
Technical Report on the Definition of Green
Hydrogen
Grant agreement no.: 633107
Deliverable No. D2.4
Technical Report on the Definition of Green Hydrogen
Status:
draft
Dissemination level:
PU - Pu li
Last update:
23 July 2015

Technical Report o the Defi itio of Gree Hydrogen
2
Authors:
J. Castro (TÜV SÜD Industrie Service GmbH)
D. Fraile (HINICIO)
F. Barth (HINICIO)
M. Altmann (Ludwig-Bölkow-Systemtechnik GmbH)
W. Weindorf (Ludwig-Bölkow-Systemtechnik GmbH)
Date: 23 July 2015

Technical Report o the Defi itio of Gree Hydrogen
3
Table of Contents 1 Introduction ....................................................................................................................... 8
2 Summary of consultation process ..................................................................................... 9
2.1 Step 1: Definition and selection of criteria for preparing green hydrogen definition
options ....................................................................................................................... 10
2.1.1 Outcome of the on-line survey with Affiliated Partners ................................... 11
2.1.2 Key outcomes of the Affiliated Partners workshop (23 April 2015) .................. 12
2.1.3 Key outcomes of the second Affiliated Partners workshop (7 July 2015) ......... 12
3 P oposed Dual Pu pose GoO fo P e iu H d oge .................................................. 14
4 Defi itio of g ee h d oge ....................................................................................... 17
4.1 Hydrogen from renewable sources ........................................................................... 17
4.2 CertifHy definition of green hydrogen – first proposal ............................................. 19
5 Gua a tee of O igi GoO o ept fo g ee h d oge ............................................. 22
5.1 First section of a GoO (data on origin) ...................................................................... 23
5.2 Second section of a GoO ............................................................................................ 23
6 Limitations of the first proposed definition and proposed options for addressing these
limitations ............................................................................................................. 24
6.1 Limitations ................................................................................................................. 24
6.1.1 Overall emissions ............................................................................................... 24
6.1.2 Exclusion of certain renewable feedstock pathways ......................................... 26
6.1.3 Variable GHG content of renewable hydrogen ................................................. 26
6.1.4 A se e of ea s fo keepi g t a k of the esidual i ............................... 27
6.2 Proposed approaches for addressing some or all of the above limitations .............. 27
6.2.1 Option 1: Transparency on overall GHG emissions of production facility ........ 28
6.2.2 Option 2: Offsetting of above-benchmark emissions ........................................ 29
6.2.3 Coverage of GoO to all hydrogen production .................................................... 36
6.3 Comparative analysis of the GoO options ................................................................. 36
7 Stakeholder consultation on the most suitable GoO scheme ......................................... 38
7.1 Defi itio of g ee h d oge ................................................................................. 38
7.2 Options to address the limitations of the definition ................................................. 39
7.3 Inclusion of by-product hydrogen ............................................................................. 39

Technical Report o the Defi itio of Gree Hydrogen
4
7.4 Inclusion of transport into GoO ................................................................................. 40
Annex A. GHG calculation for By-product hydrogen ............................................................... 41
A.1 Hydrogen from chloralkali electrolysis ...................................................................... 42
A.2 Hydrogen from steam cracking of naphtha ............................................................... 42
Technical Report o the Defi itio of Gree Hydrogen
5
List of Figures
Figure 1. Consultation process to agree on the definition of green hydrogen and prepare
the basis for a suited GoO Scheme ....................................................................... 10
Figure 2. Five selected pathways including supercritical water gasification ....................... 18
Figure 3. Diagram definition 1 .............................................................................................. 19
Figure 4. GHG emissions of hydrogen production on an LCA basis ..................................... 20
Figure 5. GHG emissions of hydrogen production on an LCA basis ..................................... 24
Figure 6. GHG emissions diagram ......................................................................................... 26
Figure 7. Offsetting approach ............................................................................................... 30
Technical Report o the Defi itio of Gree Hydrogen
6
List of Tables
Table 1. Overview of Regulatory, market and economic drivers for green hydrogen in a
CO2 policy driven scenario .................................................................................... 15
Table 2. GoO Concept .......................................................................................................... 22
Table 3. H2 GHG emission for a facility based on electrolysis ............................................. 25
Table 4. H2 GHG emission for a facility based on SMR onsite ............................................. 26
Table 5. GoO Concept-Option 1 .......................................................................................... 29
Table 6. Offsetting approach (application) ......................................................................... 30
Table 7. GoO Concept option 2 ........................................................................................... 35
Table 8. Criteria and evaluation of options to address the residual mix problematic ....... 36
Table 9. Electricity consumption for the production of hydrogen from chloralkali
electrolysis ............................................................................................................ 42
Table 10. Yield and product composition of a typical steam cracking plant ........................ 43
Table 11. Input and output data for hydrogen production via steam cracking of naphtha
applying energy allocation .................................................................................... 43
Technical Report o the Defi itio of Gree Hydrogen
7
Abbreviations
H Enthalpy of Reaction
AP Affiliated Partner (to the CertifHy project)
CCS Carbon Capture and Storage
ETS Emissions Trading Scheme
FQD Fuel Quality Directive
GHG Greenhouse Gas
GoO Guaranty of Origin
I/O Input / Output
IPCC Intergovernmental Panel on Climate Change
LCA Life Cycle Analysis
LHV Lower Heating Value
RED Renewable Energy Directive
RES Renewable Energy Sources
SMR Steam Methane Reforming

Technical Report o the Defi itio of Gree Hydrogen
8
1 Introduction
The European project CertifHy develops the first EU-wide framework for the generation of
Guarantees of Origin (GoO) for green hydrogen. The objectives of this ambitious initiative
are to develop a widely accepted definition of green hydrogen, to design a robust GoO
scheme for green hydrogen and to propose a roadmap to implement the initiative across
the EU.
A key point in the project is the definition of green hydrogen. In order to have a
comprehensive definition, the consortium starts with the identification and characterisation
of the possible ways of production, distribution and supply of hydrogen, followed by an
extended life-cycle analysis (LCA), which has been used as basis for the development of
options to define green hydrogen. The definition described in this report has been
developed taking into account the results of a survey amongst the Affiliated Partners of the
project and a series of workshops.
As the design of a GoO scheme is directly dependent on the definition of green hydrogen,
this definition has been developed together with a basic concept of a GoO which will be
further detailed within the CertifHy project.
At the section 7 of this report, a number of still-opened questions are addressed, for
hi h e ould appre iate the readers feed a k.

Technical Report o the Defi itio of Gree Hydrogen
9
2 Summary of consultation process
The consultation process on the definition of green hydrogen started along with the kick-off
of the project, in December 2014, and is expected to last until summer 2015.
The consultation process has been divided into the following steps:
1. Step 1: Definition and selection of criteria for preparing green hydrogen definition
options
a. This step has been done by the consortium, based on input from an online
survey with the participation of Affiliated Partners;
b. The main concepts and conclusions from the survey have been presented at a
technical workshop with Affiliated Partners;
c. Key inputs in this process were obtained from the Public Launch event where
most structural questions related to the GoO were analysed, having
significant impact on the way the definition of green hydrogen and the
development of a GoO scheme.
2. Step 2: Formulation of a comprehensive document (this document), including the
concept and structure of the future GoO, along with a definition for green hydrogen
fully compatible with the proposed GoO.
3. Step 3: Consultation on the most suitable GoO options, along with the definition of
green hydrogen (with this document as a basis)
a. This has been done in an interactive process with Affiliated Partners, where
the results were discussed at a technical workshop on July 8th.
4. Step 4: The selected proposal will be presented to the wide community, seeking for
further input and final endorsement.
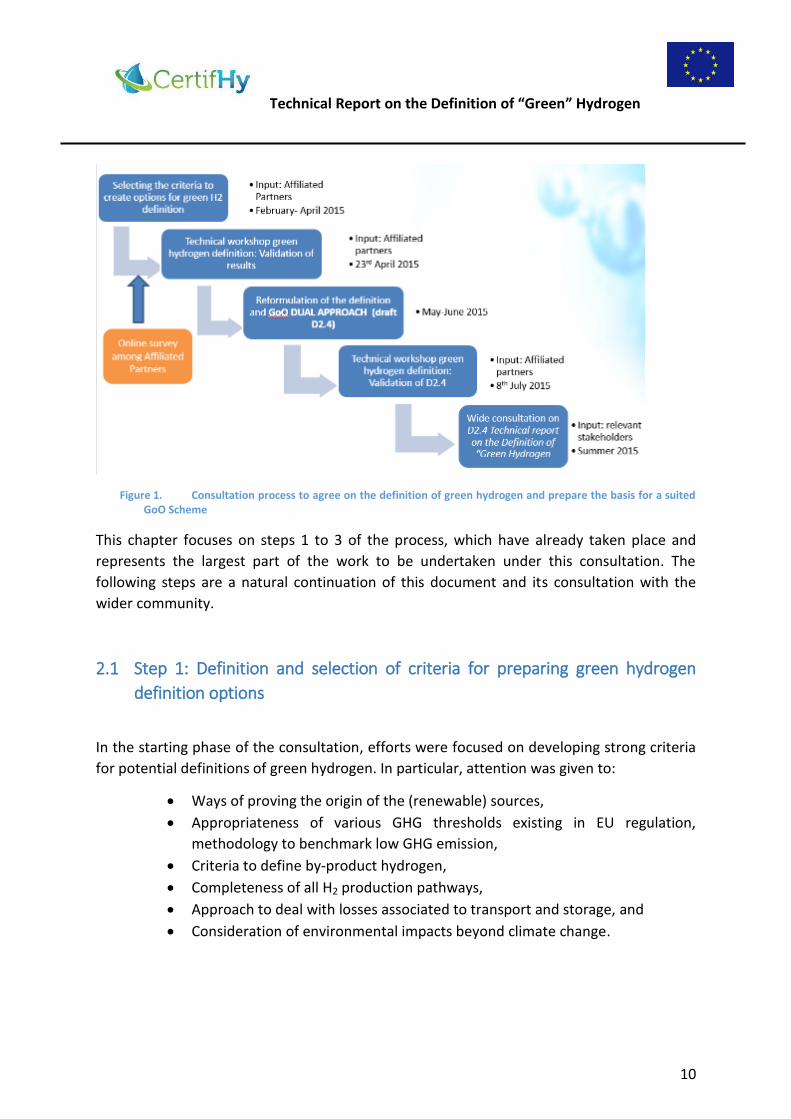
The steps are presented in Figure 1.
Technical Report o the Defi itio of Gree Hydrogen
10
Figure 1. Consultation process to agree on the definition of green hydrogen and prepare the basis for a suited
GoO Scheme
This chapter focuses on steps 1 to 3 of the process, which have already taken place and
represents the largest part of the work to be undertaken under this consultation. The
following steps are a natural continuation of this document and its consultation with the
wider community.
2.1 Step 1: Definition and selection of criteria for preparing green hydrogen
definition options
In the starting phase of the consultation, efforts were focused on developing strong criteria
for potential definitions of green hydrogen. In particular, attention was given to:
Ways of proving the origin of the (renewable) sources,
Appropriateness of various GHG thresholds existing in EU regulation,
methodology to benchmark low GHG emission,
Criteria to define by-product hydrogen,
Completeness of all H2 production pathways,
Approach to deal with losses associated to transport and storage, and
Consideration of environmental impacts beyond climate change.
Technical Report o the Defi itio of Gree Hydrogen
11
As a result of this work, the project looked into the two main approaches for defining green
H2, renewable origin and GHG emissions based. On that basis, Affiliated Partners were
consulted through an online survey.
2.1.1 Outcome of the on-line survey with Affiliated Partners
The survey was structure around two main approaches for defining green hydrogen. For
each approach, a set of questions on the criteria were put forward.
The first approach was based on share of renewable energy and sustainability of
feedstock. In this case the use of renewable energy and/or renewable feedstock is a
condition for producing green hydrogen, and the amount of green hydrogen produced can
be determined by the share of renewable energy and/or renewable feedstock in the total
used or by a threshold.
Main conclusions:
• Share based approach: green H2 needs to be proportional to RES input (avoid all-or-
nothing thresholds). A 65% RES share in the energy used should lead to a 65 green
hydrogen share out of all hydrogen produced.
• Attention should be paid to the emissions associated to the non-renewable part of
the input (no agreement on how- application of penalties/bonuses)
• All energy sources (from the non-RES input) to be eligible.
• By-product: Case by case analysis necessary.
The second approach was based on greenhouse gas (GHG) emissions. In this approach the
GHG emissions of hydrogen production including all upstream process steps are calculated
in a Life Cycle Analysis (LCA). Hydrogen produced will be considered green if the associated
GHG emissions are lower than a certain pre-defined threshold.
Main conclusions:
• Share based approach: green H2 needs to be proportional to low-GHG input (avoid
all-or-nothing thresholds)
• GoOs for electricity and gas as a way to identify low-GHG input (preferred option)
• The reference value for GHG emissions should be those associated to SMR of natural
gas in centralized plants
• Consistency with RED/FQD methodology (however a specific emission saving %
ould ’t e ag eed • By-product: substitution and the energy allocation methods the preferred ones.

Technical Report o the Defi itio of Gree Hydrogen
12
2.1.2 Key outcomes of the Affiliated Partners workshop (23 April 2015)
During the workshop the results of the survey were presented and it came clear that:
Affiliated Partners would like the GoO to cover both renewables-based hydrogen
and hydrogen with low GHG emissions.
Green hydrogen should refer to hydrogen from renewable energy sources.
The value of defining low-carbon hydrogen was not so evident. The GoO should
provide information on the GHG emissions of the hydrogen produced. The market
ould the de ide ho lo the GHG e issio s should e and set a price to it.
In any case, the GoO should be as factual and transparent as possible.
So more fundamental questions regarding the renewable H2 approach where left
unanswered:
Should the GHG emissions intensity associated to renewable H2 be 0?
Should a process be eligible for producing renewable H2 even if its overall emissions
are greater than that of the reference process?
Should the share of renewable H2 produced be in line with the contribution of the
process to the reduction of GHG emissions compared to the conventional process?
2.1.3 Key outcomes of the second Affiliated Partners workshop (7 July 2015)
The following is a summary of the discussions and decisions made at the workshop:
There was a general agreement with the proposal that green hydrogen should refer
to renewables-based hydrogen. Some Affiliated Partners expected however an
additional definition for low-carbon hydrogen to be included.
The sha e of h d oge f o e e a le sou es i total h d oge p odu tio is equal to the share of renewable energy in total energy consumption. In processes
requiring several energy inputs, renewable energy will need to be part of at least one
of the main energy inputs (in this case, main energy input refers to an energy source
that represents at least [x%] of the overall process demand). There was not
agreement on the level of the threshold.
One definition proposed states that Green hydrogen should be hydrogen from
renewable energy source and with a GHG footprint below a certain threshold. Two
saving thresholds were discussed: -50% or -70% of the reference process (SMR of
natural gas). No agreement was found on the level and whether the threshold
should evolve over time (similarly to the RED approach for biofuels).

Technical Report o the Defi itio of Gree Hydrogen
13
A second definition, leading to green hydrogen with zero GHG emissions was
presented and discussed. Under such approach, the emissions would be offset by
reducing the active share of green hydrogen. The total energy used for producing all
hydrogen in the facility during one year would need to emit fewer emissions than
the reference process. No agreement could be found whether this definition or the
previously presented definition should be supported.
For by-product hydrogen, it was agreed that energy allocation was the most suitable
allocation method.
Technical Report o the Defi itio of Gree Hydrogen
14
3 Proposed Dual Purpose GoO for Premium Hydrogen
The CertifHy Consortium has de eloped a a ket outlook fo p e iu h d oge .1,2 It
concludes that if Europe is to continue its ambition policies on climate change, energy
security and competitiveness of its industry, hydrogen will play a significant role in the
decarbonisation of the transport sector, and to a lesser extent, it will contribute to reduce
emissions on the energy-intensive industry. Under a policy driven scenario, about 17% of all
hydrogen could be originated from renewable and/or low-carbon sources by 2030,
representing a market of about 1.7 million tons of p e iu hydrogen per year.
P e iu h d oge will be required to comply with different regulations and policies. In
some cases, proving the (renewable) origin of the energy to produce hydrogen will be
requested (e.g. Renewable Energy Directive). In some other cases, a proof of reduced
emissions would be sufficient (e.g. Fuel Quality Directive, Emissions Trading Scheme). In
those cases where regulation is not the main driver, the market and final customer will
decide whether hydrogen should be low carbon, or specifically from renewable energy
sources (e.g. food processing industries due to sustainability/green labels, corporate social
responsibility, fuel cell vehicles users).
In any of the cases, The CertifHy project recommends that the GoO for hydrogen should
address the market and regulatory needs of different hydrogen users. Therefore, the GoO
should be designed in such a way that information about its (renewable) origin and its
associated GHG emissions are provided to the final customer.
The following table present an overview of EU regulation and market drivers that could have
an impact on demand for hydrogen. Depending on the scope of the driver, hydrogen may
need to be produced from a low-GHG source (indicated in blue), from renewable energy
sources (indicated in green), or none of them (indicated in grey).
1 Premium hydrogen refers to renewables-base and/or low- a o h d oge . The o ept g ee h d oge is
not yet used as its definition has not yet been fully elaborated. 2 Deli e a le . . Ge e i esti atio s e a ios of a ket pe et atio a d de a d fo e ast fo p e iu
g ee h d oge i sho t, id a d lo g te , CertifHy WP1, June 2015

Technical Report o the Defi itio of Gree Hydrogen
15
Table 1. Overview of Regulatory, market and economic drivers for green hydrogen in a CO2 policy driven
scenario3
Legend:
3 Deli e a le . . Ge e i esti atio s e a ios of a ket pe et atio a d de a d fo e ast fo p e iu
g ee h d oge i sho t, id a d lo g te , CertifHy WP1, June 2015
Mobility and
transport
Power to gas
(injection into the
natural gas grid)
Driver scope Refineries
Amonia
(other
chemicals)
metal
processing
Food, Glass
production,
Semiconducto
rs, Aerospace,
etc.
H2 use
inFCVs
Energy storage
and system
transformation
CSR- Green marketing/
Company image
cost competitive vs.
SMR of natural gas
(reference technology)
Drivers for hydrogen/green
hydrogen in the main 3 markets
analysed (policy driven scenario)
Consumers choice-
clean transportation
Oversupply of variable
renewable energy/
Energy storage market
Regulatory
drivers
Mix driver-
regulation
through
Market &
Economic
drivers
Alternative fuel
infrastructure directive
ETS (Cap, exemptions,
CO2 price)
Industry
Fuel quality directive
RED (including.
Renewables Transport
target)
Emissions Performance
standards for
passenger cars
Air quality (Low
Emissions Zones)
Short term: 2015
Medium Term: 2020-2025
Long term: >2030
No impact
Low/limited demand potential
high demand potential
for RES based hydrogen
for low-carbon hydrogen
for hydrogen
Timeframe
Type of hydrogen
demand
Relevance/impact on
green H2 demand
Technical Report o the Defi itio of Gree Hydrogen
16
The potential benefits of a dual purpose GoO are the following:
Allows the development of a fully operational and ready-for-use GoO system
attending two well identified needs - rather than only one - with regards to the
supply of green hydrogen (anywhere where hydrogen can be delivered, thanks to
tradability of the GoO), hence increasing total market value and resilience to
evolving demand and availability of hydrogen.
Allows developing a (comprehensive) regulation-ready GoO scheme, satisfying the
requirements from different existing EU legislation, including those that aim to
reduce the carbon footprint of fuels (FQD, ETS) and increase the share of renewables
in the energy system (RED).
Allows to fully exploiting the environmental performance of a given process by
taking advantage of both the renewable and low GHG hydrogen produced (example:
electrolyser running with a combination of renewable electricity and electricity from
a low-carbon mix).
Provides a mechanism supporting both the development of renewable and low
carbon hydrogen production pathways.

Technical Report o the Defi itio of Gree Hydrogen
17
4 Definition of green hydrogen
As explained in section 3, given the identified need to cover different policy and market
needs, an inclusive GoO scheme that addresses both the use of renewable sources and use
of low-GHG processes is proposed.
As far as of low-GHG h d oge is o e ed, p o idi g a defi itio of lo -GHG is ot necessarily required. Indeed, policy instruments and regulation that incentivize the use of
low-GHG processes aim to reduce GHG emissions; hence information on the GHG footprint
could be sufficient to fulfil this objective. For instance, the Fuel Quality Directive and the
Emission Trading Scheme do not use specific thresholds for the selection of eligible
processes/technologies; all processes are valid as long as they help achieving the emission
savings reduction objectives.
4.1 Hydrogen from renewable sources
According to the Renewable Energy Directive, e ergy fro re ewa le sour es ea s energy from renewable non-fossil sources, namely wind, solar, aerothermal, geothermal,
hydrothermal and ocean energy, hydropower, biomass, landfill gas, sewage treatment plant
gas and biogases.
As shown in the figure below, various hydrogen production pathways from renewable
feedstock also involve the use of additional energy.

Technical Report o the Defi itio of Gree Hydrogen
18
Figure 2. Five selected pathways including supercritical water gasification
Appl i g the defi itio of e e g f o e e a le sou es to hydrogen, the share of
hydrogen from renewable sources in total hydrogen production can be defined as the
share of renewable energy consumption in total energy consumption in the hydrogen
production process.
Note: Energy consumption in the steps upstream of production (such as the energy
consumption to grow crop used as feedstock) is therefore not included.
With this app oa h, h d oge f o e e a le sou es a e p odu ed from an energy
and/or feedstock mix where only one form of energy or feedstock is renewable.
Taking as hypothetical basis that hydrogen is produced by Plasma gasification of a mixture
of industrial and municipal waste containing 30% biomass, with 80% of the electricity used
being renewable, and with the assumption that electricity represents 35% of total energetic
input, the renewable H2 can be calculated as follows:
The industrial waste input represents 65% of total energy input with 30% renewable
biomass content, electricity represents 35% of total energy input with 80% of electricity
being renewable. The share of renewable energy in total energy input is 65% x 30% + 35% x
80% = 47.5%
As a result, 47.5% of hydrogen production is renewable.
0.00
0.50
1.00
1.50
2.00
2.50
3.00
100% renewable 100% corn Waste wood Supercritical water gasification 100% nuclear electr.
Electrolysis SMR Gasification Plasma gasification*
En
erg
y r
eq
uir
em
en
t su
pp
ly a
nd
use
(M
J/M
J H2)
Renewable
Nuclear
Fossil
* waste ,
50% biomass
LBST
, 2
2 J
un
e 2
01
5

Technical Report o the Defi itio of Gree Hydrogen
19
If the waste does not have any renewable content (0% biomass), the share of hydrogen
from renewable sources then is 65% x 0% + 35% x 80% = 28%
The p oposed defi itio of g ee h d oge is based on the above definition of h d oge f o e e a le sou es .
4.2 CertifHy definition of green hydrogen – first proposal
A first proposal for defining green hydrogen taking into account the policy framework and
customer expectations is the following:
Green hydrogen is hydrogen from renewable sources (see chapter 4.1) with an associated
GHG emissions intensity (based on an LCA approach) below a specified threshold. Any
biomass used shall comply with the sustainability requirements according to the
Renewable Energy Directive.
Figure 3. Diagram definition 1
In other words: The percentage of green hydrogen of a production is equivalent to the
percentage of renewable sources (energy including ancillary energy requirement and
feedstocks) used for the production. This hydrogen percentage will be considered green if
the related GHG emissions (based on an LCA approach) are below a certain threshold.
(See Question 5 in chapter 7).
Share of renewable energy input
A share of the hydrogen generated by a process using a combination of different forms of
energy input will be renewable, if renewable sources are used for at least one of the energy
forms. In order to avoid any market disturbance, energy inputs should be required to
exceed a minimum share of total energy input in order to allow green hydrogen to be
Technical Report o the Defi itio of Gree Hydrogen
20
produced. This will prevent processes that use renewable energy only in energy input which
is not substantial (below a threshold) to be able to produce green hydrogen.
(See Question 1 and Question 2 in chapter 7).
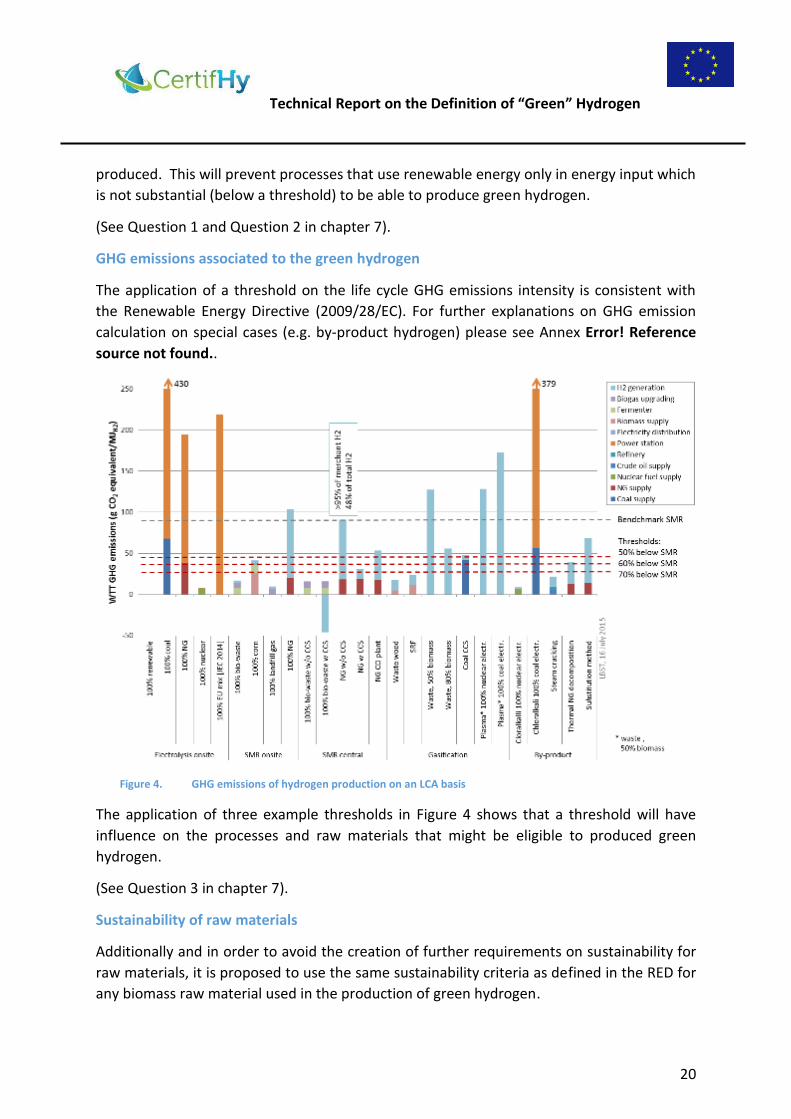
GHG emissions associated to the green hydrogen
The application of a threshold on the life cycle GHG emissions intensity is consistent with
the Renewable Energy Directive (2009/28/EC). For further explanations on GHG emission
calculation on special cases (e.g. by-product hydrogen) please see Annex Error! Reference
source not found..
Figure 4. GHG emissions of hydrogen production on an LCA basis
The application of three example thresholds in Figure 4 shows that a threshold will have
influence on the processes and raw materials that might be eligible to produced green
hydrogen.
(See Question 3 in chapter 7).
Sustainability of raw materials
Additionally and in order to avoid the creation of further requirements on sustainability for
raw materials, it is proposed to use the same sustainability criteria as defined in the RED for
any biomass raw material used in the production of green hydrogen.
Technical Report o the Defi itio of Gree Hydrogen
21
Furthermore, under this definition, a materiality threshold of 5% in relation to the total
energy sources is proposed. This materiality threshold means that up to 5% of the input
energy can be conservatively estimated without the need of exact measurements. This is
applied in order to reduce the efforts of measuring minor energy consumptions (e.g.
ancillary systems such as pu ps, e tilatio , et … . This does not imply that 5% of the
energy will not be accounted for.
In cases where hydrogen is a by-product the above definition can be applied keeping in
mind that sustainability of raw materials other than biomass is not covered by this
definition.
(See Question 6 and Question 7 in chapter 7).
Technical Report o the Defi itio of Gree Hydrogen
22
5 Guarantee of Origin GoO concept for green hydrogen
A robust Guarantee of Origin System requires clear and factual information to be provided
to final customers in order to increase users trust and transparency on the system. In order
to achieve this goal a concept for a GoO is proposed. This approach will be adapted and
further elaborated within the course of the CertifHy project.
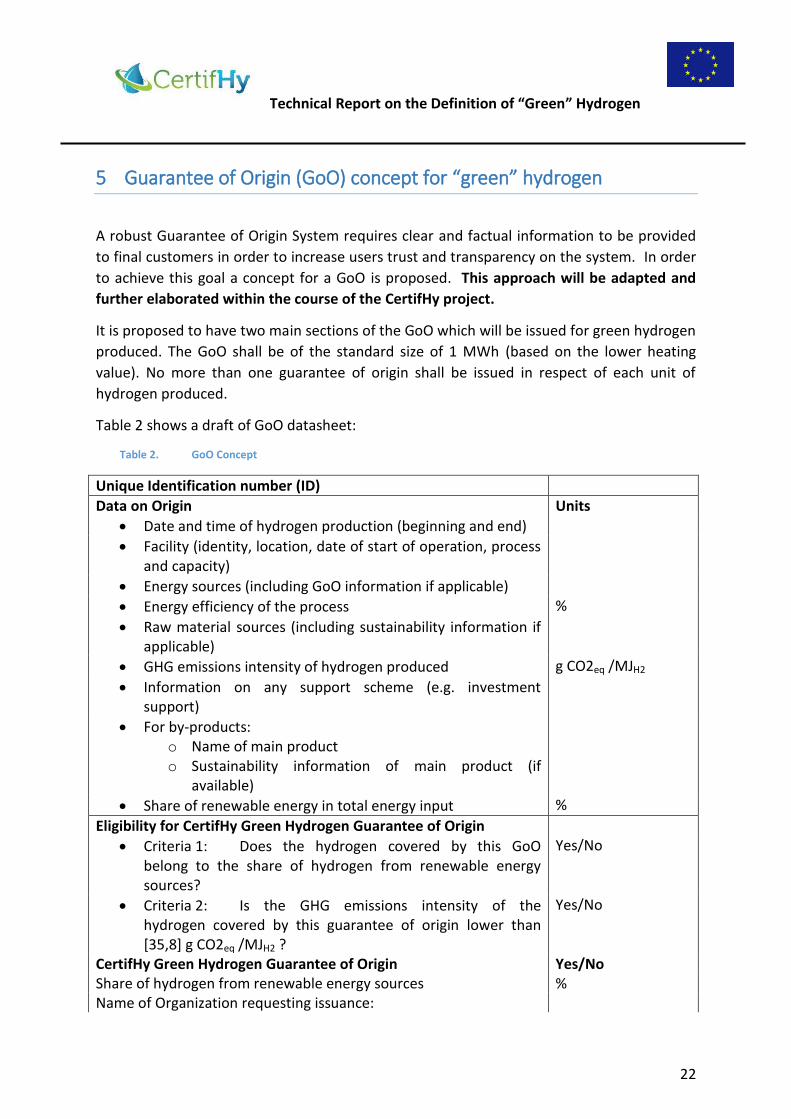
It is proposed to have two main sections of the GoO which will be issued for green hydrogen
produced. The GoO shall be of the standard size of 1 MWh (based on the lower heating
value). No more than one guarantee of origin shall be issued in respect of each unit of
hydrogen produced.
Table 2 shows a draft of GoO datasheet:
Table 2. GoO Concept
Unique Identification number (ID)
Data on Origin Units
Date and time of hydrogen production (beginning and end)
Facility (identity, location, date of start of operation, process
and capacity)
Energy sources (including GoO information if applicable)
Energy efficiency of the process %
Raw material sources (including sustainability information if
applicable)
GHG emissions intensity of hydrogen produced g CO2eq /MJH2
Information on any support scheme (e.g. investment
support)
For by-products:
o Name of main product
o Sustainability information of main product (if
available)
Share of renewable energy in total energy input %
Eligibility for CertifHy Green Hydrogen Guarantee of Origin
Criteria 1: Does the hydrogen covered by this GoO
belong to the share of hydrogen from renewable energy
sources?
Yes/No
Criteria 2: Is the GHG emissions intensity of the
hydrogen covered by this guarantee of origin lower than
[35,8] g CO2eq /MJH2 ?
Yes/No
CertifHy Green Hydrogen Guarantee of Origin Yes/No
Share of hydrogen from renewable energy sources %
Name of Organization requesting issuance:
Technical Report o the Defi itio of Gree Hydrogen
23
Validity / expiration date x years /
dd.mm.yyyy
The information presented in the GoO shall be confirmed by an accredited independent
third party.
5.1 First section of a GoO (data on origin)
The first section of the GoO shall contain general information (fact sheet) of the produced
unit. Using as reference the requirements of RED Article 15 §6, the following requirements
are proposed to be included to a GoO scheme.
A guarantee of origin shall specify at least:
The energy source / sources including any electricity GoO if applicable;
The raw material sources including any sustainability information;
Start and end dates of production;
The identity, location, process and capacity of the installation where the green
hydrogen was produced;
The energy efficiency of the process
In case that hydrogen is a by-product, the name of the main product and
sustainability information of the main product
The GHG emissions for the green hydrogen produced;
Any information related to investment supports or any other type of support
scheme;
The date on which the installation became operational.
5.2 Second section of a GoO
A second section will include the definition of green hydrogen and might be used for further
labels to comply with market demands.
This section will provide the information needed to confirm the compliance with the
definition of green hydrogen, as established by the CertifHy project (see chapter 4.2):
The sources are renewable according to RED;
The GHG emissions are lower than the threshold (see chapter 7.1);
The raw materials comply with sustainability requirements (if applicable) (see
chapter 7.3).

Technical Report o the Defi itio of Gree Hydrogen
24
Technical Report o the Defi itio of Gree Hydrogen
25
6 Limitations of the first proposed definition and proposed options
for addressing these limitations
6.1 Limitations
The approach for defining the amount of green hydrogen produced by a given facility, as
presented in chapter 4.2, presents a number of limitations, reviewed hereafter.
6.1.1 Overall emissions
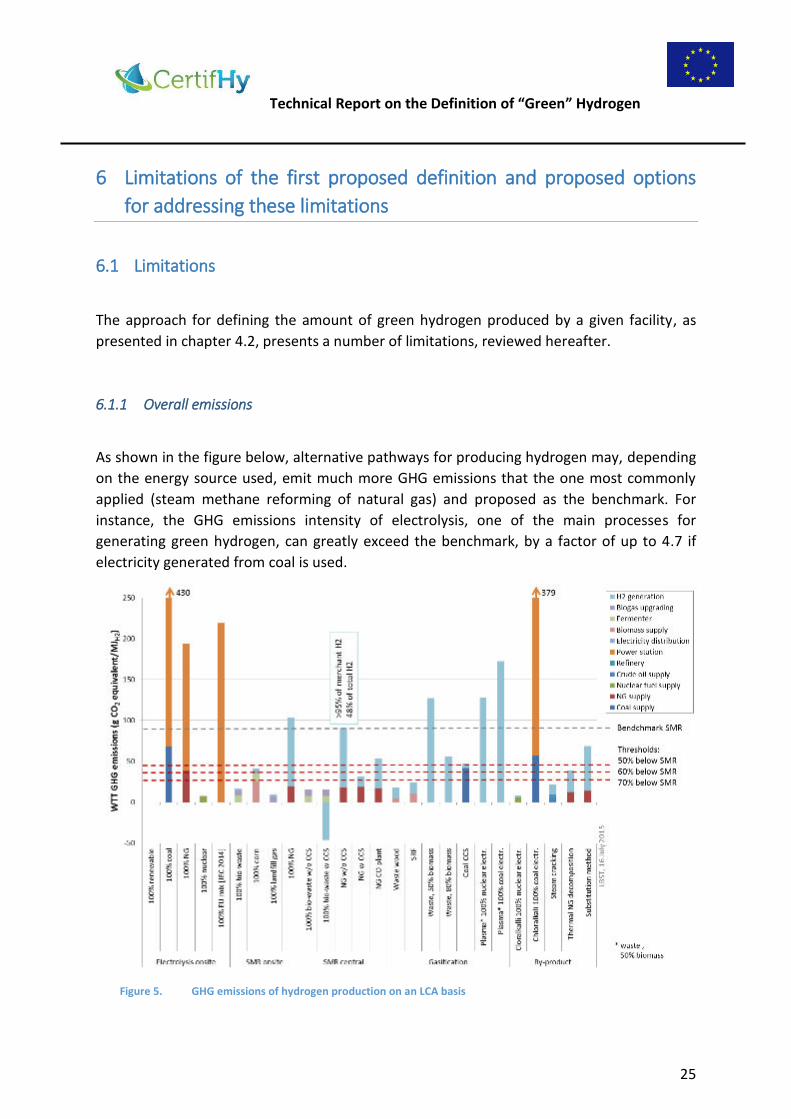
As shown in the figure below, alternative pathways for producing hydrogen may, depending
on the energy source used, emit much more GHG emissions that the one most commonly
applied (steam methane reforming of natural gas) and proposed as the benchmark. For
instance, the GHG emissions intensity of electrolysis, one of the main processes for
generating green hydrogen, can greatly exceed the benchmark, by a factor of up to 4.7 if
electricity generated from coal is used.
Figure 5. GHG emissions of hydrogen production on an LCA basis

Technical Report o the Defi itio of Gree Hydrogen
26
As a result, the average GHG emissions intensity of hydrogen produced by electrolysis with a
50% share of renewable electricity is greater than that of the benchmark process-up to 2.3
times- for all residual mixes studied except 100% nuclear.
Table 3. H2 GHG emission for a facility based on electrolysis
Considering only the emissions of the share of renewable energy used, may in practice
encourage the deployment of processes with increased GHG emissions compared to
benchmark despite using a high share (e.g. 50%) of renewable electricity.
As experienced with the co-firing of biomass for the production of renewable electricity, this
situation may result in a strong lack of acceptance.
Electrolyser onsite
Zero GHG GHG emiss. H2
renewable Residual of H2 from GHG emiss.
electricity* mix res mix average
share gCO2eq/MJ gCO2eq/MJ
90% 42,4
80% 84,7
70% 127,1
60% 169,5
50% 211,9
90% 19,2
80% 38,3
70% 57,5
60% 76,6
50% 95,8
90% 0,8
80% 1,5
70% 2,3
60% 3,0
50% 3,8
90% 21,7
80% 43,4
70% 65,1
60% 86,8
50% 108,6
* on-site or GoO red: > 89,6
SMR Ref
Energy mix
EU mix 217,1
100% NG 191,5
100% nucl. 7,5
100% coal 423,7
Technical Report o the Defi itio of Gree Hydrogen
27
6.1.2 Exclusion of certain renewable feedstock pathways
Application of a GHG emissions threshold for determining which processes may generate
green hydrogen results in the exclusion of pathways that would nonetheless have a
beneficial impact in terms of production of energy from renewable sources (e.g.
geothermal).
Furthermore, the number of eligible green hydrogen pathways is sensitive to the threshold
value applied, which is a political decision. Therefore, achieving consensus on the threshold
value to be applied may be difficult.
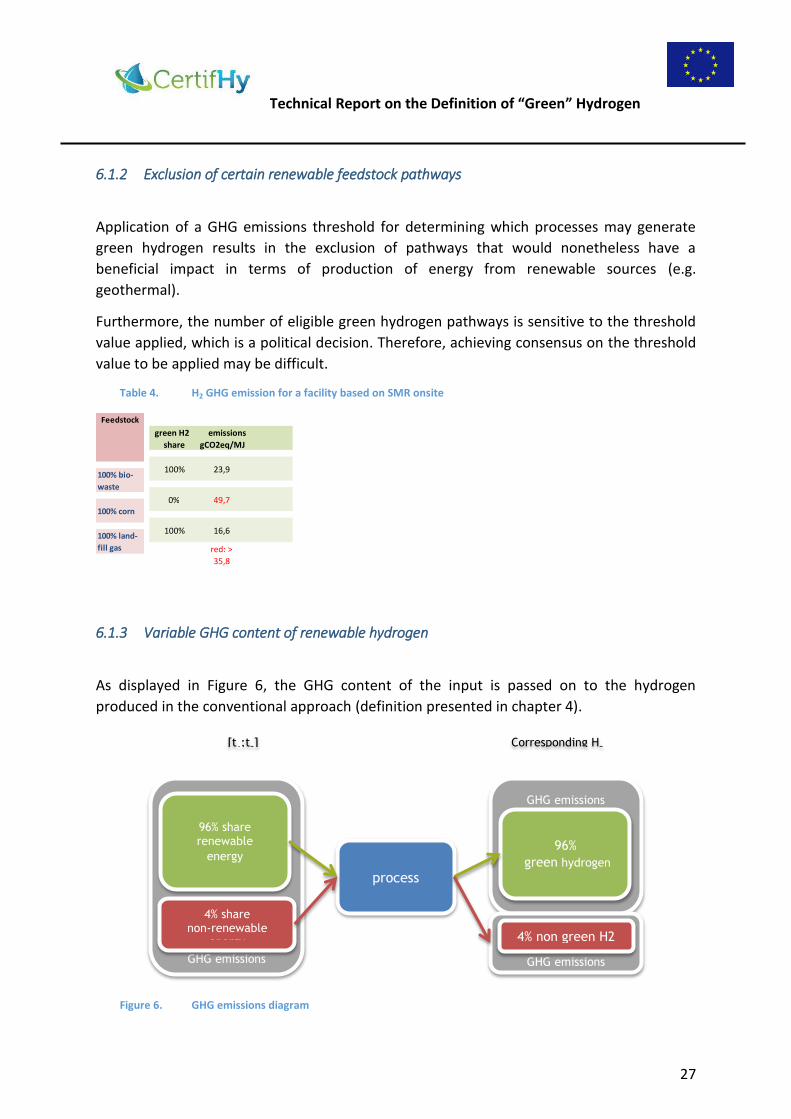
Table 4. H2 GHG emission for a facility based on SMR onsite
6.1.3 Variable GHG content of renewable hydrogen
As displayed in Figure 6, the GHG content of the input is passed on to the hydrogen
produced in the conventional approach (definition presented in chapter 4).
Figure 6. GHG emissions diagram
100% bio-
waste
100% corn
100% land-
fill gas
Feedstock
green H2 emissions share gCO2eq/MJ
100% 23,9
0% 49,7
100% 16,6 red: > 35,8
GHG emissions
GHG emissions GHG emissions
process
96% share renewable
energy
4% share non-renewable
energy
96%
green hydrogen
4% non green H2
[t1;t
2] Corresponding H
2

Technical Report o the Defi itio of Gree Hydrogen
28
Consequently, the GHG content of green hydrogen depends on the process and feedstock.
As experienced with electricity, this introduces a quality parameter that the customer will
tend to consider, increasing complexity, and potentially impacting market acceptance of
those quantities of green hydrogen that have the highest emissions intensity. This may have
a negative impact on market liquidity, market value, and market uptake.
6.1.4 A se e of ea s for keepi g tra k of the residual ix
A guarantee of origin scheme normally requires keeping track of the GHG emissions of the
production not covered by the GoO for being able to keep track of and inform the users on
these as well. Indeed, hydrogen provided to a buyer who does not buy the associated GoO is
h d oge f o the esidual i ithout GoO , hi h is not characterized.
The proposed definition allows green hydrogen generation from facilities having in average
higher GHG emissions than the benchmark, while providing no means for identifying and
keeping track of the impact of these higher emissions on the residual mix.
This may result in the GoO scheme not being accepted.
6.2 Proposed approaches for addressing some or all of the above limitations
Potential solutions were reviewed for addressing the above limitations taking into
consideration the following criteria:
Transparency: information is easy to be found and understood in GoG
Simplicity for the customer
Simplicity for the producer ; simplicity for the traders
Customer trust
Market potential (including market value)
Support to hydrogen production from renewable and low carbon sources
Adaptable to evolving regulatory measures
Consistency with RED, FQD, etc.
Consistency with other GoO certificates
Technology neutral and robust
Effective contribution to fulfilment of environmental goals
Technical Report o the Defi itio of Gree Hydrogen
29
As a result, two alternatives amending the first approach defined in chapter 4.2 – referred
to as Option 1 and Option 2 – are proposed for addressing, at least to some extent, the
limitations above. These options are presented hereafter.
6.2.1 Option 1: Transparency on overall GHG emissions of production facility
In order to provide transparency on the overall emissions of the production facility, option 1
consists on providing - in the first part of the GoO - the average GHG emissions intensity of
all the hydrogen produced in the whole 12 months preceding the end of the time interval
during which the hydrogen covered by the GoO was produced.
In this way any end user will be able to assess not only the characteristics of the hydrogen
labelled but also the characteristics of all the hydrogen produced over a one year period.
This approach will reduce the willingness to implement processes and use feedstock or
energy sources with high GHG emissions within the installations that expect to have part of
their production labelled as green hydrogen. It is important to mention that this approach
might cause some confusion on the consumer side as green hydrogen might be created in
facilities with high emissions, case in which the GoO will carry contradictory information
with regards to environmental impact.
The implementation of this option does not require any change to the definition of green
hydrogen as presented in chapter 4.2.
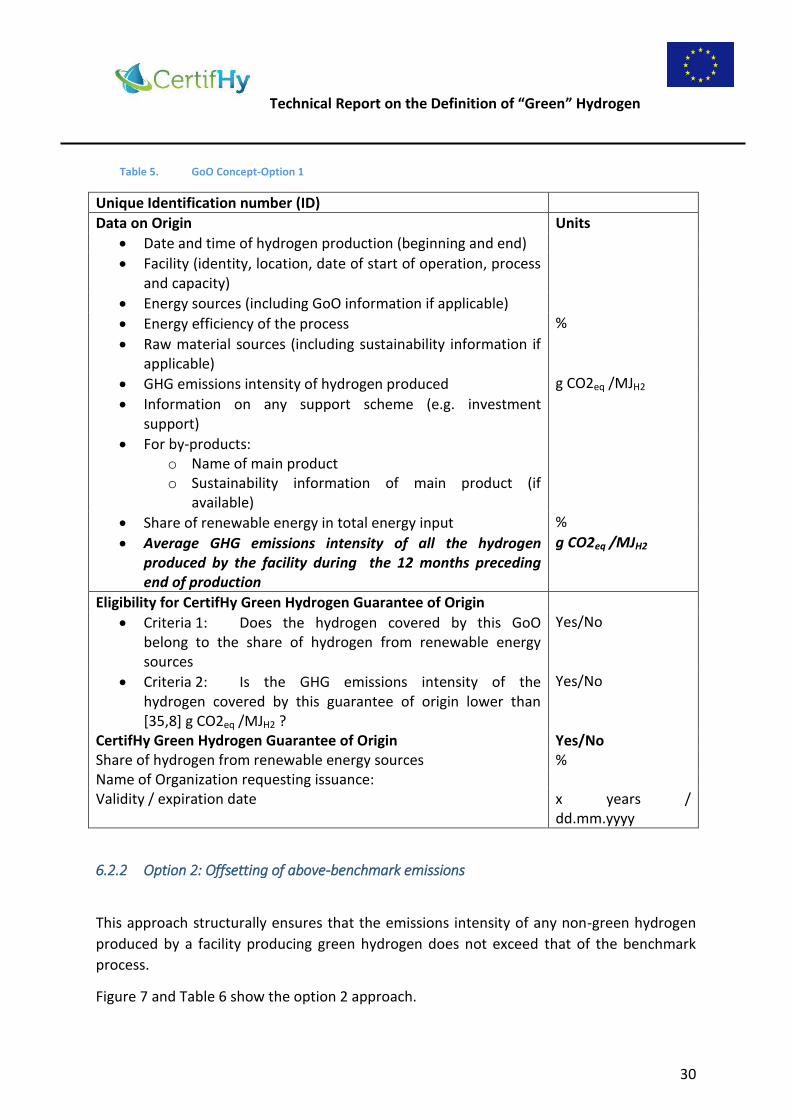
Application of option 1 simply requires amending the GoO concept (See Question 5) through
the addition highlighted in below:
Technical Report o the Defi itio of Gree Hydrogen
30
Table 5. GoO Concept-Option 1
Unique Identification number (ID)
Data on Origin Units
Date and time of hydrogen production (beginning and end)
Facility (identity, location, date of start of operation, process
and capacity)
Energy sources (including GoO information if applicable)
Energy efficiency of the process %
Raw material sources (including sustainability information if
applicable)
GHG emissions intensity of hydrogen produced g CO2eq /MJH2
Information on any support scheme (e.g. investment
support)
For by-products:
o Name of main product
o Sustainability information of main product (if
available)
Share of renewable energy in total energy input %
Average GHG emissions intensity of all the hydrogen
produced by the facility during the 12 months preceding
end of production
g CO2eq /MJH2
Eligibility for CertifHy Green Hydrogen Guarantee of Origin
Criteria 1: Does the hydrogen covered by this GoO
belong to the share of hydrogen from renewable energy
sources
Yes/No
Criteria 2: Is the GHG emissions intensity of the
hydrogen covered by this guarantee of origin lower than
[35,8] g CO2eq /MJH2 ?
Yes/No
CertifHy Green Hydrogen Guarantee of Origin Yes/No
Share of hydrogen from renewable energy sources %
Name of Organization requesting issuance:
Validity / expiration date x years /
dd.mm.yyyy
6.2.2 Option 2: Offsetting of above-benchmark emissions
This approach structurally ensures that the emissions intensity of any non-green hydrogen
produced by a facility producing green hydrogen does not exceed that of the benchmark
process.
Figure 7 and Table 6 show the option 2 approach.

Technical Report o the Defi itio of Gree Hydrogen
31
Figure 7. Offsetting approach
Table 6. Offsetting approach (application)
GHG emissionsGHG emissions
process
X%renewable
energy
(100-X)%
Non-renewable
energy
≤X%green
hydrogen
≥(100-X)%non-green
hydrogen
[t1;t2]
SMR onsite
Renewable GHG intens. H2 feedstock of other GHG emiss.
energy energy used average share gCO2eq/MJ gCO2eq/MJ
100% bio- waste 81% 123,2 23,9
100% corn 80% 243,6 49,7
100% land- fill gas 78% 74,1 16,6
Energy mix Feedstock
green H2 green non-green share gCO2eq/MJ gCO2eq/MJ
73% 0,0 89,6
45% 0,0 89,6
78% 0,0 74,1
Technical Report o the Defi itio of Gree Hydrogen
32
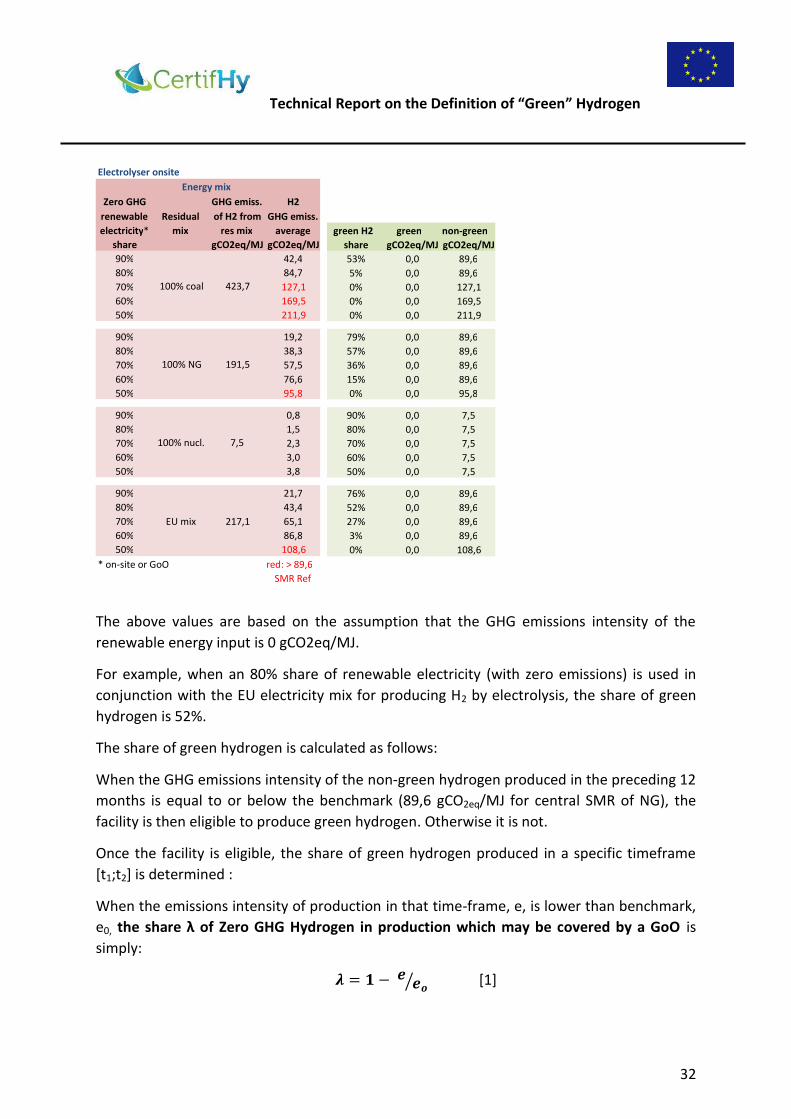
The above values are based on the assumption that the GHG emissions intensity of the
renewable energy input is 0 gCO2eq/MJ.
For example, when an 80% share of renewable electricity (with zero emissions) is used in
conjunction with the EU electricity mix for producing H2 by electrolysis, the share of green
hydrogen is 52%.
The share of green hydrogen is calculated as follows:
When the GHG emissions intensity of the non-green hydrogen produced in the preceding 12
months is equal to or below the benchmark (89,6 gCO2eq/MJ for central SMR of NG), the
facility is then eligible to produce green hydrogen. Otherwise it is not.
Once the facility is eligible, the share of green hydrogen produced in a specific timeframe
[t1;t2] is determined :
When the emissions intensity of production in that time-frame, e, is lower than benchmark,
e0, the share λ of Zero GHG Hydroge i produ tio hi h ay e o ered y a GoO is
simply: � = � − � �⁄ [1]
Electrolyser onsite
Zero GHG GHG emiss. H2 renewable Residual of H2 from GHG emiss. electricity * mix res mix average
share gCO2eq/MJ gCO2eq/MJ 90% 42,4 80% 84,7 70% 127,1 60% 169,5 50% 211,9
90% 19,2 80% 38,3 70% 57,5 60% 76,6 50% 95,8
90% 0,8 80% 1,5 70% 2,3 60% 3,0 50% 3,8
90% 21,7 80% 43,4 70% 65,1 60% 86,8 50% 108,6
* on-site or GoO red: > 89,6 SMR Ref
Energy mix
EU mix 217,1
100% NG 191,5
100% nucl. 7,5
100% coal 423,7
green H2 green non-green share gCO2eq/MJ gCO2eq/MJ 53% 0,0 89,6 5% 0,0 89,6 0% 0,0 127,1 0% 0,0 169,5 0% 0,0 211,9
79% 0,0 89,6 57% 0,0 89,6 36% 0,0 89,6 15% 0,0 89,6 0% 0,0 95,8
90% 0,0 7,5 80% 0,0 7,5 70% 0,0 7,5 60% 0,0 7,5 50% 0,0 7,5
76% 0,0 89,6 52% 0,0 89,6 27% 0,0 89,6 3% 0,0 89,6 0% 0,0 108,6

Technical Report o the Defi itio of Gree Hydrogen
33
Where:
- e is the emissions intensity of all the hydrogen produced during the considered
production time-frame [t1;t2].
- e0 is the emissions intensity of the benchmark process
Setting the share of zero-e issio s h d oge to λ p o ides that the e issio s i te sit of the non-zero-emissions hydrogen is e0.
If a share of the energy input is renewable, the share of CertifHy Green Hydrogen in
production is: � = � �; � [2]
The share of production qualifies for being labeled as CertifHy Green Hydrogen.
If the emissions intensity of production in the [t1;t2], e, is greater than or equal to the
benchmark, e0, the share of zero-GHG-hydrogen and the share of green hydrogen are both
equal to zero.
Example:
The emissions intensity of the H2 produced by the plant during the past 12 months is 80.9
gCO2eq/MJ, below the benchmark value (89.6 gCO2eq/MJ). The plant is therefore eligible for
producing green hydrogen.
Now we study the specific time-frame [t1;t2]:
If the share of renewable energy in input, , is 70%, and the total emissions of our hydrogen
produced in this period are 45 gCO2eq/MJ, we apply formulas 1 and 2:
λ= - 45/89.6 = 0.497
γ = i 7 , 9.7 = 49.7%
The share of green hydrogen becomes: = 49.7%
In summary, under Option 2:
The green hydrogen produced always has an emissions intensity of 0 gCO2eq/MJ.
Green hydrogen can only be generated if the average GHG emissions intensity of the
facility for producing the non-green hydrogen over the reference period (12 months)
is lower than that of the benchmark process (89,6 gCO2eq/MJ for central SMR of
NG).
When green hydrogen is generated, the emissions intensity of the non-renewable
hydrogen never exceeds that of the conventional process. Therefore, GoO emissions

Technical Report o the Defi itio of Gree Hydrogen
34
occur without negative impact on the residual mix, and H2 separated from its
associated GoO can conservatively be assigned the benchmark emissions.
Finally, this approach allows all processes using renewable energy with overall
emissions lower than the benchmark to produce green hydrogen. The application of
an arbitrary threshold on the level of GHG emissions is no longer needed.
The implementation of Option 2 requires the definition of Green Hydrogen to be modified
as follows:
CertifHy Green Hydrogen definition - Option 2
Green hydrogen is hydrogen from renewable sources (see chapter 4.1) with an allocated
associated GHG emissions intensity of zero (based on an LCA approach) produced in a
plant where the average emissions intensity of the non-zero-GHG hydrogen production
(based on an LCA approach) of the past 12 months does not exceed the emissions
intensity of the reference process (SMR of natural gas).
(See Question 5)
6.2.2.1 Extension of option 2 approach- zero GHG hydrogen
The approach described above can be applied for defining a share of zero-emissions
hydrogen in any process generating hydrogen with a GHG emissions intensity lower than
benchmark, (whether or not renewable energy sources are used). Consequently, three types
of hydrogen may potentially be produced in a given facility:
Type 1: Green hydrogen according to definition option 2
Type 2: Zero-emissions hydrogen not from renewable sources
Type 3: Non-zero-emissions hydrogen
When the GHG emissions intensity of the hydrogen produced in the preceding 12 months is
below benchmark, a CertifHy GoO can be delivered for either type 1 and type 2 hydrogen,
type 1 hydrogen being covered by a CertifHy Green Hydrogen GoO and both type 1 and type
2 hydrogen being covered by a Zero GHG Hydrogen GoO.
Observing again formula [1] and formula [2] in the previous section, we could conclude that
the share of production qualifies for being labeled both CertifHy Green Hydrogen and Zero
GHG Hydrogen.
The same or larger share λ of production qualifies for being labeled Zero GHG hydrogen.

Technical Report o the Defi itio of Gree Hydrogen
35
“u se ue tl , if λ>α, the sha e λ-α) qualifies for being labeled zero GHG hydrogen only.
This generalization is needed in order to ensure consistent quantification of GHG emissions:
zero-emissions hydrogen produced from renewable sources may be sold as zero GHG
hydrogen, therefore a single method for quantifying GHG emissions needs to be applied
without regards to renewable origin.
6.2.2.2 Option 2 GoO concept
The GoO concept associated to Option 2 is shown below.
It allows the identification of both CertifHy green hydrogen and zero GHG hydrogen.
As can be seen, there is no longer a reference to a GHG emissions intensity threshold, as the
application of such a threshold is no longer required.
Technical Report o the Defi itio of Gree Hydrogen
36
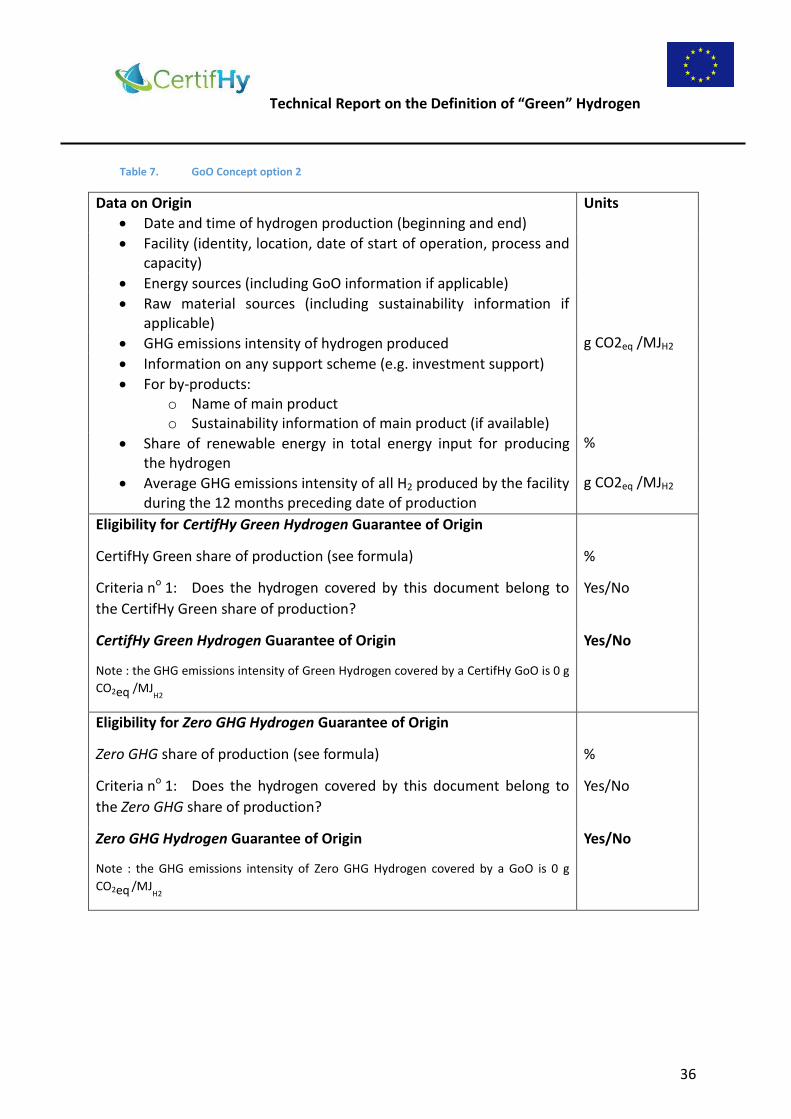
Table 7. GoO Concept option 2
Data on Origin Units
Date and time of hydrogen production (beginning and end)
Facility (identity, location, date of start of operation, process and
capacity)
Energy sources (including GoO information if applicable)
Raw material sources (including sustainability information if
applicable)
GHG emissions intensity of hydrogen produced g CO2eq /MJH2
Information on any support scheme (e.g. investment support)
For by-products:
o Name of main product
o Sustainability information of main product (if available)
Share of renewable energy in total energy input for producing
the hydrogen
%
Average GHG emissions intensity of all H2 produced by the facility
during the 12 months preceding date of production
g CO2eq /MJH2
Eligi ility for CertifHy Green Hydrogen Guara tee of Origi
Ce tifH G ee sha e of p odu tio see fo ula %
C ite ia o : Does the h d oge o e ed this do u e t elo g to the Ce tifH G ee sha e of p odu tio ?
Yes/No
CertifHy Green Hydrogen Guara tee of Origi Yes/No
Note : the GHG emissions intensity of Green Hydrogen covered by a CertifHy GoO is 0 g
CO2eq /MJH2
Eligi ility for Zero GHG Hydrogen Guara tee of Origi
Zero GHG sha e of p odu tio see fo ula %
C ite ia o : Does the h d oge o e ed this do u e t elo g to the Zero GHG sha e of p odu tio ?
Yes/No
Zero GHG Hydrogen Guara tee of Origi Yes/No
Note : the GHG emissions intensity of Zero GHG Hydrogen covered by a GoO is 0 g
CO2eq /MJH2

Technical Report o the Defi itio of Gree Hydrogen
37
Exception in the case 100% of energy input is renewable:
As green hydrogen has a GHG emissions intensity of zero, the share of green hydrogen is
lower than 100% when non-zero emissions energy sources are used, even if these are 100%
renewable.
It is proposed to allow the possibility of producing a 100% share of green (zero-emissions)
hydrogen when only renewable energy is used, under the condition that exclusively
renewable sources have been used during the preceding 12 months and that all the LCA
GHG emissions are compensated by purchasing of CO2 certificates.
6.2.3 Coverage of GoO to all hydrogen production
This approach requires all the hydrogen produced and delivered to be associated to a GoO
providing all relevant information regarding sources and sustainability. Consequently, the
notion of residual mix disappears, as all production is characterized.
It is worth mentioning that this approach does not necessarily prevent the production of
high GHG emissions hydrogen if a fraction of the consumers are not concerned about GHG
emissions.
Furthermore, the approach requires in practice the disclosure of data relative to hydrogen
production operations for all markets, which is unlikely to be accepted. Therefore this
option is not proposed for further consideration in CertifHy.
6.3 Comparative analysis of the GoO options
Table 8 shows the summary of criteria applied to each of the above mentioned options,
including some information on the limitations of the options.
Table 8. Criteria and evaluation of options to address the residual mix problematic
CRITERIA Reference: no measures
taken to address limitations
Option 1 definition with
transparency on GHG
emissions of facility
Option 2 definition, with off-setting of
excess emissions
Transparency Does not provide information
regarding overall emissions of
the facility.
Conflict: rejection of green
electricity from co-firing of
biomass and coal in power
plants
Addresses limitation of (1):
information on Facilities
GHG emissions is provided
Same information as (1) is provided. No
particular limitation
Simplicity for Renewable hydrogen has a Same as (1). Addresses limitation of (1) and (2):

Technical Report o the Defi itio of Gree Hydrogen
38
customer GHG emissions intensity that
depend on the pathway. This
introduces a quality
parameter that the customer
has to deal with, increasing
complexity
Furthermore, GoO for
green H2 may indicate that
facility has high emissions,
providing contradictory
information as to beneficial
impact.
the GHG emissions intensity of green H2
is always 0, eliminating a parameter to
deal with, reducing complexity
Simplicity for
producer
No particular limitation Need to continuously keep
track of overall GHG
emissions
Same as (1).
(Uses same LCA analysis as (1) and (2))
Customer trust Potential actual detrimental
impact of the H2 production
a ti it ge e ati g GoO’s is a source of mistrust
Only partially addresses
limitation of (1): the fact
that the system does not
prevent the provision GoOs
from facilities with
detrimental effect remains
a source of mistrust
Addresses limitation of (1) and (2): GoOs
can only be generated by facilities having
a positive environmental impact
Market potential Variable level of GHG
emissions complicates mass
marketing and impacts value
Same as (1) Addresses limitations of (1) and (2):
Green H2 becomes a uniform product
with maximum customer value (0 GHG
emissions) facilitating mass marketing
and maximizing market value
Support to H2
production from
alternative low
carbon sources
Many low carbon sources are
excluded due to reliance on a
renewable sources (e.g.
nuclear electricity)
Same as (1) Addresses limitations of (1) and (2):
Impact of carbon emissions is
progressive, and therefore almost all low
carbon sources using renewable
feedstock can produce some renewable
GoO covered hydrogen
Consistency with
long term trend
(disclosure of
environmentally
relevant
information for
all production)
Does not provide full
information on a given facility
and does not ensure
information for all H2
production
This option does not
require information to be
provide for all H2
production
Same as (1)
Consistency with
RED and FQD
No particular limitation No particular limitation Introduces a new way of quantifying
green H2 production, although not
consistent with RED or FQD
Consistency with
other GoO
schemes
No particular limitation. It is
to be noted though that
existing GoO schemes are not
consistent among themselves
Same as (1) The rate of conversion of renewable
energy to green H2 will depend on the
GHG content of renewable energy, but
other site specific factors come into play
as well (such as energy efficiency). Not
consistent with other GoO schemes
Technology
neutral and
robust
GHG threshold is arbitrary
and set of processes which
are in or out is sensitive to
threshold
Same as (1) Same as (1)
Effective
fulfilment of
environmental
goals
GoOs may be generated
despite detrimental
environmental effects of
facility production.
No provision for keeping
track of residual mix (i.e.,
production not covered by a
GoO)
Partially address limitation
of (1) as information on the
whole GHG emissions of
the plant is available.
Addresses limitations of (1) and (2):
- GoO’s a o l e ge e ated f o facilities having a beneficial/neutral
impact.
- Approach ensures that residual mix will
not be negatively affected by processes
ge e ati g GoO’s, eli i ati g eed to track residual mix
- This option does not take into account
any sustainability aspect apart from GHG
emissions

Technical Report o the Defi itio of Gree Hydrogen
39
7 Stakeholder consultation on the most suitable GoO scheme
Following the logical consultation process presented in chapter 2, the present report shows
the background and definition of green hydrogen, nevertheless some details are to be
clarified in order to have a robust and transparent GoO scheme.
7.1 Definition of green hydrogen
The definition of green hydrogen as presented in chapter 4 covers a dual purpose:
addressing renewable sources and including a threshold on the GHG emissions of the
produced hydrogen.
The stakeholders are requested to assess the acceptability of the definition and to point out
any practical inconveniences by applying such definition on the field.
Question 1. Is it necessary to include a minimum share threshold regarding the energy
input form, enabling the generation of hydrogen from renewable sources?
Question 2. In case of a positive answer to Question 1, this minimum share should be:
Option a) 5% of the total energy demand
Option b) 10% of the total energy demand
Option a) 20% of the total energy demand
Option a) other percentage, please give a value
Question 3. Which threshold shall be applied to definition 1:
a) 50% below the reference value?
b) 60% below the reference value?
c) 70% below the reference value?
d) Moving threshold following RED? If yes, how fast should it move and which should be the
starting % below the reference value?
d) Other percentage, please give a (moving or fixed) value/s
Question 4. does the definition fit with current national initiatives in your country for the
labelling and certification of green hydrogen? Please, elaborate.

Technical Report o the Defi itio of Gree Hydrogen
40
7.2 Options to address the limitations of the definition
Chapter 6 shows that the definition presented in chapter 4.2 have a number of limitations,
in particular the likelihood that facilities generating green hydrogen will in fact have higher
overall emissions than the current reference and incapacity to limit emissions associated to
the residual mix used in the hydrogen production facility. Improvements to this approach or
more substantial changes can be applied to partially or fully address this challenge. On the
other hand, other important aspects will also be impacted, including transparency and
consistency with current GoO schemes.
Stakeholders are requested to give an opinion on the most appropriate and practicable
approach to address this issue.
Question 5. Which definition shall apply for green hydrogen?
a) Definition 1 (see chapter 4.2)
b) Definition 1 including Option 1 of Chapter 6.2.1
c) Definition 2 (See chapter 6.2.2)
In case that none of the options are acceptable the stakeholders are requested to inform
how the residual mix, transparency and other relevant issues should be treated outside the
scheme in order to give a clear feedback to policy makers.
7.3 Inclusion of by-product hydrogen
The definition of green hydrogen includes sustainability requirements for raw materials
(feedstocks). In case of by-product hydrogen (see examples in Annex) there is no available
definition of sustainability for raw materials other than biomass.
The stakeholders are requested to assess the relevance of sustainability of raw materials
when hydrogen is a by-product of established processes (e.g. chloralkali electrolysis, steam
cracking of naphtha, etc.) and to present options on how to address sustainability in such
cases.
Question 6. Should by-product hydrogen processes be eligible for producing green
hydrogen?
Question 7. In case of a positive answer to Question 6 and taking into account that for
GHG calculations an allocation approach is required (see Annex Error! Reference source not
found.), additionally taking into account that energy allocation is required by the RED. Is
energy allocation based on standard enthalpies of formation and reaction enthalpies
Technical Report o the Defi itio of Gree Hydrogen
41
appropriate, when the input/s and/or output/s are not energy carriers (e.g. Chloralkali
electrolysis)?
7.4 Inclusion of transport into GoO
Following the actual situation on the electricity GoO scheme, the green hydrogen GoO
scheme proposed to have certificates at the production site and not at the consumer site.
The participants are requested to comments on the marked effects or disruptions due to
not accounting for losses on the transport of hydrogen.
Question 8. Should energy consumption in transport and storage be addressed by the
GoO?
The response to these questions will be assessed and the conclusions will be presented in
the final report.

Technical Report o the Defi itio of Gree Hydrogen
42
Annex A. GHG calculation for By-product hydrogen
The greeenhouse gas emission calculation based on an LCA approach is described in
[CertifHy 2015]4.
In general, the by-product H2 is used for steam and electricity generation for consumption
within the chemical complex, or it is transported to remote customers; only limited amounts
of by-product hydrogen are not used, and flared or vented. Various methodologies can be
applied for calculating the GHG emissions of H2 from chloralkali electrolysis:
Substitution method (marginal approach hydrogen): Today, by-product H2 is used for
steam and electricity generation. If this H2 is used for other purposes, e.g. as
transportation fuel for fuel cell electric vehicles (FCEV), additional natural gas is
required within the chemical complex for steam and electricity generation. As a
result of this substitution, the GHG emissions of the supply and use of natural gas are
assigned to H2.
Substitution method (chlorine and sodium hydroxide by-product): H2 is considered
to be the main product, Cl2 and NaOH are considered to be by-products. However,
there is no commercially viable alternative production process for both Cl2 and
NaOH. Only for NaOH there is the Solvay process which leads to Na2CO3, which can
subsequently be converted to NaOH. Therefore, the substitution method (chlorine
and sodium hydroxide by-product) cannot be applied.
Allocation by energy: Emissions are allocated to the products based on their relative
energy content. In the present case, Cl2 and NaOH are considered to be raw
chemicals rather than energy products. Nonetheless, it is possible to apply energy
allocation here based on standard enthalpies of formation of the chemicals involved
in the reactions, which is used for calculating the enthalpy of reaction (H; see
chemical reaction below).
Allocation by mass: Emissions are allocated to the products based on their relative
weights. This allocation method is sometimes used for non-energy products, and is
thus not applicable here.
Allocation by market value: Emissions are allocated to the products based on their
relative market value. This allocation method is sometimes used for products where
the market values of the products show significant differences, which supports the
assumption that the high-value products are the main motivation for the commercial
operation, and thus higher levels of emissions should be allocated to them. This
method is not suitable here.
4 CertifHy project, Altmann, M., Weindorf, W.: Extended Life-cycle Analysis of Hydrogen Production,
Deliverable No. 2.3, 3 July 2015

Technical Report o the Defi itio of Gree Hydrogen
43
In line with the RED/FQD methodology, energy allocation is also used for the calculation of
the GHG balance of by-product hydrogen: emissions are allocated to the products based on
their relative energy content.
The following two commercially relevant examples shall serve to clarify the approach
[CertifHy 2015].
A.1 Hydrogen from chloralkali electrolysis
Chloralkali electrolysis is used to produce chlorine (Cl2) and sodium hydroxide (NaOH) from
sodium chloride (NaCl) and water. H2 is a by-product. The enthalpy of reaction (H) is
positive which indicates that energy has to be provided to the reaction:
2 NaCl + 2 H2Oliq 2 NaOH + Cl2 + H2 H = 540.22 kJ
In general, the by-product H2 is used for steam and electricity generation for consumption
within the chemical complex, or it is transported to remote customers; only limited amounts
of by-product hydrogen are not used, and flared or vented.
Cl2 and NaOH are considered to be raw chemicals rather than energy products. Nonetheless,
it is possible to apply energy allocation here as well based on standard enthalpies of
formation of the chemicals involved in the reactions, which is used for calculating the
enthalpy of reaction (H; see chemical reaction above).
The energy content of the products can be considered to be the same as the theoretical
energy input for electrolysis, i.e. the 540.22 kJ (see reaction above). The energy bound in the
hydrogen amounts to 285.84 kJ, which is the higher heating value per mole of hydrogen. As
a result, the allocation factor is 52.9% for hydrogen (see Table 9) [CertifHy 2015].
Table 9. Electricity consumption for the production of hydrogen from chloralkali electrolysis
Unit Allocation by energy
Before allocation kWh/kgH2 80.75
kWh/kWhH2, LHV 2.4233
Allocation factor 52.9%
After allocation kWhe/kWhH2, LHV 1.2822
A.2 Hydrogen from steam cracking of naphtha
Steam cracking of naphtha is used to generate olefins, e.g. for the production of plastics.
First, naphtha is pre-heated to a temperature of 550-600°C while steam at a temperature of

Technical Report o the Defi itio of Gree Hydrogen
44
180-200°C is added. Then, the naphtha is heated up to a temperature of 800-850°C where
the hydrocarbon chains are cracked into ethylene and propylene as main products as well as
various other compounds as by-products, thereof about 1% hydrogen by mass, or 2.63% by
energy.
Table 10 shows the yield of products and its composition for a typical steam cracking plant
[CertifHy 2015].
Table 10. Yield and product composition of a typical steam cracking plant
Product Share
(%-energy)
Energy stream
(TJ/yr)
H2 2.63% 358
CO 0.01% 1
CH4 16.34% 2,226
C2H2 0.70% 96
C2H4 31.14% 4,242
C2H6 3.46% 471
C3H6 15.80% 2,152
C3H8 0.37% 51
C4H8 9.15% 1,246
Pyrolysis gasoline 17.69% 2,410
Pyrolysis fuel oil 2.69% 367
Total 100.00% 13,622
Table 11 shows the input and output data for the production of hydrogen from naphtha
steam cracking applying energy allocation based on typical values for the energy
requirements [CertifHy 2015].
Table 11. Input and output data for hydrogen production via steam cracking of naphtha applying energy
allocation
I/O Unit Value
Naphtha Input MJ/MJ 0.9310
Steam Input MJ/MJ 0.0135
Heat Input MJ/MJ 0.1410
Electricity Input MJ/MJ 0.0020
Hydrogen Output MJ 1


