Download - Tata manendra

PRESENTED BY
Manendra & Team

INTRODUCTION
India’s largest business group
Diverse businesses in 7 sectors
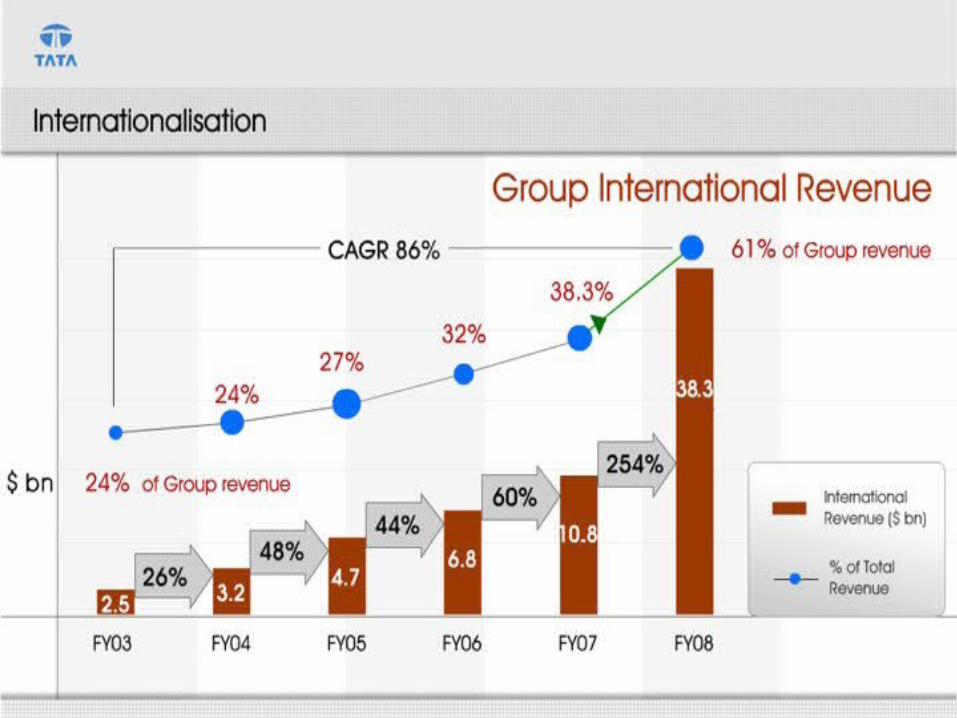
International income 61% of group revenue
Operations in over 80 countries
Products and services exported to 85 countries
Largest employer in private sector over 300,000 employees
Group revenue FY 2008: Rs 251,543 cr/$ 62.5 bn
Group profit FY 2008: Rs 21,578 cr/$ 5.4 bn

The beginnings of Tata Group can be traced back to 1868,when Jamsetji Nusserwanji Tata established a trading company dealing in Opium in Bombay.
Sir Dorab Tata, the eldest son of Jamsetji became the chairman of the group after his fathers death in 1904.
After the death of Dorab Tata in 1934, Nowroji Saklatwala headed the group till 1938.
He was succeeded by JRD Tata till 1991.
Ratan Tata, the incumbent chairman of the group succeeded JRD Tata in 1991.
HISTORY

Improve the quality of lifeof the communities we servethrough leadership in sectors of national economic significance

Group Values
Tata Code of Conduct

Ownership Promoter Companies
66% Public Trust
Tata Sons18% Other corporate
shareholders
13% Tata Companies
3% Family
51% Other Tata Companies
Tata Industries29% Tata Sons
20% Jardine Matheson group

Tata Steel Advance Materials
Taj Hotels Tata AIG Life &
General Insurance Companies
Tata Tea Titan Trent
Tata Motors TACO Group Voltas
Tata Chemicals Rallis
Tata Power Tata BP Solar
Services
Materials Energy
Chemicals
EngineeringConsumer Products
Tata Consultancy Services
Tata Teleservices VSNL
IT and Communications
Business Sectors

Industry Pioneers

Role of Companies:
Committed to improving quality of life of surrounding communities.
CSR expenditure budgeted before preparation of P & L accounts.
Active volunteering programme in group. IIIustrative Initiative: Tata Steel: HIV/AIDS programme. TCS: Computer-based Adult Literacy Programme.

INFORMATION TECHNOLOGY AND COMMUNICATIONS
INFORMATION TECHNOLOGY
TATA CONSULTANCY SERVICESTATA TECHNOLOGIESTATA ELXSITATA INTERACTIVE SYSTEMSTATA BUSINESS SUPPORT SERVICESCOMPUTATIONAL RESEARCH LABORATORIES
COMMUNICATIONS
TATA TELESERVICESTATA COMMUNICATIONSTATA SKY

INFORMATION TECHNOLOGY TATA CONSULTANCY SERVICES
ESTABLISHED :1968MARKET CAP: Rs 47,242cr/$9.7bn
Pioneer & leader in Indian ServicesCurrent global ranking No 11: Revenue No 3: ProfitsGlobal footprint Clients in 50 countries: 6 of Fortune Top 10 Offices in 42 countries: Delivery Centers in 18 countries Over 1,16,000 AssociatesFull Service Provider: IT services BPO Infrastructure services Engineering and Industrial servicesVISION: GLOBAL TOP BY 10 BY 2010
REVENUE 07-08: $5.7bn

COMMUNICATIONS TATA INDICOM
ONE BRAND COMPREHENSIVE TELECOM SERVICE PORTFOLIO
SERVICES: FIXED & MOBILE, VOICE/DATA/VAS
SEGMENTS: CARRIERES,CORPORATE,SME and INDIVIDUALS
NETWORKS: DOMESTICS AND INTERNATIONAL

COMMUNICATIONS TATA COMMUNICATIONS
TAKEN OVER BY TATA : 2002MARKET CAP: Rs. 12078Cr/$2.5 bn
INDIA: ENTERPRISE DATA AND MANAGED SERVICESINTERNATIONAL AND DOMESTICS LONG DISTANCE SERVICES.INTERNET AND BROADBAND SERVICES
GLOBAL :
INTERNATIONAL WHOLESALE VOICE CARRIERSUBMERINE CABLE AND BRANWIDTHENTERPRICE CONNECTIVITY & MANAGED SERVICESENTRY INTO SOUTH AFRICA(NEOTEL) AND CHINA(CEC)
LISTED ON NYSEOBJECTIVE:TOP 3 SERVICE PROVIDER IN CHOOSEN MERKET
REVENUE 07-08: $2.12 bn

COMMUNICATIONS TATA SKY
ESTABLISHED: 2002
Direct-To-Home satellite TV services JV WITH STAR World class TV Viewing experience empowering customers with choice control and convenience DVD quality picture and CD quality soundRange of interactive servicesLaunched: Aug.2006, record 2.3million activations

ENGINEERING
AUTOMOTIVE:
TATA MOTORSTATA AUTOCOMP SYSTEMSTELCO CONSTRUCTION EQUIPMENT
ENGINEERING PRODUCTS,PROJECT AND SERVICES
VOLTASTATA PROJECTS

AUTOMOTIVES
ESTABLISHED :1945MARKET CAP: Rs:6,763cr/$1.4 bn
India’s largest Automobile company by revenueJaguar Land Rover part of portfolio.Leadership position in commercial vehicles
Global No 4 in M&HCV trucks; No 2 in BusesNo 3 in passenger car vehicles in IndiaStrongest Subsidiaries / Associates
Tata Daewoo, Hispano, Telcon, Tata Technologies,European Technical center in UK and Tata Motors inThailand
Objectives 2010: Doubles sales to >1m vehicles;Thrust on growing International presence
TATA-MOTORS
REVENUE 07-08: $8.8 bn

TATA MOTORS-NANO
Address largest part of the pyramids
Expanding Domestic Addressable Market
Price Rs:1,00,000 ~2000(exclusive VAT and freight) Among the World’s least expensive car.Family car-seats four comfortablyFully complaint with safety and emission norms.Engine: 623cc; 33PS250,000 capacity plant coming up Sanand,Gujarat

AUTOMOTIVE TATA AUTOCOMP SYSTEMS
ESTABLISHED:1995
Amongst fastest growing auto components and service provider Among top 5 Indian playersBUSINESSES:
Manufacturing: 35 facilitiesIncluding One each Germany and ChinaDesign and EngineeringSupply Chain15 Global PartnersOwn business in interior and plastics, suspension parts for passenger vehicles and Mobility TelematicsCustomers from all major global and Indian auto OMES.Objectives: To become a preferred Tier 1 supplier to Global automotive industry.
REVENUE 07-08: $ 843m

AUTOMOTIVS
Telco Construction Equipment Company
ESTABLISHED :1999REVENUE 07-08: Rs:2,735/$679.7m
60:40 JV of Tata Motors & Hitachi Construction Machinery.Domestic market leader in product and services for construction mining and earthmoving industries.
Design, manufacturing, servicing, marketing and sales capabilities.
Main Products: hydraulic excavators, backhoe loaders, wheeled loaders, off-highway dampers, crawler & tyre mounted cranes , compactors, motor graders.
Manufacturing Units: Jamshedpur; Dharwad; Kharagpur(up coming)
Acquired Serviplem S.A. (Spain)Design, manufacturing, sales and service of concrete equipmentsAcquired Comoplesa Lebrero S.A. (Spain)Design, manufacturing, sales and service of concrete equipments

Engineering Products, Projects and Services
VOLTASESTABLISHED :1954MARKET CAP: Rs.1,310 cr/$269m
Engineering Solutions in:
Electro-mechanical projects and servicesLargest exporter in IndiaLeading central air conditioning company in India
Cooling Products: commercial/homesIndia’s no 2 air-conditioner brand
Engineering product and servicesTextiles, material handling, mining and construction equipment and machine tools.
Objectives: Rs 10,000 cr ($2 bn) revenue by 2010-11
REVENUE 07-08: $774.4m

MATERIALS
METALS
TATA STEEL
COMPOSITES
TATA ADVANCE MATERIALS

METALS
TATA STEEL
ESTABLISHED :1907MARKET CAP: Rs 13,301 cr/ $2.7bn
Fortune 500 company
World’s 6th largest steel maker : 28 MTPA Jamshedpur works NatSteel Asia Corus Tata Steel,Thailand
Presence in 50 markets; manufacturing operation 24 countries.
Expansion plans:Brownfield: Jamshedpur worksGreenfield: India and Overseas
REVENUE 07-08: $ 32.83 bn

METALS
TATA STEEL GROUPCORUS
Europe's 2nd largest steel producer: 20 MTPA Main plant in UK and The Netherlands
Three main operating divisions- Strips Products,Long Products and Distribution & building Systems
Investment underway to reinforce competitive position in automotive and construction markets.Scunthrope, UK-new beam caster and wire rod mill upgrade (on stream 2008)IJmuiden, Netherlands – new cold rolling mill and continuous galvanizing line (on stream 2008-09)

COMPOSITES
TATA ADVANCED MATERIALSESTABLISHED :1999REVENUE 07-08: Rs 26 cr/$ 6.45m
Design, engineering, and manufacture of advanced composites
Products and Services:Aerospace and Aircraft componentsDesign and Engineering servicesPersonnel armour products- largest in IndiaVehicle armour solutions
Objectives: Rs 1000 cr/$200 m revenue by 2012-13

SERVICES
HOTELS AND REALITY
Indian Hotels( Taj hotels, Resorts, Palaces)Tata Reality and InfrastructureTata Housing
FINANACIAL SERVICESTata AIG Life and General InsuranceTata Asset ManagementTata Investment CorporationTata Capital
HOTELS
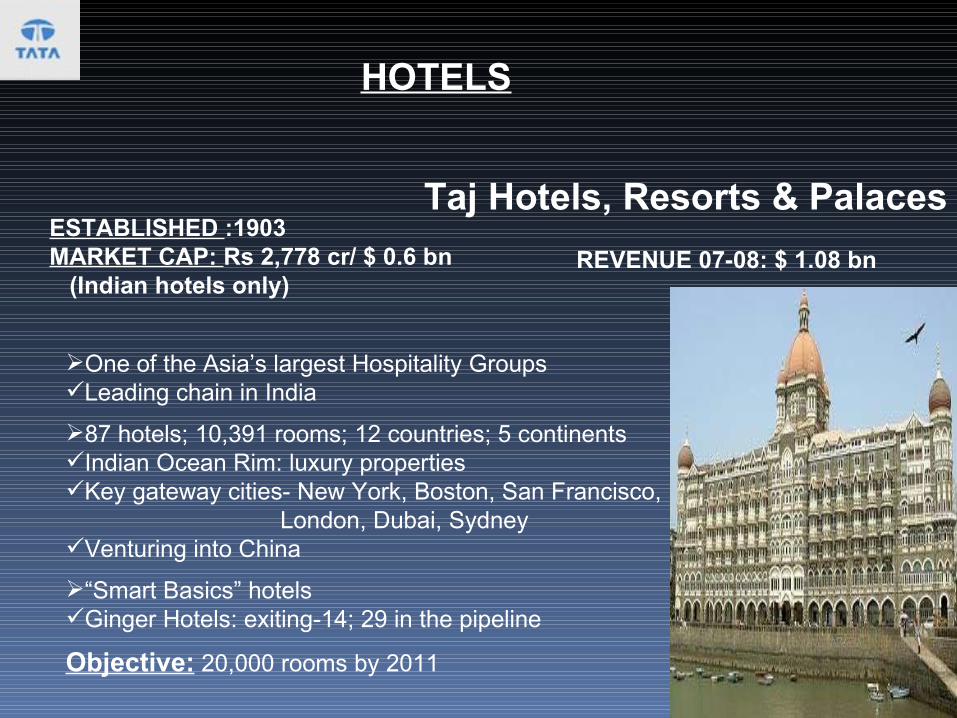
Taj Hotels, Resorts & PalacesESTABLISHED :1903MARKET CAP: Rs 2,778 cr/ $ 0.6 bn (Indian hotels only)
One of the Asia’s largest Hospitality GroupsLeading chain in India
87 hotels; 10,391 rooms; 12 countries; 5 continentsIndian Ocean Rim: luxury propertiesKey gateway cities- New York, Boston, San Francisco, London, Dubai, SydneyVenturing into China
“Smart Basics” hotels Ginger Hotels: exiting-14; 29 in the pipeline
Objective: 20,000 rooms by 2011
REVENUE 07-08: $ 1.08 bn

Address largest part of the pyramids
Indian Hotels- Ginger
Rs. 999-2,499 (single room) ($20-$50)“Smart Basics”
100+ rooms per hotel14 open; mostly in non-metros
Aggressive roll out: 30 hotels in 2 years;100+ by2011

ENERGY
POWER
Tata Power
Renewable Energy
Tata BP Solar

POWERTATA POWER
ESTABLISHED :1911MARKET CAP: Rs 16,447cr/$3.4 bn
Pioneered hydro power generation in India
Generation Capacity>2300 MW- largest private sector
Presence in generation (thermal, hydro, solar and wind), transmission and distribution
Expansion:>7,500 MW additional generation capacity by 2012
Objective: Aggressive addition in generation, transmission, distribution capacity in India
REVENUE 07-08: $ 2.8 bn

CONSUMER PRODUCT
BEVERAGES
Tata TeaTata Coffee
WATCHES AND JEWELLARY
Titan Industry
Retailing TrentInfiniti Retail

BEVERAGES
TATA TEA
ESTABLISHED :1964MARKET CAP: Rs 3,429 cr/$ 703m
World’s 2nd largest global branded tea operation Acquisition- Tetley, Good Earth, Jemca, Joekels & Vitax
Coffee- growing through:Higher value roast & grounded coffee (Eight O’clock coffee)Freeze dried/Instant coffee
Water: Himalaya Brand
Objectives: Beverage solution for consumers’ well being, nutrition and hydration. Global face in the beverage industry; grow 5X in 5 years
REVENUE 07-08: $ 1.1 bn

CHEMICALS
Tata Chemicals Rallis IndiaAdvinus Therapeutics

CHEMICALS
TATA CHEMICALS
ESTABLISHED :1939MARKET CAP: Rs 3,398cr/$ 0.7bn
Into inorganic chemicals, fertilizers, and food additives.
World No.2 in Soda Ash
Pioneer and market leader in branded, iodized salt
Total Produce Ireland JV for fruits and vegetables distribution.
Entering Bio-fuels Sector
Objectives: $ 4bn (18000 cr) revenues by 2012.
REVENUE 07-08: $ 1.7 bn

IDP is a fact sheet about the individual.
Is prepared by the manager of the employee.
Is endorsed by the Function/SBU Head and finally signed off by the CEO of the company.
Individual Development Profile
Work & Career Details
Performance Data
Personal Details: Age, Education
Tata WorkLevel & MCPA Assessment
Tata Leadership Practices Data
Development PlanIDP

Talent Management Schedule
Annual Performance Review & Development need discussions with individual employees
Manager / EmployeeApr - Jun
Talent Review within Business Unit/Function
BU Leadership TeamJun - Jul
Presentation of Talent Review by BU / Functional Leaders to MD/CEO
BU Leadership Team & CEOJul - Aug
Talent Review at Company level
Identification of HPMs and their Development and Movement Plans
CEO & HR HeadAug
Group PPM discussions
Agree on Development & Movement plans
CEO & Head HR and GCC / Peer MD / Group HRSep – Feb
Implement Development & Movement plans•In Company•Cross Company / Group Level
CEO & HR HeadSep - Mar
Implement agreed cross company Movement plans & Group level Development programs
CEO & Head HR and Group HROct – Sep
1 2 3
45
6
7&8

STRENGTH
EXPERIENCEMICRO ENVIRONMENTBUSINESS MODELRESOURCE AND CAPABILITIESCULTURE
WEAKNESS
VALUE CHAINDISTRIBUTIONMACRO ENVIRONMENT
OPPORTUNITIES
EXPORTS NEW PRODUCTSNEW MARKETSACQUISITION & MERGERS
THREAT
FREE MARKETLOW BARRIERSGLOBALISATION OF ECONOMY
SWOT ANALYSIS

STRATEGIES
GLOBAL EXPANSION THROUGH ACQUISITION
Low price strategy
Differentiation strategy
Reach to potential markets and repeatedly expending the value network
A hybrid strategy (differentiation & price lower)

“We have two guiding arrows. One points overseas, where we want to expand markets for our existing products. The other points right here, to India where we want to explore the large mass market that is emerging – not by following but by breaking new ground in product development and seeing how we can do something that hasn’t be done before.”
Ratan Tata Group Chairman


Mar ' 09 Mar ' 08 Mar ' 07 Mar ' 06 Mar ' 05
Sources of funds of Tata steel(BALANCE SHEET TATA STEEL)
Owner's fund
Equity share capital
730.79 730.78 580.67 553.67 553.67
Share application money
- - 147.06 - -
Preference share capital
5,472.66 5,472.52 - - -
Reserves & surplus
23,501.15 21,097.43 13,368.42 9,201.63 6,506.25
Loan funds
Secured loans 3,913.05 3,520.58 3,758.92 2,191.74 2,468.18
Unsecured loans 23,033.13 14,501.11 5,886.41 324.41 271.52
Total 56,650.78 45,322.42 23,741.48 12,271.45 9,799.62
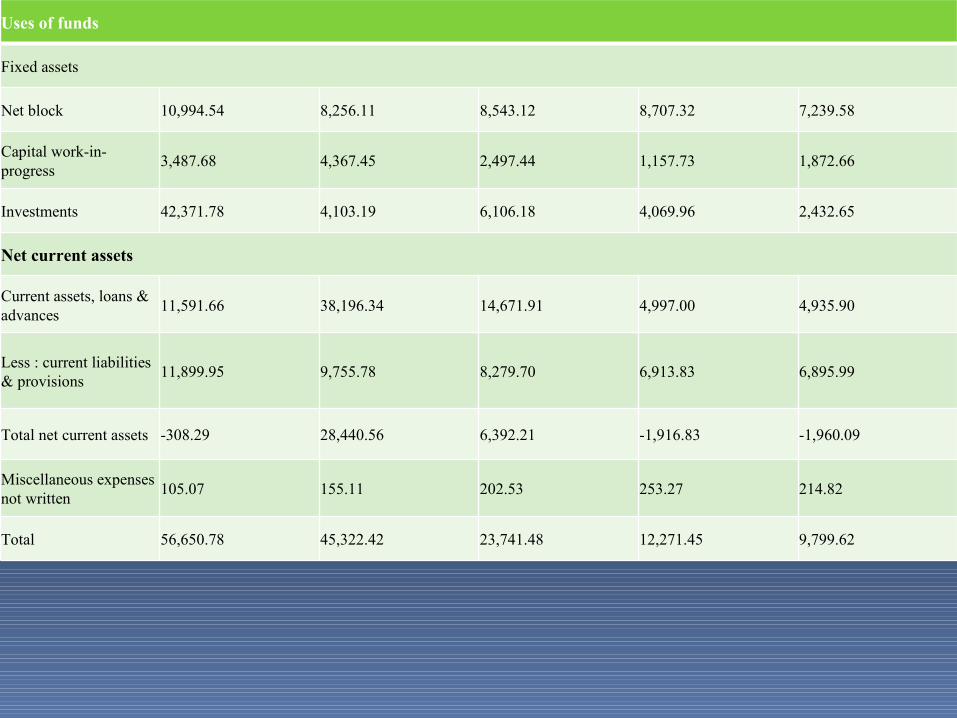
Uses of funds
Fixed assets
Net block 10,994.54 8,256.11 8,543.12 8,707.32 7,239.58
Capital work-in-progress
3,487.68 4,367.45 2,497.44 1,157.73 1,872.66
Investments 42,371.78 4,103.19 6,106.18 4,069.96 2,432.65
Net current assets
Current assets, loans & advances
11,591.66 38,196.34 14,671.91 4,997.00 4,935.90
Less : current liabilities & provisions
11,899.95 9,755.78 8,279.70 6,913.83 6,895.99
Total net current assets -308.29 28,440.56 6,392.21 -1,916.83 -1,960.09
Miscellaneous expenses not written
105.07 155.11 202.53 253.27 214.82
Total 56,650.78 45,322.42 23,741.48 12,271.45 9,799.62

Mar’09 Mar ' 08 Mar ' 07 Mar ' 06
Income
Operating income 24,348.32 19,654.41 17,452.66 15,132.09
Expenses
INCOME STATEMENT OF TATA STEEL LTD.
Cost of sales 15,171.88 11,409.87 10,538.91 9,247.87
Other recurring income
305.36 347.28 485.14 256.95
Financial expenses
1,489.50 929.03 251.25 168.44
Depreciation 973.40 834.61 819.29 775.10
Tax charges 2,114.87 2,380.28 2,040.47 1,734.38
Adjusted PAT 4,904.03 4,447.90 4,287.88 3,463.25
Non recurring items
297.71 239.13 -123.02 -4.37
Other non cash adjustments
- - 57.29 47.50
Reported net profit
5,201.74 4,687.03 4,222.15 3,506.38

Mar ' 09 Mar ' 08 Mar ' 07 Mar ' 06 Mar ' 05
Per share ratios
Reported EPS (Rs)69.70 63.85 72.74 63.35 62.77
Dividend per share 16.00 16.00 15.50 13.00 13.00
Operating profit per share (Rs)
125.60 112.85 119.11 106.31 107.61
Profitability ratios
Operating margin (%)
37.68 41.94 39.61 38.88 41.10
Gross profit margin (%)
33.69 37.70 34.91 33.76 36.83
Net profit margin (%)
21.09 23.43 23.53 22.78 23.72
Adjusted return on net worth (%)
19.87 20.42 31.19 36.44 50.27
RATIO ANALYSIS OF TATA STEEL

Leverage ratios
Total debt/equity 1.34 1.08 0.69 0.25 0.38
Owners fund as % of total source
42.77 48.16 59.12 79.49 72.04
Fixed assets turnover ratio
1.22 1.20 1.09 0.98 1.11
Liquidity ratios
Current ratio 0.97 3.92 1.77 0.72 0.71
Quick ratio 0.57 3.52 1.37 0.29 0.33
Inventory turnover ratio
9.36 10.84 10.81 9.89 10.42
Payout ratios
Dividend payout ratio (net profit)
27.15 29.39 26.15 23.39 23.64
Coverage ratios
Financial charges coverage ratio
6.37 9.25 29.45 36.46 26.72
Long term assets / total Assets
0.83 0.30 0.53 0.73 0.70
CONTD..

Mar ' 09 Mar ' 08 Mar ' 07 Mar ' 06 Sources of fundsOwner's fund
Equity share capital 514.05 385.54 385.41 382.87
Reserves &surplus 11,855.15 7,428.45 6,458.39 5,127.81Loans & fundsSecured loans 5,251.65 2,461.99 2,022.04 822.76
Unsecured loans 7,913.91 3,818.53 1,987.10 2,114.08Total 25,534.76 14,094.51 10,852.94 8,447.52
Balance sheet of TATA MOTORS
Uses of funds
Fixed assets
Net block 7620.20 5361.80 3855.31 3543.65
Capital work-in-progress
6,954.04 5,064.96 2,513.32 951.19
Investments 12,968.13 4,910.27 2,477.00 2,015.15

Net current assets cont’d of tata motors
Current assets, loans & advances
10,836.58 10,781.23 10,318.42 9,812.06
Less : current liabilities & provisions
12,846.21 12,029.80 8,321.20 7,888.65
Miscellaneous expenses not
written2.02 6.05 10.09 14.12
Total 25,534.76 14,094.51 10,852.94 8,447.52

INCOME STATEMENT OF TATA MOTORS CO
Mar’09 Mar’08 Mar’07 Mar’06
Income
Operating income 25660.67 28767.91 26664.25 20088.63
Expenses
Cost of sales 23937.57 25737.39 24077.74 17942.27
Other recurring income
841.54 359.42 887.23 685.18
Financial expenses
704.92 471.56 455.75 350.24
Depriciation 874.54 652.31 586.29 520.94
Other write offs 51.17 64.35 85.02 73.78
Tax charges 12.50 547.55 660.37 524.93
Adjusted PAT 921.51 1,654.17 1,686.31 1,361.65
Non recurring items
79.75 374.75 227.15 167.23
Other non cash adjustments
15.29 - -0.07 -
Reported net profit
1,016.55 2,028.92 1,913.39 1,528.88

BALANCE SHEET OF TCS LTD.MAR ‘09 MAR’08 MAR’07
SOURCES OF FUNDS
OWNERS FUND
EQUITY SH CAP. 97.86 97.86 97.86
PREF SH CAP 100.00 100.00 -
RES.&SURPLUS 13248.39 10806.95 7961.13
LOANS FUNDS 13486.62 11023.06 8109.73
USES OF FUNDS
NET BLOCK 2669.08 1940.53 1460.61
CAPITAL WIP 685.13 889.74 757.85
INVESTMENTS 5936.03 4509.33 3252.04
NET CURRENT ASSETS
CURRENTS ASSETS,LOANS &ADVANCES
9250.79 7396.46 5294.74
LESS:CURRENT LIABILITY 5054.41 3713.00 2655.51
TOTAL NET CURRENT ASSETS
4196.38 3683.46 2639.23
TOTAL 13486.62 11023.06 8109.73

INCOME STATEMENT OF TCS LTD.Mar’09 Mar’08 Mar’07
Income
Operating income 22401.92 18533.72 14939.97
Expenses
Cost of sales 16381.09 13508.11 10638.49
Other recurring income
232.62 165.01 86.38
Financial expenses 7.44 3.42 3.43
depriciation 417.46 458.78 343.41
Tax charges 443.48 457.58 410.80
PAT 5385.07 4270.84 3630.22
Nonrecurring items -688.86 275.44 129.66
Other non cash adjust.
- -37.52 -2.59
Reported net profit 4696.21 4508.76 3757.29

31-Mar-09 31-Mar-08 31-Mar-07
Return on Total Assets (%) 41.23 38.81 48.44
Return on Networth (%) 34.93 40.97 46.62
Return on Capital Employed (%)
40.36 49.74 56.40
Profitability
Gross Margin (%) 35.40 35.00 36.98
Operating Margin (%) 25.01 23.61 26.49
Net Profit Margin (%) 20.96 24.65 25.15
Leverage
Debt/Equity ratio (x) -- -- 0.01
Interest Coverage (x) 809.25 1396.60 1253.90
RATIO OF TCS

Liquidity
Current Ratio (x) 1.27 1.46 1.55
Quick Ratio (x) 1.75 2.14 2.37
Working Capital
Per Share
Earnings Per Share (Rs)
-- 46.07 38.40
Dividend Per Share (Rs)
-- 14.00 11.50
Total Operating Income
22.49 22.42 33.03

THE PURPOSE OF THE TATA – IMPROVING THE QUALITY OF LIVES
ACTIVITIES
Endowments for creation of national institutions
Development assistance – including for livelihoods, health,education, micro-finance, bio-diversity,water harvesting.
Foreign scholarships – science and engineering Jn tata endowment
Disaster relief
CSR Contd…..
NATIONAL INSTITUTIONS
Indian Institute of ScienceTata Institute of Social Sciences(TISS)Tata Memorial HospitalTata Institute of Fundamental ResearchNational Centre for the Performing Arts
Other InitiativesTata Steel HIV/AIDS programmeTCS: Computer based Adult Literacy Programmes

THE QUESTIONS AHEAD OF TATA
the total debt of the Tata group as of the end of FY'09 at over Rs one trillion, of which Rs 117 billion is due through March 2010.
The total debt of the five major entities -- Tata Motors, Tata Steel, TCS, Tata Power and Tata Communications -- which account for 90 per cent of the group's revenues, is estimated at Rs 91,000 crore in FY2010, the analysts said. It includes:-
Tata Steel Rs 40,600 crore Tata Motors Rs 22,800 crore Tata Power Rs21,400 crore Tata Communication Rs 6,200 crore
"Within the group, the most pertinent issue remains Tata Motors' Rs 11,300 crore debt coming up for repayment/refinance in FY2010

Additionally, total capital expenditure for the group is Rs216 billion in financial year 2010, with a bulk of this coming from Tata Steel and Tata Power
Tata Power today said it has lined up nearly Rs 24,000 crore as capital expenditure in the next three years. (6th august 2009, Mumbai)
Tata steel is planning to spend Rs 40,000 crore to expand it’s production capacity to 16 million tonnes
Rating agency S&P (standard and poor's) downgraded Tata Motors rating to ‘B’ from ‘B+’ (Aug 4th , 2009)

Possible Measures
Tata Sons does not aggregate the debt of individual group companies as each company is a standalone legal entity and is evaluated accordingly."
MEASURES
Sake sales can be a possible measureTata motors can monetize its commercial vehiches division which is valued at Rs 12000 croreTata Motors can borrow upto Rs 11500 crores against the assets in the books
Tata motors announced a surprise quarterly profit July 28 of just under $107 million, investors took notice. Operating profit was up 11.4%, even though exports were down 43% and domestic sales were down about 10%.

A CLEAR VISION AND THE DEDICATION TO SERVE PRODUCES THE BEST OUTPUT AND LEADS TO GREATNESS

TATA.COMBROCHURE OF THE TATA GROUP KOTAK SECURITIES REPORT ON TATA