Tariff Structure Statement
16 March 2018
Tariff Structure Statement
Contents
Tariff Structure Statement ................................................................................................................. 1
1 Introduction ......................................................................................................................... 4
1.1 Purpose of our Tariff Structure Statement (TSS) ................................................................ 4 1.2 Scope of our TSS .................................................................................................................. 4 1.3 Structure of this TSS ............................................................................................................ 8
2 About Power and Water ...................................................................................................... 8
2.1 Power and Water ................................................................................................................. 8 2.2 NT market changes .............................................................................................................. 9 2.3 Customer retail pricing protections .................................................................................... 9 2.4 NT electricity meter fleet .................................................................................................. 10 2.5 Our demand and customer characteristics ....................................................................... 10
3 Our customer and stakeholder engagement .................................................................... 12
3.1 Summary of outcomes ...................................................................................................... 13 3.2 Preference testing ............................................................................................................. 13 3.3 Consulting on tariff design and our draft plan .................................................................. 15
4 Network tariff classes and tariff assignment ..................................................................... 16
4.1 Proposed network tariff classes for standard control services ......................................... 16 4.2 Network tariff assignment process ................................................................................... 19
5 Network tariff structures and charging parameters ......................................................... 22
5.1 Charging parameters ......................................................................................................... 22 5.2 Setting peak and off‐peak periods .................................................................................... 23 5.3 Tariff structures ................................................................................................................. 24
6 Network pricing principles ................................................................................................ 26
6.1 Rule requirements ............................................................................................................. 26 6.2 Compliance with the Rules ................................................................................................ 26 6.3 Pricing within stand‐alone and avoidable cost ................................................................. 27 6.4 Pricing based on long run marginal costs (LRMC) ............................................................. 28 6.5 Ensuring our tariffs reflect total efficient costs and relative customer cost shares, and
seek to minimise distortion ............................................................................................... 30 6.6 Considering customer impacts of tariffs ........................................................................... 31 6.7 Ensuring that tariffs can be understood ............................................................................ 33 6.8 Indicative tariffs ................................................................................................................. 34 6.9 Future tariff refinement .................................................................................................... 36
7 Alternative control services ............................................................................................... 37
7.1 What are our alternative control services ......................................................................... 37 7.2 Fee based and quoted ancillary services ........................................................................... 37 7.3 Metering services .............................................................................................................. 39
Appendix A – Indicative pricing schedule ........................................................................................ 40
Standard Control Services indicative tariffs 2019‐2024 ........................................................... 41

Tariff Structure Statement
3
Alternate Control Services indicative tariffs 2019‐2024 .......................................................... 43
8 Glossary of Terms .............................................................................................................. 46
Tariff Structure Statement
4
1 Introduction
This introductory chapter explains the purpose, scope and structure of this document.
1.1 Purpose of our Tariff Structure Statement (TSS)
Power and Water Corporation (Power and Water) is responsible for delivering energy from power generators to your homes and businesses in a safe and reliable way. While your retailer (e.g. Jacana Energy, Rimfire Energy or QEnergy) charges you for your energy usage, they pay us, on your behalf, for our services.
This Tariff Structure Statement (TSS) relates to Power and Water’s electricity network tariffs (tariffs). It explains our five‐year tariff strategy, outlining what tariffs we will charge, and who will be assigned to which tariffs.
Our tariffs recover the costs of building and maintaining the poles and wires, and the support staff needed to keep the energy network operating. This includes restoring power when faults and emergencies happen as a result of severe weather events and other causes beyond our control. The costs we can recover are regulated and must be approved by the Australian Energy Regulator (AER) every five years. The first regulatory approval period under the AER will be from 1 July 2019 to 30 June 2024. The tariffs in this TSS (if approved by the AER) will commence on 1 July 2019.
We have engaged with our stakeholders and customers to develop this, our first TSS, including publishing a draft overview of this TSS for consultation in November 2017. We will seek the AER’s approval during 2018, and will ensure our consequent annual tariff proposals align to it within the 2019‐24 regulatory control period.
For most customers, changes in our prices have no impact on their retail bills. This is because retail pricing protection applies under the Northern Territory (NT) Government’s Electricity Pricing Order (the Pricing Order).
1.2 Scope of our TSS
This document is required by the National Electricity (NT) Rules (NT NER – the Rules), and sets out the proposed approach to tariffs that comply with the service classifications set by the AER, and the network pricing rule requirements of clause 6.18.1A (tariff structures statement) and 6.18.5 (pricing principles).
The scope of network services covered by this TSS includes:
standard control services; and
alternative control services.
It includes our assignment policy which is used to determine which tariff a customer will be eligible for. It does not cover our charging arrangements for network connection services, these are set out in detail in our Customer Connection Services Policy available on our website.
Below we outline the relevant Rules.
Tariff Structure Statement
5
1.2.1 National Electricity (NT) Rules (NT NER – the Rules)
A Tariff structure statement requirements
Clause 6.18.1 specifies that a TSS must include the following elements:
1. the tariff classes into which retail customers for direct control services will be divided during the relevant regulatory control period;
2. the policies and procedures the Distribution Network Service Provider will apply for assigning retail customers to tariffs or reassigning retail customers from one tariff to another (including any applicable restrictions);
3. the structures for each proposed tariff;
4. the charging parameters for each proposed tariff; and
5. a description of the approach that the Distribution Network Services Provider will take in setting each tariff in each pricing proposal of the Distribution Network Services Provider during the relevant regulatory control period.1
Our TSS is also governed by the following clauses in the Rules:
6.18.3 Tariff classes – discussed in section 4.1;
6.18.4 Principles governing assignment or re‐assignment of retail customers to tariff classes and assessment and review of basis of charging – discussed in section 4.2; and
6.18.5 Pricing principles – discussed below and in chapter 6.
B Pricing principles and objective requirements
The Rules also require that a TSS must comply with the network pricing objective and pricing principles for direct control services.2
Our tariff structures must support the following network pricing objective:
The tariffs that we charge for providing regulated network services to a retail customer should reflect our efficient costs of providing those services.
This objective is designed to support our customers’ long‐term interests. Research by the CSIRO and Energy Networks Australia shows that billions of dollars of energy infrastructure investment can be saved across Australia if we, as an energy network provider, get this right. It will also support our customers to make informed choices about how they source and use electricity as the energy sector transforms in the future, through new technologies and decarbonisation policies.
The pricing principles we must also adhere to may be summarised as:
1. Revenues from a given group of customers (called a tariff class) must be less than standalone cost and greater than avoidable cost.
2. Our tariffs must be based on long‐run marginal cost (LRMC).
3. Our tariffs must recover the efficient cost of servicing customers on that tariff, recover the revenue amount allowed by the Regulator, and ensure the manner of recovery doesn’t distort efficient customer use decisions.
4. We must consider the customer impact principle and transition.
1 NT NER 6.18.1(a). 2 NT NER 6.18.1(b).
Tariff Structure Statement
6
5. Our tariffs must be easy to understand for retail customers.
6. We must comply with all rules and regulations.3
We have developed our proposed tariffs to support the network pricing objective and comply with these pricing principles (as we explain further in chapter 6).
C Classification of distribution services
The standard control services and alternative control services covered in this TSS have been classified by the AER in its July 2017 Framework and Approach | Power and Water Corporation (NT) Regulatory control period commencing 1 July 2019 (the ‘framework and approach’).
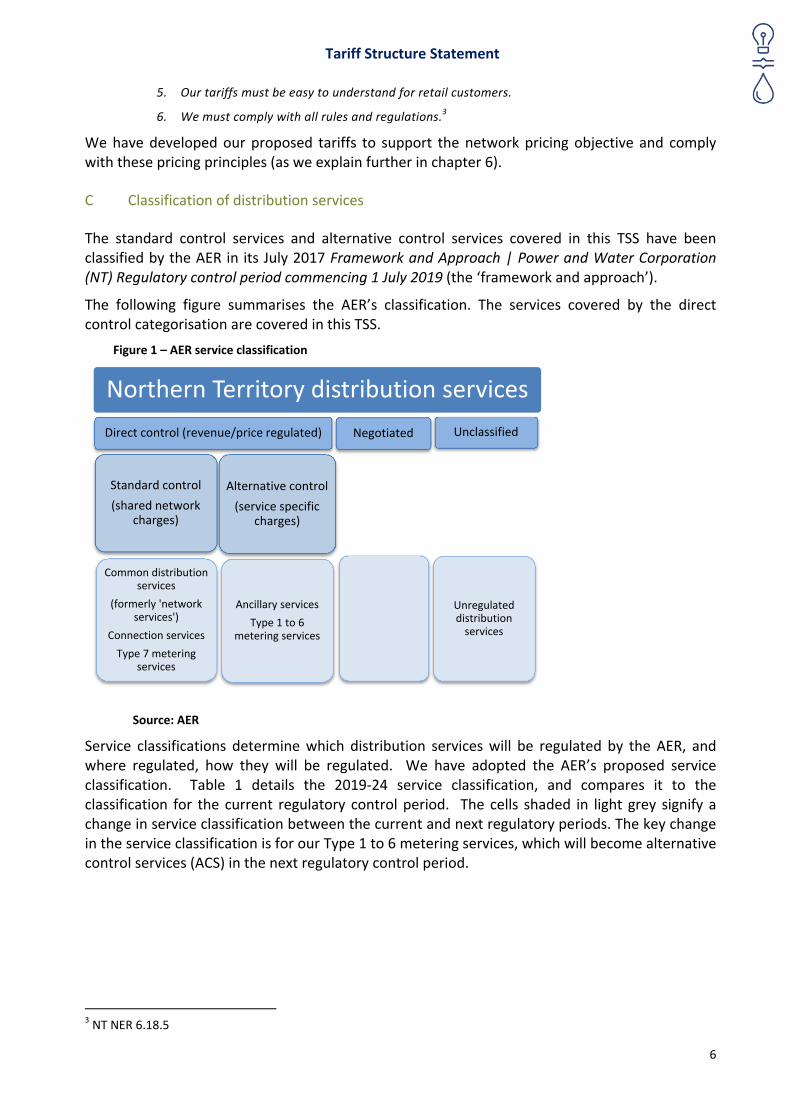
The following figure summarises the AER’s classification. The services covered by the direct control categorisation are covered in this TSS.
Figure 1 – AER service classification
Source: AER
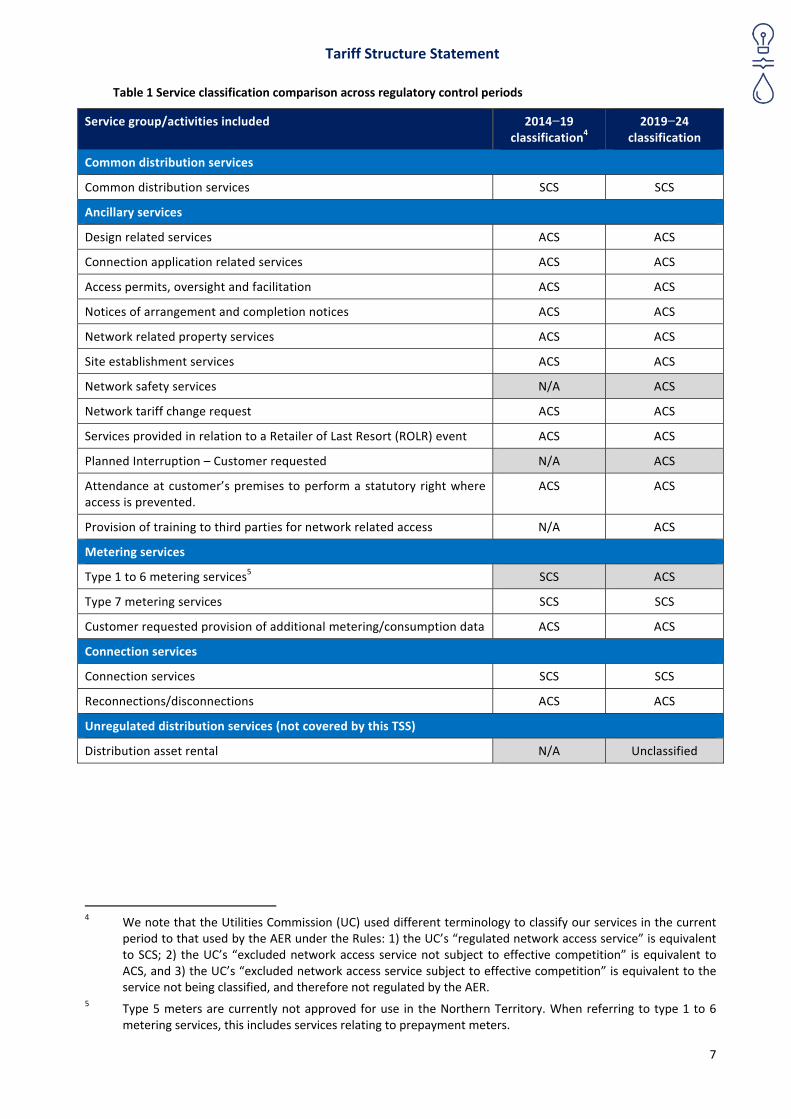
Service classifications determine which distribution services will be regulated by the AER, and where regulated, how they will be regulated. We have adopted the AER’s proposed service classification. Table 1 details the 2019‐24 service classification, and compares it to the classification for the current regulatory control period. The cells shaded in light grey signify a change in service classification between the current and next regulatory periods. The key change in the service classification is for our Type 1 to 6 metering services, which will become alternative control services (ACS) in the next regulatory control period.
3 NT NER 6.18.5
Northern Territory distribution services
Direct control (revenue/price regulated)
Standard control
(shared network charges)
Common distribution services
(formerly 'network services')
Connection services
Type 7 metering services
Alternative control
(service specific charges)
Ancillary services
Type 1 to 6 metering services
Negotiated Unclassified
Unregulated distribution services
Tariff Structure Statement
7
Table 1 Service classification comparison across regulatory control periods
Service group/activities included 2014−19 classification4
2019−24 classification
Common distribution services
Common distribution services SCS SCS
Ancillary services
Design related services ACS ACS
Connection application related services ACS ACS
Access permits, oversight and facilitation ACS ACS
Notices of arrangement and completion notices ACS ACS
Network related property services ACS ACS
Site establishment services ACS ACS
Network safety services N/A ACS
Network tariff change request ACS ACS
Services provided in relation to a Retailer of Last Resort (ROLR) event ACS ACS
Planned Interruption – Customer requested N/A ACS
Attendance at customer’s premises to perform a statutory right where access is prevented.
ACS ACS
Provision of training to third parties for network related access N/A ACS
Metering services
Type 1 to 6 metering services5 SCS ACS
Type 7 metering services SCS SCS
Customer requested provision of additional metering/consumption data ACS ACS
Connection services
Connection services SCS SCS
Reconnections/disconnections ACS ACS
Unregulated distribution services (not covered by this TSS)
Distribution asset rental N/A Unclassified
4 We note that the Utilities Commission (UC) used different terminology to classify our services in the current
period to that used by the AER under the Rules: 1) the UC’s “regulated network access service” is equivalent to SCS; 2) the UC’s “excluded network access service not subject to effective competition” is equivalent to ACS, and 3) the UC’s “excluded network access service subject to effective competition” is equivalent to the service not being classified, and therefore not regulated by the AER.
5 Type 5 meters are currently not approved for use in the Northern Territory. When referring to type 1 to 6 metering services, this includes services relating to prepayment meters.
Tariff Structure Statement
8
1.3 Structure of this TSS
We have structured this TSS as follows:
Chapter 2 explains who we are and the aspects of our operating environment that are relevant to pricing design and customer impacts.
Chapter 3 summarises the customer and stakeholder research and engagement we have undertaken to inform this TSS.
Chapter 4 outlines the tariff classes for our common distribution services and our approach to assigning customers to tariffs.
Chapter 5 explains our tariff charging parameters and tariff structures.
Chapter 6 describes how we have designed our new tariffs structures to comply with the network pricing principles.
Chapter 7 details our alternative control services.
Attachment 1 provides our indicative tariff schedule for standard control services and alternative control services.
2 About Power and Water
This chapter explains who we are and the key features of our NT operating environment that are relevant to our decisions for setting network tariffs.
2.1 Power and Water
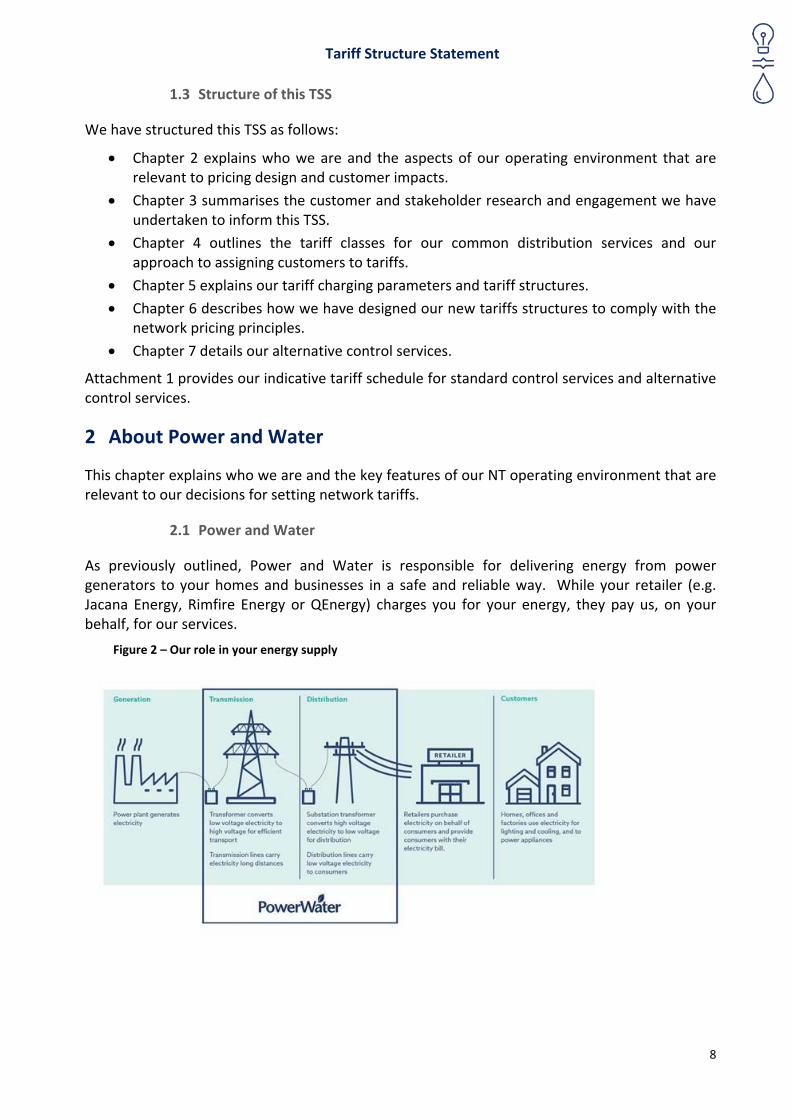
As previously outlined, Power and Water is responsible for delivering energy from power generators to your homes and businesses in a safe and reliable way. While your retailer (e.g. Jacana Energy, Rimfire Energy or QEnergy) charges you for your energy, they pay us, on your behalf, for our services.
Figure 2 – Our role in your energy supply
Tariff Structure Statement
9
2.2 NT market changes
The NT energy market in which we operate is changing, including:
How our customers are sourcing and using energy, and the technologies that they are seeking to connect to our grid, with growth in solar installations and falling prices for batteries and electric vehicles.
The introduction of Full Retail Contestability and the structural separation of Power and Water from other parts of the supply chain shown in Figure 2 above.
The introduction of a wholesale electricity market.
Transition of network regulation to the national regulatory framework, which includes how network prices and services are set and the arrangements for connecting customers to our grid.
The increased requirement of the national regulatory framework to transition network tariffs to cost reflective structures, reflecting the drivers of our network costs and price levels that encourage efficient use of our grid.
In light of these changes, we are required to modify our network tariffs to better meet the regulated network pricing objective. As noted in section 1.2.1, this objective requires that the tariffs we charge for providing regulated services to a retail customer (via their retailer) should reflect the efficient costs of providing those services.6
2.3 Customer retail pricing protections
While this TSS covers tariffs applying to all our customers, not all of our customers will be directly affected by our network tariffs.
We have designed our TSS to consider customer pricing impacts. A key determinant of customer impacts is the Pricing Order, which presently:
inhibits the use of cost reflective network tariffs for smaller customers by fixing their retail electricity rates; and
does not address the separation of type 1‐6 metering charges from standard network tariffs as required by the AER’s framework and approach paper.
The Pricing Order gives rise to two distinct types of customers for the purposes of tariff design, customer engagement and customer impact assessment:
1. Customers who use <750MWh per year – these are most of our 85,000 customers, and comprise households and small to medium businesses. These customer groups are currently subject to retail pricing protection through the Pricing Order. This regulates the retail prices for these customer groups. Therefore, the impact of the AER’s decision on our tariffs will not directly affect their retail electricity bills, as our network tariffs are not currently listed as a separate line item on their bill. It will similarly, have limited effect on retailers because Jacana Energy hold the largest customer share by a significant margin. This means any tariff rebalancing we perform will largely net out at the level of our total bill to Jacana Energy.
6 National Electricity Rules, Network pricing objective in rule 6.18.5(a).
Tariff Structure Statement
10
2. Customers who use >750MWh per year – These are our 200 largest energy users. They see our network tariffs as a separate charge on their retail bill and the impact of the AER’s decision on our TSS will directly affect this customer group.
2.4 NT electricity meter fleet
We presently have a diverse range of meter types in the NT, with most being accumulation meters not capable of supporting cost reflective network tariffs or customers choosing to move onto an alternative retail tariff option. We have been rolling out suitable advanced metering to all customers that use more than 40 MWh per year in the current regulatory period within the total expenditure forecasts approved by the Utilities Commission (UC). We plan to expand this to all new and replacement customer meters installed from July 2019.
2.5 Our demand and customer characteristics
2.5.1 Our demand over the coming regulatory control period
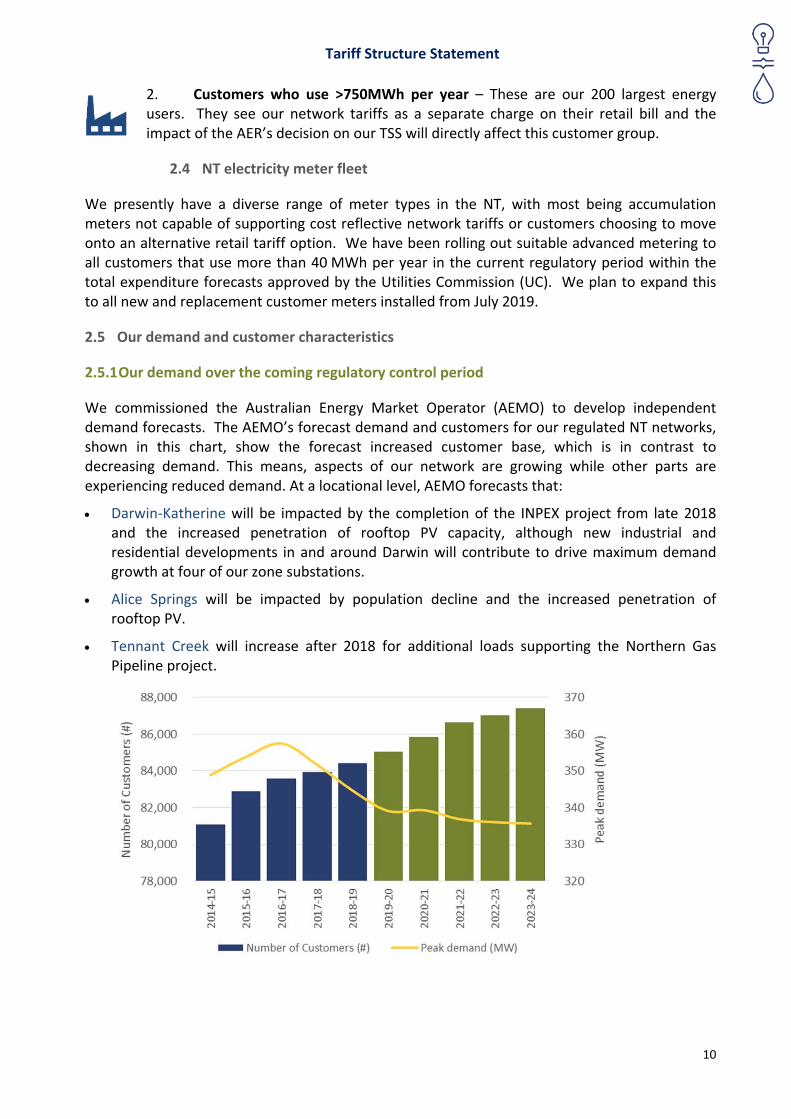
We commissioned the Australian Energy Market Operator (AEMO) to develop independent demand forecasts. The AEMO’s forecast demand and customers for our regulated NT networks, shown in this chart, show the forecast increased customer base, which is in contrast to decreasing demand. This means, aspects of our network are growing while other parts are experiencing reduced demand. At a locational level, AEMO forecasts that:
Darwin‐Katherine will be impacted by the completion of the INPEX project from late 2018 and the increased penetration of rooftop PV capacity, although new industrial and residential developments in and around Darwin will contribute to drive maximum demand growth at four of our zone substations.
Alice Springs will be impacted by population decline and the increased penetration of rooftop PV.
Tennant Creek will increase after 2018 for additional loads supporting the Northern Gas Pipeline project.
Tariff Structure Statement
11
2.5.2 Our customers and load patterns
The NT’s vast expanse stretches from the tropical savannah in the far north to the deserts of Central Australia. While we have the largest service area of any distribution network, we service the smallest customer base by far in Australia’s National Electricity Market (NEM).
Relevantly to efficient tariff design, we have among the highest per customer energy use in the NEM, and an equivalent of the summer‐peaking system demand when our customers are all cooling their homes and businesses during the wet season/summer months.
We must set prices in recognition of our customers and their demand characteristics:
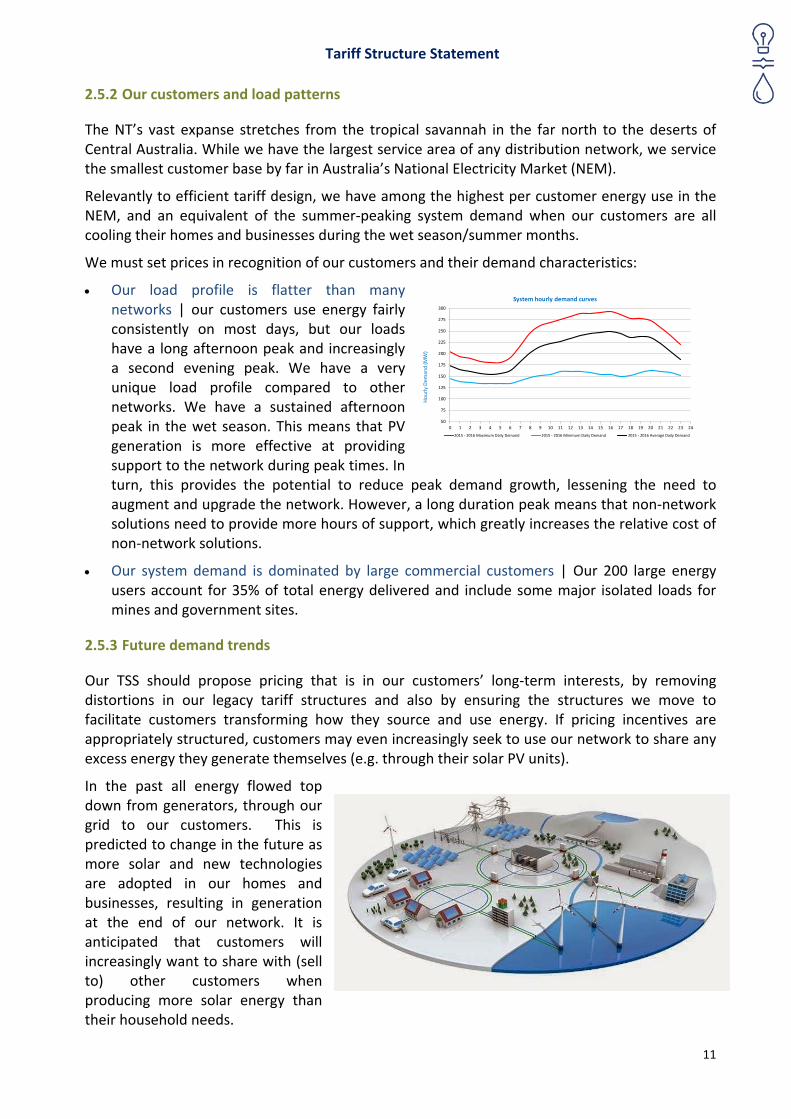
Our load profile is flatter than many networks | our customers use energy fairly consistently on most days, but our loads have a long afternoon peak and increasingly a second evening peak. We have a very unique load profile compared to other networks. We have a sustained afternoon peak in the wet season. This means that PV generation is more effective at providing support to the network during peak times. In turn, this provides the potential to reduce peak demand growth, lessening the need to augment and upgrade the network. However, a long duration peak means that non‐network solutions need to provide more hours of support, which greatly increases the relative cost of non‐network solutions.
Our system demand is dominated by large commercial customers | Our 200 large energy users account for 35% of total energy delivered and include some major isolated loads for mines and government sites.
2.5.3 Future demand trends
Our TSS should propose pricing that is in our customers’ long‐term interests, by removing distortions in our legacy tariff structures and also by ensuring the structures we move to facilitate customers transforming how they source and use energy. If pricing incentives are appropriately structured, customers may even increasingly seek to use our network to share any excess energy they generate themselves (e.g. through their solar PV units).
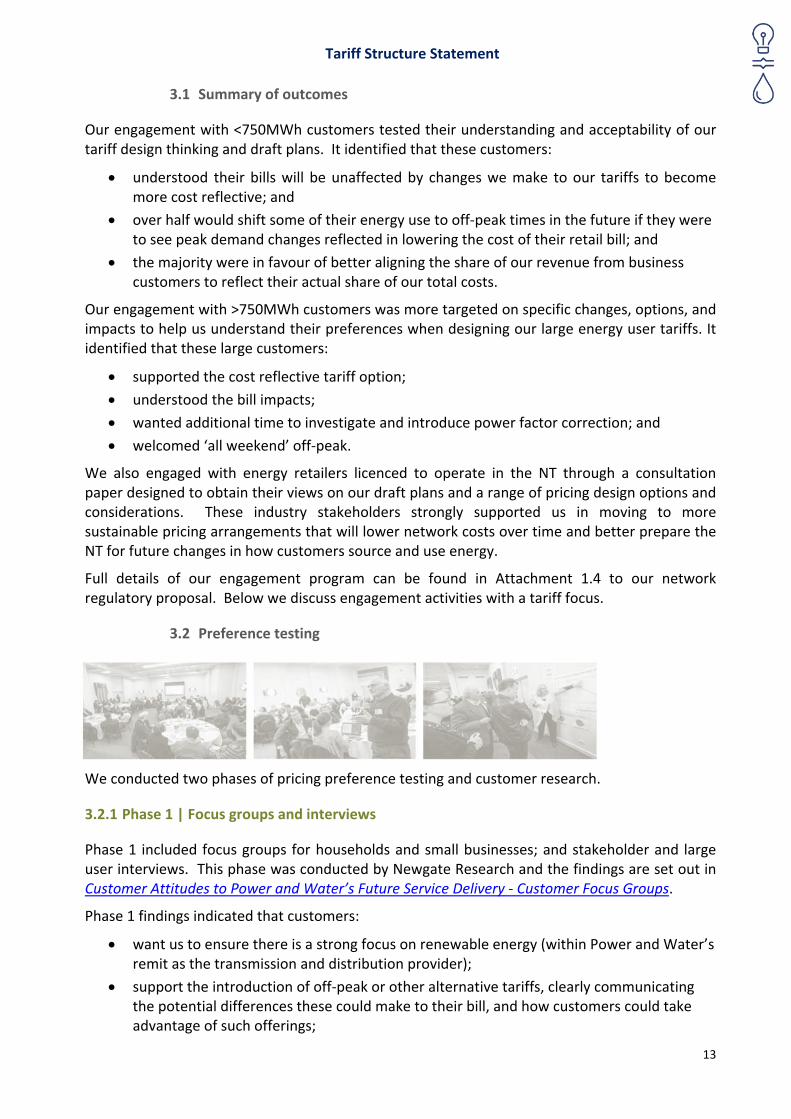
In the past all energy flowed top down from generators, through our grid to our customers. This is predicted to change in the future as more solar and new technologies are adopted in our homes and businesses, resulting in generation at the end of our network. It is anticipated that customers will increasingly want to share with (sell to) other customers when producing more solar energy than their household needs.
50
75
100
125
150
175
200
225
250
275
300
0 1 2 3 4 5 6 7 8 9 10 11 12 13 14 15 16 17 18 19 20 21 22 23 24Hourly Dem
and (M
W)
System hourly demand curves
2015 ‐ 2016 Maximum Daily Demand 2015 ‐ 2016 Minimum Daily Demand 2015 ‐ 2016 Average Daily Demand
Tariff Structure Statement
12
Decisions we make today will be pivotal in how the network can support:
changing consumer behaviours and expectations;
technology improvements;
our customers’ increasing commitment to renewables and response to climate change (in line with feedback we have received during our engagement forums); and
delivery of a better future for our customers.
These decisions include both:
Our investment and network design strategy for the future, which includes:
o responding to customer feedback by facilitating the connection of renewables;
o adopting smart meters as our new and replacement meters going forward, to facilitate access to new energy products like in‐home automation, and time of use and demand tariffs; and
o finding ways to configure our system that let customers share their excess energy with others via our grid.
Our TSS pricing strategy will:
o have peak demand charges and free off‐peak demand tariffs for all users who have a smart meter;
o remove distorting signals from our legacy, declining block demand tariffs; and
o move unmetered supply tariffs to demand‐based charges.
At the end of this regulatory control period, we will have increased the number of smart meters and be able to realise the benefit of more interval and demand data. This facilitates tariff refinements that better support our customers’ long‐term interests.
3 Our customer and stakeholder engagement
This chapter explains our customer and stakeholder engagement and research which has informed this TSS.
We have engaged extensively with our customers and stakeholders to develop this, our first TSS. This program included customer focus groups, research forums, in‐depth interviews, the establishment of our Customer Advisory Council, consultation papers and direct consultation with retailers and other major stakeholders.
Our engagement has focussed on the two distinct classes of retail customers with differing tariff impacts under the Pricing Order:
customers who use <750MWh per year (<750MWh customers); and
customers who use >750MWh per year (>750MWh customers).
The fundamental difference in how our tariffs will affect the two distinct customer groups over the 2019‐24 regulatory control period (due to the Pricing Order) has driven the need to design our engagement program and research questions accordingly.
Tariff Structure Statement
13
3.1 Summary of outcomes
Our engagement with <750MWh customers tested their understanding and acceptability of our tariff design thinking and draft plans. It identified that these customers:
understood their bills will be unaffected by changes we make to our tariffs to become more cost reflective; and
over half would shift some of their energy use to off‐peak times in the future if they were to see peak demand changes reflected in lowering the cost of their retail bill; and
the majority were in favour of better aligning the share of our revenue from business customers to reflect their actual share of our total costs.
Our engagement with >750MWh customers was more targeted on specific changes, options, and impacts to help us understand their preferences when designing our large energy user tariffs. It identified that these large customers:
supported the cost reflective tariff option;
understood the bill impacts;
wanted additional time to investigate and introduce power factor correction; and
welcomed ‘all weekend’ off‐peak.
We also engaged with energy retailers licenced to operate in the NT through a consultation paper designed to obtain their views on our draft plans and a range of pricing design options and considerations. These industry stakeholders strongly supported us in moving to more sustainable pricing arrangements that will lower network costs over time and better prepare the NT for future changes in how customers source and use energy.
Full details of our engagement program can be found in Attachment 1.4 to our network regulatory proposal. Below we discuss engagement activities with a tariff focus.
3.2 Preference testing
We conducted two phases of pricing preference testing and customer research.
3.2.1 Phase 1 | Focus groups and interviews
Phase 1 included focus groups for households and small businesses; and stakeholder and large user interviews. This phase was conducted by Newgate Research and the findings are set out in Customer Attitudes to Power and Water’s Future Service Delivery ‐ Customer Focus Groups.
Phase 1 findings indicated that customers:
want us to ensure there is a strong focus on renewable energy (within Power and Water’s remit as the transmission and distribution provider);
support the introduction of off‐peak or other alternative tariffs, clearly communicating the potential differences these could make to their bill, and how customers could take advantage of such offerings;
Tariff Structure Statement
14
offered little support for a seasonal energy tariff, though many were open to daily time of use charging. There was also support for behaviour change initiatives to encourage people to save money and reduce environmental impacts; and
did not support receiving separate retail bills and network services bills.
3.2.2 Phase 2 | Deliberative forums
We held two deliberative forums – one in Darwin and one in Alice Springs. These provided customers with information about key elements and options Power and Water was considering for its five‐year plan and this TSS, seeking to explore and understand their views and preferences on these issues and options.
Newgate Research also conducted this phase and the findings are set out in Power and Water’s Future Service Delivery ‐ Customer Deliberative Forums.
The TSS and pricing‐related issues covered included:
cost‐reflectivity in pricing and demand charging;
cross‐subsidisation from residential to non‐residential customers; and
smart metering roll‐out.
The research findings from the deliberative forums were:
acceptability of demand charging: customers were somewhat split, but were more likely to find the principle acceptable with 45% rating it 7 or above out of 10 (with 10 being completely acceptable) and an average rating of 5.7;
impact of the pricing order: typically well‐understood, once customers were informed about it during the forums with 88% stating they understood impacts;
shifting energy usage: most customers felt they would probably or definitely shift their energy usage if it meant lower bills;
rebalancing the revenue share we recover from businesses compared to households: most customers were in favour of our proposal, with 57% giving it a high acceptability score of 7 or more out of 10; and
interest in smart meters: customers were very interested once the benefits were understood, and supported the planned roll‐out. Almost three quarters (73%) of participants found the proposal to roll out smart meters to all new customers to be completely acceptable (scoring a10 out of 10).
3.2.3 Phase 2 | Large energy users forum
We held a large energy users forum in Darwin on 12 October 2017 with >750MWh customers. The forum focused on the proposed tariff structures and the associated impact of each option for customers within this class.
This forum was a crucial element of the engagement process as this customer class represents approximately 35% of the total network load and is the only customer class not protected by the Pricing Order. These customers see our actual network charges displayed separately on their bill.
A large sample of the >750MWh customers were invited, with a focus on ensuring we captured those who would be most affected by the tariff changes. 17 participants attended the forum, representing 30 sites or 15% of the large user sites across the NT. These participants account for
Tariff Structure Statement
15
approximately 38% of total consumption within the >750MWh customer class and rated the forum 8.3 out of 10.
The forum identified that these large customers:
supported the cost reflective option: more than half of these customers favoured our “Fully Cost Reflective” tariff option as their first preference. This option removes the declining block in our energy charges and demand charges and adds a charge for customers with a poor power factor;
understood impacts: half understood their bill impacts and the other half partially understood these, noting they needed to understand the delivered retail impact from their retailer;
wanted time to correct their power factors: some customers requested more time to prepare for the introduction of poor power factor surcharges, asking that these are introduced later in the regulatory period to allow time to design and budget for their power factor correction solutions; and
welcomed weekend off‐peak: customers supported us aligning with the retailer treatment of all weekend as ‘off‐peak’.
3.3 Consulting on tariff design and our draft plan
3.3.1 Pricing consultation with electricity industry stakeholders
In June 2017 we invited comment and feedback on our initial tariff strategy considerations and options from system participants (retailers and generators), as well two NT Government Departments, the UC and the Department of Treasury and Finance. The paper was also shared with the AER to gain its feedback.
The paper was not made more widely available as it was designed to gain an understanding of the views and opinions of the various system participants, as well as the Government’s views to further refine our proposed tariff structures as the Pricing Order is protecting the majority of consumers in the NT.
We received one submission from Jacana Energy and had several follow‐up meetings with stakeholders who did not formally respond.
3.3.2 Public pricing consultation on draft pricing plans
In November 2017, we published a draft customer overview of this TSS after testing it with our Customer Advisory Council (CAC) at the October meeting and the AER’s Customer Challenge Panel (CCP). The paper invited all customers across the NT to provide feedback on our draft TSS overview. This was the second paper distributed for comment in this engagement process and unlike the previous paper, this was aimed at all Territorians.
Tariff Structure Statement
16
This paper was placed on our website and sent directly to:
CAC members;
CCP members;
AER;
UC;
Department of Treasury and Finance;
market participants (retailers and generators); and
large energy users (>750MWh customers).
At the third CAC meeting, members provided feedback on the paper, noted their support for the planned tariff changes and made the following observations:
within the Pricing Order protections framework, and with 88% of customers saying they understood they won’t be affected, it makes sense to move all customers with suitable metering to a cost reflective tariff immediately; and
it will be important that we highlight in this TSS (and its overview) that there is no impact for most customers due to the Pricing Order.
Retailer Jacana Energy made a submission supporting our proposal to introduce more efficient network tariffs, noting that smart meters should be deployed to further support these reforms, and changes to the Pricing Order may be needed to help fully realise the long‐term benefits of network tariff reform through customer behavioral change.
4 Network tariff classes and tariff assignment
This chapter explains the customer groupings (tariff classes) we use for assigning customers to tariffs, as well as the eligibility criteria and assessment process for tariff assignment.
4.1 Proposed network tariff classes for standard control services
We have kept the number of tariff classes to a minimum, to avoid unnecessary transaction costs. In addition, customers have been efficiently grouped together, recognising the material differences between customers arising from:
the pattern and level of network usage as between residential and non‐residential customers, which have different usage patterns and average consumption; and
the nature of the plant or equipment required to provide the network access service, in the case of the HV tariff class, as these customers do not make use of the low voltage network or distribution substations.
Tariff Structure Statement
17
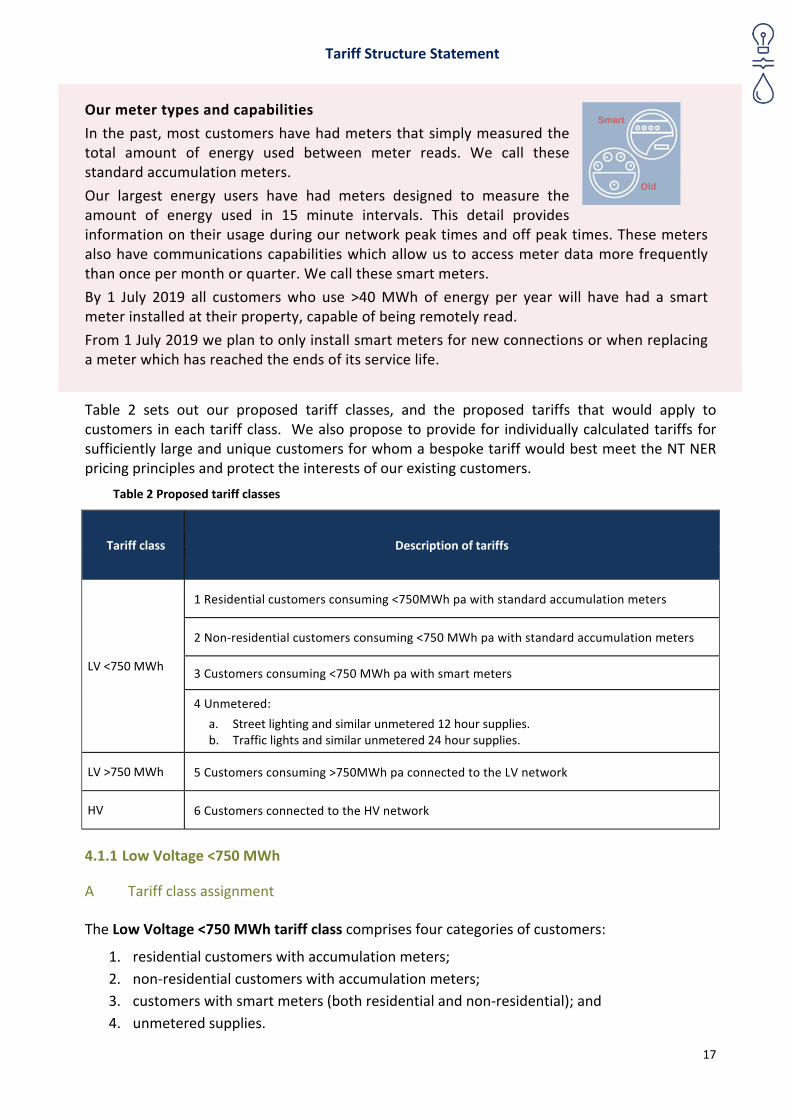
Our meter types and capabilities
In the past, most customers have had meters that simply measured the total amount of energy used between meter reads. We call these standard accumulation meters.
Our largest energy users have had meters designed to measure the amount of energy used in 15 minute intervals. This detail provides information on their usage during our network peak times and off peak times. These meters also have communications capabilities which allow us to access meter data more frequently than once per month or quarter. We call these smart meters.
By 1 July 2019 all customers who use >40 MWh of energy per year will have had a smart meter installed at their property, capable of being remotely read.
From 1 July 2019 we plan to only install smart meters for new connections or when replacing a meter which has reached the ends of its service life.
Table 2 sets out our proposed tariff classes, and the proposed tariffs that would apply to customers in each tariff class. We also propose to provide for individually calculated tariffs for sufficiently large and unique customers for whom a bespoke tariff would best meet the NT NER pricing principles and protect the interests of our existing customers.
Table 2 Proposed tariff classes
Tariff class Description of tariffs
LV <750 MWh
1 Residential customers consuming <750MWh pa with standard accumulation meters
2 Non‐residential customers consuming <750 MWh pa with standard accumulation meters
3 Customers consuming <750 MWh pa with smart meters
4 Unmetered:
a. Street lighting and similar unmetered 12 hour supplies. b. Traffic lights and similar unmetered 24 hour supplies.
LV >750 MWh 5 Customers consuming >750MWh pa connected to the LV network
HV 6 Customers connected to the HV network
4.1.1 Low Voltage <750 MWh
A Tariff class assignment
The Low Voltage <750 MWh tariff class comprises four categories of customers:
1. residential customers with accumulation meters;
2. non‐residential customers with accumulation meters;
3. customers with smart meters (both residential and non‐residential); and
4. unmetered supplies.
Smart
Old
Tariff Structure Statement
18
B Tariff eligibility
Tariff 1 | The residential tariff, applies to customers supplied at a connection point where:
total electricity consumption, per financial year, is <750MWh;
electricity is supplied at a voltage level defined as low voltage – nominally 230/400 V;
the customer is connected to the LV network via an accumulation meter; and
the premises is intended to be used primarily for residential purposes, excluding serviced apartments, but including:
o electricity used on vacant land zoned for residential (domestic) purposes; and
o living premises in retirement villages, which must be separately metered.
Tariff 2 | The non‐residential tariff is applied to customers where:
total electricity consumption, per financial year, is <750MWh;
electricity is supplied at a voltage level defined as low voltage – nominally 230/400 V;
the customer is connected to the LV network via an accumulation meter; and
the premises is intended to be used for non‐residential purposes, including:
o electricity used on vacant land zoned for commercial purposes;
o temporary supply (i.e. for construction purposes);
o motels, hotels, serviced apartments and any form of temporary accommodation;
o shops, offices, warehouses and industrial/manufacturing plants;
o mining enterprises; and
o farms.
Tariff 3 | The LV smart meter tariff is applied to customers where:
total electricity consumption, per financial year, is <750MWh;
electricity is supplied at a voltage level defined as low voltage – nominally 230/400 V; and
the customer is connected to the LV network via a smart meter.
There is no differentiation within this category in relation to the customer’s end use.
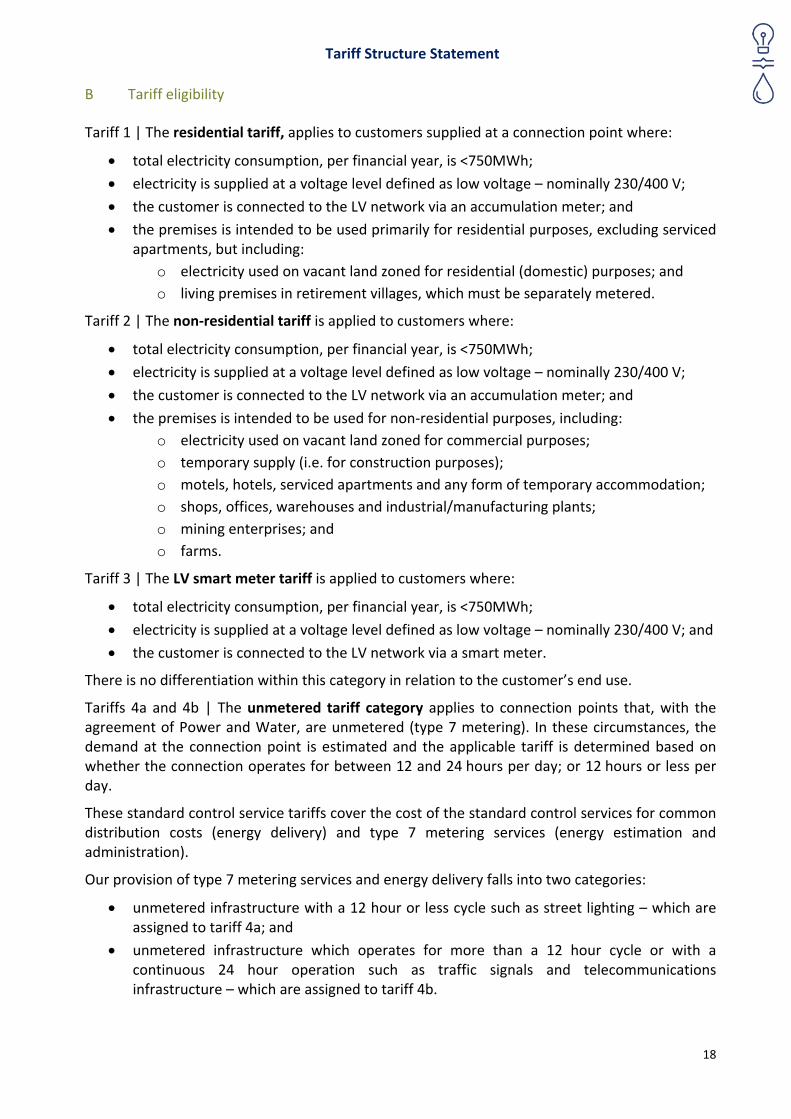
Tariffs 4a and 4b | The unmetered tariff category applies to connection points that, with the agreement of Power and Water, are unmetered (type 7 metering). In these circumstances, the demand at the connection point is estimated and the applicable tariff is determined based on whether the connection operates for between 12 and 24 hours per day; or 12 hours or less per day.
These standard control service tariffs cover the cost of the standard control services for common distribution costs (energy delivery) and type 7 metering services (energy estimation and administration).
Our provision of type 7 metering services and energy delivery falls into two categories:
unmetered infrastructure with a 12 hour or less cycle such as street lighting – which are assigned to tariff 4a; and
unmetered infrastructure which operates for more than a 12 hour cycle or with a continuous 24 hour operation such as traffic signals and telecommunications infrastructure – which are assigned to tariff 4b.
Tariff Structure Statement
19
The tariff for these customers is being simplified in this TSS. In the current 2014‐19 regulatory control period, we applied a kWh energy charge for these connections based on an assumed consumption based on wattage rating and hours of operation. In this TSS we have altered the tariff structure from the energy based charge to a demand charge ($/W) based on the wattage rating of the installation. This change simplifies our administration of the charges and aligns with the retail tariff structure set out in the Pricing Order. The revenue raised from unmetered infrastructure remains largely unchanged as a result of changing the charging parameter.
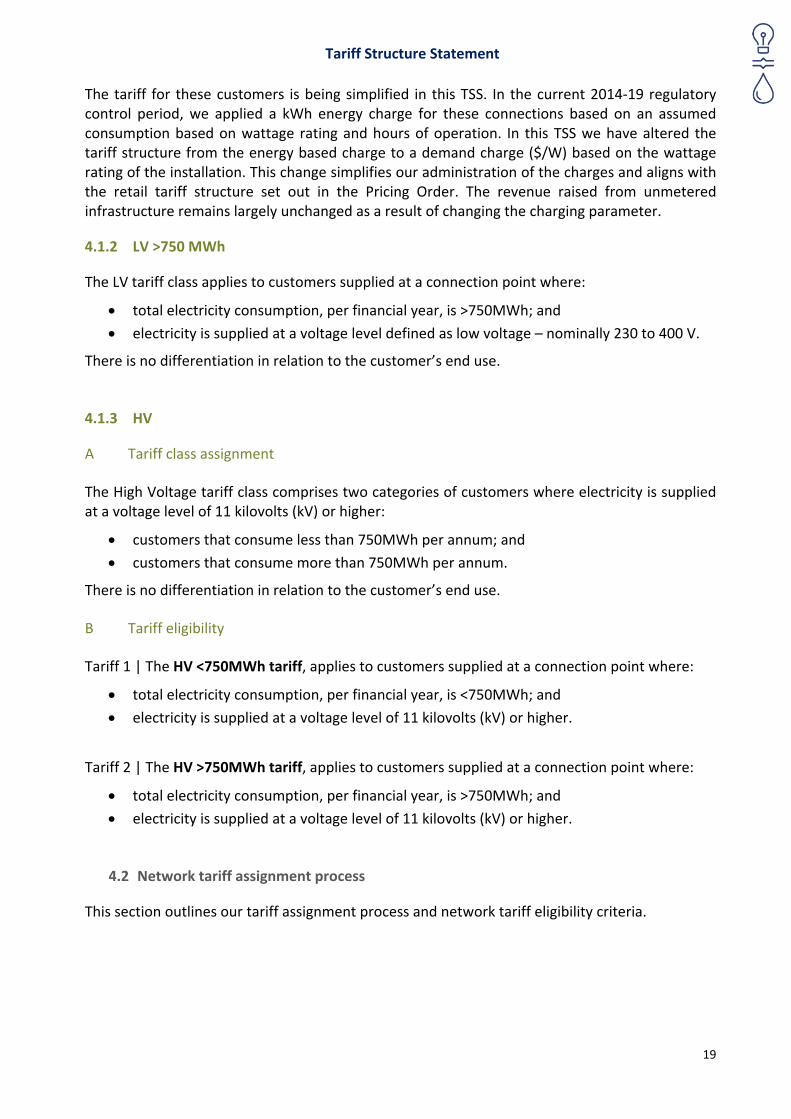
4.1.2 LV >750 MWh
The LV tariff class applies to customers supplied at a connection point where:
total electricity consumption, per financial year, is >750MWh; and
electricity is supplied at a voltage level defined as low voltage – nominally 230 to 400 V.
There is no differentiation in relation to the customer’s end use.
4.1.3 HV
A Tariff class assignment
The High Voltage tariff class comprises two categories of customers where electricity is supplied at a voltage level of 11 kilovolts (kV) or higher:
customers that consume less than 750MWh per annum; and
customers that consume more than 750MWh per annum.
There is no differentiation in relation to the customer’s end use.
B Tariff eligibility
Tariff 1 | The HV <750MWh tariff, applies to customers supplied at a connection point where:
total electricity consumption, per financial year, is <750MWh; and
electricity is supplied at a voltage level of 11 kilovolts (kV) or higher.
Tariff 2 | The HV >750MWh tariff, applies to customers supplied at a connection point where:
total electricity consumption, per financial year, is >750MWh; and
electricity is supplied at a voltage level of 11 kilovolts (kV) or higher.
4.2 Network tariff assignment process
This section outlines our tariff assignment process and network tariff eligibility criteria.
Tariff Structure Statement
20
4.2.1 Assignment and reassignment procedures
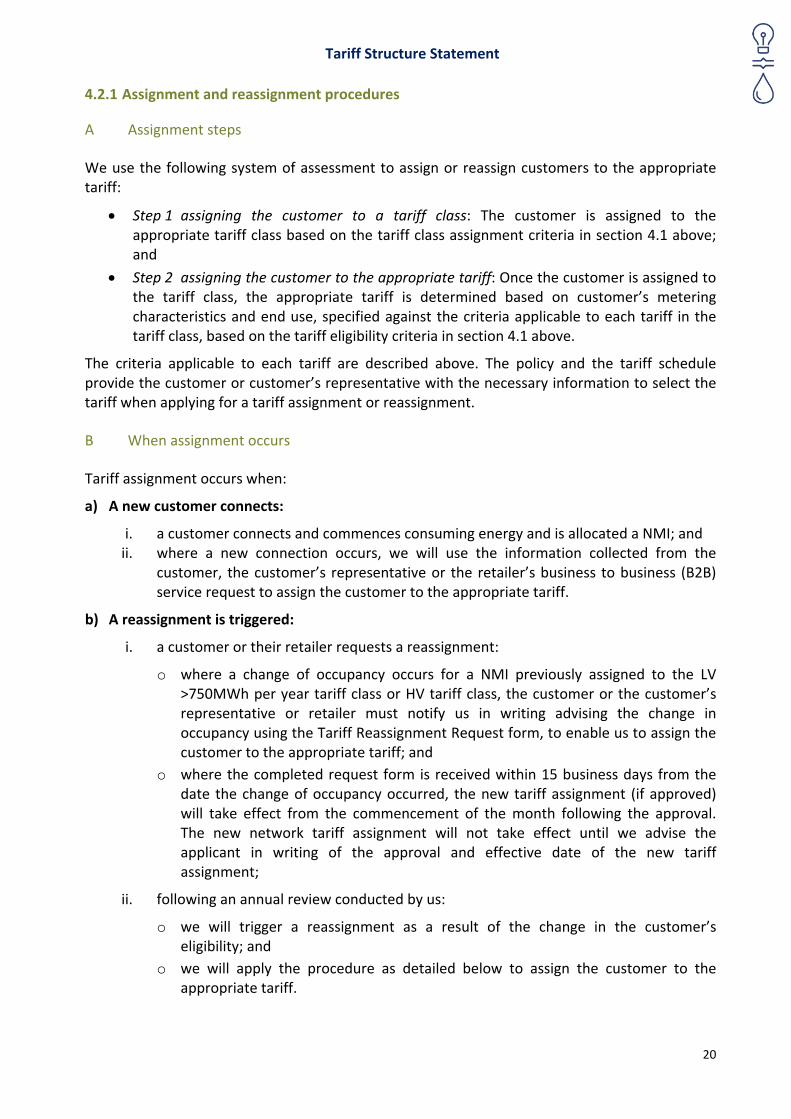
A Assignment steps
We use the following system of assessment to assign or reassign customers to the appropriate tariff:
Step 1 assigning the customer to a tariff class: The customer is assigned to the appropriate tariff class based on the tariff class assignment criteria in section 4.1 above; and
Step 2 assigning the customer to the appropriate tariff: Once the customer is assigned to the tariff class, the appropriate tariff is determined based on customer’s metering characteristics and end use, specified against the criteria applicable to each tariff in the tariff class, based on the tariff eligibility criteria in section 4.1 above.
The criteria applicable to each tariff are described above. The policy and the tariff schedule provide the customer or customer’s representative with the necessary information to select the tariff when applying for a tariff assignment or reassignment.
B When assignment occurs
Tariff assignment occurs when:
a) A new customer connects:
i. a customer connects and commences consuming energy and is allocated a NMI; and ii. where a new connection occurs, we will use the information collected from the
customer, the customer’s representative or the retailer’s business to business (B2B) service request to assign the customer to the appropriate tariff.
b) A reassignment is triggered:
i. a customer or their retailer requests a reassignment:
o where a change of occupancy occurs for a NMI previously assigned to the LV >750MWh per year tariff class or HV tariff class, the customer or the customer’s representative or retailer must notify us in writing advising the change in occupancy using the Tariff Reassignment Request form, to enable us to assign the customer to the appropriate tariff; and
o where the completed request form is received within 15 business days from the date the change of occupancy occurred, the new tariff assignment (if approved) will take effect from the commencement of the month following the approval. The new network tariff assignment will not take effect until we advise the applicant in writing of the approval and effective date of the new tariff assignment;
ii. following an annual review conducted by us:
o we will trigger a reassignment as a result of the change in the customer’s eligibility; and
o we will apply the procedure as detailed below to assign the customer to the appropriate tariff.
Tariff Structure Statement
21
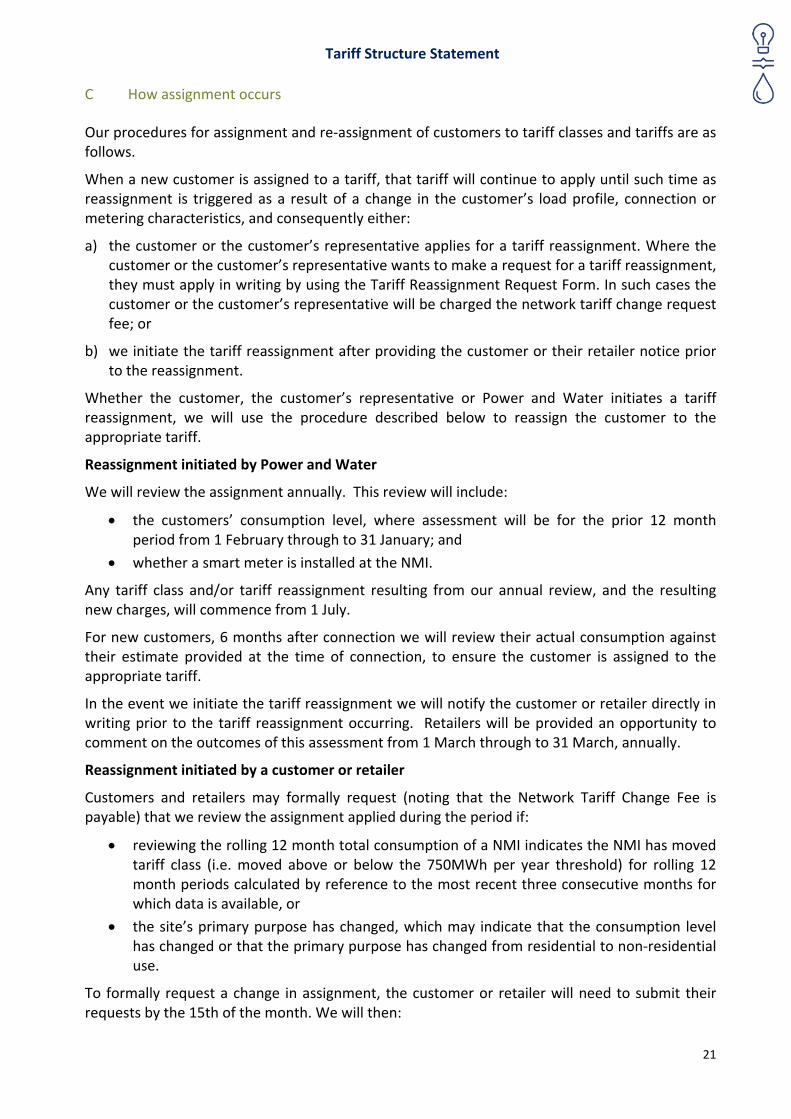
C How assignment occurs
Our procedures for assignment and re‐assignment of customers to tariff classes and tariffs are as follows.
When a new customer is assigned to a tariff, that tariff will continue to apply until such time as reassignment is triggered as a result of a change in the customer’s load profile, connection or metering characteristics, and consequently either:
a) the customer or the customer’s representative applies for a tariff reassignment. Where the customer or the customer’s representative wants to make a request for a tariff reassignment, they must apply in writing by using the Tariff Reassignment Request Form. In such cases the customer or the customer’s representative will be charged the network tariff change request fee; or
b) we initiate the tariff reassignment after providing the customer or their retailer notice prior to the reassignment.
Whether the customer, the customer’s representative or Power and Water initiates a tariff reassignment, we will use the procedure described below to reassign the customer to the appropriate tariff.
Reassignment initiated by Power and Water
We will review the assignment annually. This review will include:
the customers’ consumption level, where assessment will be for the prior 12 month period from 1 February through to 31 January; and
whether a smart meter is installed at the NMI.
Any tariff class and/or tariff reassignment resulting from our annual review, and the resulting new charges, will commence from 1 July.
For new customers, 6 months after connection we will review their actual consumption against their estimate provided at the time of connection, to ensure the customer is assigned to the appropriate tariff.
In the event we initiate the tariff reassignment we will notify the customer or retailer directly in writing prior to the tariff reassignment occurring. Retailers will be provided an opportunity to comment on the outcomes of this assessment from 1 March through to 31 March, annually.
Reassignment initiated by a customer or retailer
Customers and retailers may formally request (noting that the Network Tariff Change Fee is payable) that we review the assignment applied during the period if:
reviewing the rolling 12 month total consumption of a NMI indicates the NMI has moved tariff class (i.e. moved above or below the 750MWh per year threshold) for rolling 12 month periods calculated by reference to the most recent three consecutive months for which data is available, or
the site’s primary purpose has changed, which may indicate that the consumption level has changed or that the primary purpose has changed from residential to non‐residential use.
To formally request a change in assignment, the customer or retailer will need to submit their requests by the 15th of the month. We will then:
Tariff Structure Statement
22
advise the customer or retailer of their acceptance or rejection in writing by the 25th of the month; and
change the assignment from the next billing period after month end.
In the event the applicant initiates the tariff reassignment, we will notify the applicant in writing advising the outcome of the application. Where the application is not approved, we will advise the applicant of the reasons.
Where the applicant is someone other than the customer or customer’s retailer, the applicant will be required to obtain authorisation from the customer to deal with us on their behalf. The applicant will also take responsibility of communicating the outcome of the tariff reassignment to the customer or retailer.
5 Network tariff structures and charging parameters
This chapter explains the different types of charges (charging parameters) we apply and how we adopt different combinations to create the tariff structures within each tariff class.
5.1 Charging parameters
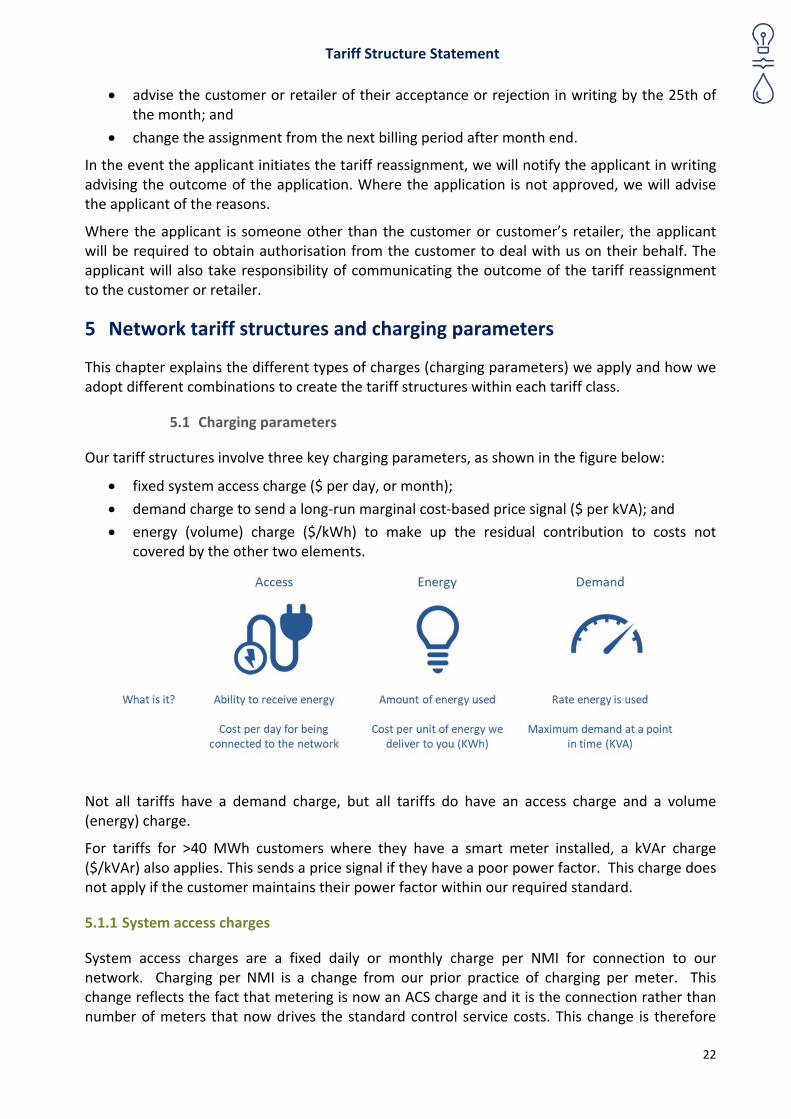
Our tariff structures involve three key charging parameters, as shown in the figure below:
fixed system access charge ($ per day, or month);
demand charge to send a long‐run marginal cost‐based price signal ($ per kVA); and
energy (volume) charge ($/kWh) to make up the residual contribution to costs not covered by the other two elements.
Not all tariffs have a demand charge, but all tariffs do have an access charge and a volume (energy) charge.
For tariffs for >40 MWh customers where they have a smart meter installed, a kVAr charge ($/kVAr) also applies. This sends a price signal if they have a poor power factor. This charge does not apply if the customer maintains their power factor within our required standard.
5.1.1 System access charges
System access charges are a fixed daily or monthly charge per NMI for connection to our network. Charging per NMI is a change from our prior practice of charging per meter. This change reflects the fact that metering is now an ACS charge and it is the connection rather than number of meters that now drives the standard control service costs. This change is therefore
Tariff Structure Statement
23
necessary to reflect the new AER service classification as we transition to the Rules administered by the AER.
5.1.2 Demand charges
Our demand charges are based on the time of use and the actual demand. They are measured as maximum kVA per month in the peak window (12:00‐21:00). We will no longer have any demand charges in the off‐peak window. Demand charges only apply to customers with meters capable of measuring demand. For customers on the LV smart meter tariff, the peak period will be seasonal and only apply between 1 October and 31 March with the rest of the year being off peak.
This is our current approach to demand measurement and the only approach our current billing system supports. Our June 2017 industry participant consultation paper consulted on other demand measurement options. Jacana Energy’s submission noted that using maximum demand in the peak period was preferable and was the only submission providing comment on this issue.
5.1.3 Volume charges
For customers on the residential tariff or non‐residential tariff (Tariff 1 or Tariff 2), the anytime $/kWh charge, will form the primary price signalling component of the bill.
For LV smart meter tariff (Tariff 3) customers and new customers within the LV >750 MWh and HV tariff classes the volumetric charge will also be an anytime $/kWh charge.
In line with the stated preference of our large energy users, customers within the LV >750 MWh and HV tariff classes will immediately adopt an anytime flat rate $/kWh charge in the place of the historical declining block energy charge.
5.1.4 kVAr Charge
Customers with a smart meter who use >40MWh per annum will have an excess kVAr charge introduced within the regulatory period. We will implement this tariff no earlier than 1 July 2021, in response to our customers’ feedback. This delayed implementation is to give affected customers time to invest in power factor correction equipment.
5.2 Setting peak and off‐peak periods
Our peak period will be between 12:00 and 21:00 on weekdays, including public holidays. All other times will be off peak.
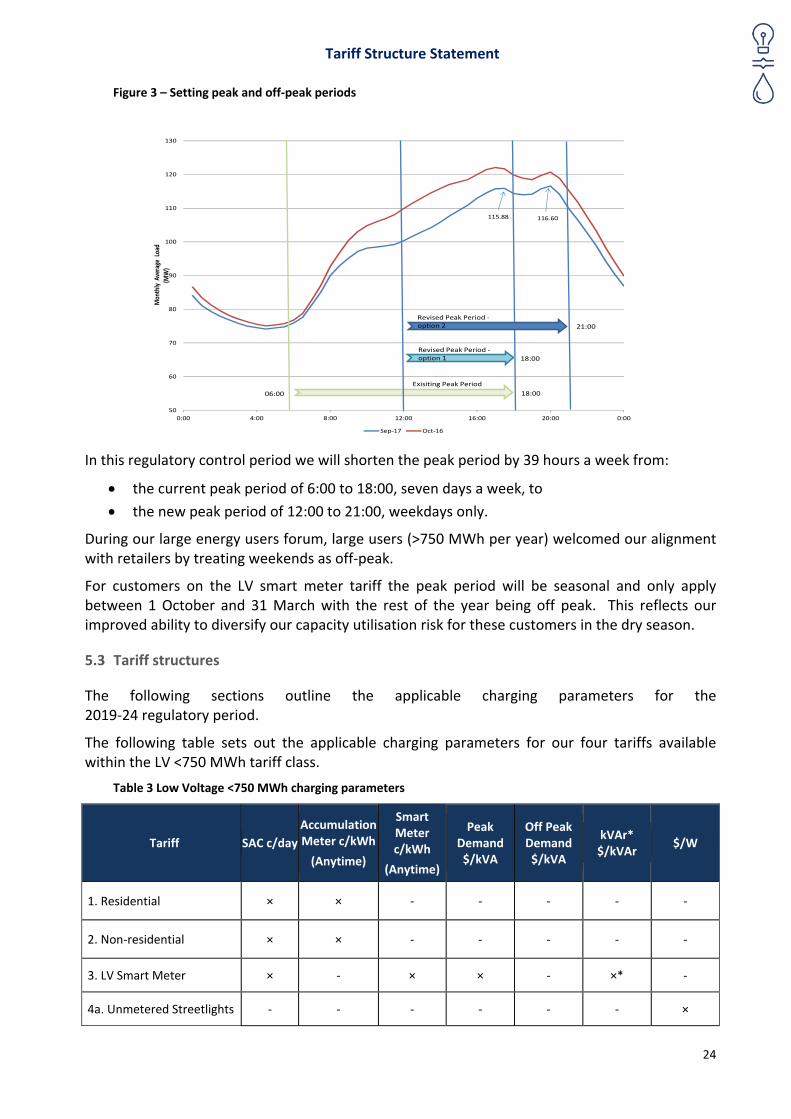
We consulted with our customers about setting peak and off‐peak periods. We consulted on two options, which we developed iteratively as more recent annual peak load data became available. Importantly, this new data showed our evening peak was becoming a double peak, as shown in the figure below.
Tariff Structure Statement
24
Figure 3 – Setting peak and off‐peak periods
In this regulatory control period we will shorten the peak period by 39 hours a week from:
the current peak period of 6:00 to 18:00, seven days a week, to
the new peak period of 12:00 to 21:00, weekdays only.
During our large energy users forum, large users (>750 MWh per year) welcomed our alignment with retailers by treating weekends as off‐peak.
For customers on the LV smart meter tariff the peak period will be seasonal and only apply between 1 October and 31 March with the rest of the year being off peak. This reflects our improved ability to diversify our capacity utilisation risk for these customers in the dry season.
5.3 Tariff structures
The following sections outline the applicable charging parameters for the 2019‐24 regulatory period.
The following table sets out the applicable charging parameters for our four tariffs available within the LV <750 MWh tariff class.
Table 3 Low Voltage <750 MWh charging parameters
Tariff SAC c/day
Accumulation Meter c/kWh
(Anytime)
Smart Meter c/kWh
(Anytime)
Peak Demand $/kVA
Off Peak Demand $/kVA
kVAr* $/kVAr
$/W
1. Residential × × ‐ ‐ ‐ ‐ ‐
2. Non‐residential × × ‐ ‐ ‐ ‐ ‐
3. LV Smart Meter × ‐ × × ‐ ×* ‐
4a. Unmetered Streetlights ‐ ‐ ‐ ‐ ‐ ‐ ×
115.88 116.60
50
60
70
80
90
100
110
120
130
0:00 4:00 8:00 12:00 16:00 20:00 0:00
Mon
thly A
verage Loa
d(M
W)
Sep‐17 Oct‐16
18:00
21:00
Revised Peak Period ‐option 2
Exisiting Peak Period
Revised Peak Period ‐option 1
18:0006:00
Tariff Structure Statement
25
Tariff SAC c/day
Accumulation Meter c/kWh
(Anytime)
Smart Meter c/kWh
(Anytime)
Peak Demand $/kVA
Off Peak Demand $/kVA
kVAr* $/kVAr
$/W
4b. Unmetered Traffic Lights
‐ ‐ ‐ ‐ ‐ ‐ ×
[*] The kVAr charge will apply only to those LV Smart Meter customers with a consumption of >40 MWh per annum.
5.3.1 LV >750 MWh
The following table sets out the applicable charging parameters tariff for our LV >750 MWh tariff class customers.
Table 4 LV >750 MWh charging parameters
Tariff SAC
$/month Anytime
kWh c/kWh
Peak Energy c/kWh
Off Peak Energy c/kWh
Peak Demand $/kVA
Off Peak Demand $/kVA
kVAr $/kVAr
LV >750 MWh × × ‐ ‐ × ‐ ×
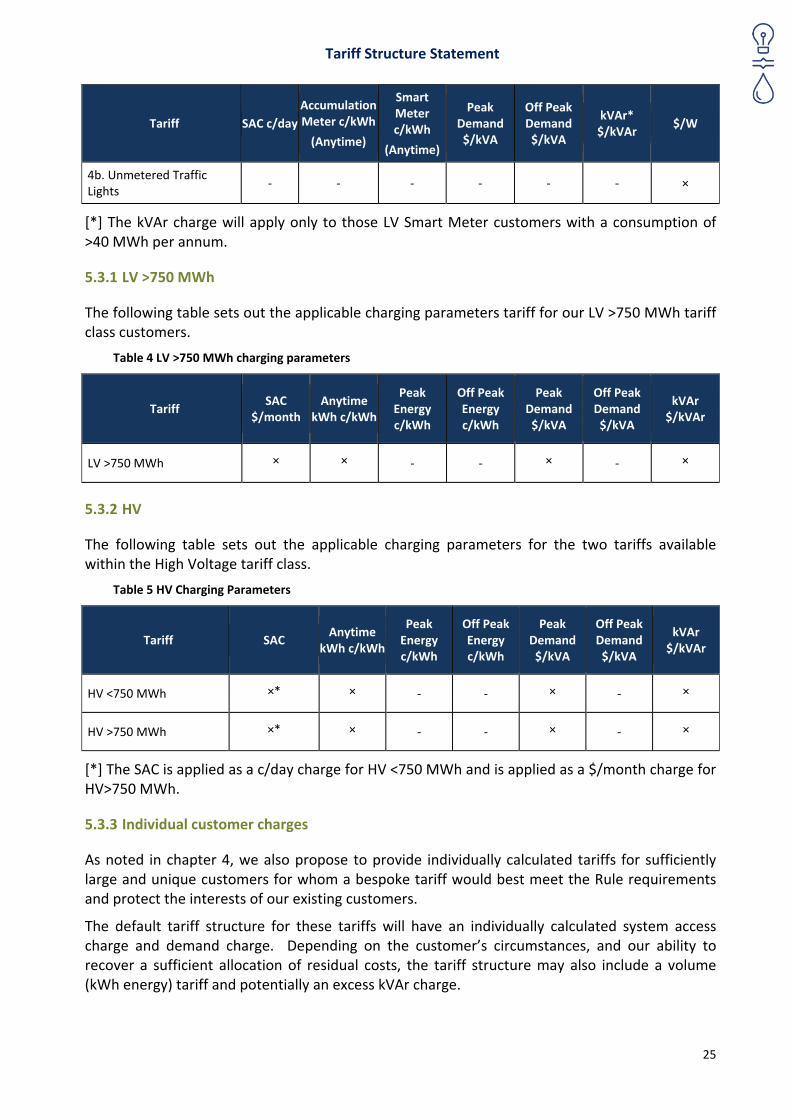
5.3.2 HV
The following table sets out the applicable charging parameters for the two tariffs available within the High Voltage tariff class.
Table 5 HV Charging Parameters
Tariff SAC Anytime
kWh c/kWh
Peak Energy c/kWh
Off Peak Energy c/kWh
Peak Demand $/kVA
Off Peak Demand $/kVA
kVAr $/kVAr
HV <750 MWh ×* × ‐ ‐ × ‐ ×
HV >750 MWh ×* × ‐ ‐ × ‐ ×
[*] The SAC is applied as a c/day charge for HV <750 MWh and is applied as a $/month charge for HV>750 MWh.
5.3.3 Individual customer charges
As noted in chapter 4, we also propose to provide individually calculated tariffs for sufficiently large and unique customers for whom a bespoke tariff would best meet the Rule requirements and protect the interests of our existing customers.
The default tariff structure for these tariffs will have an individually calculated system access charge and demand charge. Depending on the customer’s circumstances, and our ability to recover a sufficient allocation of residual costs, the tariff structure may also include a volume (kWh energy) tariff and potentially an excess kVAr charge.
Tariff Structure Statement
26
6 Network pricing principles
This chapter explains the relevant rule requirements and our compliance with these.
6.1 Rule requirements
The network pricing objective has been specified in Rule 6.18.5(a) which requires that tariffs should reflect the efficient costs of providing services to customers using these tariffs. The pricing principles set out in clauses 6.18.5(e) ‐ (j) of the Rules require us to ensure our tariffs:
recover revenue from each tariff class that lies between the stand‐alone cost of providing the service to the relevant customers and the avoidable cost of not providing the services;
are based on the long run marginal cost (LRMC) of providing the service;
recover revenue that reflects our total efficient costs of providing services to the customers assigned to that tariff, and minimises distortions to efficient usage signals when recovering residual costs (i.e. our efficient costs in excess of LRMC);
reflect our consideration of the impact on customers of changes in our network tariffs;
have been developed to be reasonably able to be understood by our customers;
must comply with any jurisdictional pricing obligations imposed by the NT Government; and
comply with the Rules, including those for side constraints which limit annual price movements within a tariff class, which will be tested within the regulatory period.
6.2 Compliance with the Rules
For this, our first TSS, we have developed our proposed tariff structures and indicative tariffs to comply with the above rule requirements in a manner which:
manages customer impacts of transition;
recognises the impact of the Pricing Order; and
responds to customer and stakeholder feedback from our engagement program.
In the past our tariff structures were established based on a vertically integrated electricity business, providing end‐to‐end services from generation through to retail. Therefore, most of our legacy tariff structures do not reflect the drivers of our network costs and indeed for some customers, they actually provided discounted demand tariffs at the peak times when our cost drivers were highest.
In order to comply with the Rules, our prices must be cost reflective. These legacy tariffs need to be changed to comply with the pricing principles set out in the Rules and be implemented in such a way that manages any impacts on our customers.
What is cost reflectivity? The amount customers pay should reflect their usage and demand placed on the network, including:
the cost of them being connected to the network; and
the demand they put on the network (particularly at peak times which drive growth in our costs).
Tariff Structure Statement
27
What does cost reflectivity mean when setting our tariffs? Cost reflective pricing requires consideration of the following:
how our customers use the network is reflected in how they are charged – we call this the tariff structure, identifying what components there are in the bill and how these relate to types of use and ultimately our costs; and
how much (what share of costs) different customer groups pay based on how much of our total costs they account for – we call this our revenue share.
We have captured these requirements in our pricing design principles of ‘simple, stable, fair and enough’. The following sections demonstrate how we have accounted for and complied with the pricing principles.
6.2.1 Developing our 2019‐24 TSS and proposed tariffs
Our proposed tariffs will help to ensure:
more efficient revenue shares: the amount different customer groups pay will reflect how much of our costs they drive by rebalancing to better align our residential and large non‐residential revenue shares with the corresponding allocated cost shares; and
more efficient tariff structures: the way our customers use the network is reflected in how they are charged, including:
o demand charges are to be introduced for all customers with a suitable meter;
o demand tariffs will be set at flat levels to encourage efficient energy use (not declining blocks), and energy tariffs are set at flat levels and don’t provide discounts for high energy use;
o we will adjust our peak charging period to 12:00 to 21:00 to be better aligned to our current and predicted peak load profiles; and
o customers with a power factor that does not meet our system’s technical requirements will be encouraged to implement corrective measures through introduction of an excess kVAr charge.
6.3 Pricing within stand‐alone and avoidable cost
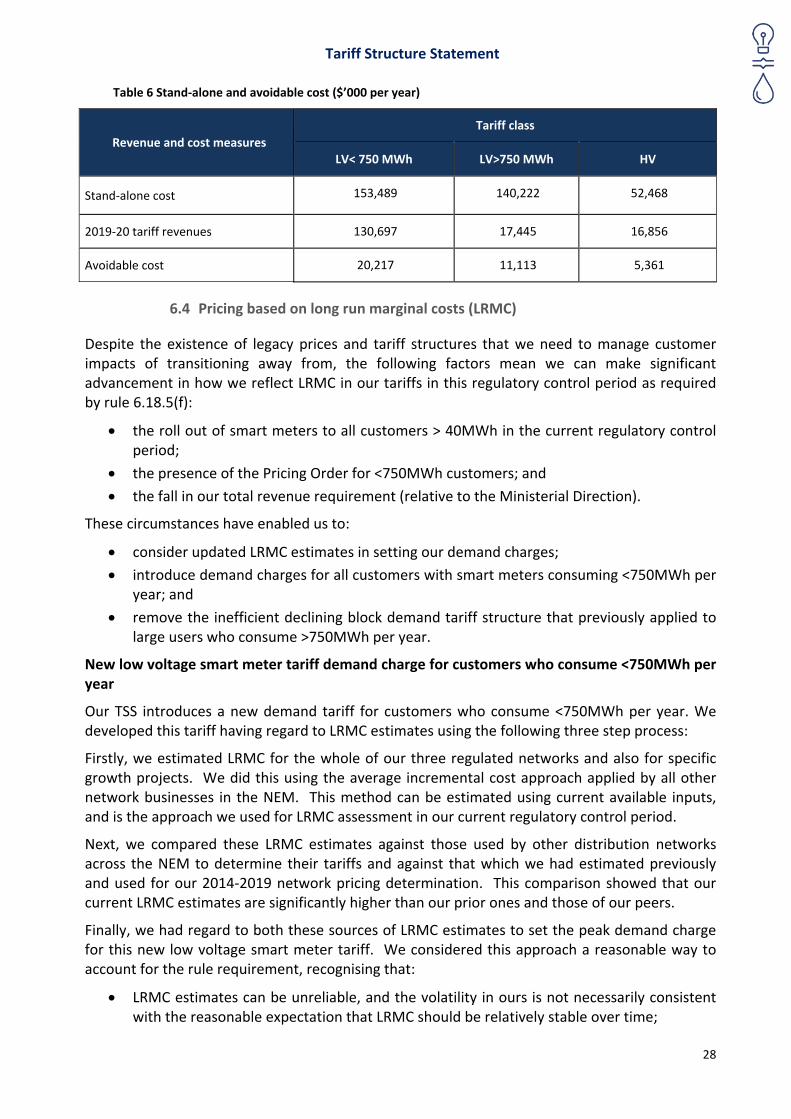
As Table 6 shows, we have ensured the revenues we expect to recover from each tariff class are within the efficient pricing bounds required by rule 6.18.5(e). That is, they are:
more than we would save if we didn’t serve those customers – our avoidable cost – and thereby ensure we are not serving customers through inefficient levels of cross‐subsidy; and
less than the cost those customers would incur to build their own energy solutions – standalone cost.
Tariff Structure Statement
28
Table 6 Stand‐alone and avoidable cost ($’000 per year)
Revenue and cost measures
Tariff class
LV< 750 MWh LV>750 MWh HV
Stand‐alone cost 153,489 140,222 52,468
2019‐20 tariff revenues 130,697 17,445 16,856
Avoidable cost 20,217 11,113 5,361
6.4 Pricing based on long run marginal costs (LRMC)
Despite the existence of legacy prices and tariff structures that we need to manage customer impacts of transitioning away from, the following factors mean we can make significant advancement in how we reflect LRMC in our tariffs in this regulatory control period as required by rule 6.18.5(f):
the roll out of smart meters to all customers > 40MWh in the current regulatory control period;
the presence of the Pricing Order for <750MWh customers; and
the fall in our total revenue requirement (relative to the Ministerial Direction).
These circumstances have enabled us to:
consider updated LRMC estimates in setting our demand charges;
introduce demand charges for all customers with smart meters consuming <750MWh per year; and
remove the inefficient declining block demand tariff structure that previously applied to large users who consume >750MWh per year.
New low voltage smart meter tariff demand charge for customers who consume <750MWh per year
Our TSS introduces a new demand tariff for customers who consume <750MWh per year. We developed this tariff having regard to LRMC estimates using the following three step process:
Firstly, we estimated LRMC for the whole of our three regulated networks and also for specific growth projects. We did this using the average incremental cost approach applied by all other network businesses in the NEM. This method can be estimated using current available inputs, and is the approach we used for LRMC assessment in our current regulatory control period.
Next, we compared these LRMC estimates against those used by other distribution networks across the NEM to determine their tariffs and against that which we had estimated previously and used for our 2014‐2019 network pricing determination. This comparison showed that our current LRMC estimates are significantly higher than our prior ones and those of our peers.
Finally, we had regard to both these sources of LRMC estimates to set the peak demand charge for this new low voltage smart meter tariff. We considered this approach a reasonable way to account for the rule requirement, recognising that:
LRMC estimates can be unreliable, and the volatility in ours is not necessarily consistent with the reasonable expectation that LRMC should be relatively stable over time;
Tariff Structure Statement
29
other networks have built up to their current LRMC estimates over time, after consultation, and with the benefit of AER feedback; and
it may harm our customers to blindly rely on the current estimates from our first step, if these are sufficiently unreliable.
Drawing on this method, we estimated our LRMC to be approximately $20/kVA/month for LV customers and $9.5/kVA/month for HV customers. This compares with the current system‐wide LRMC of $39/kVA/month and $18/kVA/month for LV and HV respectively.
Having estimated LRMC, we assessed the load profile of all LV smart meter tariff customers to ascertain the bill and revenue impacts of a demand charge of $20/kVA. Then, having regard for the bill outcomes of the demand charge, the system access charge for this tariff was disaggregated between customers with consumption >40MWh per year and those consuming less. The energy charge was set to recover residual costs and manage bill impacts across these two customer segments.
We have therefore adopted the $20 per kVA rate as the peak demand charge for our new low voltage smart meter tariff demand charge for <750MWh customers.
Existing demand charges for customers who use > 750 MWh per year
Our approach to accounting for LRMC for our customers who already pay demand charges, and who are not protected by the Pricing Order, differed because we needed to account for customer impacts.
For these customers, our objective was to remove the inefficient legacy demand tariff structure that had declining blocks as customers used more energy in the peak periods. This declining block demand tariff structure, and the incentives it provided, was at odds with the pricing principle requirement that we account for the additional costs likely to be associated with meeting demand from retail customers that are assigned to these tariffs at times of greatest utilisation of the relevant part of the distribution network. This is because it was likely that at times of greatest utilisation, these declining block peak demand tariffs were materially lower than our estimates of LRMC (e.g. the first block in 2017‐18 was $8.258 per kVA).
We consulted with our large users on our plan for a single flat rate peak demand charge and no off peak demand charge. We initially consulted at our large user forum on a draft plan to set this rate at the existing (2017‐18) first block rate of the current declining block. We then modified this approach to adjust the rate for HV customers, to reflect the fact that the LRMC estimate for customers who only use the HV system is lower than the rate for customers connected to the LV system, who use both voltage systems to get their energy.
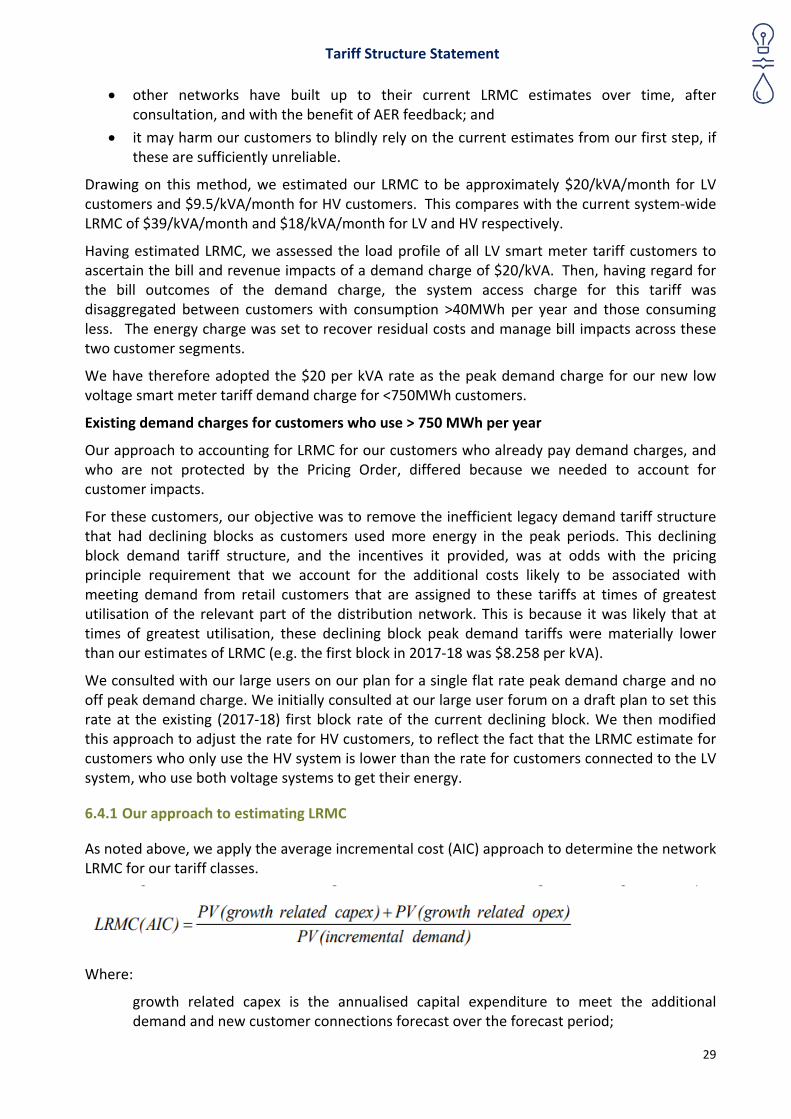
6.4.1 Our approach to estimating LRMC
As noted above, we apply the average incremental cost (AIC) approach to determine the network LRMC for our tariff classes.
Where:
growth related capex is the annualised capital expenditure to meet the additional demand and new customer connections forecast over the forecast period;
Tariff Structure Statement
30
growth related opex is the incremental annual cost of operating and maintaining the newly constructed network and connection assets over the forecast period; and
incremental demand is the forecast change in kVA demand compared with the base year.
The following have been incorporated into the AIC calculation:
augmentation expenditure by system level;
a proportion of replacement expenditure (approximately 5%), assessed as providing a useable network capacity increase through the installation of modern equipment; and
operating expenditure associated with the above capital expenditure.
Table 7 Long‐run marginal cost estimates
Tariff
LRMC
$/kVA per month
LV < 750 MWh 38.90
LV >750 MWh 38.90
HV 18.38
We chose the AIC method because it uses information currently available from our 2019‐24 price review process and from our asset planning processes. This method is less data intensive than the perturbation method, and considered a cost‐effective approach for our first TSS. This method has been adopted by all other distribution networks in their TSS and approved by the AER.
6.5 Ensuring our tariffs reflect total efficient costs and relative customer cost shares, and seek to minimise distortion
We have ensured our tariffs only recover our total efficient costs as required by rule 6.18.5(g)(2). We have tested that the net present value (NPV) of multiplying our forecast indicative tariffs in this TSS and AEMO’s forecast demand growth rates aligns to the NPV of the building block revenue requirement we have forecast using the AER post tax revenue model.
If the actual demand over the period differs from AEMO’s forecast demand that we have relied on in this TSS, the revenue cap will adjust our annual prices to ensure we only recover our approved efficient costs.
6.5.1 Aligning our revenue shares with our cost to serve
In addition to recovering our total efficient costs, we are also better aligning the share of our revenue we receive from each tariff class with how much they cost us to supply as required by rule 6.18.5(g)(1). In the past, our non‐residential tariffs have recovered a lower revenue share than is reflective of their relative contribution to our total costs.
Our forecast revenue is expected to fall compared to the current regulatory control period, providing an opportunity for revenue alignment without price increases. Falling revenue means we can achieve a better sharing of our costs by:
reducing the revenue collected from residential customers; and
maintaining the revenue collected from non‐residential customers, at the current level.
Tariff Structure Statement
31
This will allow us to recover our regulated revenue in a way that is less likely to distort our customers’ decisions to use energy efficiently.
6.5.2 Revenue recovery through non‐distortionary charging parameters
Our LRMC‐driven costs and associated charging parameters discussed in section 6.4 above are not sufficient to recover our total efficient costs. This is because our allowed total efficient costs include the recovery of both variable or growth costs (called marginal costs) and our fixed costs, which together allow us to recover our average costs.
We have a lot of fixed costs in providing network services. This means we have to recover residual costs (the difference between marginal costs and our allowed revenues determined by the AER). We have designed our tariffs to recover residual costs in a way that:
minimises distortions to efficient price signals, by keeping demand tariffs in line with our our LRMC estimates, or below these where we have needed to manage bill impacts; and
considers the impact of residual costs on customer bills, and whether these bill impacts will distort usage decisions (including whether the Pricing Order will prevent bill impacts), as discussed below.
6.6 Considering customer impacts of tariffs
Managing customer impacts was a key focus of our tariff design, and informed how we designed our customer engagement on pricing issues (as discussed in chapter 3 above) as required by rule 6.18.5(h). Uniquely within the NEM, the Pricing Order means we have two distinct types of retail customers with differing price impacts.
1. Customers who use <750MWh per year
Most of our 85,000 customers, comprising households and small to medium businesses, are subject to retail pricing protection, so our TSS pricing decisions will not directly affect their retail electricity bills.
Our engagement with these customers still tested their understanding and acceptability of our tariff design thinking and draft plans, and relevantly found that these customers understood their bills will be unaffected by changes we make to our tariffs to become more cost reflective.
This meant we could immediately structure our tariffs to cost reflective levels for customers with smart meters without creating bill shock. This approach was supported by our Customer Advisory Council.
2. Customers who use >750MWh per year
Our 200 largest energy users see our network tariffs as a separate line item on their retail bill. Our network prices will directly affect these customers. We sought to manage our tariff changes to minimise customer impacts and our engagement with these customers focussed on specific tariff changes, options, and impacts for these customers. It identified that these customers:
supported our cost reflective tariff option with more than half of these customers favouring our “Fully Cost Reflective” tariff option as their first preference; and
understood network tariff impacts, with half stating they understood their bill impacts and the other half that they partially understood these, noting they need to understand the delivered retail impact from their retailer.
Tariff Structure Statement
32
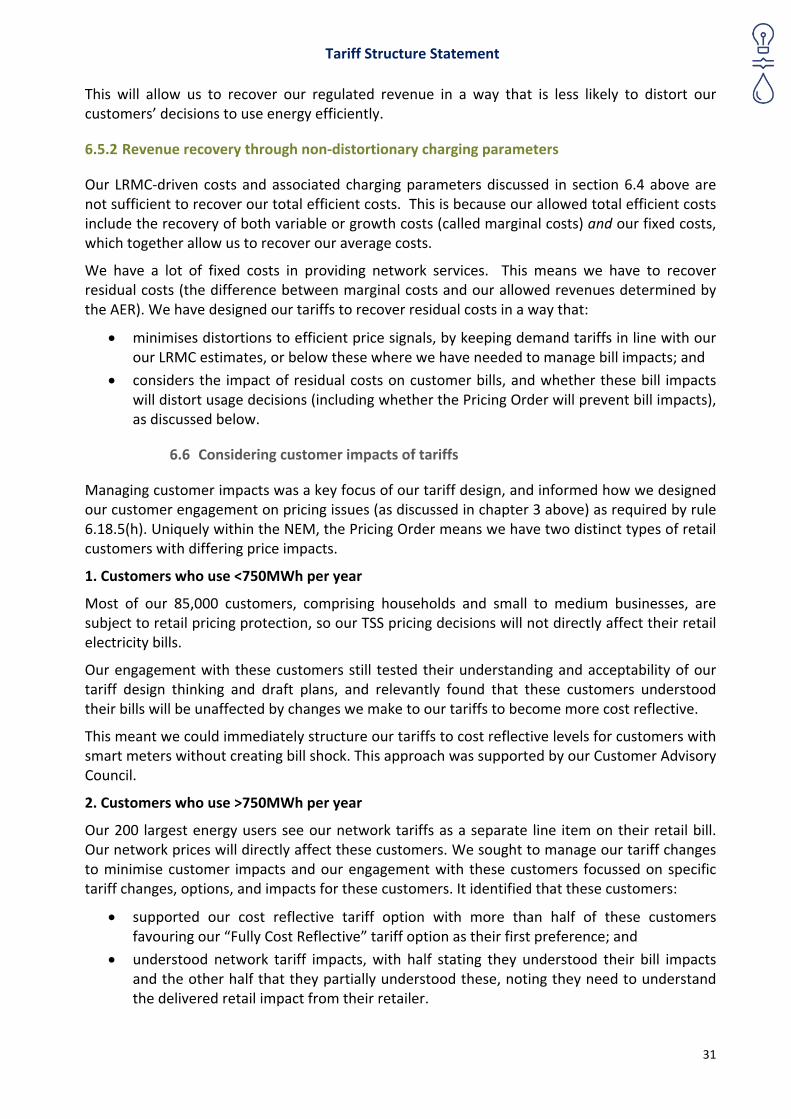
Our large user tariff impact analysis for the first year of our regulatory control period relative to 2018/19 is shown in the figure below. This shows the network bill impact one, which would be lessened when considered at a retail bill level.
Figure 4 – Large user customer bill impact analysis
We initially considered and consulted with industry participants in our June consultation paper on having opt‐in tariff arrangements to help manage customer impacts of transition for >750MWh customers. Having regard to the overall revenue reductions in this TSS, we subsequently found that these were not needed to manage bill impacts. This meant the options we presented at the large user forum were able to be for all existing and new customers rather than needing the added complexity of differentiated legacy and new tariffs with opt in or opt out arrangements.
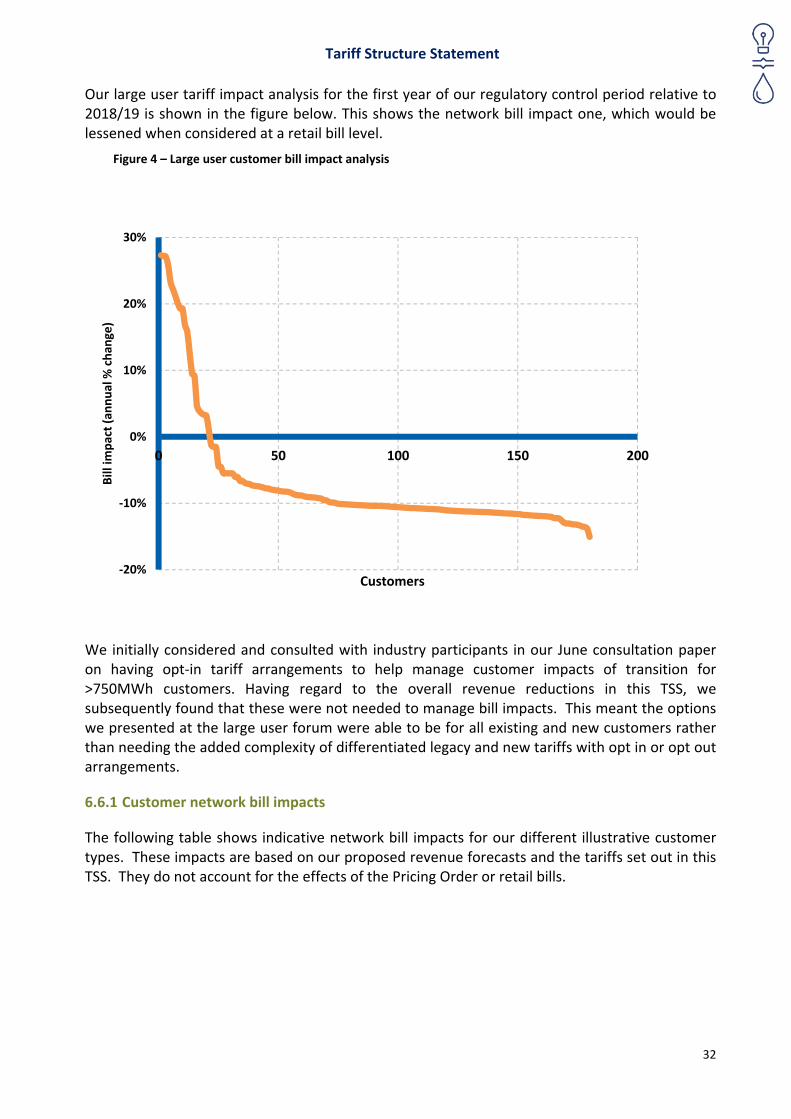
6.6.1 Customer network bill impacts
The following table shows indicative network bill impacts for our different illustrative customer types. These impacts are based on our proposed revenue forecasts and the tariffs set out in this TSS. They do not account for the effects of the Pricing Order or retail bills.
‐20%
‐10%
0%
10%
20%
30%
0 50 100 150 200
Bill im
pact (annual % chan
ge)
Customers
Tariff Structure Statement
33
Table 8 Movement in customers’ network bills 2018‐19 to 2019‐20 (excluding GST)
Customer Type Network Bill+ Bill Movement Revenue Movement*
2018‐19* 2019‐20 $ % $M %
Small Residential
Accumulation Meter
(8,500 kWh pa)
1,109 1,093 ‐16 ‐1.4
‐7.26 ‐5.26
Small Residential Smart
Meter
(8,500 kWh pa)
1,107 1,083 ‐24 ‐2.1
Large Residential
Accumulation Meter
(15,000 kWh pa)
1,831 1,749 ‐82 ‐4.5
Large Residential Smart
Meter
(15,000 kWh pa)
1,831 1,535 ‐296 ‐16.2
Non‐Residential
Accumulation Meter
(38,000kWh pa)
4,259 4,466 207 4.9
Non‐Residential Smart
Meter
(38,000 kWh pa)
4,259 3,300 ‐959 ‐22.5
Industrial
(1,000,000 kWh pa) 89,481 79,723 ‐9,758 ‐10.9
0.38 1.15 Large Industrial HV
(8,000,000 kWh pa) 405,638 456,420 50,782 12.5
[*] 2018‐19 Network Tariffs are indicative and will be subject to review and approval by the Northern Territory Treasurer in May 2018. [+] Excludes ACS Metering
6.7 Ensuring that tariffs can be understood
In developing this TSS we sought to ensure that the new tariff charging parameters for particular tariff classes, and our changes to structures and charging arrangements (such as the peak charging window), were understood by customers who faced these bill impacts. We consulted our phase 1 and phase 2 residential and small non‐residential customers about the concept of demand charging and our time of use charging window. We did the same with our large user forum in addition to a dedicated session on power factor correction on our new excess kVAr charge.
The tariff changes that better simplify our tariffs to help ensure they are reasonably capable of being understood by retail customers, as required by rule 6.18.5(i), are as follows:
We have simplified our tariff structures to remove blocks and have flat rate energy and demand charges:
o flat rates are easier for customers to understand; and
o the flat rate tariff option was the most preferred option tested at our large user forum.
Tariff Structure Statement
34
We have simplified our tariffs by removing off‐peak demand charges:
o this supports a simpler message for our customers that capacity in off‐peak periods is free; and
o this was welcomed at our large user forum.
We have extended the off‐peak period:
o this now includes an additional 39 hours a week and weekends, which was welcomed at the large user forum and considered simpler because it aligns with retailers’ treatment of weekends as off‐peak; and
o for LV connected <750MWh customers with a smart meter, the off‐peak period also includes the six months between 1 October and 31 March.
We have retained simplicity in our tariff schedule by not having a menu of opt in tariffs.
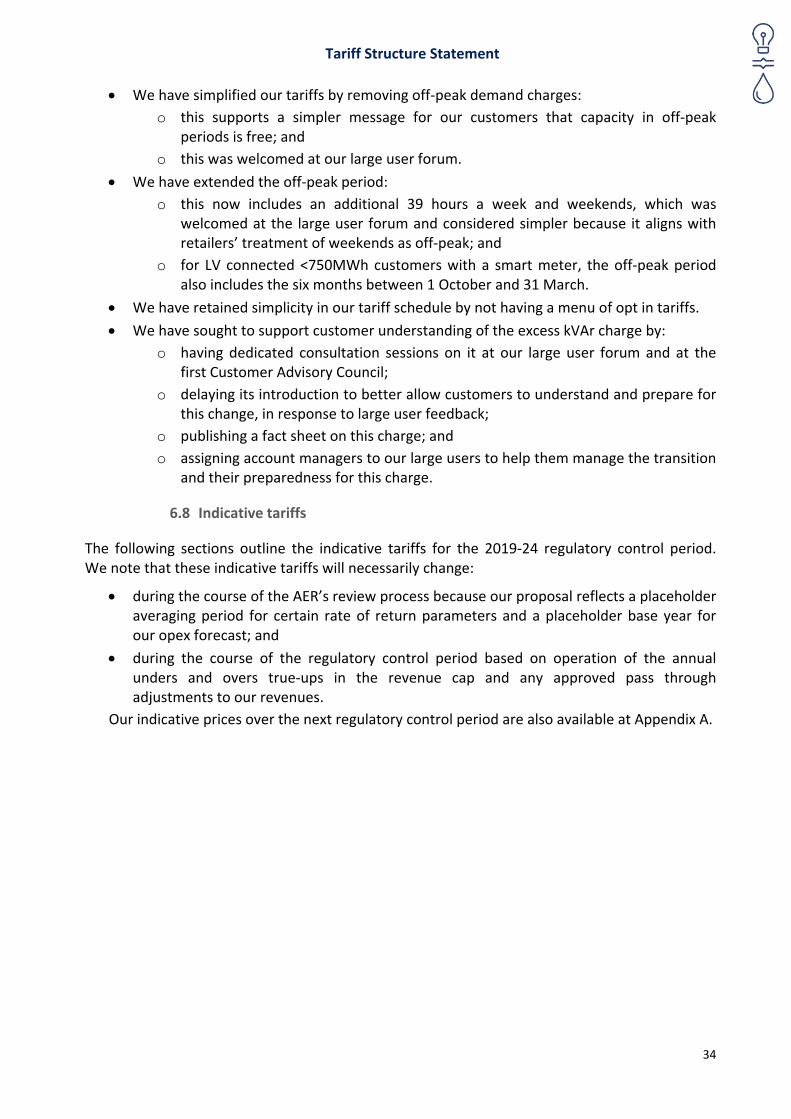
We have sought to support customer understanding of the excess kVAr charge by:
o having dedicated consultation sessions on it at our large user forum and at the first Customer Advisory Council;
o delaying its introduction to better allow customers to understand and prepare for this change, in response to large user feedback;
o publishing a fact sheet on this charge; and
o assigning account managers to our large users to help them manage the transition and their preparedness for this charge.
6.8 Indicative tariffs
The following sections outline the indicative tariffs for the 2019‐24 regulatory control period. We note that these indicative tariffs will necessarily change:
during the course of the AER’s review process because our proposal reflects a placeholder averaging period for certain rate of return parameters and a placeholder base year for our opex forecast; and
during the course of the regulatory control period based on operation of the annual unders and overs true‐ups in the revenue cap and any approved pass through adjustments to our revenues.
Our indicative prices over the next regulatory control period are also available at Appendix A.
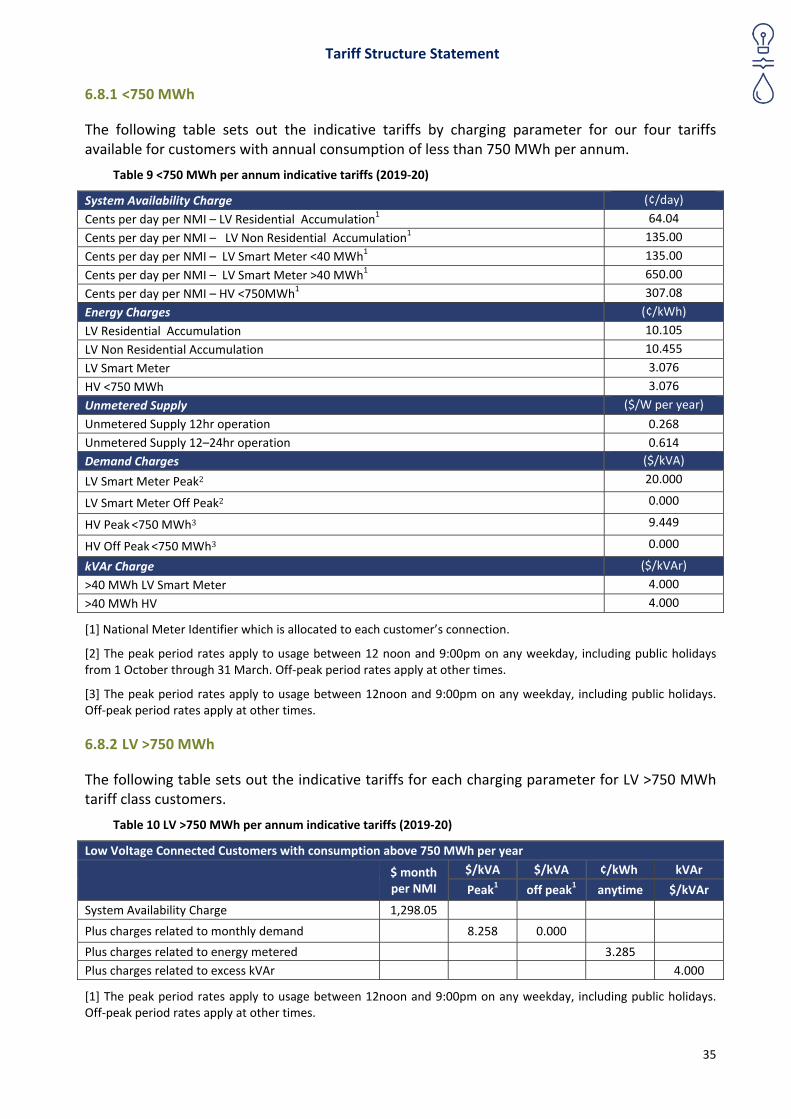
Tariff Structure Statement
35
6.8.1 <750 MWh
The following table sets out the indicative tariffs by charging parameter for our four tariffs available for customers with annual consumption of less than 750 MWh per annum.
Table 9 <750 MWh per annum indicative tariffs (2019‐20)
System Availability Charge (¢/day)
Cents per day per NMI – LV Residential Accumulation1 64.04
Cents per day per NMI – LV Non Residential Accumulation1 135.00
Cents per day per NMI – LV Smart Meter <40 MWh1 135.00
Cents per day per NMI – LV Smart Meter >40 MWh1 650.00
Cents per day per NMI – HV <750MWh1 307.08
Energy Charges (¢/kWh)
LV Residential Accumulation 10.105
LV Non Residential Accumulation 10.455
LV Smart Meter 3.076
HV <750 MWh 3.076
Unmetered Supply ($/W per year)
Unmetered Supply 12hr operation 0.268
Unmetered Supply 12–24hr operation 0.614
Demand Charges ($/kVA)
LV Smart Meter Peak2 20.000
LV Smart Meter Off Peak2 0.000
HV Peak <750 MWh3 9.449
HV Off Peak <750 MWh3 0.000
kVAr Charge ($/kVAr)
>40 MWh LV Smart Meter 4.000
>40 MWh HV 4.000
[1] National Meter Identifier which is allocated to each customer’s connection.
[2] The peak period rates apply to usage between 12 noon and 9:00pm on any weekday, including public holidays from 1 October through 31 March. Off‐peak period rates apply at other times.
[3] The peak period rates apply to usage between 12noon and 9:00pm on any weekday, including public holidays. Off‐peak period rates apply at other times.
6.8.2 LV >750 MWh
The following table sets out the indicative tariffs for each charging parameter for LV >750 MWh tariff class customers.
Table 10 LV >750 MWh per annum indicative tariffs (2019‐20)
Low Voltage Connected Customers with consumption above 750 MWh per year
$ month per NMI
$/kVA $/kVA ¢/kWh kVAr
Peak1 off peak1 anytime $/kVAr
System Availability Charge 1,298.05
Plus charges related to monthly demand 8.258 0.000
Plus charges related to energy metered 3.285
Plus charges related to excess kVAr 4.000
[1] The peak period rates apply to usage between 12noon and 9:00pm on any weekday, including public holidays. Off‐peak period rates apply at other times.
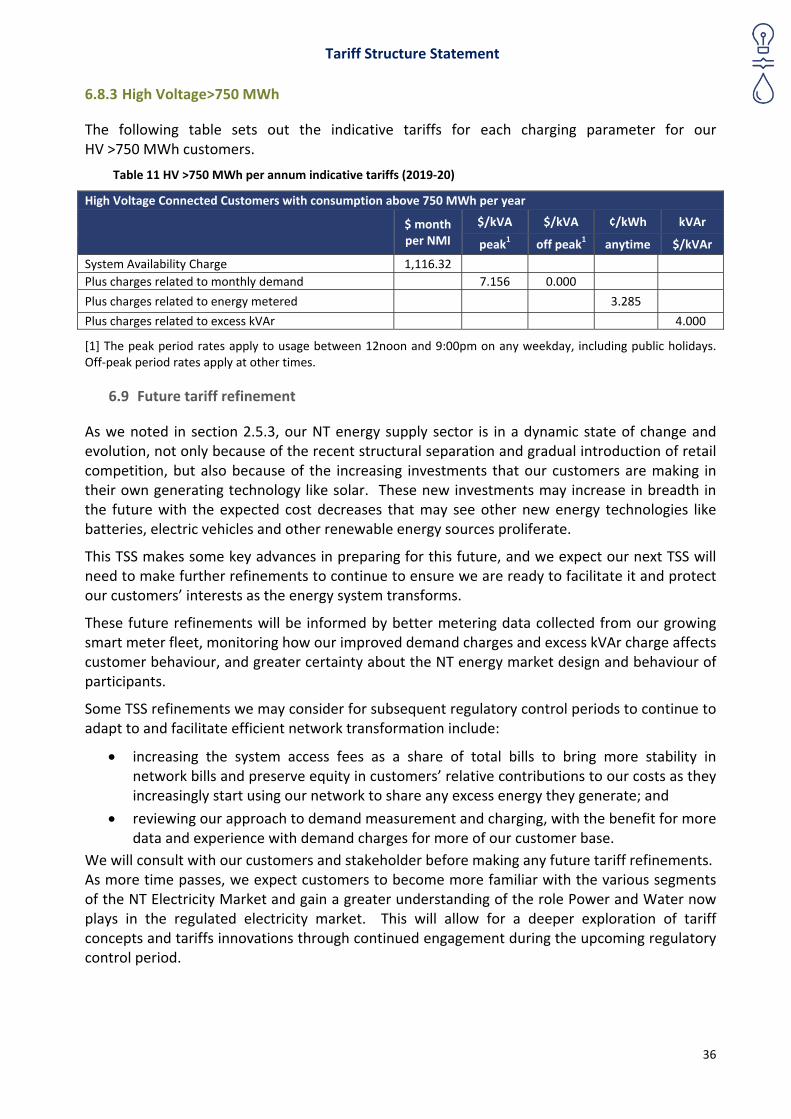
Tariff Structure Statement
36
6.8.3 High Voltage>750 MWh
The following table sets out the indicative tariffs for each charging parameter for our HV >750 MWh customers.
Table 11 HV >750 MWh per annum indicative tariffs (2019‐20)
High Voltage Connected Customers with consumption above 750 MWh per year
$ month per NMI
$/kVA $/kVA ¢/kWh kVAr
peak1 off peak1 anytime $/kVAr
System Availability Charge 1,116.32
Plus charges related to monthly demand 7.156 0.000
Plus charges related to energy metered 3.285
Plus charges related to excess kVAr 4.000
[1] The peak period rates apply to usage between 12noon and 9:00pm on any weekday, including public holidays. Off‐peak period rates apply at other times.
6.9 Future tariff refinement
As we noted in section 2.5.3, our NT energy supply sector is in a dynamic state of change and evolution, not only because of the recent structural separation and gradual introduction of retail competition, but also because of the increasing investments that our customers are making in their own generating technology like solar. These new investments may increase in breadth in the future with the expected cost decreases that may see other new energy technologies like batteries, electric vehicles and other renewable energy sources proliferate.
This TSS makes some key advances in preparing for this future, and we expect our next TSS will need to make further refinements to continue to ensure we are ready to facilitate it and protect our customers’ interests as the energy system transforms.
These future refinements will be informed by better metering data collected from our growing smart meter fleet, monitoring how our improved demand charges and excess kVAr charge affects customer behaviour, and greater certainty about the NT energy market design and behaviour of participants.
Some TSS refinements we may consider for subsequent regulatory control periods to continue to adapt to and facilitate efficient network transformation include:
increasing the system access fees as a share of total bills to bring more stability in network bills and preserve equity in customers’ relative contributions to our costs as they increasingly start using our network to share any excess energy they generate; and
reviewing our approach to demand measurement and charging, with the benefit for more data and experience with demand charges for more of our customer base.
We will consult with our customers and stakeholder before making any future tariff refinements. As more time passes, we expect customers to become more familiar with the various segments of the NT Electricity Market and gain a greater understanding of the role Power and Water now plays in the regulated electricity market. This will allow for a deeper exploration of tariff concepts and tariffs innovations through continued engagement during the upcoming regulatory control period.
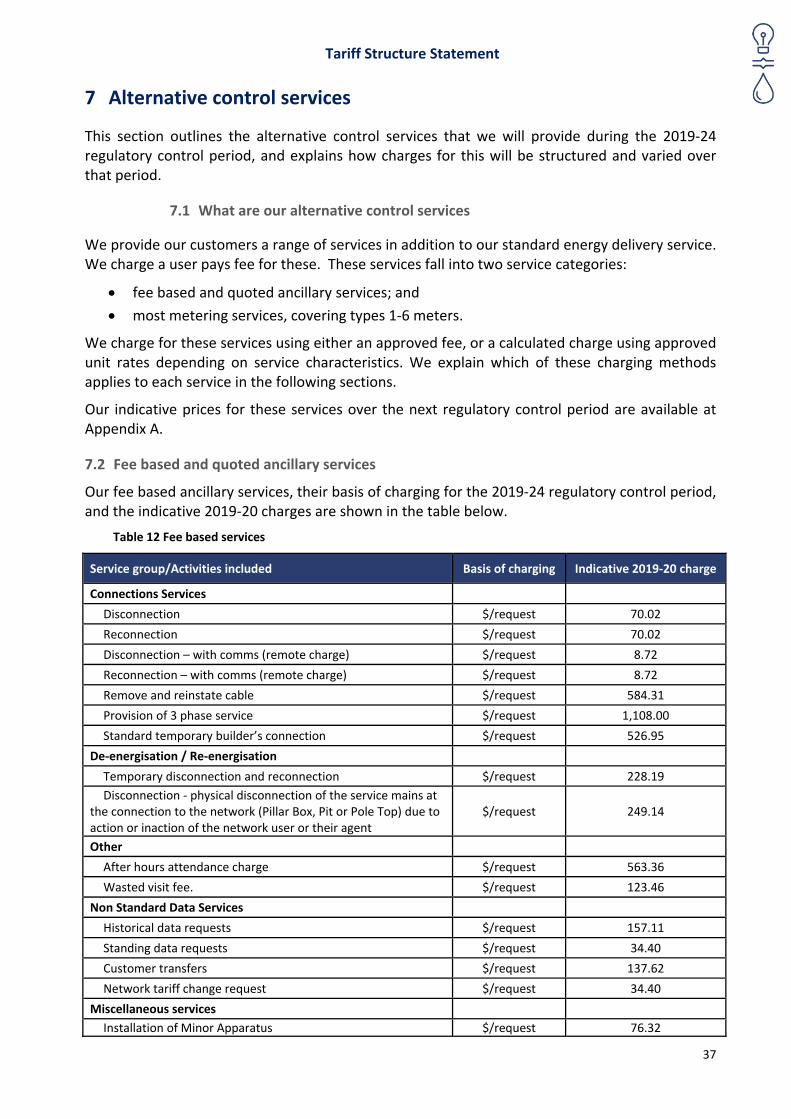
Tariff Structure Statement
37
7 Alternative control services
This section outlines the alternative control services that we will provide during the 2019‐24 regulatory control period, and explains how charges for this will be structured and varied over that period.
7.1 What are our alternative control services
We provide our customers a range of services in addition to our standard energy delivery service. We charge a user pays fee for these. These services fall into two service categories:
fee based and quoted ancillary services; and
most metering services, covering types 1‐6 meters.
We charge for these services using either an approved fee, or a calculated charge using approved unit rates depending on service characteristics. We explain which of these charging methods applies to each service in the following sections.
Our indicative prices for these services over the next regulatory control period are available at Appendix A.
7.2 Fee based and quoted ancillary services
Our fee based ancillary services, their basis of charging for the 2019‐24 regulatory control period, and the indicative 2019‐20 charges are shown in the table below.
Table 12 Fee based services
Service group/Activities included Basis of charging Indicative 2019‐20 charge
Connections Services
Disconnection $/request 70.02
Reconnection $/request 70.02
Disconnection – with comms (remote charge) $/request 8.72
Reconnection – with comms (remote charge) $/request 8.72
Remove and reinstate cable $/request 584.31
Provision of 3 phase service $/request 1,108.00
Standard temporary builder’s connection $/request 526.95
De‐energisation / Re‐energisation
Temporary disconnection and reconnection $/request 228.19
Disconnection ‐ physical disconnection of the service mains at the connection to the network (Pillar Box, Pit or Pole Top) due to action or inaction of the network user or their agent
$/request 249.14
Other
After hours attendance charge $/request 563.36
Wasted visit fee. $/request 123.46
Non Standard Data Services
Historical data requests $/request 157.11
Standing data requests $/request 34.40
Customer transfers $/request 137.62
Network tariff change request $/request 34.40
Miscellaneous services
Installation of Minor Apparatus $/request 76.32
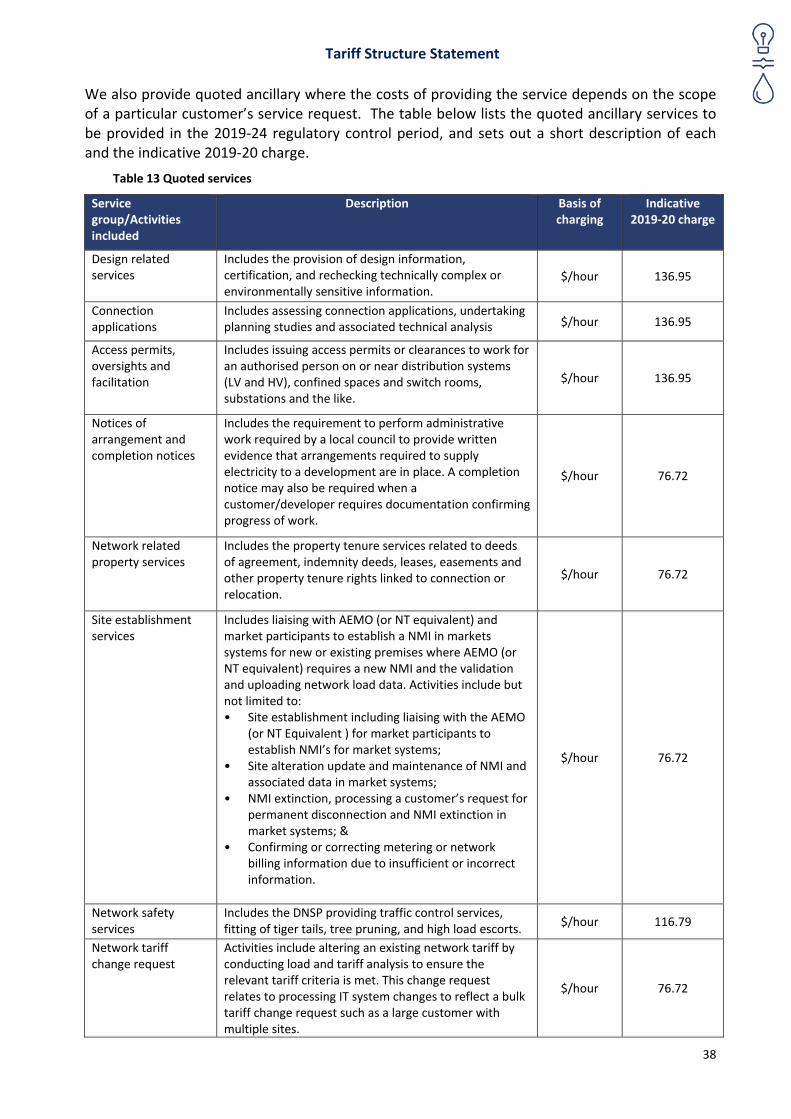
Tariff Structure Statement
38
We also provide quoted ancillary where the costs of providing the service depends on the scope of a particular customer’s service request. The table below lists the quoted ancillary services to be provided in the 2019‐24 regulatory control period, and sets out a short description of each and the indicative 2019‐20 charge.
Table 13 Quoted services
Service group/Activities included
Description Basis of charging
Indicative 2019‐20 charge
Design related services
Includes the provision of design information, certification, and rechecking technically complex or environmentally sensitive information.
$/hour 136.95
Connection applications
Includes assessing connection applications, undertaking planning studies and associated technical analysis $/hour 136.95
Access permits, oversights and facilitation
Includes issuing access permits or clearances to work for an authorised person on or near distribution systems (LV and HV), confined spaces and switch rooms, substations and the like.
$/hour 136.95
Notices of arrangement and completion notices
Includes the requirement to perform administrative work required by a local council to provide written evidence that arrangements required to supply electricity to a development are in place. A completion notice may also be required when a customer/developer requires documentation confirming progress of work.
$/hour 76.72
Network related property services
Includes the property tenure services related to deeds of agreement, indemnity deeds, leases, easements and other property tenure rights linked to connection or relocation.
$/hour 76.72
Site establishment services
Includes liaising with AEMO (or NT equivalent) and market participants to establish a NMI in markets systems for new or existing premises where AEMO (or NT equivalent) requires a new NMI and the validation and uploading network load data. Activities include but not limited to: • Site establishment including liaising with the AEMO
(or NT Equivalent ) for market participants to establish NMI’s for market systems;
• Site alteration update and maintenance of NMI and associated data in market systems;
• NMI extinction, processing a customer’s request for permanent disconnection and NMI extinction in market systems; &
• Confirming or correcting metering or network billing information due to insufficient or incorrect information.
$/hour 76.72
Network safety services
Includes the DNSP providing traffic control services, fitting of tiger tails, tree pruning, and high load escorts.
$/hour 116.79
Network tariff change request
Activities include altering an existing network tariff byconducting load and tariff analysis to ensure the relevant tariff criteria is met. This change request relates to processing IT system changes to reflect a bulk tariff change request such as a large customer with multiple sites.
$/hour 76.72
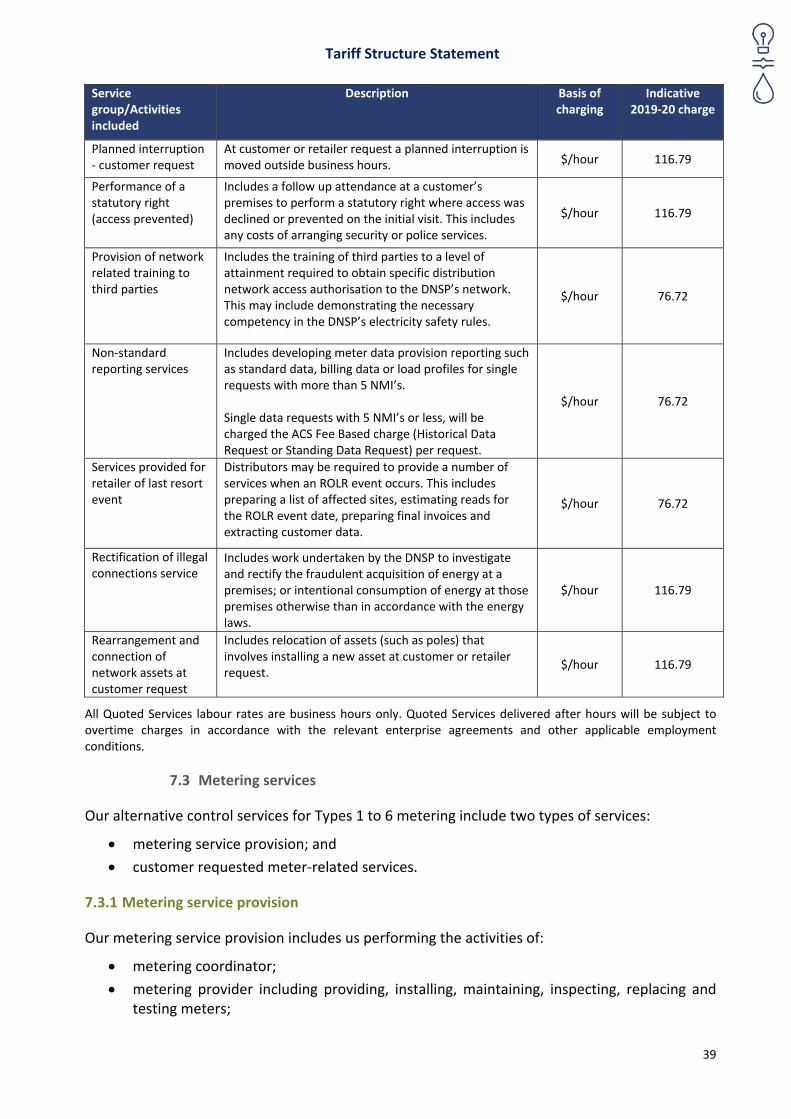
Tariff Structure Statement
39
Service group/Activities included
Description Basis of charging
Indicative 2019‐20 charge
Planned interruption ‐ customer request
At customer or retailer request a planned interruption is moved outside business hours. $/hour 116.79
Performance of a statutory right (access prevented)
Includes a follow up attendance at a customer’s premises to perform a statutory right where access was declined or prevented on the initial visit. This includes any costs of arranging security or police services.
$/hour 116.79
Provision of network related training to third parties
Includes the training of third parties to a level of attainment required to obtain specific distribution network access authorisation to the DNSP’s network. This may include demonstrating the necessary competency in the DNSP’s electricity safety rules.
$/hour 76.72
Non‐standard reporting services
Includes developing meter data provision reporting such as standard data, billing data or load profiles for single requests with more than 5 NMI’s. Single data requests with 5 NMI’s or less, will be charged the ACS Fee Based charge (Historical Data Request or Standing Data Request) per request.
$/hour 76.72
Services provided for retailer of last resort event
Distributors may be required to provide a number of services when an ROLR event occurs. This includes preparing a list of affected sites, estimating reads for the ROLR event date, preparing final invoices and extracting customer data.
$/hour 76.72
Rectification of illegal connections service
Includes work undertaken by the DNSP to investigate and rectify the fraudulent acquisition of energy at a premises; or intentional consumption of energy at those premises otherwise than in accordance with the energy laws.
$/hour 116.79
Rearrangement and connection of network assets at customer request
Includes relocation of assets (such as poles) that involves installing a new asset at customer or retailer request.
$/hour 116.79
All Quoted Services labour rates are business hours only. Quoted Services delivered after hours will be subject to overtime charges in accordance with the relevant enterprise agreements and other applicable employment conditions.
7.3 Metering services
Our alternative control services for Types 1 to 6 metering include two types of services:
metering service provision; and
customer requested meter‐related services.
7.3.1 Metering service provision
Our metering service provision includes us performing the activities of:
metering coordinator;
metering provider including providing, installing, maintaining, inspecting, replacing and testing meters;
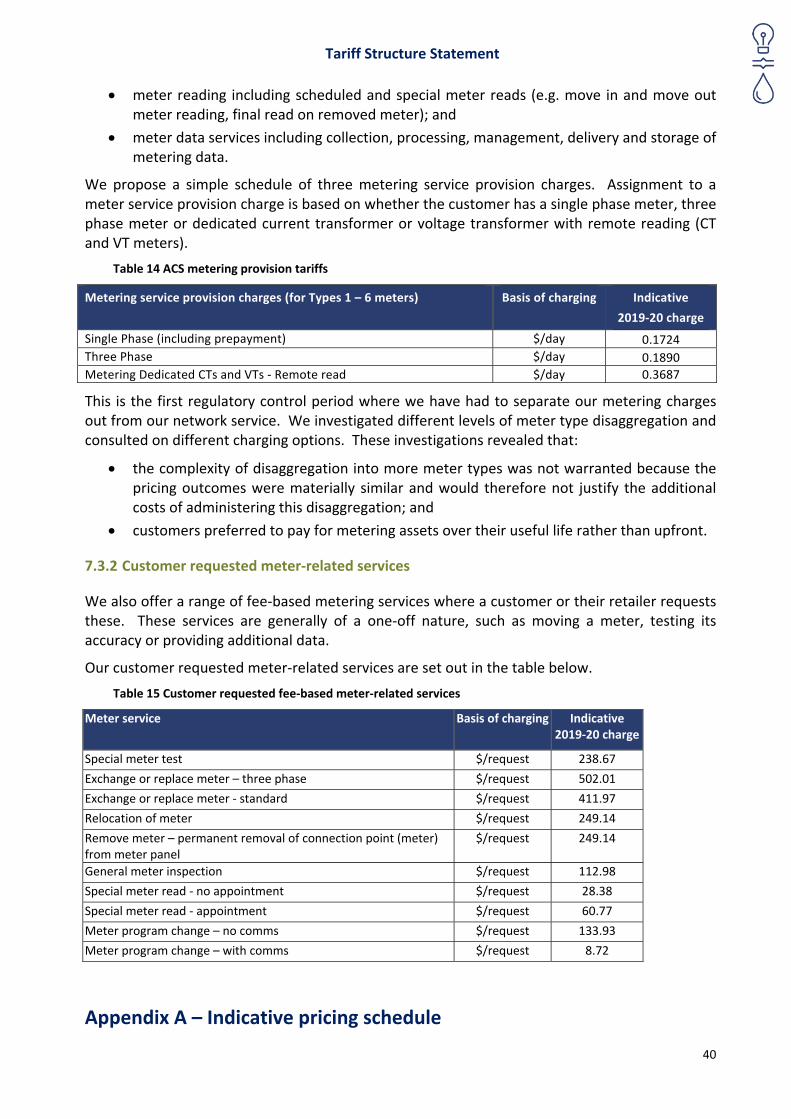
Tariff Structure Statement
40
meter reading including scheduled and special meter reads (e.g. move in and move out meter reading, final read on removed meter); and
meter data services including collection, processing, management, delivery and storage of metering data.
We propose a simple schedule of three metering service provision charges. Assignment to a meter service provision charge is based on whether the customer has a single phase meter, three phase meter or dedicated current transformer or voltage transformer with remote reading (CT and VT meters).
Table 14 ACS metering provision tariffs
Metering service provision charges (for Types 1 – 6 meters) Basis of charging Indicative
2019‐20 charge
Single Phase (including prepayment) $/day 0.1724
Three Phase $/day 0.1890
Metering Dedicated CTs and VTs ‐ Remote read $/day 0.3687
This is the first regulatory control period where we have had to separate our metering charges out from our network service. We investigated different levels of meter type disaggregation and consulted on different charging options. These investigations revealed that:
the complexity of disaggregation into more meter types was not warranted because the pricing outcomes were materially similar and would therefore not justify the additional costs of administering this disaggregation; and
customers preferred to pay for metering assets over their useful life rather than upfront.
7.3.2 Customer requested meter‐related services
We also offer a range of fee‐based metering services where a customer or their retailer requests these. These services are generally of a one‐off nature, such as moving a meter, testing its accuracy or providing additional data.
Our customer requested meter‐related services are set out in the table below.
Table 15 Customer requested fee‐based meter‐related services
Meter service Basis of charging Indicative 2019‐20 charge
Special meter test $/request 238.67
Exchange or replace meter – three phase $/request 502.01
Exchange or replace meter ‐ standard $/request 411.97
Relocation of meter $/request 249.14
Remove meter – permanent removal of connection point (meter) from meter panel
$/request 249.14
General meter inspection $/request 112.98
Special meter read ‐ no appointment $/request 28.38
Special meter read ‐ appointment $/request 60.77
Meter program change – no comms $/request 133.93
Meter program change – with comms $/request 8.72
Appendix A – Indicative pricing schedule
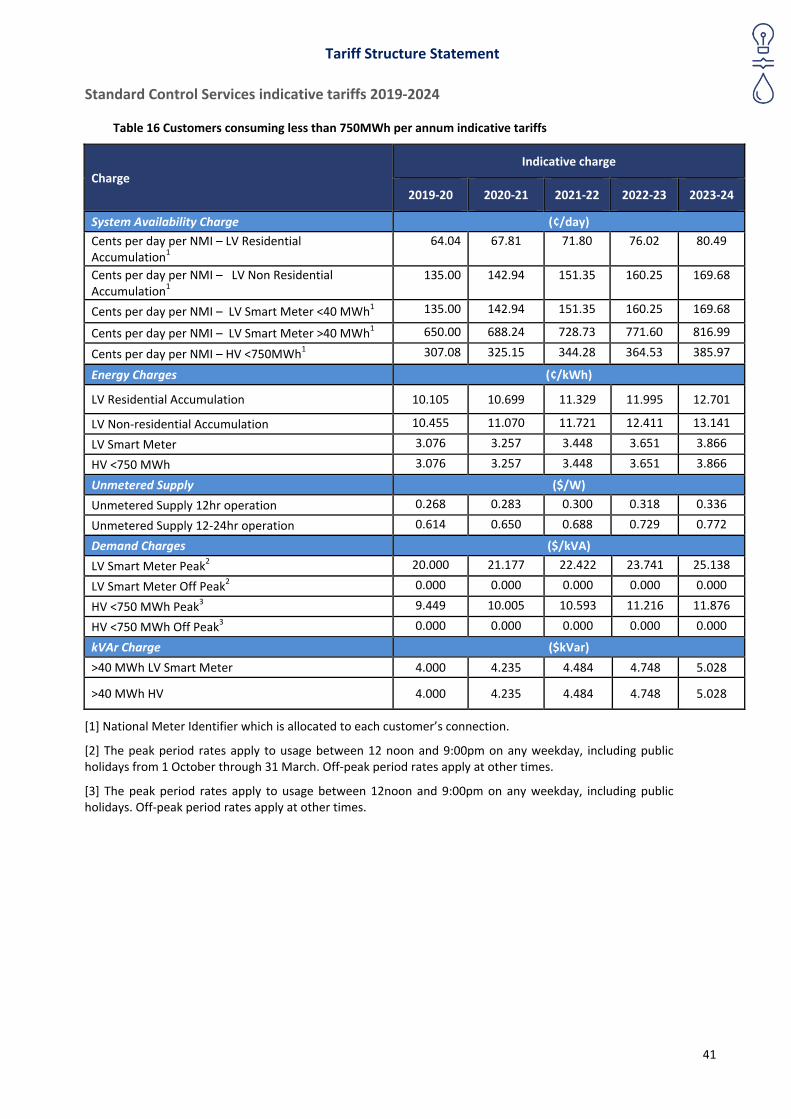
Tariff Structure Statement
41
Standard Control Services indicative tariffs 2019‐2024
Table 16 Customers consuming less than 750MWh per annum indicative tariffs
Charge
Indicative charge
2019‐20 2020‐21 2021‐22 2022‐23 2023‐24
System Availability Charge (¢/day)
Cents per day per NMI – LV Residential Accumulation1
64.04 67.81 71.80 76.02 80.49
Cents per day per NMI – LV Non Residential Accumulation1
135.00 142.94 151.35 160.25 169.68
Cents per day per NMI – LV Smart Meter <40 MWh1 135.00 142.94 151.35 160.25 169.68
Cents per day per NMI – LV Smart Meter >40 MWh1 650.00 688.24 728.73 771.60 816.99
Cents per day per NMI – HV <750MWh1 307.08 325.15 344.28 364.53 385.97
Energy Charges (¢/kWh)
LV Residential Accumulation 10.105 10.699 11.329 11.995 12.701
LV Non‐residential Accumulation 10.455 11.070 11.721 12.411 13.141
LV Smart Meter 3.076 3.257 3.448 3.651 3.866
HV <750 MWh 3.076 3.257 3.448 3.651 3.866
Unmetered Supply ($/W)
Unmetered Supply 12hr operation 0.268 0.283 0.300 0.318 0.336
Unmetered Supply 12‐24hr operation 0.614 0.650 0.688 0.729 0.772
Demand Charges ($/kVA)
LV Smart Meter Peak2 20.000 21.177 22.422 23.741 25.138
LV Smart Meter Off Peak2 0.000 0.000 0.000 0.000 0.000
HV <750 MWh Peak3 9.449 10.005 10.593 11.216 11.876
HV <750 MWh Off Peak3 0.000 0.000 0.000 0.000 0.000
kVAr Charge ($kVar)
>40 MWh LV Smart Meter 4.000 4.235 4.484 4.748 5.028
>40 MWh HV 4.000 4.235 4.484 4.748 5.028
[1] National Meter Identifier which is allocated to each customer’s connection.
[2] The peak period rates apply to usage between 12 noon and 9:00pm on any weekday, including public holidays from 1 October through 31 March. Off‐peak period rates apply at other times.
[3] The peak period rates apply to usage between 12noon and 9:00pm on any weekday, including public holidays. Off‐peak period rates apply at other times.
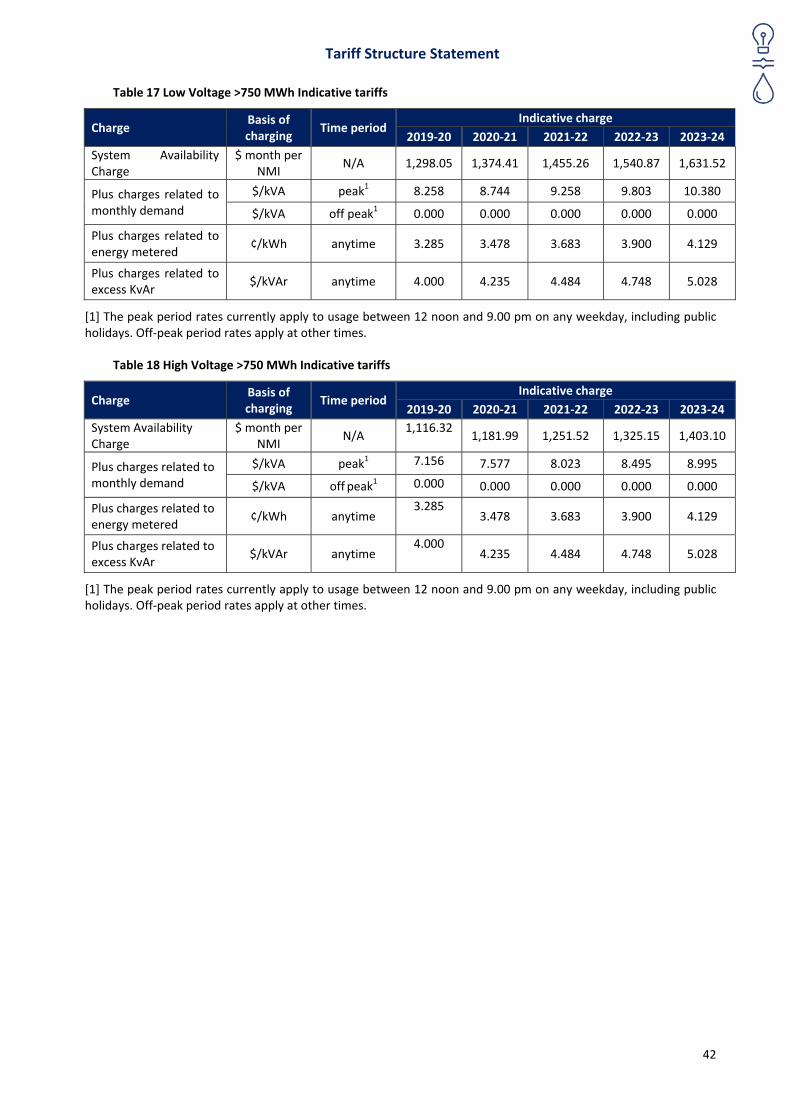
Tariff Structure Statement
42
Table 17 Low Voltage >750 MWh Indicative tariffs
Charge Basis of charging
Time period Indicative charge
2019‐20 2020‐21 2021‐22 2022‐23 2023‐24
System Availability Charge
$ month per NMI
N/A 1,298.05 1,374.41 1,455.26 1,540.87 1,631.52
Plus charges related to monthly demand
$/kVA peak1 8.258 8.744 9.258 9.803 10.380
$/kVA off peak1 0.000 0.000 0.000 0.000 0.000
Plus charges related to energy metered
¢/kWh anytime 3.285 3.478 3.683 3.900 4.129
Plus charges related to excess KvAr
$/kVAr anytime 4.000 4.235 4.484 4.748 5.028
[1] The peak period rates currently apply to usage between 12 noon and 9.00 pm on any weekday, including public holidays. Off‐peak period rates apply at other times.
Table 18 High Voltage >750 MWh Indicative tariffs
Charge Basis of charging
Time period Indicative charge
2019‐20 2020‐21 2021‐22 2022‐23 2023‐24
System Availability Charge
$ month per NMI
N/A 1,116.32
1,181.99 1,251.52 1,325.15 1,403.10
Plus charges related to monthly demand
$/kVA peak1 7.156 7.577 8.023 8.495 8.995
$/kVA off peak1 0.000 0.000 0.000 0.000 0.000
Plus charges related to energy metered
¢/kWh anytime 3.285
3.478 3.683 3.900 4.129
Plus charges related to excess KvAr
$/kVAr anytime 4.000
4.235 4.484 4.748 5.028
[1] The peak period rates currently apply to usage between 12 noon and 9.00 pm on any weekday, including public holidays. Off‐peak period rates apply at other times.
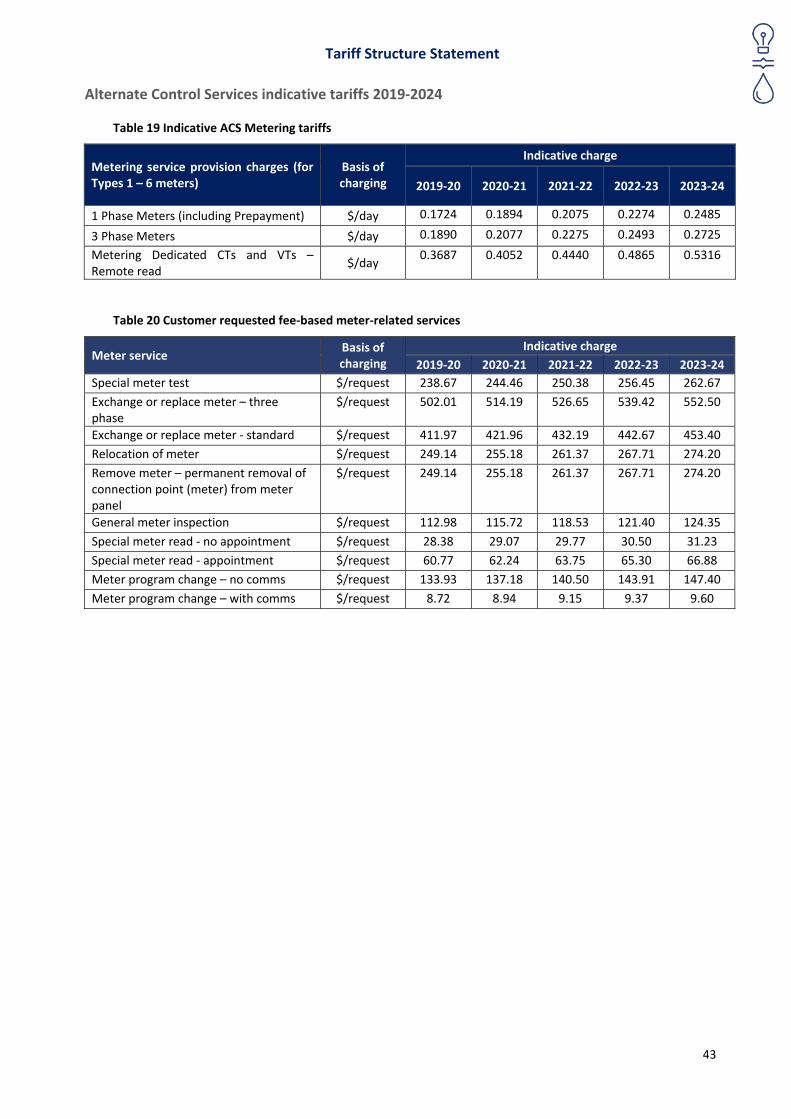
Tariff Structure Statement
43
Alternate Control Services indicative tariffs 2019‐2024
Table 19 Indicative ACS Metering tariffs
Metering service provision charges (for Types 1 – 6 meters)
Basis of charging
Indicative charge
2019‐20 2020‐21 2021‐22 2022‐23 2023‐24
1 Phase Meters (including Prepayment) $/day 0.1724 0.1894 0.2075 0.2274 0.2485
3 Phase Meters $/day 0.1890 0.2077 0.2275 0.2493 0.2725
Metering Dedicated CTs and VTs – Remote read
$/day 0.3687 0.4052 0.4440 0.4865 0.5316
Table 20 Customer requested fee‐based meter‐related services
Meter service Basis of charging
Indicative charge
2019‐20 2020‐21 2021‐22 2022‐23 2023‐24
Special meter test $/request 238.67 244.46 250.38 256.45 262.67
Exchange or replace meter – three phase
$/request 502.01 514.19 526.65 539.42 552.50
Exchange or replace meter ‐ standard $/request 411.97 421.96 432.19 442.67 453.40
Relocation of meter $/request 249.14 255.18 261.37 267.71 274.20
Remove meter – permanent removal of connection point (meter) from meter panel
$/request 249.14 255.18 261.37 267.71 274.20
General meter inspection $/request 112.98 115.72 118.53 121.40 124.35
Special meter read ‐ no appointment $/request 28.38 29.07 29.77 30.50 31.23
Special meter read ‐ appointment $/request 60.77 62.24 63.75 65.30 66.88
Meter program change – no comms $/request 133.93 137.18 140.50 143.91 147.40
Meter program change – with comms $/request 8.72 8.94 9.15 9.37 9.60
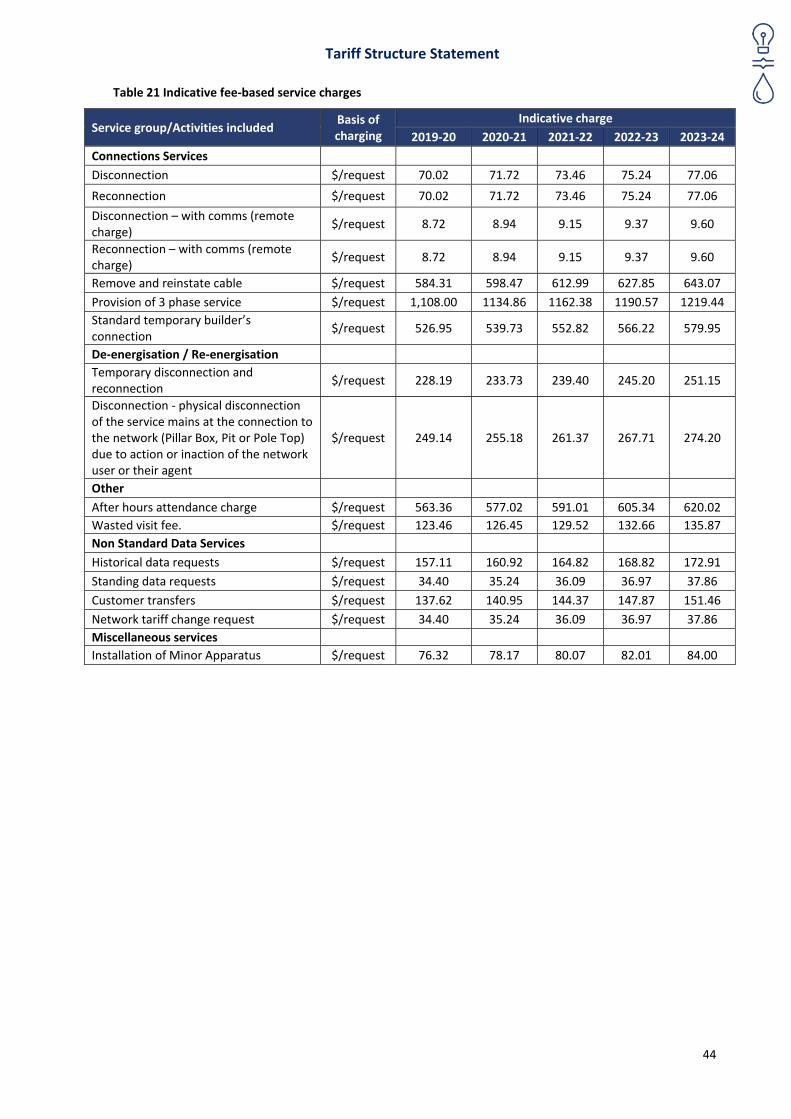
Tariff Structure Statement
44
Table 21 Indicative fee‐based service charges
Service group/Activities included Basis of charging
Indicative charge
2019‐20 2020‐21 2021‐22 2022‐23 2023‐24
Connections Services
Disconnection $/request 70.02 71.72 73.46 75.24 77.06
Reconnection $/request 70.02 71.72 73.46 75.24 77.06
Disconnection – with comms (remote charge)
$/request 8.72 8.94 9.15 9.37 9.60
Reconnection – with comms (remote charge)
$/request 8.72 8.94 9.15 9.37 9.60
Remove and reinstate cable $/request 584.31 598.47 612.99 627.85 643.07
Provision of 3 phase service $/request 1,108.00 1134.86 1162.38 1190.57 1219.44
Standard temporary builder’s connection
$/request 526.95 539.73 552.82 566.22 579.95
De‐energisation / Re‐energisation
Temporary disconnection and reconnection
$/request 228.19 233.73 239.40 245.20 251.15
Disconnection ‐ physical disconnection of the service mains at the connection to the network (Pillar Box, Pit or Pole Top) due to action or inaction of the network user or their agent
$/request 249.14 255.18 261.37 267.71 274.20
Other
After hours attendance charge $/request 563.36 577.02 591.01 605.34 620.02
Wasted visit fee. $/request 123.46 126.45 129.52 132.66 135.87
Non Standard Data Services
Historical data requests $/request 157.11 160.92 164.82 168.82 172.91
Standing data requests $/request 34.40 35.24 36.09 36.97 37.86
Customer transfers $/request 137.62 140.95 144.37 147.87 151.46
Network tariff change request $/request 34.40 35.24 36.09 36.97 37.86
Miscellaneous services
Installation of Minor Apparatus $/request 76.32 78.17 80.07 82.01 84.00
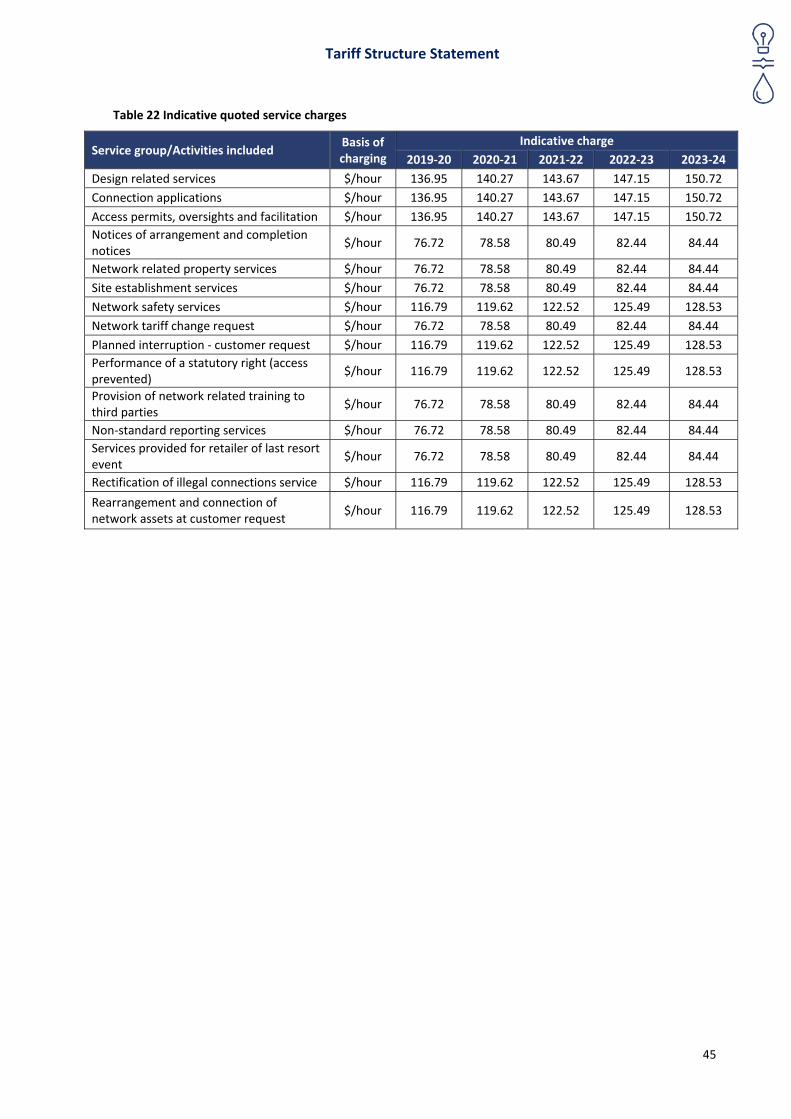
Tariff Structure Statement
45
Table 22 Indicative quoted service charges
Service group/Activities included Basis of charging
Indicative charge
2019‐20 2020‐21 2021‐22 2022‐23 2023‐24
Design related services $/hour 136.95 140.27 143.67 147.15 150.72
Connection applications $/hour 136.95 140.27 143.67 147.15 150.72
Access permits, oversights and facilitation $/hour 136.95 140.27 143.67 147.15 150.72
Notices of arrangement and completion notices
$/hour 76.72 78.58 80.49 82.44 84.44
Network related property services $/hour 76.72 78.58 80.49 82.44 84.44
Site establishment services $/hour 76.72 78.58 80.49 82.44 84.44
Network safety services $/hour 116.79 119.62 122.52 125.49 128.53
Network tariff change request $/hour 76.72 78.58 80.49 82.44 84.44
Planned interruption ‐ customer request $/hour 116.79 119.62 122.52 125.49 128.53
Performance of a statutory right (access prevented)
$/hour 116.79 119.62 122.52 125.49 128.53
Provision of network related training to third parties
$/hour 76.72 78.58 80.49 82.44 84.44
Non‐standard reporting services $/hour 76.72 78.58 80.49 82.44 84.44
Services provided for retailer of last resort event
$/hour 76.72 78.58 80.49 82.44 84.44
Rectification of illegal connections service $/hour 116.79 119.62 122.52 125.49 128.53
Rearrangement and connection of network assets at customer request
$/hour 116.79 119.62 122.52 125.49 128.53
Tariff Structure Statement
46
8 Glossary of Terms
Term Definition
ACS (charges) Alternative Control Services
AEMO Australian Electricity Market Operator
AER Australian Electricity Regulator
CAPEX Capital Expenditure
CCP Consumer Challenge Panel
DNSP Distribution Network Service Provider
GST Goods and Services Tax
GW GigaWatt
GWh GigaWatt hour
HV High Voltage
kV KiloVolt
kVA KiloVolt Amperes
kVAr KiloVolt Amperes reactive
kW KiloWatt
kWh KiloWatt hour
LRMC Long Run Marginal Cost
LV Low Voltage
MVA Megavolt ampere
MW MegaWatt
MWh MegaWatt hour
NEM National Electricity Market
NER National Electricity Rules
NMI National Metering Identifier
OPEX Operating expenditure
PV Photo Voltaic
Power and Water Power and Water Corporation
RoLR Retailer of Last Resort (Jacana Energy)
SCS (charges) Standard Control Services
TSS Tariff Structure Statement
WACC Weighted Average Cost of Capital
UC Utilities Commission


