
TARGETING HIGHER IN AGE
PREPARING THE RETAIL BUSINESS FOR THE NEW AGE
SENIOR SEGMENT
By
Sofia de Oliveira Serra Costa
Master Dissertation
in Marketing
Supervised by
Prof. Drª Catarina Roseira
Faculdade de Economia
Universidade do Porto
2009

It takes a long time to become young.
Pablo Picasso
i
Biography
Sofia de Oliveira Serra Costa was born in Oporto on 13 July of 1979. As a child, she
once said: “what a beautiful view, it looks just like a commercial.”
In 2002, she graduated in Economics in the Economics College of Oporto University.
Back then, her final project was already dedicated to stores’ physical attributes in
Oporto city.
Her professional starting point was in the consulting area at Sigma team consultancy till
2003. Since then, her professional career has been developed at Sonae Investimentos,
S.A., in the retail business. As a market analyst in several divisions, such as Light
Bazaar Commercial Division and the International Trade Division, her life has been
devoted to examining business trends to support management decisions.
In 2007, she enrolled in the Masters Degree of Marketing in the Economics College of
Oporto, where she started developing research about retail patronage in the fast moving
consumer goods context, for one special segment: the New Age seniors.

ii
Acknowledgements
I would like to express my gratitude to a group of people who helped to complete this
dissertation.
Firstly, I would like to thank the following six senior universities that participated in
this research, without whom this research would not have been possible: Academia
Sénior de Gaia, Universidade Sénior das Antas, Universidade Sénior Contemporanea,
Universidade Sénior da Foz, Universidade Sénior de Gondomar and Universidade
Sénior de Matosinhos.
I would like to show special appreciation to Dr. Artur Santos, Drª Marta Loureiro, Mr.
Rui Cupertino Miranda, Dr. Alcidio Jesus, Ms. Olga Esteves and Dr. António Torres for
being key connections with the senior universities’ reality.
I would like to recognize the importance of Prof. Paula Brito in this research, for
helping me find the light in the maze of meticulous numbers. I would also like to thank
Drª Sofia Veiga and Prof. Helena Santos for their insightful recommendations for the
empirical research approach.
I would like to thank my supervisor Prof. Catarina Roseira, for always challenging me
towards improvement and keeping me focused on the essential. Being supervised by her
was truly an inspiration.
I would like to thank my husband Paulo for not letting me forget the bright side of life
and giving 24 hour support to reconcile three years of a busy schedule.
Finally, I am profoundly grateful to my parents’ life example and their unconditional
help in all aspects of life. Being their daughter makes me wish to reach excellence.

iii
Abstract
The senior segment has long stood in the shadow, letting youth be the main subject of
most marketing actions and the center of attention of business strategy. However, the
recent western demographic trends lead to believe that the senior age group will rapidly
overcome the dimension of youth. Additionally, the senior segment gives evidence of
changing from a passive stereotype to a new proactive and dynamic profile that
influences the consumption pattern. This gives further importance to this segment:
besides increasing in number, it increases in consumption potential per head.
This exploratory research study acknowledges this fact and aims to integrate this
emerging change in the fast moving consumer goods retail context, presenting it as a
targeting challenge for retailers eager to adapt. For that reason, this investigation is
devoted to the retail patronage of the New Age seniors. More concretely, it focuses on
understanding the New Age seniors’ underlying motivations and attribute preferences,
when shopping for their groceries.
While attempting to detect differences between new age seniors and traditional seniors,
empirical support is provided about a lower tendency to enjoy bargaining and an
inferior propensity to exhibit an apathetic shopper profile. The exploratory cluster
analysis indicates that one possible way to classify New Age senior shopper typologies
is: busy and happy, majestic, basic, rational enthusiasts and hedonic enthusiasts. This
pattern is radically different from comparable clustering patterns presented in previous
research, for a more generalized age group population.

iv
Resumo
O segment sénior tem se mantido na sombra, dando a possibilidade à juventude de ser o
alvo da atenções favorito da maior parte das acções de marketing e estratégias de
empresa. No entanto, a recente têndencia demográfica nos países ocidentais leva a crer
que o segmento etário mais velho irá rapidamente ultrapassar a dimensão do segmento
jovem. Adicionalmente, o segmento sénior evidencia uma mudança do esterótipo
passivo para um novo perfil dinâmico e proactivo, que influencia por sua vez os padrões
de consumo. Isto dá ainda mais importância a este segmento: para além de aumentar em
número, ele cresce também no potencial de consumo por pessoa.
Esta investigação exploratória reconhece esse facto e pretende integrar esta mudança
emergente no contexto do retalho de produtos de grande consumo, apresentando-o
como um desafio de targeting para retalhistas dispostos a adaptarem-se. Assim sendo,
esta investigação é dedicada à definição de preferência de lojas de retalho pelo senior
New Age. De forma mais concreta, foca-se na compreensão das motivações para ir às
compras e importância dos atributos das lojas, para os séniores New Age enquanto
clientes de retalho.
Ao tentar detectar diferenças entre seniores New Age e seniores tradicionais, é fornecida
evidência empírica sobre a sua tendência inferior para apreciar negociação e a sua
propensão inferior para exibir um perfil the cliente apático. A análise de clusters
exploratória indica que uma forma possível de classificar os seniores modernos é nas
seguintes tipologias: atarefados e felizes, majestáticos, básicos, entusiastas racionais e
entusiastas hedónicos. Este padrão é radicalmente diferente do padrão de clusterização
comparável apresentado num estudo prévio, para uma população de escalão estário
mais generalizado .

v
Index Biography ......................................................................................................................... i Acknowledgements ......................................................................................................... ii Abstract ........................................................................................................................... iii Resumo ............................................................................................................................ iv
Index ................................................................................................................................. v Figures Index ................................................................................................................. vii Table Index ................................................................................................................... viii 1. Introduction ............................................................................................................. 1
1.1. The Relevance and purpose of the study ............................................................ 1
1.2. Dissertation Structure ......................................................................................... 2
2. Literature Review I: The Senior Segment ............................................................. 5 2.1. The impact of aging on consumer behaviour ..................................................... 5
2.1.1. Biological Changes .............................................................................. 6
2.1.2. Psychological Changes ........................................................................ 7 2.1.3. Economic Changes .............................................................................. 9 2.1.4. Social Changes .................................................................................. 10
2.2. A New Age for aging ........................................................................................ 12 2.2.1. Demographic trends ........................................................................... 12 2.2.2. Senior lifestyle changes ..................................................................... 16
3. Literature Review II: Retail Patronage ............................................................... 24 3.1. Retail Patronage Factors ................................................................................... 24
3.1.1. Product-related attributes ................................................................... 25 3.1.2. Store-related attributes ....................................................................... 28
3.1.3. Consumer Attributes .......................................................................... 38 3.2. Clustering Consumers ....................................................................................... 44
3.2.1. Apathetic ............................................................................................ 45 3.2.2. Enthusiasts ......................................................................................... 45 3.2.3. Destination Shoppers ......................................................................... 46 3.2.4. Basic Shoppers .................................................................................. 46
3.2.5. Bargain Seekers ................................................................................. 47
4. Methodology ........................................................................................................... 49 4.1. Research Questions ........................................................................................... 49
4.2. The senior concept ............................................................................................ 52
4.3. Focus groups Methodology .............................................................................. 54 4.4. Survey methodology ......................................................................................... 59
4.4.1. Questionnaire Design ........................................................................ 59
4.4.2. Data collection and response rates .................................................... 60 4.4.3. Measures ............................................................................................ 62 4.4.4. Data Analysis ..................................................................................... 64
5. Empirical Results ................................................................................................... 66 5.1. Focus Groups Results ....................................................................................... 66
5.1.1. Participants Profile ............................................................................ 66 5.1.2. Data Analysis ..................................................................................... 69 5.1.3. Conclusion ......................................................................................... 81
5.2. Survey Results .................................................................................................. 83 5.2.1. Sample Analysis ................................................................................ 83

vi
5.2.2. Results Validation ............................................................................. 86
5.2.3. Shopper Habits .................................................................................. 88 5.2.4. Age vs. Shopper motivations and attribute importance ..................... 94 5.2.5. Shopper motivations and attribute importance .................................. 96 5.2.6. Factor analysis ................................................................................... 98 5.2.7. Clustering Results ............................................................................ 103
5.2.8. Conclusion ....................................................................................... 111
6. Conclusion ............................................................................................................ 121 6.1. Overview and major findings ......................................................................... 121
Seniors will be seniors .................................................................................... 123 Tradition is not what it used to be .................................................................. 123
Segmenting a segment .................................................................................... 124 6.2. Managerial Implications ................................................................................. 125 6.3. Limitations and Suggestions for Further Research ......................................... 127
Bibliography ................................................................................................................ 129 7. Appendix .............................................................................................................. 138
7.1. Focus group questionnaire .............................................................................. 138 7.2. Focus Group quotations tables ....................................................................... 139
Price ................................................................................................................ 139 Product Selection ............................................................................................ 139
Quality ............................................................................................................ 140 Store Atmosphere ........................................................................................... 140 Staff ................................................................................................................ 141
Check-outs ...................................................................................................... 142
Store Image ..................................................................................................... 143 Attitude towards shopping .............................................................................. 144 Affiliation ....................................................................................................... 145
Antecipated utility .......................................................................................... 145 Choice optimization ........................................................................................ 146 Role enactment ............................................................................................... 146
Power and authority ........................................................................................ 147
7.3. Survey Questionnaire ......................................................................................... 148 7.4. Spearman Correlation ..................................................................................... 150

vii
Figures Index
Figure 1 | Magnifying Lens in German supermarkets ...................................................... 7 Figure 2 | The Companion ................................................................................................ 8 Figure 3 | Big button 100 Telephone............................................................................... 11 Figure 4 | Life expectancy in Portugal ............................................................................ 13
Figure 5 | Share evolution comparison: elderly vs. youth .............................................. 13 Figure 6 | Annual evolution of employment over 45 ...................................................... 15 Figure 7 | Over 60s changing looks ................................................................................ 17 Figure 8 | Senior Games .................................................................................................. 18
Figure 9 | Annual evolution of senior athletes in NASGA. ............................................ 19 Figure 10 | Portuguese senior universities annual evolution . ........................................ 20 Figure 11 | Diversity of people over 50. ......................................................................... 22 Figure 12 | Average effective age of retirement in Portugal. .......................................... 52
Figure 13 | Seniors registered in senior universities. ...................................................... 61 Figure 14 | Senior Universities location of the survey sample ....................................... 61 Figure 15 | Age group shares .......................................................................................... 66 Figure 16 | Gender shares ............................................................................................... 66
Figure 17 | marital status shares ...................................................................................... 67 Figure 18 | subjective average age by age groups ........................................................... 68
Figure 19 | Occupation shares ......................................................................................... 68 Figure 20 | motivations and attributes by focus groups relation strength ....................... 82
Figure 21 | Gender share comparison. ............................................................................ 83 Figure 22 | Age group share comparison. ....................................................................... 84
Figure 23 | education level share comparison. ................................................................ 84 Figure 24 |Occupation shares for the survey sample ...................................................... 85 Figure 25 | Declared activities’ frequencies for the survey sample ................................ 86
Figure 26 | Good parking lot vs car usage. ..................................................................... 87 Figure 27 | online shopping evaluation vs internet usage. .............................................. 87 Figure 28 | frequency of store visit for first choice and alternative store. ...................... 89 Figure 30 | Visited insignias absolute frequencies .......................................................... 91
Figure 31 | Visited insignias relative frequencies ........................................................... 91 Figure 29 | Satisfaction score by insignia ....................................................................... 92 Figure 32 | top of mind reason for choice of destination ................................................ 92
Figure 33 | top of mind reason by insignia. Relative frequencies. .................................. 93 Figure 34 | Descending trend of several item scores as objective age increases. ........... 95 Figure 35 | Ascending trend of several item scores as objective age increases. ............. 96 Figure 36 |Motivation component cluster analysis. Dendogram. ................................. 104
Figure 37 | Ultrametric distance and Ward’s R2
evolution as clusters increase ............ 105 Figure 38 | Cluster pattern Ganesh et al. (2007) vs. this study ..................................... 113 Figure 39 | Possible origins of research disparities ....................................................... 114

viii
Table Index
Table 1 | Weekly time spent in daily domestic chores .................................................... 14 Table 2 | Sample composition by senior university ........................................................ 62 Table 3 | Subjective average age by age groups ............................................................. 67
Table 4 | Shopping enjoyment vs. email usage. .............................................................. 88 Table 5 | visit frequency typology ranking ..................................................................... 89 Table 6 | retail type destination vs. car usage. ................................................................ 90 Table 7 | Total variance explained by component .......................................................... 98
Table 8 | original motivation items vs components correlations .................................... 99 Table 9 | Resulting motivation components and strongly related variables ................. 100 Table 10 | original attribute items vs components correlations .................................... 101 Table 11 | Resulting attribute components and strongly related variables ................... 103
Table 12 | clusters centroids by factor .......................................................................... 106 Table 13 | cluster centroids by questionnaire item ........................................................ 108 Table 14 | Cluster interpretation overview .................................................................... 110

Introduction
1
1. Introduction
When supplies run out at home, an immediate idea comes to mind: it’s time to
replenish. Then, the first decision might as well be “where”, which seems a rather
simple decision process… at least unconsciously.
In fact, deciding where to shop incorporates a never ending list of factors. What am I
searching for? Do I have budget constraints? How far is it reasonable to go? Even the
shopper’s identity influences this decision: gender, marital status, age, all can influence
the key motivations for shopping.
Putting oneself in the position of an elderly shopper, one might wonder: Does age
matter? Mark Twain once wrote: “Age is an issue of mind over matter. If you don’t
mind, it doesn’t matter.” The following study will precisely look into Mark Twain’s
thought and bear out if this is true. In other words, does age matter in shopping, even if
you don’t mind?
1.1. The Relevance and purpose of the study
The chosen theme uses a wide range of concepts and theories in the area of Marketing,
providing immediate academic relevance to this research. Focusing specifically in the
elderly fringe of population, it deals with marketing planning techniques, illustrating the
value of segmenting and targeting to better respond to the market. While studying how
the more mature consumer evaluates the distribution service, it explores the intersection
area of Consumer Psychology and Distribution. In the Consumer Psychology
perspective, it analyzes the impact of aging in consumers’ behaviour. For that matter
different domains are approached: from physiological to psychological aspects and from
economic to social changes. In the Distribution perspective, this study tries to lessen the
existing gap of services that don’t fulfil the real needs of this more demanding
consumer. To that purpose, this research intends to explore the patronage behaviour of

Introduction
2
seniors, by identifying the patronized stores, discovering their shopping motivations and
weighing the importance given to store attributes.
The subject of this dissertation also presents personal relevance, since it approaches the
student’s interest areas, such as market research and consumer Psychology. In
professional terms also, from the perspective of a market analyst of a distribution
company, this research intends to anticipate and develop a contribution in how to better
adjust the big retailers’ service to the Portuguese (and western most countries of
Europe) demographic changes.
Though this contribution is specially directed to the retail context where I develop my
professional activity and better accompany, the subject of the dissertation can enlighten
services that also relate with older segments of population. So, the dissertation may
present managerial relevance, given that more and more businesses will seek to serve in
a more satisfactory way the over 60s segment.
1.2. Dissertation Structure
Since this work focuses on retail patronage for seniors, the research begins with a
literature review treading into two separate directions: understanding the senior segment
and examining retail patronage, isolated from each other.
When analyzing the senior segment (Chapter 2), the first approach is considering what
changes in consumer behavior as people age. A wide set of transformations happen
after 50. From a biological and psychological, from economic to social, all layers of life
gradually modify and bring consequences in the way the senior perceives and reacts as a
shopper.
While these changes happen to most humans as they age, the next section explains how
ageing nowadays is detaching from the previous paradigm of what being a senior
means. Several factors are instigating “a New Age for ageing”. Differently from the

Introduction
3
past, demographic trends in western civilization are rising senior population share in a
more representative group. Becoming less of a minority, the relative increase empowers
this group as a whole. This is noticeable in active ageing politics and advancements in
science, which are directed to improve life over 50. Finally, senior lifestyle changes are
witnessed in all areas of life: aesthetics, sports, technology propensity, and attitude
towards change. The seniors cease to present themselves as static and become more
variable, unpredictable and the most diverse age group. Contrarily to the past, many life
events are possible to occur at this stage of life: divorce or (re)marriage, retiring or
beginning a new business. In consequence, this segment may display different
preferences and motivations from what was once observed and, above all, they may be
difficult to generalize as a whole single group.
The second theme reviewed was retail patronage, or in other words, understanding why
consumers shop where they do (Chapter 3). Aligning to previous academic research,
the retail patronage factors are presented as three groups: product-related, store-related
and consumer-related attributes. Firstly, product-related attributes such as perceived
product quality, price and assortment are analyzed. Secondly, store-related attributes are
scrutinized. Here are included considerations about convenience, service quality, store
image, atmosphere, personnel and fast checkouts. Last, but not least, the consumer’s
own attributes are evaluated. Their motivations are also influential in the patronage
decision. At this stage, Westbrook and Black’s (1985) proposition of shoppers’
motivations are presented. According to these authors the main drives of shopping are
power and authority, negotiation, anticipated utility, choice optimization, role
enactment, affiliation and stimulation. Since these attributes will have different
saliencies. For example, while for some stimulation may be a key driver, for others it
may be almost irrelevant. For that reason, it makes sense to try to cluster consumers into
homogeneous groups. In this phase, Ganesh et al. (2007) clustering results are
presented. For their 2007 research, which applied for all age groups and retail formats,
the clusters obtained were: Apathetic, Enthusiasts, Destination Shoppers, Basic
Shoppers and Bargain Seekers.
Introduction
4
The next challenge is to apply the retail patronage issue to the senior segment in
particular and identify if the same rule applies. According to Zinkhan and Pan (2006),
“no consensus exists about the relationship between shopper’s demographic profiles and
their patronage behaviour.” To guarantee that the seniors in the spotlight are
representative of the future senior segment, a bold assumption is taken: the sample is
made of students of senior universities, where the characteristics of the New Age senior
(as referred in literature review) are abundant.
After methodological considerations (chapter 4) the outcome of several focus groups is
examined. Besides a richer insight to the seniors’ reality, focus groups are used as
validity assurance for the following stage: the survey. Though limited in dimension and
of exploratory nature, the quantitative analysis intends to investigate in a more concrete
and accurate manner if the senior segment presents similarities or not with the general
population, in their preferences and motivations.
The results obtained in the empirical study (chapter 5) aim to improve the fit between
seniors’ needs and preferences and retail offerings. This fit will naturally happen over
time. However, the first to adapt will surely be at a good vantage point and regarding
the elderly may mean the survival of the fittest.

Literature Review I: The Senior Segment
5
2. Literature Review I: The Senior Segment
In marketing studies, products, services and people are constantly highlighted for their
differences. Brands, packages and labels are created to set them aside from the
remaining. Why do so with people too? Segmentation is in fact, labelling consumers.
But instead of having the purpose of better identifying what they offer (like products),
the focus is on what they need. In this context, senior segment will be now examined
and characterized. Only by deeply understanding seniors and their associated needs in
the retail context, is it possible to conclude if it is justifiable to call them a segment,
after all.
2.1. The impact of aging on consumer behaviour
Wrinkles should merely indicate where smiles have been.
Mark Twain, Following the Equator
There already exists extensive literature about the mature citizen, with a natural focus
on the areas of geriatrics and psychology. However, it is also possible to come across
diverse publications about the older person, as a consumer. Concurring with Yani
Gregóire (2003), there is already a lot of research centred on how the consumer changes
with aging, focusing mainly on the cognitive component, for example the alteration of
information processing. According to the same author, affective and behavioural
changes have been specially forgotten and there is still a long path to run in what
concerns the cause and effect relations between social, psychological and affective
aging and the consumer response (purchase decision, satisfaction, preference,
complaining, etc…).
In the ensuing section, several types of changes that come with aging will be pointed
out, along with innovative adaptations developed by companies that are responding to
needs and desires of an older segment. The reflection about this subject is of great
Literature Review I: The Senior Segment
6
importance: the strategy must be well calibrated in order to hit a segment that does not
appreciate being treated as old, without alienating the younger generation.
2.1.1. Biological Changes
Independently of the youthful attitude that the current senior may exhibit, there are
several biological changes that are difficult to disregard. To begin with, the five senses
go through modifications, with particular incidence on sight and hearing. Due to pupil
reduction, that limits the light captured by the eye, and the yellowing of the lens, the
older consumer starts facing sight complications, even perceiving colours differently.
Moreover, the hearing diminishes, hindering the communication abilities of the
individual.
Secondly, articulations, muscles and skin lose elasticity, which provokes changes in
mobility and appearance of the body as a whole. Even though this transformation is not
of a physiological nature, it brings penalties in emotional states (feelings of
vulnerability, insecurity,...) and social impact (interaction with community,…). In the
same way, menopause, which is primarily a biological change also influences women to
reassess their identity. According to Silvers (1997), women that experience this
compelling personal change fall into a segment of “New Me” life stage, together with
individuals experiencing a mid-life crisis or major careers. “With a new outlook on life,
New Me enjoy experimenting with new brands” and are more prone to investigate major
purchases meticulously.
Pak and Kambil’s study (2003) identifies several kinds of adjustments that aim to
respond to biological changes. Generally, it is important to invest in better facilities,
adding functions that can help overcome the difficulties previously referred to. For
example, Figure 1 illustrates a German retail chain that provides magnifier glasses to
amplify label information.

Literature Review I: The Senior Segment
7
These functions also undertake a better lighting distribution, lessening dazzle effect, and
simplifying and clearing signage and store decor. In a more frequent manner, it is
already possible to find several examples of product development (ex: fruit-catcher, an
extensible arm that helps to reach the top of a tree without taking risks climbing stairs)
and service redesign, to better handle the older segment. The Ford Third Age Suit is a
paradigmatic case of this. It was invented to feel the driving experience in the skin of an
older person. Weights and engines are used to restrict movement in key points as knees,
elbows, stomach and back, and other gadgets that simulate cataracts and reduce tactile
ability. Using this suit, Ford engineers are able to understand what it is like to have
more 30 years, to better design their vehicles, developing for example and eased access
(Pak e Kambil, 2006).
2.1.2. Psychological Changes
At a psychological level, changes are observed in the cognitive ability, in the
development of attitudes and even in emotional states.
At a cognitive level, memory and information processing abilities alter. These changes
can modify the way the older consumer searches information, compares alternatives and
behaves in the point of sale. Additionally, it also influences his brand awareness and
satisfaction after purchasing. (Pak e Kambil, 2006)
Figure 1 | Magnifying Lens in German supermarkets

Literature Review I: The Senior Segment
8
The information processing changes have great impact, not only in the service
evaluation, that become more rational, but also in how the customer enjoys it. For
example, attention changes reduce the ability to ignore noise or irrelevant stimulus,
whether they are visual, auditive, tactile or language related. In consequence, noisy
advertisements, that may be popular among younger consumers, will probably inspire
poor or even hostile response among the older segment. From another standpoint, an
unfamiliar setting, where the older consumer gathers less information in memory,
instigates a more cautious behaviour. This sense of vulnerability can be reduced in
diverse ways. On the one hand, solutions can be developed in the store setting, as
training the store staff to be more attentive to this issue. On the other hand, the solution
can also be designed inside the customer’s home. Given that this segment is not yet
widely introduced in on-line commerce, there are already some retail chains, like the
British Sommerfield that are investing in innovating projects. One of the most popular is
the Companion, an intelligent scanner (Figure 2), which sends automatically purchase
orders from home, via telephone or e-mail merely by passing a bar code label from the
supermarket catalogue or the cans the customer has at hand. (Farringhton, 2007)
Adding up to the different way of perceiving the surrounding atmosphere, the learning
pace too slows down with age. Nonetheless, according to Spotts and Schewe (1989),
“learning deficiency attributed to aging did not occur when the individual was allowed
to self-pace the information.” (Pak e Kambil, 2006)
Figure 2 | The Companion
Source: Farrington (2007)

Literature Review I: The Senior Segment
9
Bearing these ideas in mind, many adjustments can be carried out in the advertisement
and promotions area. Some of these are concerned with the selection of clear and easy-
to-remember messages; others focus on the development of occasions to detain
information at the customer’s own speed (giving preference, for example to written
advertisements, rather than to frenetic TV ads). More oriented to the store setting,
suggestions are made in the sense of eliminating distractions and irrelevant stimuli, as
for example reducing the background noise and creating a comfortable feeling, specially
in new circumstances, decreasing for example learning requirements.
2.1.3. Economic Changes
As customers and their relatives age, it is likely that saving, consumption and
investment patterns alter as well. The main economic change is the rising odd of
entering the retirement period. This change alone brings big opportunities in how to
interact with the older consumer. This may come from a greater satisfaction towards
grocery shopping (Buttle, 1992), or having a more experimenting pattern of
consumption derived from entering a “New Me” stage of life (Silvers, 1997).
Above all, retirement normally generates a trade-off between the relative availability of
income and free time. Once in a rush, shopping becomes an activity that may be
lingered or that can be done in different schedules from before. As McGoldrick (2002
pg 96) explained, “just as store selection criteria are person and context dependent, so
too is the extent to which “costs” may sometimes become benefits”. A typical form of
providing a good win-win situation for this segment is offering off-peak period
discounts. In the context of a busy retail store, this could be for example a discount for
visitors on weekdays’ mornings. Retirees would benefit since better prices would be
available, without a sacrifice (changing the visiting hour). The business would benefit
by avoiding crowding, assuring good service levels and achieving a better installed
capacity usage of the store (not having to hire extra staff and better use of staff in off-
peak period).

Literature Review I: The Senior Segment
10
Moreover, “people save in their early years to have stable consumption opportunities in
later life” (Pak e Kambil, 2006). This idea is supported by Franco Modigliani’s
consumption life cycle theory that defends that “people make rational, consistent,
intertemporal plans, that they act as if they are maximizing a utility function defined
over the periods of life” and that as a result, “consumption is proportional (…) to
average income over the life span”(Deaton, 2005). So, even though earnings tend to
decline with aging, consumption propensity may be sustained in a late age.
2.1.4. Social Changes
At last, social roles shifting over 60 still remain to be scrutinized. With the end or
diminishing of professional responsibilities, changes occur regarding social life style,
such as social meetings frequency, daily strolls, etc… These changes also bring out
variations in leisure consumption patterns, as tourism, dining habits, personal
healthcare, etc.…. This life style change, originated by retirement, normally comes
along with another change, in the family environment. Supposing the existence of
offspring, these may be entering a marriage or parenting period. Consequently, the over-
60 segment incurs in a new role: being grandparents. This fresh role frequently involves
them into new activities when attending grandchildren, as family activities and gift
purchases. Additionally, other situations drive this segment into a care giving situation,
such as taking care of a parent or an adult child that has returned to the nest. According
to the Silvers research (1997), these “continuing care givers” place a premium on
quality brands and merchandise, perhaps as a result of the added responsibilities.
However, not all of the senior segment is in this life stage. The older consumer may be
in an “empty nest” life cycle. Untied from the costs overload of providing for their
children that eventually became autonomous, the older consumer can now incur in
expenses that previously could not afford. Frequently, this is a stage of renewal of vows
with partner, which often is put into practice with second honey moons and a higher
devotion to the “nest”, refurbishing and redecorating their residence. Also called as
“free birds” (Silvers, 1997), this group tends to spend on “big ticket items that bring

Literature Review I: The Senior Segment
11
pleasure, such as automobiles or travel, and trades off by being cost conscious on
everyday goods.”
In a quite darker picture, social changes may lead to experiencing loneliness. This may
happen more acutely due to relations endings, such as death of partner or divorce, or
because of vulnerability feelings (e.g. perceived lack of self-competence, feelings of
inferiority) (Forman and Sriram, 1991). For these seniors in particular and lonely people
in general, they may seek social contact in their shopping routine (Youn-Kyung, 2005).
And when this assumption happens, replacing checkout assistants with self-service
checkouts (for a more efficient and quick service) can reduce the shopping experience
satisfaction (Forman and Sriram, 1991).
In a more relational angle, it is important to underline that, as “consumers are not
islands of preferences, it is important to understand how they are mutually connected
and influence the purchase of others” (Pak e Kambil, 2006). For example, the image
detained by the older consumer of a given store or brand, is certainly influenced by his
relations, normally rooted in the neighbourhood, family and sometimes childhood
friendships.
Consequently, managerial implications for this social component normally emphasize
the importance of understanding the preferences of the older consumer, inside his
Figure 3 | Big button 100 Telephone
Source: Baker (2008)
Literature Review I: The Senior Segment
12
network. It is highlighted the added-value of enhancing the connection between the
senior segment and family and friendships. This is the case of the product and service
improvement illustrated in Figure 3. The Big Button 100 Telephone, of BT, presents
larger buttons, a more ergonomic receiver, hands free function, adjustable volume, and
light signs for hearing challenged consumers. Similarly, in June 2009, a new computer
was released in Portugal by the partnership Tmn, Inforlândia, Caixa Geral de Depósitos
and Microsoft, to specifically match seniors’ needs and give them more accessibility to
the information technology. The keyboard and letters are bigger and the computer is
lighter and with fewer peripheral accessories. (Sol, 2009) Though these products are
oriented to an older consumer, Zoë Arden from BT expresses that “Inclusion is more
than addressing a particular group”, defending that by making life easy for this
particular segment, life is improved for all society in a broader spectrum (Baker, 2008).
2.2. A New Age for aging
2.2.1. Demographic trends
According to Instituto Nacional de Estatísica (INE) data, Portugal shows similar
demographic trends as other developed countries, such as the USA and the countries of
the European Union. A twofold population aging trend can be observed: more seniors
and less youth. In other words, on the one hand, the nativity rate is decreasing, with the
average of children per couple under 2, the minimum required to restore the current
population. On the other hand, subsequent of the improving of life conditions and
science developments, the average life expectancy has been rising, allowing a healthier
more long-lasting life.

Literature Review I: The Senior Segment
13
Figure 4 | Life expectancy in Portugal
Life expectancy in Portugal
2000/01 2001/02 2002/03 2003/04 2004/05 2005/06
Life expectancy at birth
Men 73,4 73,7 74,0 74,5 74,9 75,2
Women 80,4 80,6 80,6 81,0 81,4 81,8
Life expectancy at 65 years old
Men 15,6 15,7 15,7 15,9 16,2 16,3
Women 19,0 19,2 19,1 19,3 19,5 19,8
Source: INE - Res ident Population estimates and Demographic Statis tics unit: years
Source: INE (2007)
According to INE 2007 reports, for each hundred young people there were about 104
seniors in 2001. In 2006, the ratio grew to 112 seniors.1 For the future in the
medium/long run, estimates indicate that this trend might rise exponentially. If in 2000,
the proportion of young and seniors were even, rounding both 16%, for 2050 moderate
projections anticipate twice this share for the senior population, ca. 32% (Figure 5).
Whatever scenario awaits, the aging index is growing steadily. Pessimistic forecasts
anticipate that Portugal’s population might “achieve 395 seniors per each hundred
young people in 2050, that is to say, almost four times more comparing to year 2000
(102,2), doubling around 2025.” (INE, 2003).
Figure 5 | Share evolution comparison: elderly vs. youth
Source: INE (2003)
1 INE’s classification defines teenagers as aged bellow 15 and seniors above 65.
Population of youths and elderly 2000-2050 (according to different scenarios, in percentage),
Portugal
Youth percentage elderly percentage
Rejuvenating scenario aging scenario base scenario

Literature Review I: The Senior Segment
14
Still, this increase would not be relevant for the retail industry if seniors were not
decisive as actual shoppers. However, national statistics reveal that Portuguese seniors
over 65 still maintain a lot of their domestic tasks. From the figures (Table 1), it is
visible that the majority of women over 65 claimed to go for their groceries and spend
with this task more than one hour, every week. (Time Ocupation survey- INE, 2002).
Table 1 | Weekly time spent in daily domestic chores
Weekly time spent in daily domestic chores by seniors over 65, according to gender, Portugal 1999
weekly time spent men women men women men women men women men women men women
less than 0,5 hour 32,6 4,5 32,7 7,5 28,6 8,4 9,5 19,2 47,6 53,5 24,7 15,1
between 0,5 and 1 hour 25,3 11,9 22,8 13,7 31,1 15,8 16,1 17,9 28,5 28,6 28,6 24,9
between 1 and 2 hours 19,0 16,8 24,9 19,7 25,3 22,3 15,2 20,7 16,4 13,8 26,7 25,6
More than 2 hours 23,1 66,8 19,5 59,1 15,0 53,6 59,2 42,2 7,6 4,1 20,0 34,5
Source: INE, Poll to occupation of time
regular shoppingMeal preparation House cleaning clothing treatement gardening management
In addition to this fact, it is relevant to analyze if this segment that grows in number
may present significance in value as well. As it is of widespread knowledge, a major
part of Portuguese seniors are currently in poverty conditions. However, though
estimates are still inexistent, several reasons may justify a healthier financial situation
for the forecoming seniors, the baby boomer generation.
Firstly, confronting with younger generations, who face some frailty in their careers and
housing loans and interest rates that capture a big portion of their income, the generation
currently above 50 find themselves in a much more comfortable, as well as vigorous,
position. According to Roberts and Manolis, (2000), the senior segment emerging in the
present (baby boomers) displays a higher consumption propensity, since they “have
more money in retirement than any generation ever”, consequence of years of prosperity
accumulation. The bar graph (Figure 6) illustrates how the older active population in an
older age presents relevant and rising share.
Source: INE (2002)

Literature Review I: The Senior Segment
15
Figure 6 | Annual evolution of employment over 45
34.9%34.3%33.7%33.0%32.8%32.0%32.0%31.6%31.3%31.2%31.1%30.8%
6.2%6.2%6.5%6.5%6.4%6.2%6.4%6.4%6.2%5.9%5.7%5.8%
200920082007200620052004200320022001200019991998
Annual evolution of employement over 45 share%in total age groups employment
45 - 64 years 65 and more years
Source: INE statistical data (extraction in 2009)
Secondly, and to the opposite of the latter generation, this generation experienced life in
a prosperity environment, does not express as much propensity for savings. At last, it is
necessary to take into account that this is the generation with the greatest likelihood of
inheriting2, providing a new dimension to their available assets.
Facing this reality, it is to wonder how business has not yet explored conveniently the
opportunities that emerge from the rise of this older segment. Following this
perspective, the present dissertation is highly justified. Confining the research focus to
the retail business, this study intends to explore the potentialities not yet explored for
retail to adapt to the needs and expectations of its senior customer.
2 Since 30 is the approximate age for a Portuguese woman give to birth a child (valid for the last 5
decades) and Portuguese life expectancy has been around 83 years old (INE, 2009), it is reasonable to
estimate that in average people around 51 become heirs of their deceived parents.
Literature Review I: The Senior Segment
16
2.2.2. Senior lifestyle changes
Just as iron rusts from disuse, so does inaction spoil the intellect.
Leonardo da Vinci (1452 – 1519)
Gifted with an attitude of great autonomy people from this generation seem to be
making a change on what “being old” is all about and justify new names for the
concept.
From newspaper articles to academic papers, imagination doesn’t cease to flow:
Generation 50 plus, Mature Citizens, Third Ager Seniors, Grey Market, Golden agers,
Best Agers, Silver surfers are just some examples (Dobbelstein and Kleb, 2006).
The European Commission also concluded that the expression “third age”, a synonym
of old for the mainstream, was becoming inadequate, after a survey in 1992. Since the
life expectancy is growing, this institution suggested that a new “fourth age” should be
used for people over 75 (remaining the third age concept for people between 50 and 74)
(INE, 2002). And in fact, “Today, 50 is truly a mid-point, not an end point”, since
nowadays almost half of a person’s adult life is spent over the age of 50. (Silvers, 1997)
However, naming and relative age are not the only things changing. In fact, it is linked
to a deeper transformation that is being detected in today’s society. Comparing with
former generations, the present seniors perceive themselves very differently. Born
between 1946 and 1964 and experiencing childhood in the post-war prosperity period,
baby boomers are now turning 50. Although many are getting their retirements, “they’re
the first generation that doesn’t admit they’ve gotten old” (Green, 2003). Dychtwald
(1997) also stated that “Most boomers believe that old age will begin at 79 for them,
while they believe it started at 50 for their parents.” A survey to women over 50 reveals
similar conclusions: 87% say that they have nothing to do with their mothers at the
same age and 79% reject being labelled as “older” or “mature”. Additionally, 93% think
that false concepts prevail about their age group (Source: TNS global/Dove 32/08-Focus
nº461).

Literature Review I: The Senior Segment
17
Mathur (1998) found that “what they called the New Age elderly had a different value
orientation, being about 12 years younger than their chronological age.” Yet, it can be
argued if seniors’ self-perception corresponds to an actual change in their lifestyle or a
mere change of attitude towards age.
In a first perspective, it is visible that youthful appearance is more easily sustainable till
later in life. Confronting a recent image with a 16th
century painting (Figure 7), it is
possible to witness how two women both in their sixties largely contrast in appearance
(Dobbelstein and Kleb, 2006). Madonna, Sharon Stone, Michelle Pfeiffer, Pierce
Brosnan and Richard Gere are just some few examples of celebrities over 50 currently
considered beauty standards, increasing the average age of the public’s opinion beauty
rank (Focus, nº 461).
However, the referred senior changes go beyond the skin, superficial basis. Both
academic literature and practical evidence leads to believe that change is actually
occurring in seniors’ way of living. According to Brasseul (1981), elders are
increasingly more participative in cultural life and have a stronger need to feel socially
and culturally integrated; remaining active and up to date in numerous areas of
Mother of the painter Durher, 63 years old, in
1514
Singer Tina Turner 66 years old, presently
Figure 7 | Over 60s changing looks
Source: Dobbelstein and Kleb, (2006).

Literature Review I: The Senior Segment
18
knowledge.3 New-Age elderly are portrayed as feeling more in control of their lives,
more satisfied with their health and social life and feel they are more decisive
consumers, compared to traditional elderly (Mathur, 1998). Sherman et al. (2001)
describes the same group as being more skilful and knowledgeable consumers and
presenting significant differences regarding preferences and behaviour in travel and
leisure activities. Koutsky (2001) (cited in Gordon, 2002) also defends that “in the
future, matures are expected to be even more health conscious, independent, physically
active, educated, and well traveled than their predecessors, all of which make them
prime prospects for enterprising agents”.
Figure 8 | Senior Games
source: NASGA site
In sports, seniors are making a stand. In the United States, the National Senior Games
popularity is rapidly growing (Figure 9). It consists of a national not-for-profit
organization promoting healthy lifestyles for 50+ adults through education, fitness and
sport and is also a non-profit member of the United States Olympic Committee. In
August 2009, the Summer National Senior Games gathered 12,750 senior athletes in
San Francisco Bay Area. More than 800 events were contested over 16 day, in a wide
range of medal sports: Archery, Badminton, Basketball, Bowling, Cycling, Golf,
Horseshoes, Race Walk, Racquetball, Road Race, Shuffleboard, Softball, Swimming,
Table Tennis, Tennis, Track & Field, Triathlon and Volleyball (NASGA site, 2009).
3 Veloso, E. C. As Universidades da Terceira Idade em Portugal : Contributos para uma caracterização. IV Congresso
Português de Sociologia. All the indirect quotes in this dissertation result from rare cases of not finding the
original source.

Literature Review I: The Senior Segment
19
Figure 9 | Annual evolution of senior athletes in NASGA.
Source: NASGA site
In Portugal, seniors are also changing and becoming a lively segment of choices and
consumption. According to a Marktest study (2008), 71% are concerned about their
physical appearance and wellbeing. More than half confirmed using cosmetic products
(52%) and a big majority practices a physical activity (68%). Regarding leisure
activities and tourism, 44% of the seniors (between 55 and 74) interviewed declare to
travel (Marktest, 2009). Normally, they enjoy travelling with their family (70%) and 9%
of them choose thermal destinations or spas. According to Marktest (2008), the period
2001-2006 verified a growing trend of seniors taking vacation (in the previous year),
from 37.6 till 40.9%. But it is not only in taking vacation that Portuguese seniors reveal
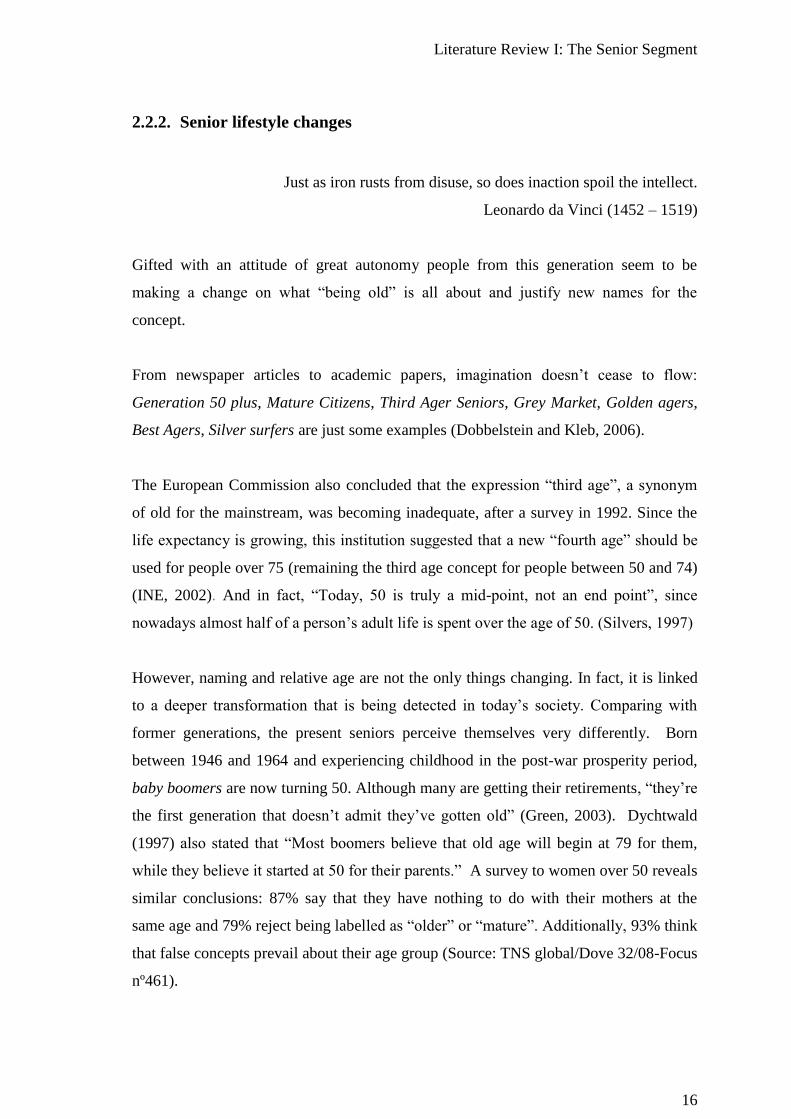
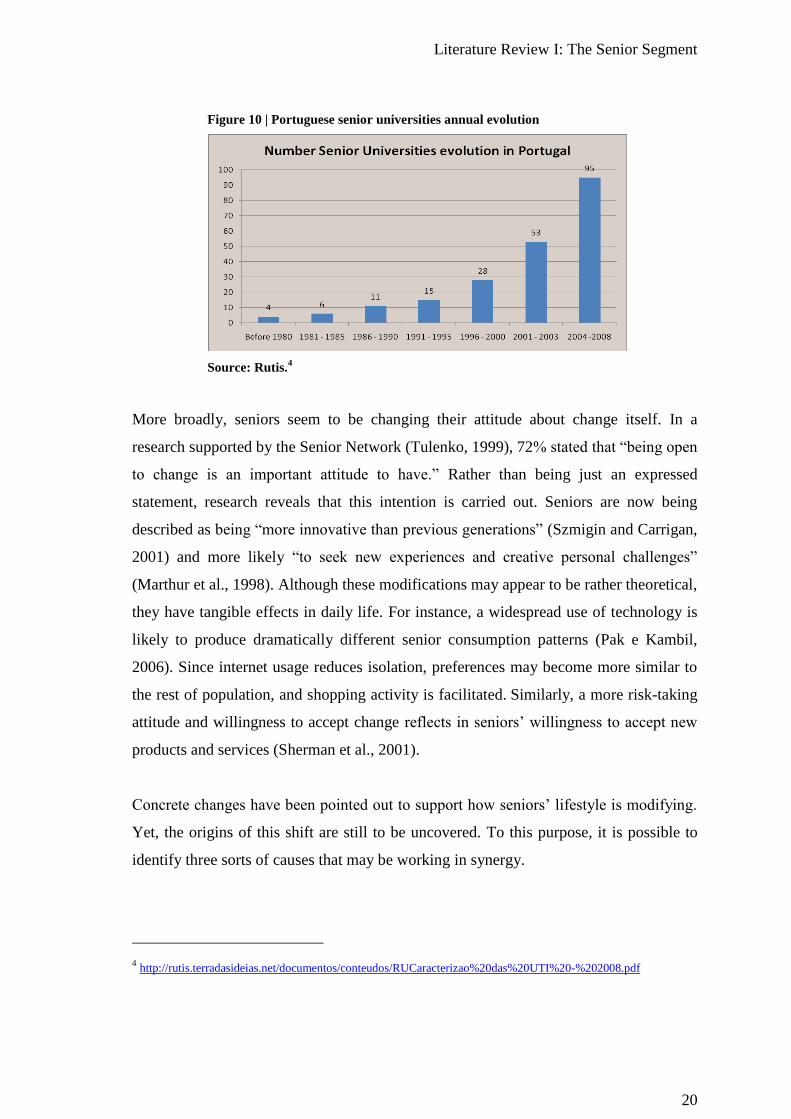
a significant growth. As the chart below clarifies, senior education faces a boom in
Portugal. According to RUTIS (U3A network in Portugal), since 2003 the number of
senior universities have nearly doubled (Figure 10).
Literature Review I: The Senior Segment
20
Figure 10 | Portuguese senior universities annual evolution
Source: Rutis.4
More broadly, seniors seem to be changing their attitude about change itself. In a
research supported by the Senior Network (Tulenko, 1999), 72% stated that “being open
to change is an important attitude to have.” Rather than being just an expressed
statement, research reveals that this intention is carried out. Seniors are now being
described as being “more innovative than previous generations” (Szmigin and Carrigan,
2001) and more likely “to seek new experiences and creative personal challenges”
(Marthur et al., 1998). Although these modifications may appear to be rather theoretical,
they have tangible effects in daily life. For instance, a widespread use of technology is
likely to produce dramatically different senior consumption patterns (Pak e Kambil,
2006). Since internet usage reduces isolation, preferences may become more similar to
the rest of population, and shopping activity is facilitated. Similarly, a more risk-taking
attitude and willingness to accept change reflects in seniors’ willingness to accept new
products and services (Sherman et al., 2001).
Concrete changes have been pointed out to support how seniors’ lifestyle is modifying.
Yet, the origins of this shift are still to be uncovered. To this purpose, it is possible to
identify three sorts of causes that may be working in synergy.
4 http://rutis.terradasideias.net/documentos/conteudos/RUCaracterizao%20das%20UTI%20-%202008.pdf
Literature Review I: The Senior Segment
21
The first group of causes for seniors’ change reside in elderly reactions to today’s
context. Due to a general improvement of the occidental way of living, starting with
better work and housing conditions till more cautious health habits, people are not just
living longer but also aging better. Major advancements in science are sustaining good
health more effectively and plastic surgery, cosmetics and nutritional supplements go a
step forward. In consequence, since by the time people retire, they still have about 20
more years to enjoy and self-evaluate themselves of being old increasingly later, their
retirement period has a rather different outcome, comparing with seniors in the past.
(Henseling et al., 2002)5
The second group of causes of seniors’ change may be resulting of an institutional effort
to promote active aging, integrated in a social development movement. According to the
World Health Organization, active aging is “the process of optimizing health,
participation and safety opportunities, in order to improve well being, as an individual
ages”. (Jacob, 2008) Since 1982 till 2007, United Nations has organized three Ageing
World Assemblies in order to promote the Active Aging Movement. Among the most
relevant aspects are the preservation of seniors’ multigenerational relations, the
encouragement of personal development through life (ex: Senior Universities), and the
incentive of seniors participation in society (ex: voluntary work, politics) (Jacob, 2008).
As well expressed by Abraham Lincoln, “in the end, it's not the years in your life that
count. It's the life in your years”. In the Portuguese context, a lot of changes have also
been observed in the third age policies. Before 1995, the government just invested in
social and healthcare actions in order to maintain elderly in their private residence, as a
form of prevention of higher costs associated with internment. In contrast, since 1995,
the third age policies extended their focus to promoting seniors’ dignity, consumption
and social interaction celebrating sporadically the Year of the Elderly, developing the
third age card and financing senior tourism, such as INATEL (Veloso, 2008).
The third group of causes of seniors’ change is a consequence of a major revolution in
life events timing that pushes all the traditional life stages years beyond. Some decades
ago, life seemed to be a clearly defined pathway of living that passed through investing
5 in Dobblestein and Kleb, 2006

Literature Review I: The Senior Segment
22
in education, getting a first job, marriage, setting up home, and having children.
Nowadays, people tend to stay longer in the educational system, careers are delayed as
well as autonomy. Consequently, marriage and children are also postponed.
Additionally, since divorces are more frequent, it is not rare anymore to see people in
their 40’s or 50’s, starting second families. (Silvers, 1997) Coincidentally, in 2002 the
Population Studies Services of Instituto Nacional de Estatística (INE) also recognized in
its publication “that the aging and seniors issues require a redefinition, an age
management restructuring”, calling for a replacement of the traditional life cycle that
was divided in 3 stages: education, work and retirement (INE, 2002).
All three groups of causes of seniors’ changes working together make people over 50
become much more unpredictable and diverse and “the patterns of behaviour are less
clear”. Nowadays, over 50s are embracing a wide diversity of projects, such as starting
a new family, taking care of grandchildren, caring for an elderly relative, thinking of
retirement, setting up a business, or even returning to full time education (Szmigin and
Carrigan, 2001). This diversity makes it difficult to classify over 50s into a single,
predictable mindset. According to Silvers (1997) people aged above 50 are as diverse
Figure 11 | Diversity of people over 50.
Source: Silvers (1997)

Literature Review I: The Senior Segment
23
(or more) as the under 50, in terms of life stage and consequently in terms of shopping
behaviour, about which is still so little known.
Summing up, in this chapter it was analysed how age changes biological, psychological,
economic and social aspects of the shopper’s life, which often originated vulnerability.
Though these changes are not possible escape from, recent generations of seniors are
facing a new era. On the one hand, demographic trends lead this segment to become a
bigger and more representative share of western population, which empowers them
subsequently. On the other hand, seniors are aging differently. Their attitude towards
age is remarkably different, and they are presenting a greater propensity to be
autonomous, dynamic and prone to learning. In consequence, they are more
participative in social and cultural life. Several causes could be identified as accountable
for this transformation: institutional effort in the active aging movement, the
improvement of living conditions, healthier habits and a higher life expectancy (which
turns people around sixty relatively younger) and the revolution of life events timings
(families are starting later, divorce and new jobs may happen anytime, etc..). All this,
turns people over 50 a very rich, diverse and above all unexpectable segment which
deserves to be studied for their emerging changes and consequent impact in the market
demand.
Literature Review II: Retail Patronage
24
3. Literature Review II: Retail Patronage
I went to a general store, but they wouldn't let me buy anything specific.
Steven Wright1
Retail patronage is about why people shop where they do (Tauber, 1972). In this
chapter, the aim will be to understand what variables influence the shopping decision,
not taking into account the specificities of the senior segment for now. The retail
patronage concept has been often applied as either shoppers’ store choice (Grewal et al.
2003;Kenhove et al. 1999; Woodside and Trappey 1992) or shopping frequency
(e.g.Darley and Lim, 1993; Korgaonkar et al. 1992). Being the practice as important as
the intention, Pan and Zinkhan (2006) consider both as the components of retail
patronage and this view will be adopted for this study as well.
3.1. Retail Patronage Factors
According to the same authors, in spite of decades of empirical research based upon
various predictors and a shopper’s retail patronage, the relations between them remain
unclear. This fact is to a great extent, due to differences in both direction and study
conditions (nature of samples, scales, etc…)
However, the meta-analytical study of these Pan and Zinkhan (2006) highlights a
consistent number of antecedents for retail patronage which they categorized in 3
groups of factors: product-related, market-related, and personal factors.
1 http://www.brainyquote.com/quotes/quotes/s/stevenwrig102574.html

Literature Review II: Retail Patronage
25
3.1.1. Product-related attributes
The first kind of attributes that influence which store the shopper will choose are the
ones related to the product itself. This issue is the immediate question that arises in the
shoppers’ mind: “what am I looking for?” Though stores tend to become similar in their
product range, perceived product quality, price and assortment still vary among them.
Perceived product quality
Perceived product quality was verified as having a positive relation with retail
patronage (Zinkhan and Pan, 2006; Darley and Lim, 1993). Yoo et al. (1998)
corroborates and states that “the perceived value of products affect shoppers’
contentment, pride, and satisfaction”, which in turn exert an indirect effect on store
attitudes.
In terms of meaning, perceived quality is defined by Zeithaml (1988) “as the
consumer’s judgement about the extent of superiority or excellence of the product”.
David Ford et al. (2006), also highlighted the subjective meaning of quality measuring it
by the “extent to which it actually solves a particular problem for a particular
customer”.
To infer quality, it is alleged that consumers use intrinsic and extrinsic cues. On the one
hand, intrinsic cues involve the physical composition of the product (for example,
flavour and color in beverages). On the other hand, extrinsic cues include other not
controllable aspects (for example, price and brand name). Extrinsic cues become more
important when quality is difficult to evaluate as in the case of experience goods such as
food products (Zeithaml, 1988). This clearly applies to the grocery context, since a wide
range of the merchandise are usually brand absent, such as vegetables, meat, fruit and
deli (Ou, W.-M., R. Abratt, et al., 2006).

Literature Review II: Retail Patronage
26
Price
Zinkhan and Pan (2006) verified that general price levels are predictors of retail
patronage, with a negative relation. This is justified by the fact that “a higher price
represents a monetary measure of immediate costs, which leads to a reduced willingness
to buy” (Dodds et al.1991; Walters and Rinne, 1986). Still, it is important to stress the
fact that this pattern is not as straightforward as it may seem, varying with purchase
context, consumers’ profile and companies strategy.
Examining the shopping context, low prices will be particularly relevant when the task
assumes buying large quantities or when purchases are regular (Kenhove et al., 1999).
Buying large quantities will make the store’s location less significant (fixed costs)
comparing to its price level (variable cost) (Tang et al., 2001).
Analysing the consumer’s attitude towards price, it is predictable that price undertakes a
negative role, influencing choice of stores with low prices. This may be observed
through price consciousness or through sales proneness. Price conscious consumers will
have a higher propensity to focus on low price as a major driver in their shopping
behaviour and will tend to choose store formats that implement low price strategies
(value department stores, off-price retailers, mass merchants and internet retailers).
(Moore et al., 2004) Similarly, sale proneness refers to the consumer propensity to buy
goods and services when they are offered at a sale price.
However, this expected negative role of price does not occur in all contexts. Sometimes
price is used as an indicator of quality, especially when other cues as brand and store
image are not available as diagnostic information. (Zinkhan and Pan, 2006) So, in this
case of the price/quality schema (Moore et al., 2004), price has a positive role for the
shopper. Another possible positive role occurs when shoppers act upon high prices as a
stimulus for purchasing behaviour. In this case of prestige sensitivity, Moore et al.
(2004) research statistically supports that shoppers will tend to avoid choosing store
formats that implement low price strategies.
Literature Review II: Retail Patronage
27
Finally, price may be managed in different formats, with different benefits for its
customers. This is the case of the two extreme formats EDLP (Every day Low Price) at
one end and HILO (Promotional Pricing) at the other. EDLP, relative to HILO, involves
providing lower prices in average, but also giving a smaller amplitude of price range.
HILO stores will have a higher price in average, normally justified by higher service
levels. However, the greater degree of price fluctuation typical of HILO stores can offer
the benefit of flexibility for shoppers that wish to stock up when the price is low (Tang
et al., 2001).
No price format may be perceived as dominant and Tang et al. (2001) suggest that the
coexistence of these opposite formats may be explained by one of two reasons:
consumer heterogeneity (different formats are targeting to different types of clientele) or
consumer adaptation (similar shoppers behave differently in different price formats).
(Tang et al., 2001)
Product Selection/Assortment
Assortment is another factor that can influence store patronage (Huddleston et al., 2004;
Zinkhan and Pan, 2006; Briesch et al., 2009; Yoo et al., 1998) and research has proven
that store choice decisions may be more responsive to this attribute than to changes in
price (Briesch et al., 2009). Assortment is usually evaluated by its breadth (number of
brands) and depth (numbers of stock keeping units, also known as sku). However,
Briesch et al. (2009) defended that assortment should also be measured by availability
of a household’s favourite brands, given its power of predicting store choice.
Besides giving the benefit of variety for itself, contributing for the hedonic value of
shopping, a wide product selection “can also minimize the perceived costs (e.g. travel
time, effort) associated with each shopping trip and the ease of the shopping task (e.g.
by enhancing comparison shopping).” (Zinkhan and Pan, 2006) Additionally, a greater
diversity of alternatives enhances the probability of a better fit between consumer
preferences and the available selection. (Chernev et al., 2009)

Literature Review II: Retail Patronage
28
However, larger assortments are not always preferred. Briesch et al. (2009) suggested
that shoppers prefer different assortment characteristics, which may result for example
from different trade-offs between travel distances and attractive assortments. It may also
be consequence of different purchase contexts, given that wide product range is
particularly relevant when the shopper’s task is shopping for new ideas or purchasing
material for a difficult job (Kenhove et al., 1999). Another justification is given by
Chernev et al. (2009) who pointed out that choosing from larger assortments is
associated with greater cognitive effort in evaluating choice alternatives and greater
difficulty in making a choice. According to these authors’ research, the benefit of
increasing assortment size will be more relevant when assortments comprise relatively
less attractive options. Inversely, the marginal benefit of bringing more attractive
options to an already big assortment will be modest.
3.1.2. Store-related attributes
As Tauber defends (1972) “People’s motives for shopping are a function of many
variables, some of which are unrelated to the actual buying of products”. He suggested
that beyond the mere economic exchange, people also shop for self-gratification, role-
playing, diversion, learning new trends, sensory stimulation, among other motives.
Rather than focusing only in the range of products offered, nowadays stores per se are
also taken into account as an attraction factor for the consumer. This point of view of
shopping enhanced the responsibility of the store, which must maximize the hedonic
value of shopping.
For that matter, extensive research has been done about why consumers patronize one
store and not another. “Reasons for selecting a store are normally expressed in terms of
the positive attributes which help to fulfil shoppers motives” (McGoldrick, 2002 pg.92)
Literature Review II: Retail Patronage
29
A wide list of popular attributes emerges in research such as convenience, location,
value for money, and so on. Value for money, for instance has implicit a trade-off
between money and a “benefit”, which in supermarket shopping may represent variety,
service, facilities, quality, nutrition, convenience or even freshness (Bishop, 1984;
Doyle, 1984; Schechter, 1984)2.The list of attributes of Pan and Zinkhan’s meta-
analytical study (2006) were elected to serve as a structural grid of testing for this
research since they resulted of gathering the most popular and statistically verified
attributes found in academic literature at that time.
Convenience
In Zinkhan and Pan’s research (2006), convenience was validated as being an influential
variable for predicting retail patronage. Being a blurred term, usually just associated
with location and parking facilities, convenience is in fact a mirror for non-monetary
costs that customers wish to avoid. Berry et al. (2002) conceptualized service
convenience as “consumers’ time and effort perceptions related to buying or using
service.” The authors state that, while time has had a profound exploration, physical and
emotional effort have had little attention. However, effort deserves consideration since it
can be related to a wide range of factors: stairs, crowds, exposure to weather, large car
parks, awkward trolleys, bad layouts and long aisles. All these increase effort.
According to the Berry et al. (2002) model, this attribute falls into 5 types of
convenience associated with the service purchase activities: Decision convenience,
Access convenience, Transaction convenience, Benefit convenience and Post-Benefit
convenience.
Transaction convenience relates to time and effort that the customer invests in the
transaction stage of the service. Since in retail this occurs specially during checkout, this
type of convenience will be detailed later on, as another attribute, following the
structure of Zinkhan and Pan’s research (2006).
2 in Sihori et al.(1998). These indirect quotes result from rare cases of not finding bibliography in the
original source.
Literature Review II: Retail Patronage
30
Decision Convenience is related to the time and effort that the customer dedicates in
several choices that have to be made about the service. Choosing the service provider
and the products can involve a certain level of uncertainty. This brings our attention to
another non-monetary cost: Risk. According to McGoldrick (2002), “a risk perception
comprises an evaluation of the probability of an unwelcome outcome, combined with
the likely consequences of that outcome”. Berry et al., (2002) proposed that uncertainty
is heightened in labour-intensive services, because outcome variability is more expected
(e.g. hairdressers). However, retail services are also applicable contexts for risk.
Deciding on a store or a product may provide a totally different outcome when it comes
to price or perceived quality. Consequently, one manner to offer decision convenience
is for example guaranteeing twice the money back if the customer finds cheaper in
competition, or making it easy to compare prices and product technical specifications
between alternatives.
When talking about the ease of the service delivery we are talking about Access
convenience. Access is the result of simplicity to contact or visit the service provider.
Contact can be facilitated by a free number to dial, by a speedy online site and home
delivery. An easy visit to the store depends, among others, on its location, operating
hours and parking lot. Proximity of the store is particularly relevant when the shopper’s
task is an urgent purchase or regular purchases (Kenhove et al., 1999), which is the case
of supermarkets. For example, a central location with low driving time associated can
reduce the transaction costs associated with shopping (e.g., transportation cost, time
spent) (Pan and Zinkhan, 2006)
However, recent trends show that peripheral areas are also attractive because they offer
another type of convenience: free and spacious parking lot. According to Waerden et
al. research (1998), the decision of choosing a supermarket is influenced by the
associated parking lot characteristics, such as location, tariff, design and scale.
Unexpectedly, although a reasonable number of parking spaces are necessary to provide
accessibility, the same research has found that “the probability of choosing a parking lot
decreases with an increasing size, suggesting that customers want to avoid long walking
distances”

Literature Review II: Retail Patronage
31
When talking of benefit convenience, the focus moves to the effort and time that the
customer spends when experiencing the benefit of the retail service. Assuming that the
core benefit of a given customer is the “one-stop” shopping, then retailers provide
benefit convenience, when supplying a large agglomeration of goods and services. If,
however, a given consumer has mobility problems, walking along big aisles may
represent an undesirable effort and consequently a big benefit inconvenience.
Finally, Post Benefit convenience refers to the effort and time spent after the benefit
experience and is mainly associated to product repair, maintenance or exchange. For
retail context in particular, this type of convenience is increased with trouble-free
refunds when returning a product.
Service Quality
Cronin et al. (2000) recognized both direct and indirect relationships between service
quality and (re)patronage intentions. Additionally, this attribute may reveal a greater
importance due to its influence in other attributes. For example, according to Sihori et
al. (1998) “service quality is by far the most critical determinant of merchandise quality
perception.” According to Kenhove et al. (1999), good service is particularly relevant
when the shopper’s task is searching for new ideas.
When examining service quality literature, the SERVQUAL scale and the Gaps model
are two works of distinction. SERVQUAL scale (Parasuraman et al., 1988) is the
leading scale to measure service quality, by calculating differences expectation and
perceptions (gaps) for 22 attributes (reduced from the original battery of 97 service
attributes). These 22 items are grouped into five dimensions: reliability, assurance,
responsiveness, empathy and tangibles. Equally dominant in this area is the Gaps
Model, which analyses these gaps in a more qualitative manner, by detailing the gaps in
6 types and locating the gap origin. Besides the gap between what is expected and what
is perceived by the customer, this model goes deeper identifying others, such as gap
Literature Review II: Retail Patronage
32
between service delivery and service perception or management perceptions of
expectations and actual expectations.
For the retail context, however, the SERVQUAL scale does not reflect adequately the
product service mix, since it was developed for “pure” service settings, such as banking
(McGoldrick, 2002). An adapted SERVQUAL for this branch of business was proposed
by Dabholkar et al. (1996). According to this author, Retail service quality dimensions
are the following: Physical aspects, Reliability, Personal Interaction, Problem-Solving
and Policy.
Physical aspects relate with two attributes already examined separately: appearance and
convenience. Reliability reflects keeping up with promised service and timings and
performing well (e.g. available stock when needed). The Personal Interaction stands for
helpfulness and courteousness and confidence inspiring. This dimension is linked to the
Personnel attribute (to be developed next), but also includes feeling safe to purchase in
the store, clear communication of service timings. Policy essentially embodies
convenience aspects such as operating hours, parking convenience and credit card
acceptance. Finally, Problem-solving includes mainly after-sales issues such as
willingness to handle returns and exchanges and dealing with complaints. These issues
were also stressed as important by Yoo et al. (1998). According to these authors,
meeting shoppers’ expectations on after-sales services generates positive emotional
states, such as pleasure, pride, attractiveness, and contentment, which in turn relate with
the outcomes of store attitudes, namely shopping intentions (Donovan and Rossiter,
1982).
Personnel
The personnel attribute intends to highlight the power of the human factor, in
differentiating stores. According to Zinkhan and Pan (2006), friendliness of personnel
presented high correlations with store choice. They hypothesize that “the desire for
human interaction thus may drive some shoppers to stores in which they find
salespeople friendly and communicative.” However this is not a recent idea. More than

Literature Review II: Retail Patronage
33
three decades before, Tauber (1972) already defended that “some consumers enjoy
talking to and socializing with others during a shopping visit and seek a social
experience outside home “. And 15 years before that, Martineau’s qualitative research
(1957) already noticed that “even in the grocery chains that have no salesclerks, women
will talk about the checkers and the stock boys, whether they are friendly or indifferent,
cooperative or brusque.”
What puts the personnel attribute apart from the rest may be its emotional nature. As
Yoo et al. (1998) explained “shoppers reported feeling pleased, excited, content and
attractive in the hands of kind and competent salesperson. However, treatment by a
salesperson that lacked these characteristics made them feel anxious, nullified, angry,
and displeased.” These emotions in turn, influence shoppers’ store attitudes.
But not only does the salesperson’s inside count. According to Solomon (1985), the
salesperson’s clothing also influences patronage intentions in various forms. The author
defends that the salespersons’ uniform is a potent medium to communicate desirable
service attributes. Besides differentiating the service team, employees’ clothing sends a
message. By assuming the properties and ideals of the company it represents and
reduces risk perception, because the customer interprets the uniform as the company
responsibility entrusted in the salesperson.
Store Image
Store Image describes the consumer’s overall impression of a given store (Doyle and
Fenwick, 1974). It is important, though, to underline that “consumers tend to make
judgements about stores on the basis of their subjective impressions (e.g. ambient
design , social factors).” (Baker et al. 1994). The subjectivity comes from two origins.
Firstly, it is the result of individual information-processing. “The retail environment
offers a multitude of stimuli that can serve as cues to consumers looking for
information-processing heuristics” (Baker, 1994). However, the customers’ perception

Literature Review II: Retail Patronage
34
is not the complete and complex collection of these dimensions, but instead a reduction
of these attributes into manageable proportions (Lindquist, 1974).
Secondly, subjectivity comes from intangible factors. Store image or store personality is
“the way in which the store is defined in the shopper’s mind, partly by its functional
qualities and partly by an aura of psychological attributes” (Martineau, 1957). Also,
some authors add more intangible factors, such as self-image congruency (Martineau,
1957; Doyle and Fenwick, 1974), advertisement and social class appeal (Martineau,
1957), store reliability (Myers, 19603), and reputation (Martineau, 1957; Ou, W.-M., R.
Abratt, et al., 2006) and conservative-modern projection of the store (May,1971)4 .
Psychological attributes may be a sense of belonging, the feeling of warmth or
friendliness, excitement or interest (Lindquist, 1974). According to Martineau (1957)
attributes of this nature are escalating in importance, as a result of the decline of
personal contact. The author hypothesizes that the shopper tries to compensate personal
distance by personifying the store, that becomes a symbol to which the shopper can
form deep attachments.
Self-image congruency is the preference customers give to stores that better mirror the
image they perceive about themselves (Doyle and Fenwick, 1974). The more the store
has their pretended image, the more they are willing to associate their image with.
Regarding advertising, impressions come from the physical appearance, general tone,
style and words of the advertising. “Just as we instinctively make judgements about
another person from his clothing and his mannerisms, so does the shopper believe she
can abstract symbolic cues from the advertisement” (Martineau, 1957). Nevertheless,
Martineau (1957) pointed out the importance of coherence between the symbolic
meaning of the advertising and the personality of the store itself.
3 In Lindquist, 1974
4 In Lindquist, 1974
Literature Review II: Retail Patronage
35
Reputation in turn, can be characterized by emotional appeal, products and services,
vision and leadership, workplace environment, social and environmental responsibility,
and financial performance (Ou, W.-M., R. Abratt, et al., 2006).
Martineau (1957) defended that “unless the store image is acceptable to the shopper,
price announcements are meaningless.” The power of store image for predicting retail
patronage has been supported in several researches. Zinkhan and Pan (2006), support
that store image is a predictor of the frequency of visits to a given store, rather than
store choice per se. Furthermore, Ou, W.-M., R. Abratt, et al., (2006) verified
statistically that the retailer reputation has a significant influence in retail patronage
though always moderated by demographic groups. In other words, the influence is not
visible in a uniform manner but is instead located on certain demographic groups, such
as shoppers with higher income, with lower education or higher ages.
Store Atmosphere
Initially included as a component of store image, store atmosphere used to be
conceptualized in research as a single attribute, such as “good” atmosphere (Donovan
and Rossiter, 1982). But for the last decades, store atmosphere gained autonomy and
multidimensionality, referring to a wide set of physical attributes, such as lighting,
signage, layout, store décor, rest areas, temperature and an endless list of other
dimensions. Though sometimes such dimensions may be totally imperceptible, they
may have profound effects on the shopper’s behaviour (Russel and Snodgrass, 1987)5.
Environmental psychologists have long defended that individuals react to places
(stimuli) with emotional states that may vary in pleasure and arousal intensity. And in
consequence of these emotional states they respond with two general, and opposite,
forms of behaviour: approach or avoidance.
5 Bitner, M. J. (1992). "Servicescapes: The Impact of th Physical Surroundings on customers and
Employees." Journal of Marketing 56: 57-71.
Literature Review II: Retail Patronage
36
Specifically in retail environments, several studies have focused on these consumers’
approach-avoidance behaviours in retail settings. Relations were established between
store-induced pleasure and approach behaviour (including spending behaviour) and
arousal was proven to be an amplifier of approach behaviour in pleasant environments
and of avoidance behaviour in unpleasant environments (Donovan and Rossiter, 1982).
Learning about the powerful relationship of emotional states and behaviour induced
researchers to study the effects of atmosphere manipulation. For example, Grewal et
al.(2003) study supports that classical music had a positive effect on store atmosphere
evaluations, which was demonstrated to be a powerful predictor of store patronage
intentions. Donovan and Rossiter (1982) also defend that in a store that cannot be made
pleasant, “then the arousal level should be kept low through the use of subdued lighting,
spaced displays, and relaxing music” while in a pleasant store, arousal levels may
increase approach behaviour, by bright lighting and upbeat music.
To the opposite, the shopping environment may also lead to avoidance behaviour
towards the store. Based on qualitative study, D’Astous (2000) developed an extensive
list of perceived irritability of components of the shopping environment. Some of the
irritants were associated with the store design, for example changing of the items
arrangement or being unable to find what one needs. There were also identified several
factors regarding the “ambient” (“background features (…) that affect human senses”),
such as bad smell in the store, high temperature, loud music and unclean store.
However, the highest rating of irritability was linked to the social component of the
environment, with special focus on crowding. Besides damaging the shopping
experience, crowding leads customers to having higher waiting expectations in-store,
which has a negative influence in patronage decisions (Grewal et al, 2003).
Bitner’s (1992) research also gave relevant contribution to store atmosphere being state
of the art. Besides structuring taxonomy for the store’s environment elements, Bitner
also highlighted other several strategic roles of the store atmosphere. Besides the
immediate effects on the costumers’ mood, the serviscape, as called by the author, may
have a facilitating role by aiding or hindering the ability of customers (e.g. the floor
Literature Review II: Retail Patronage
37
plan helps orientation ability). Finally, since the store atmosphere provides “a visual
metaphor for an organization’s total offering”, it influences the overall store image,
signalling the intended target and detaining a differentiating role. The dimensions of the
servicescape, as stated by Solomon (1985) for other visual service cues, act as a
package. Similar to a product's package it conveys an image and implies the potential
usage and relative quality of the service.
Fast Checkouts
In Zinkhan and Pan (2006) research, Fast Checkouts is one of the highlighted attributes
validated as influencing retail patronage. Similarly, according to Grewal et al. study
(2003), wait expectations are a strong predictor of store patronage intentions (negatively
related). Consequently, the less the wait that a person expects, the greater the will to
visit a given store.
However, promising fast checkouts without being able to keep the promise makes the
waiting experience more intolerable, and leads to great dissatisfaction (Haynes, 1990).
To avoid such scenario, the straightest solution for providing a time-saving service is
hiring more staff or developing technology, such as self-checkouts, which requires
considerable investment. But will this time-saving effort always assure customer
satisfaction?
“Actual time is a finite quantity; perceived time can either be stretched or compressed”
(Haynes, 1990). In other words, though the attribute Fast Checkouts may seem as an
objective variable measured by minutes spent in line, perceived check-out time may be
quite variable.
Influencing these perceptions are several factors. Firstly, check-out speed of service will
have different importance, depending on the context of purchase. According to
Kenhove’s study (1999), a quick service is particularly relevant when the shopper’s task
is an urgent purchase.

Literature Review II: Retail Patronage
38
Additionally, in Haynes study (1990) numerous reasons are connected with the
perceived time of waiting, such as: degree of control/choice over the wait; level of
distraction during the waiting process (e.g. reading magazines at the checkout will make
the experience more tolerable); waiting uncertainty; value of the outcomes of the wait;
fairness of queuing system; perceived waiting progress; among others.
Finally, and decisive for this research, customers’ time availability also influences their
perceptions. As Haynes defended (1990) two customers that experience the same
service wait, may be paying different prices if they present different time/money trade-
offs. Different segments of consumers, with more or less time poverty, will therefore
value this attribute in a different manner.
3.1.3. Consumer Attributes
To explain store choice, it is crucial that, both store attributes as well as shopper
attributes are captured. As Tripathi and Sinha (2008) defended, “looking at the store
attributes in isolation is looking at the supply side (what the store offers), and not on the
demand side (what the shopper is looking for).”
Investigation leads us to believe that each attribute can be more or less important,
depending on the shopping/shopper situation. Consequently, the place, the period and
the purpose will influence what the shopper values. For example, in sales period, the
decrease of normally important attributes levels, such as order and small queues, are
tolerated in benefit of price reduction. Also, if a purchase is of an urgent nature, the
store’s proximity is more important than its atmosphere. However, if the purpose of the
store visit is more about getting ideas and new trends, atmosphere gains importance.
Besides the impact of these transitory shopper situations, more enduring attributes
related to the consumer influence their patronage behaviour. Gender, group status,
levels of dependency and life-stages are some aspects already demonstrated to generate

Literature Review II: Retail Patronage
39
differences in store selection criteria (McGoldrick, 2002). Different consumer profiles
present different drivers for shopping.
In respect to motivations for shopping in particular, a lot can be found in academic
literature. Besides the utilitarian purpose, several authors defend that shoppers are often
motivated by role playing (Tauber, 1972 and Piper and Cappella, 1993), diversion or
flow (Tauber 1972;Buttle, 1992; Bloch et al., 1994), self-gratification (Tauber, 1972),
cure boredom (Mano, 1999) and loneliness (Forman and Sriram, 1991), general mood
repair (Elliott, 1994), learning about new trends (Tauber, 1972 and Bloch et al., 1994;
Korgaonkar et al., 1985), physical activity (Tauber, 1972 and Bloch et al., 1994) or
sensory stimulation (Tauber, 1972 and McGoldrick and Pieros, 1998). Moreover,
Tauber (1972) hypothesized five more social motives: social experiences outside the
home, communication with others having a similar interest, peer group attraction, status
and authority, and pleasure of bargaining.
In an attempt to synthesize this wide range of motivations, Westbrook and Black (1985)
developed a new shopper taxonomy. Using factor analysis techniques the initial 17
items proposed were reduced to seven dimensions: Anticipated utility, Role Enactment,
Negotiation, Choice Optimization, Affiliation, Power and Authority, and Stimulation.
Anticipated Utility
This motivation is related to the “expectation of benefit or hedonic states which will be
provided by the product(s) to be acquired through the shopping activity.” (Westbrook
and Black, 1985)
Different from the satisfaction apprehended in the act of consumption, anticipating the
utility may be per se a motivational element for the act of searching the market. For
example, shopping and trying out clothes is for many women an activity that delivers
satisfaction even before wearing them in daily life.

Literature Review II: Retail Patronage
40
Role Enactment
Westbrook and Black (1985) explains that this motivation assumes “culturally
prescribed roles regarding the conduct of shopping activity.” In other words, when the
shopper is moved by a role, the focus is not in the shopping task but in the shopping
driving force.
Tauber (1972) exemplified that with the relation between grocery shopping and
housewives, at that time. The author observed that any attempt of promoting home
delivery or telephone order, consequently eliminating “food shopping”, had been
unsuccessful. His research leads him to believe that “the process of grocery shopping
has a positive utility for a large segment of women who view it as an integral part of
their role.”(Tauber, 1972) This view may seem out of date, since men increasingly
share the grocery shopping task with their wives (Piper and Cappella, 1993). However,
this scenario is still valid for older segments who maintain a traditional lifestyle. This
idea is confirmed in Piper and Capella’s study (1993) that identifies the retired male
grocery shoppers as the segment least fond of shopping tasks.
Besides roles that are embedded to each individual by their function in society, role
enactment may derive from the shoppers’ thought of the way things should be done.
Prescribing normative economic behaviour, this motivation can result in “careful
product and price comparisons, searching for optimum value, and so forth.” (Westbrook
and Black, 1985) In practice, this may mean that a shopper may contain impulsive
purchases on behalf of a responsible self-image.
Korgaonkar et al. (1985) also referred a motivational linkage called Value-Expressive
Function, when studying relations between attitudes and store patronage behaviours. As
the author described, this function induces individuals in giving “a positive expression
to their central values and self-concept”. Going for groceries in the neighbourhood
shop, may be for instance, a form of helping the local community for a given shopper.

Literature Review II: Retail Patronage
41
Negotiation
In a study about shopper typology, Westbrook and Black (1985) defined negotiation as
a “motivation to seek economic advantage through bargaining interactions with sellers.”
Though this motivation was included as a valid reason for shopping enjoyment for
some, it is clear that the negotiation rarely happens in western cultures (except for
market fairs and big ticket items).
According to Kassaye (1990) the occurring of negotiation is dependent on expected
savings, which is determined by the nature of products, the kind of retail operation, the
degree of perceived underserved profit and the ratio between the price and the
customer’s earnings. From the factors mentioned above two explain why supermarkets
are not places of haggling. Nature of products influences, when perceived quality
differences are found among products. Since supermarkets distribute standardized
products, this issue does not apply. The kind of retail operation also makes the
difference because consumers don’t assess willingness to negotiate from the seller,
when visiting large-size stores where the owner is not present. (Kassaye, 1990)
Although it does not take place in retail grocery stores, it is true that it would incentivate
shopping for some individuals. As affirmed Kassaye (1990), “consumers find haggling
psychologically satisfying and economically beneficial in buying certain goods.”
Research suggests several reasons for this pleasure to emerge. Tauber (1972) pointed
out that “an individual prides himself in his ability to make wise purchases or to obtain
bargains.” Kassaye (1990) also referred that the practice of haggling is important to
create a friendly store atmosphere. Additionally, negotiations can be an expression of
assertion needs (Westbrook and Black, 1985) or a form of competition that may be
enjoyable for some buyers. (Tauber, 1972)
Nevertheless, the pleasure of negotiation is not shared among all. For many shoppers
this behaviour has a negative connotation, because they perceive it as a degrading
activity that implies that one is cheap and engages in an argument over petty things
(Tauber, 1972; Kassaye, 1990).
Literature Review II: Retail Patronage
42
Choice Optimization
Optimizing choice is aiming to complete the “shopping task efficiently and effectively”
(Ganesh, 2007). The efficiency will result from how little resources where needed, may
it be money, time or physical effort, and effectiveness results from searching and
securing “precisely the right product to fit one’s demands.” (Westbrook and Black,
1985)
Although this motivation appears to be of a rational nature, the benefit that derives from
it is not merely utilitarian. Emotions associated with choice optimization please the
shopper. As Westbrook and Black (1985) explained “the gratifications experienced
when this motivation is fulfilled are reflected in a sense of achievement and mastery of
the choice environment.” Tauber (1972) adds that when the consumer perceives
himself as a wise shopper, “he will seek bargains in fixed-price situations by looking at
relative prices between stores (comparison shopping) or relative prices over time
(special sales).”
Affiliation
This motivation is expressed by the desire to develop interaction with other individuals
in the retail setting, usually shoppers or merchants.
Since 1969, affiliation theories “emphasize the view of man as an altruistic and
cohesive social animal, seeking affection and acceptance in interpersonal relations.”
(Westbrook and Black, 1985), which have been confirmed in several studies (Bloch et
al. 1994; Ganesh et al., 2007; Westbrook and Black, 1985).
Consistent with the affiliation motive are several social motives pointed out by Tauber,
three years later (1972). The author referred motives such as seeking “social
experiences outside home” in a general way, communicating with others having similar
interest and also being attracted by a peer group. The latter one, of a more indirect

Literature Review II: Retail Patronage
43
nature, is also researched by Westbrook and Black (1985) that define peer group
attraction as when “shoppers identify with particular reference groups through their
patronage, dress, or mannerisms in retail settings.”
Besides reaching for social interaction outside personal context, affiliation can also refer
to shopping experiences with close relatives or friends. Buttle (1992) encountered in his
research an example of a shopper that hated shopping, but found enormous satisfaction
both shopping with, and shopping for, his granddaughter.
Power and Authority
This motivation is related with the aspiring social status. Yoo et al. (1998) theorized that
“shoppers feel pride when they display their economic ability and social status through
shopping”.
In practice, this motivation occurs when the shopper seeks success and admiration and
is particularly pleased when the retail personnel attendance is done with attention,
respect and deference (Westbrook and Black, 1985). As Tauber (1972) pointed out, “in
few other activities can a person expect being “waited on” without having to pay for this
service. A person can attain a feeling of status and power in this limited “master-
servant” relationship.”
However, Westbrook and Black (1985) suggested that, the power and authority may not
be confined to the salesperson. They can also “concern control over another person’s
activities in the course of social interactions during shopping” (Westbrook and Black,
1985).

Literature Review II: Retail Patronage
44
Stimulation
Shopping for stimulation is described by Westbrook and Black (1985) as seeking “novel
and interesting stimuli from the retail environment “ and is deeply related to the hedonic
function that shopping is able to deliver.
This sensory stimulation is normally associated with store atmosphere (through music,
light, the store layout…), occurring when customers take pleasure in using the five
senses, like “handling merchandise, and are either trying it on or trying it out” (Tauber,
1972). Nevertheless, Westbrook and Black (1985) mentioned that stimulation involves
“sensory, emotive, and/or cognitive faculties.” Consequently, the presence of novelties
or symbols that draw the consumer to a fantasy state is also a form of stimulation.
3.2. Clustering Consumers
Bearing in mind the motivations and attributes listed in the last sections, Ganesh and
Luckett (2007) tried to perceive how consumers could be profiled. To support the Big
Middle Thesis, these authors proposed that “Irrespective of the retail format, or the
method employed, common shopper subgroups will be found amongst the customer
base of traditionally different retail formats”. According to Levy et al. (2005), the “big
middle” concept implies that successful retailers, either coming from the extreme of low
price rationale, or coming from innovation philosophy, eventually move to a middle
point: focusing on providing value by leveraging their innovative or low price strengths.
Their cluster analysis, based on 832 shoppers from different retail formats resulted in 5
groups: the apathetic, the enthusiasts, the destination shoppers, the basic shoppers and
the bargain seekers.
Literature Review II: Retail Patronage
45
3.2.1. Apathetic
The apathetic group gather the shoppers that reveal little interest about the shopping
task. According to Ganesh’s clustering analysis (2007), this group presents low scores
for all motivation dimensions. Even Choice Optimization, which is transversally
important for the remaining clusters, displays particularly low values for Apathetic
shoppers. Ganesh (2007) advocates that “the absence of this factor, along with low
scores on the remaining motivation dimensions indicates that these shoppers are
indifferent toward shopping (…).”
Concerning store attribute dimensions, ratings were also low in general. The store
Quality dimension exhibited particularly low scores for this cluster, which implies that
this kind of shoppers does not value much more than the minimal service required.
Lesser and Hughes also found such a cluster (1986), which they named inactive
shoppers, not only in their own empirical study, but also consistently in several widely
different markets/studies. These individuals will avoid shopping the most, and if they
are forced to execute this task, they may just choose the nearest store disregarding its
attributes (Lesser and Hughes, 1986).
3.2.2. Enthusiasts
Opposite to the apathetic, enthusiasts consistently show high values on all shopping
motivation dimensions and almost all attribute importance dimensions (Ganesh et al.,
2007).
These people are the shoppers who really take pleasure in all aspects of shopping and
obtain hedonic value out of the task (Ganesh et al., 2007). This idea is consistent with
McGoldrick and Pieros research (1998), where they were able to back up the hypothesis
that consumers with strong shopping motives experience the most arousal and pleasure.

Literature Review II: Retail Patronage
46
Besides presenting generally high scores for attribute and motivational dimensions,
these shoppers exhibit particularly high values on stimulation (motivation) and
enhancements (attribute). This leads to believe that this group values HILO price
formats typically associated to high service levels.
3.2.3. Destination Shoppers
Besides the two extremes of the apathetic and the enthusiastic, three more clusters arise.
Ganesh, et al. (2007) found a cluster which they found to be “brand name and image
conscious and shops with the primary goal of obtaining new fashionable products.”
Their primary patronage motive is “clearly dictated by their need to obtain brand name,
image, and fashion oriented items and not by other aspects of the shopping
experience”(Ganesh, 2007). Thus, the most important scores are the anticipated utility
motivation and the assortment attribute dimension. The other dimensions are less
important.
Ganesh et al. (2007) suspect that this segment would identify and patronize stores
selling branded merchandise they seek. A question arises here for the retail grocery, if
these shoppers find gourmet products fashionable. Assuming that the Gourmet concept
is associated to perceived high quality, then it should depend on extrinsic cues such as
service quality and store image (which didn’t present high scores in Ganesh et al.
study).
3.2.4. Basic Shoppers
The cluster of basic shoppers is characterized by a lack of strong satisfaction they derive
from almost all motivation and attribute dimensions. “They do not necessarily view
shopping as a recreational or social activity” (Ganesh et al., 2007), similarly to apathetic
shoppers.
Literature Review II: Retail Patronage
47
However, contrarily to the apathetic, basic shoppers make an exception when it comes
to choice optimization, store quality and convenience. They view shopping as a
necessary task and want to keep it quick and simple. They walk into a store with a clear
perception of what they want, purchase the products in the least amount of time and
walk out.
3.2.5. Bargain Seekers
The last cluster to be examined is the bargain seekers. This cluster shows high values on
price orientation attribute dimension and role enactment, which includes price
comparison behaviour. According to Ganesh et al. (2007), no other dimension seems to
consistently concern them. This cluster was already identified in 1986 in Lesser and
Hughes study, by the name of price shoppers.
Motivated primarily by bargain seeking and to a lesser extent by the choice optimization
(Ganesh et al., 2007) dimension, these shoppers tend to be cherry pickers. Extremely
price-conscious, these shoppers are “willing to undertake an extensive search to meet
their price requirements and rely on all forms of advertising to find bargains” (Lesser
and Hughes, 1986). Therefore, their patronage behaviour is difficult to track down.
They normally do cross-shopping among stores that offer striking discounts and
promotions.
Summing up, this chapter clarified that a big variety of variables influence the
patronage decision. Some variables are product related, such as price, product selection
and perceived product quality. However, the shopping decision also takes into account
store related attributes. Here are included convenience, service quality, personnel, store
image, store atmosphere and fast checkouts. However the shopper himself will detain
certain characteristics that will weight his reactions to the previous attributes.
Depending on the strength of his own motivations, which may be role enactment, choice
optimization, affiliation, stimulation or power and authority, he will ponder elements
differently. After analysing the three groups of attributes (product, store and consumer

Literature Review II: Retail Patronage
48
related), five typology of shoppers are presented. They are the result of the Ganesh et al
(2007) research, where groups of shoppers were grouped by their motivation and
attribute preferences. Based on all age groups, these clusters contain basic shoppers,
apathetic, enthusiast, destination shoppers and bargain seekers. After this literature
review about retail patronage at a high level and the previous of the senior segment
analysis, it is now time to face the challenge crossing both topics confronting senior
retail patronage empirically. Therefore, the next chapter will present the research
questions that urge to be explored and methodology that will be adopted.
Methodology
49
4. Methodology
The following section has the aim to present the goals of the empirical study stage. This
empirical study is composed by a qualitative perspective for a first outlook, using the
focus group technique. Afterwards, a central work is developed in a quantitative method
based on the survey technique. It is important to stress that this study is of an
exploratory character, not aiming to be representative. A representative sample would
require a bigger and random sample, which is not the case. However, the aim of this
dissertation is not to draw definitive conclusions but rather to provide insight and
understanding of an emerging segment that is still to be analysed in a profound manner.
As a result, this section starts by clarifying the objective of the study through research
questions. Then, the senior concept is speculated and refined. The next two sections
focus on the tools and techniques that were planned to be used both in the focus groups
and the survey stages. For the focus groups, for instance, it is justified why this method
was chosen, where, when and how the groups were gathered. For the survey, issues like
questionnaire design, sampling decisions and measures are explained.
4.1. Research Questions
With a wide set of marketing publications about the new age elder segment already
available, it seems suitable to provide evidence, through an empirical study. In that
order of ideas, it becomes necessary to formulate questions that will be verified or
rejected afterwards.
According to the literature review, the new age senior segment presents differences
regarding factors that influence satisfaction, comparing with general senior population.
Consequently one of the questions to be exposed is what proves to be concretely
different in new age shopping behavior, comparing to the traditional seniors? This

Methodology
50
subject can be unfolded into several more detailed questions, regarding the different
attributes referred in the retail patronage chapter.
According to Westbrook and Black (1985) empirical studies of shopper motivations, a
mostly older age segment derives satisfaction from negotiation with salespeople and an
affiliation with other shoppers (Zinkhan and Pan, 2006). Forman and Sriram (1991) also
referred that for “the socially-isolated elderly person (…), the relationships with store
personnel or other regular shoppers, casual as they may be, can be essential. In some
cases, the brief discussion with a counter person or teller may be the critical last line of
defence against feelings of loneliness.” Having that in mind, do new age seniors also
put the same value on affiliation and negotiation issues when shopping?
It was referred in the senior segment chapter, that the physiological changes that come
with age may influence an individual perception of what is a pleasant atmosphere.
According to Moschis (1987)1, as people grow old, “consumers are less able to integrate
information, less sensitive to external stimuli (light colors), and less able to make
distinctions between stimuli”. Additionally, empirical results of d’Astous (2000) lead to
conclude that age “may show a negative (e.g. unclean store) or a positive (e.g. loud
music) relationship with shopper’s environment-based irritability perceptions depending
on the nature of the source of irritation”. If so, store atmosphere may offer benefits that
are irrelevant or even damaging to seniors. The only feature that possibly satisfies is
simplicity, for confusion avoidance. Given that assumption, do New Age seniors also
put little regard on refined store atmosphere elements?
According to Lesser and Hughes shoppers typology study (1986), older consumers were
highly associated to the apathetic segment, presenting limited enthusiasm for shopping.
At that time, the same authors defended that for attracting this segment retailers did not
need to offer competitive prices or assortments, but rather invest in convenient locations
in order to make shopping less complicated for them. Contrarily to price and
assortment, Ou, W.-M., R. Abratt, et al. (2006) support that that “retailer reputation
1 In d’Astous (2000).

Methodology
51
appears to have more influence on travel time with older shoppers”. However,
according to the same author, this fact is more related with a higher availability of time,
rather than higher enthusiasm, when comparing with younger shoppers. While
assortments seem to have a limited importance for traditional seniors, Silvers (1997)
found that the cognitively young expressed more willingness to try new brands, along
with a higher propensity to seek information and lower caution in buying. Concerning
these arguments, do new age seniors also exhibit apathetic shopping behaviour? And
additionally, does this segment put such a big emphasis on location, disregarding price
and brand diversity? Is store image still the attribute that triumphs over the distance
barriers?
In other words:
In what do New Age seniors exhibit different shopping behavior, comparing with
traditional seniors?
Independently, of being New Age or traditional, seniors are expected to present
different drives for shopping, comparing with the remaining age groups. However, are
they all the same within group? And since Silvers (1997) life cycle segmentation
presents such an expressive diversity within seniors, what types of shoppers show up?
Does this segment present the same clustering pattern as the population as a whole?
In other words:
Will the senior segment present different clusters to the ones presented by Ganesh 2007
for shoppers in general?

Methodology
52
4.2. The senior concept
Forty is the old age of youth; fifty the youth of old age.
Victor Hugo
It is difficult to draw a frontier age to define the beginning of old age. While the
Portuguese Institute of Statistics (INE) and the U.S. Census Bureau draw the line of
being a senior at the age of 65, numerous researches focus on the mature, meaning
individuals over 50 (Dychtwald 1997, Gordon et Al., 2002, Pak e Kambil, 2006). Using
a life cycle perspective, the official retirement age marks a radical change in a person’s
way of living. In Portugal, the official age of retirement is 65. However, the effective
age of retirement has been decreasing (Figure 12). Additionally, Social Welfare has
recently been conceding pre-retirement conditions to some workers at age of 552. So in
this study, we will adopt the definition that seniors are people over 55. Also, and in
agreement with Marthur’s research, this research will use a younger cut-off age limit
because it focuses on identifying an emerging segment of the elderly (Marthur et al.,
1998).
Figure 12 | Average effective age of retirement in Portugal.
73.1
66.672.2
65.5
55.0
60.0
65.0
70.0
75.0
19
65
-70
19
66
-71
19
67
-72
19
68
-73
19
69
-74
19
70
-75
19
71
-76
19
72
-77
19
73
-78
19
74
-79
19
75
-80
19
76
-81
19
77
-82
19
78
-83
19
79
-84
19
80
-85
19
81
-86
19
82
-87
19
83
-88
19
84
-89
19
85
-90
19
86
-91
19
87
-92
19
88
-93
19
89
-94
19
90
-95
19
91
-96
19
92
-97
19
93
-98
19
94
-99
19
95
-00
19
96
-01
19
97
-02
19
98
-03
19
99
-04
20
00
-05
20
01
-06
20
02
-07
Average effective age of retirement, Portugal
Men
Women
Source: OECD statistics (2006)
Still, depending on chronological age can be a simplistic way of analysing the senior
segment. As defended by Turner (1996), age is socially constructed.3 In accordance to
2 If simultaneously, the worker has 30 years of income registered. (in Portal do Cidadão webpage)
3 Szmigin, I. and M. Carrigan (2001). "Learning to love the older consumer." Journal of Consumer Behaviour 1(1):
22-34.

Methodology
53
this idea, segmentation research is now exploring new perspectives. Silvers (1997)
proposes an innovative segmentation that clusters consumers based on their occurred
life events. Rather than being more or less aged, the highlight is placed between more or
less life-experienced. A gerontographic segmentation was also defended by Mochis et
al. (2004), “based on aging processes and life circumstances”. The terms abound from
functional age, subjective age, to cognitive age, but all of them have in common an age
that is not counted but felt by the individual. Several authors were able to put in
evidence the significance of this concept through empirical studies (Sherman et al.,
2001; Mathur et al., 1998; Mochis et al., 2006), which corroborate the idea that “(…)
two models of old age coexist today: an active old age lives beside the traditional
passive old age.” (Brasseul, 1981)4
Henry Ford once said that “anyone who stops learning is old, whether at twenty or
eighty (…) anyone who keeps learning stays young”5. Recently, this idea is being
confirmed by the academy. According to Monteiro (2008), Senior Universities’ scholars
“are autonomous, independent” and capable of supervising their home, being retired in
the majority. Additionally, some are responsible for third parties, for example taking
care of parents or helping with their children’s education. In that perspective, these
scholars may well be a good way of sampling representatives of New Age seniors. Also,
the PAQUID Project, a research in gerontology field, revealed that people with more
education are twice more represented in the group of the elderly people with autonomy.
That leads to believe that higher levels of autonomy and well being in seniors are
associated to higher levels of education and social participation (Quaresma, 2008). Ten
years before, Mathur (1998) already defended the idea that new-age elderly are more
positively inclined toward learning new things compared to traditional elderly.
Additionally, in the same research he concluded that New Age elderly show greater
interest in leisure activities, such as foreign and domestic travel, computers, outdoor
activities and volunteer work/self-enrichment, comparing with traditional elderly.
4 Veloso, E. C. As Universidades da Terceira Idade em Portugal : Contributos para uma caracterização. IV Congresso
Português de Sociologia.
5 http://thinkexist.com/quotation/anyone_who_stops_learning_is_old-whether_at/146312.html

Methodology
54
Having this in mind, the sampling method for this field work will attend to the referred
characteristics: interest in travel, computers, exercise, volunteer and self enrichment and
above all, senior university course attendance.
Besides the sampling method, another important issue must be taken into account to
assure valid responses. When addressing seniors, it is not necessarily favourable to
stress the fact that the study is specially directed to them, because of their age. Though
honesty obliges transparency towards the research participants, the used terms should be
carefully chosen. In 1992, the European Community’s Commission inquired about how
senior people liked to be treated. Although the survey resulted in a big range of answers,
it revealed that “older people” was the most well accepted expression in the EU (12),
and in the southern European countries in particular. The expression “senior citizens”
showed popularity in northern countries, like Germany, Ireland and U.K., while
“retired” was the most preferred by French and Belgian (INE, 2002). On the contrary,
according to a survey to women over 50 (TNS global/Dove 32/08-Focus nº461), 79%
reject being labelled as “older” or “mature”. Though the EU Commission inquiry did
not find such severity, it was assumed for this study that old age is not always well
accepted. Consequently, to avoid a hostile posture from the interviewees, which could
have a damaging interference on responses, the regularly used term was senior. The
supporting rationale was that people that accepted the fact of attending a senior
university could identify themselves as seniors without resent.
4.3. Focus groups Methodology
The purpose of the conducted focus groups was of a complementary nature. Rather than
being the centre of the research, the aim was to explore the “reality from a client’s point
of view” (Krueger, 1994, p.99), which was distant and unknown to the researcher. Only
after this stage, could it be possible to define clear investigation propositions. In other
words, “inductive contacts with respondents can supplement deductive contacts with
theory as a source of hypotheses” (Morgan, 1997). In addition, these same interviews
could confirm the validity of the literature review for the Portuguese context.

Methodology
55
Although the following survey stage remained essential for reaching more solid
conclusions, the planning of this task also depended greatly on the results of the focus
group. Three benefits were pointed out as resulting from designing a questionnaire with
the help of a focus group. Firstly, this method can provide the domains that should be
measured in the survey, avoiding a specification error. “(…) Focus Groups can ensure
that the researcher has as a complete picture of the participants’ thinking as possible,
rather than simply relying on the researcher’s assumptions about what is relevant”
Morgan (1997) .The same idea is supported by Pedro Quelhas Brito (2008) that defends
that “the procedure and the context in which the Focus Group is implemented prevent or
minimize research belief interference, as well as individual self-conditioning.”
Secondly, it can also define the dimensions that construct each domain, reducing
invalidity risk (Morgan, 1997; Ahmad, 2003). Finally, the results of the focus group
supply the most suitable item wordings for the segment at stake. The main benefit of
this is the reduction of “unreliability by minimizing differences in how respondents
interpret the questions” (Morgan, 1997).
The Focus Group stage consisted of three interviews to groups between 8 to 13
members. The recruitment of participants was made with the help of three senior
universities from Oporto: Antas Senior University, Contemporânea Senior University
and Gondomar Senior University. Consequently, the interviewed had already been
gathered previously in groups for the purpose of senior university lessons. This fact
provided major advantages.
On the one hand, the age criterion was fulfilled straight away. However, 7 scholars of
these senior universities were between 50 and 60, which represent 20% of the sample.
Although senior age is defined to start somewhere around 60 (65 for INE), it was
decided not to exclude these younger participations. Given that all citations will be
identified by the age of the participant, importance weighing can be a choice of the
reader himself.

Methodology
56
On the other hand, since people already knew each other, the focus groups easily
reached a good atmosphere for spontaneous interaction and fluid expression of
opinions. This latter fact is especially important, since “(…) focus groups elicit a
multiplicity of views and emotional processes within a group context” (Gibbs, 1997).
So as pointed out by Kress (2007), “the interaction between the participants is as
important as the actual content of the conversation. For example, one participant may
disagree with another and point out the logics behind her or his point of view.” The
perceptions, opinions, beliefs and attitudes (POBAs6) that derive from this debate are
therefore rich and not detachable from the group context where it was originated.
“Neither should these opinions be treated as “belonging” to individuals within the
group, or as opinions held by the whole group, but as discourses which emerge in this
context” (Smithson, 2000).
The senior universities also provided the time and the setting of a regular class for the
interviews to occur. For that reason, the interviews always took place in the senior
universities classrooms, for about one hour and half, of a normal weekday.
Focus groups are “a non-directive and non structured technique of collecting
data.”(Krueger, 1994; Bristol and Fern, 1996)7 However, when it is important to assure
that particular topics are brought into discussion, a guideline is designed to conduct
semi-structured focus groups. This document contains the topics’ list and description
that should be questioned during the interview. Rather than a rigid one way path for the
reunion, this is created to bear in mind the object of research and provides “a checklist
so the moderator will not forget the items that should be approached and the order in
which it should to be done.” (Correia, 2008) The following table is the planned
guideline used for focus groups and presents the main topics of discussion and their
associated rationale.
6 Puchta (2004) defined POBAs as ”an acronym coined by the American market researcher Naomi
Henderson (1991) to stand for Perceptions, opinions, beliefs and attitudes.” 7 In Brito, P.Q., “Conceptualizing and Illustrating the digital Lifestyle of Youth”, working paper, Oct
2008

Methodology
57
Introduction:
Welcoming the participants and thanking for their presence
Delivering short questionnaires to fill in
Presenting the researcher
Brief explanation about what a focus group consists of, stressing out that:
-it is of an informal nature
-everyone should participate with their opinion
-there are no right or wrong answers
-whether if it is a positive or negative opinion, what is important is that it is
honest
Pointing out the object of the research
Asking for permission to use the audio-recorder
-the recorded material is merely for research support
-if permitted, asking to speak loud and one at a time
Offering Merci Chocolates as a sign of my gratitude
Asking if somebody has questions or doubts
1st Question: when talking of hypermarkets, what comes to the top of your head?
Rationale: Breaking the ice.
Activating participation. “Asking for first reactions implies that everybody can
cooperate; after all, everyone has first reactions.”(Puchta, 2004)
2nd
Question: Do you enjoy shopping? What do you like/dislike?
Simple question that invites participation.
Collecting attitudes towards shopping and senior shopper’s motivations for shopping.
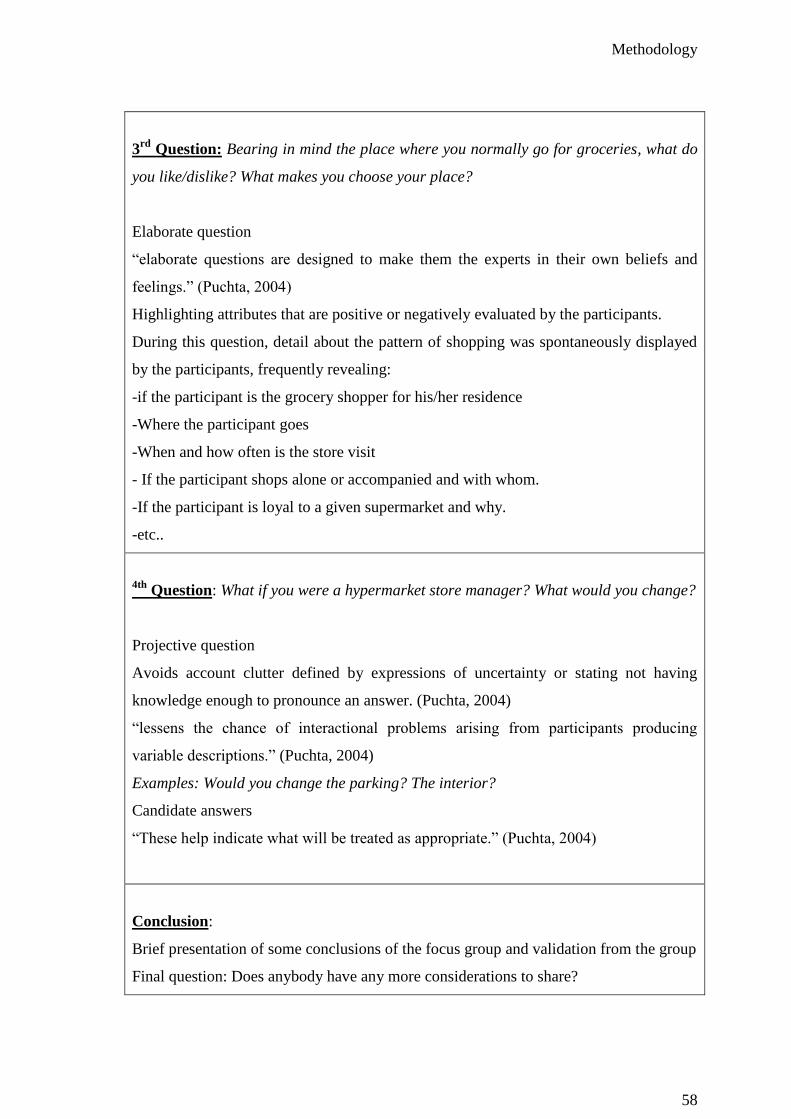
Methodology
58
3rd
Question: Bearing in mind the place where you normally go for groceries, what do
you like/dislike? What makes you choose your place?
Elaborate question
“elaborate questions are designed to make them the experts in their own beliefs and
feelings.” (Puchta, 2004)
Highlighting attributes that are positive or negatively evaluated by the participants.
During this question, detail about the pattern of shopping was spontaneously displayed
by the participants, frequently revealing:
-if the participant is the grocery shopper for his/her residence
-Where the participant goes
-When and how often is the store visit
- If the participant shops alone or accompanied and with whom.
-If the participant is loyal to a given supermarket and why.
-etc..
4th Question: What if you were a hypermarket store manager? What would you change?
Projective question
Avoids account clutter defined by expressions of uncertainty or stating not having
knowledge enough to pronounce an answer. (Puchta, 2004)
“lessens the chance of interactional problems arising from participants producing
variable descriptions.” (Puchta, 2004)
Examples: Would you change the parking? The interior?
Candidate answers
“These help indicate what will be treated as appropriate.” (Puchta, 2004)
Conclusion:
Brief presentation of some conclusions of the focus group and validation from the group
Final question: Does anybody have any more considerations to share?

Methodology
59
Rationale:
Alerting to the end of the focus groups and giving opportunity for final statements.
Thanking the participants
Afterwards a content analysis was developed with the outcome of these focus groups.
Subsequent to the focus group occurrence, the whole audio-recording of the interviews
was transcribed and registered in an Excel worksheet. Besides the column of statements,
an extra column was created to identify the interviewee (which required voice
memorizing during the focus groups). In the end, the statements were classified by their
relations to the retail patronage factors and analysed by filtering each topic.
4.4. Survey methodology
4.4.1. Questionnaire Design
Focus groups were useful for a first insight about seniors’ preferences and motivations
when visiting fast-moving consumption products retail stores. It provided not just
opinions, but explanations and the emotional intensity of points of view of the
participants. However, interviews are very limited in terms of generalising findings to a
whole population, due to the small number of participants and the likelihood that the
participants will not be a representative sample. Proceeding to a bigger scale of
participation, a survey was developed having in mind the literature review input and the
focus group results.
The survey instrument was pretested with a trial group selected on a convenience basis.
The pre-test results were used to further refine and reword many statements. The
specific statements were developed based on prior published research on shopping
motivation (Westbrook and Black, 1985; Ganesh et al., 2007). Some items were added
in result of focus group analysis.

Methodology
60
The questionnaire design followed some considerations. The content was chosen and
formatted so that it would fit in one single sheet. This would help to respect time
constraints, which could put at risk the gathering of respondents, the attention and
energy during the questionnaire and the patience to complete the questionnaire till the
end. Following recommendations of Gillham (2000), factual questions were presented
first, while questions about attitudes, opinions and beliefs, which are more challenging,
appeared in the end of the questionnaire. An exception was made for age information, to
avoid any possible influence of subjective/objective age assessment and the remaining
answers. The questions about opinions, beliefs and judgement were wrote in the form of
neutral statements (to be scored), to avoid leading the respondent to any apparently
“correct” answer (Gillham, 2000).
4.4.2. Data collection and response rates
The survey took place between March and April of 2009 and the chosen settings for the
survey were senior universities in Oporto. Choosing to interview at senior universities
had the goal to capture a sample of New Age seniors, as described in the second section.
However, several questions were designed in the questionnaire to certify how valid this
assumption was. Therefore, the seniors’ profile obtained in the survey results includes
subjective age, technology usage degree, practise of physical activities, transport used
and hobbies as measures of social and cultural life involvement and dynamism
(Brasseul, 1981; Marthur, 1998; Koutsky 2001).
For constraining the analysis, the selected universities were only inside the metropolitan
area of Oporto, identically to the focus groups. Based on RUTIS (Senior Universities
Portuguese Network) and additional research, Oporto’s Metropolitan area has at least 15
schools running during 2009. The list bellow counts up to 2,551 senior pupils registered
in these institutions.
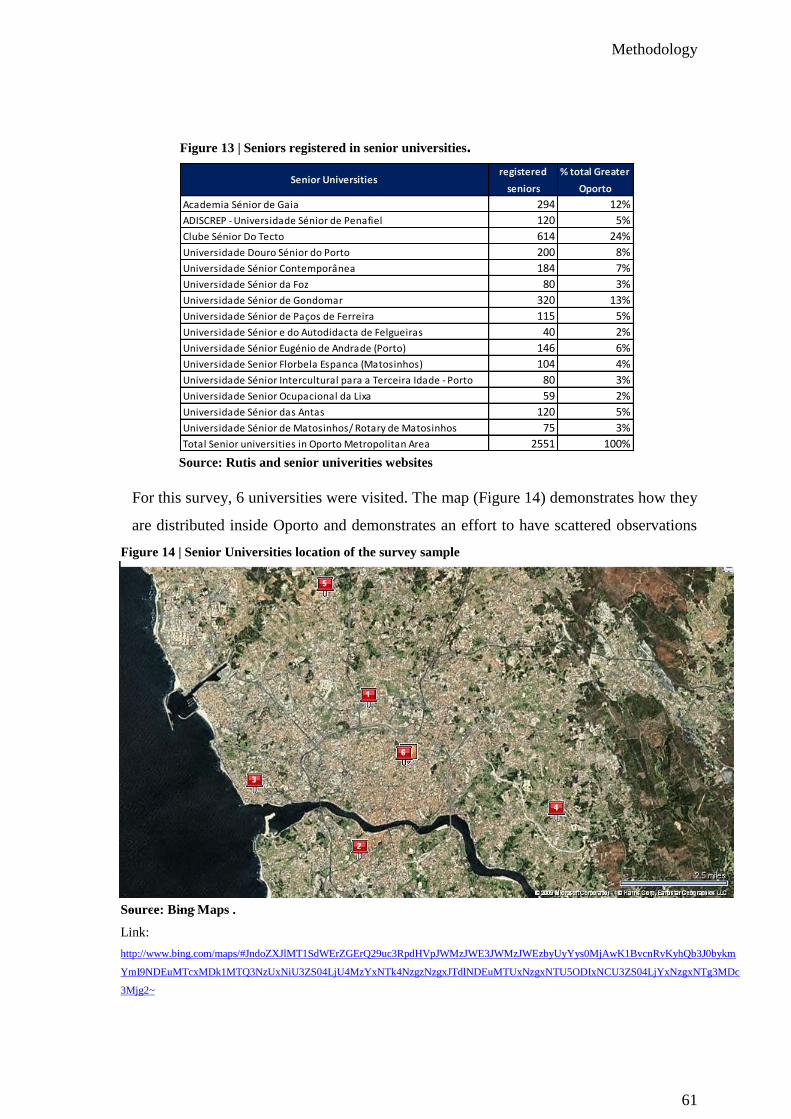
Methodology
61
Figure 13 | Seniors registered in senior universities.
Senior Universitiesregistered
seniors
% total Greater
Oporto
Academia Sénior de Gaia 294 12%
ADISCREP - Universidade Sénior de Penafiel 120 5%
Clube Sénior Do Tecto 614 24%
Universidade Douro Sénior do Porto 200 8%
Universidade Sénior Contemporânea 184 7%
Universidade Sénior da Foz 80 3%
Universidade Sénior de Gondomar 320 13%
Universidade Sénior de Paços de Ferreira 115 5%
Universidade Sénior e do Autodidacta de Felgueiras 40 2%
Universidade Sénior Eugénio de Andrade (Porto) 146 6%
Universidade Senior Florbela Espanca (Matosinhos) 104 4%
Universidade Sénior Intercultural para a Terceira Idade - Porto 80 3%
Universidade Senior Ocupacional da Lixa 59 2%
Universidade Sénior das Antas 120 5%
Universidade Sénior de Matosinhos/ Rotary de Matosinhos 75 3%
Total Senior universities in Oporto Metropolitan Area 2551 100%
For this survey, 6 universities were visited. The map (Figure 14) demonstrates how they
are distributed inside Oporto and demonstrates an effort to have scattered observations
Figure 14 | Senior Universities location of the survey sample
Source: Rutis and senior univerities websites
Bing Maps . Link:
http://www.bing.com/maps/#JndoZXJlMT1SdWErZGErQ29uc3RpdHVpJWMzJWE3JWMzJWEzbyUyYys0MjAwK1BvcnRvKy
hQb3J0bykmYmI9NDEuMTcxMDk1MTQ3NzUxNiU3ZS04LjU4MzYxNTk4NzgzNzgxJTdlNDEuMTUxNzgxNTU5ODIxNCU3Z
S04LjYxNzgxNTg3MDc3Mjg2
Source: Bing Maps .
Link:
http://www.bing.com/maps/#JndoZXJlMT1SdWErZGErQ29uc3RpdHVpJWMzJWE3JWMzJWEzbyUyYys0MjAwK1BvcnRvKyhQb3J0bykm
YmI9NDEuMTcxMDk1MTQ3NzUxNiU3ZS04LjU4MzYxNTk4NzgzNzgxJTdlNDEuMTUxNzgxNTU5ODIxNCU3ZS04LjYxNzgxNTg3MDc
3Mjg2~

Methodology
62
for a better representation of reality. 119 questionnaires were made, mainly in cafeterias
and corridors of these universities. However, 19 of these were excluded from the sample
due to incomplete information or inquired underage (above 55).
Map Universitiesregistered
pupils
% total
Oporto MA
% visited
universities
pupils considered
in the analysis
1 Universidade Sénior Contemporânea 184 7% 17% 12
2 Academia Sénior de Gaia 294 12% 27% 19
3 Universidade Sénior da Foz 80 3% 7% 18
4 Universidade Sénior de Gondomar 320 13% 30% 26
5 Universidade Sénior de Matosinhos/ Rotary de Matosinhos 75 3% 7% 13
6 Universidade Sénior das Antas 120 5% 11% 12
Total pupils in the visited senior universities 1073 42% 100% 100
Total senior pupils in Oporto's Metropolitan Universities 2551 100%
Seniors were asked to participate in this investigation by answering to an assisted
questionnaire. In other words, questions were read and explained to each interviewee, in
a personal manner. Although self-responding questionnaires are more quickly obtained,
being assisted brought several advantages. Firstly, it encouraged participation. It was
visible that people participated more easily, since it saved them some effort reading and
gave an opportunity to chat. Also, it assured that the intended interpretation occurred.
Questioning personally, gave an opportunity to rephrase the questions, especially when
it was obvious that it wasn’t being well understood. Additionally, it reduced the chance
of error, by making sure that answers were given in the right format (answers with
several crosses, for example). Finally, it also gave the investigator the frequent
opportunity to access justifications to the answers, giving a more holistic insight to the
seniors’ ideas.
4.4.3. Measures
The questionnaire is composed of four sets of measures: profile, shopper habits, shopper
motivations and the shopper’s attribute salience.
Table 2 | Sample composition by senior university
Source: Rutis site
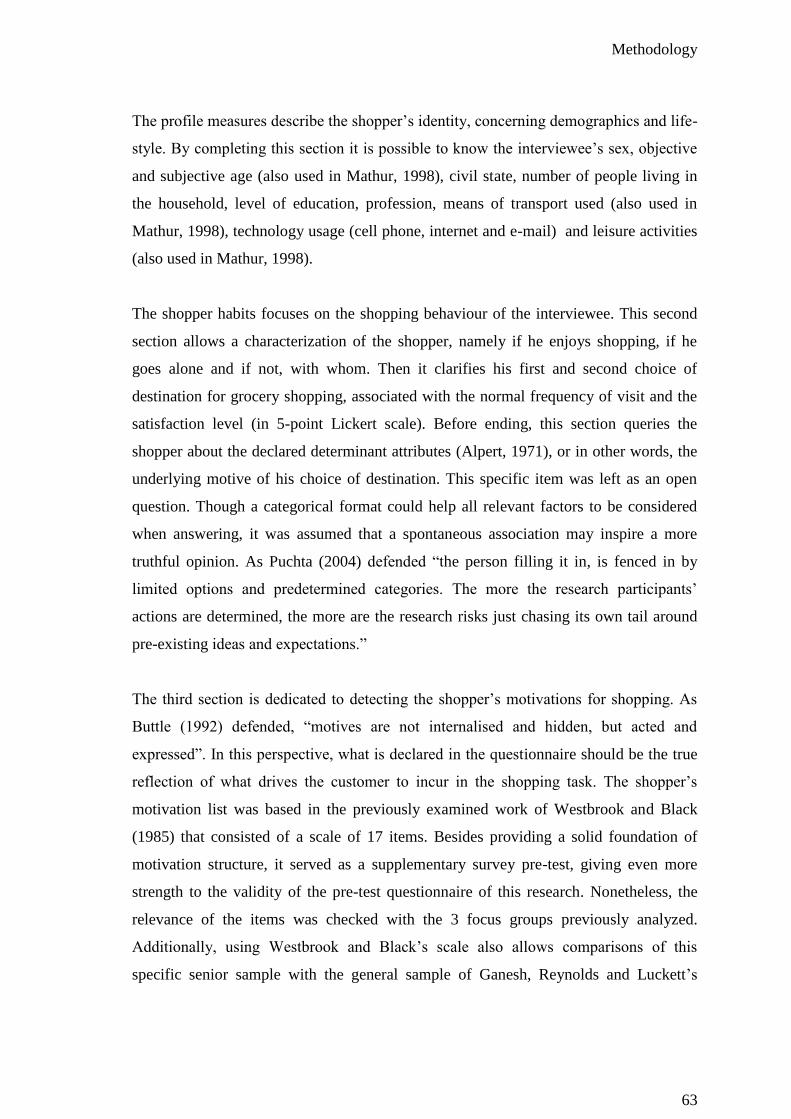
Methodology
63
The profile measures describe the shopper’s identity, concerning demographics and life-
style. By completing this section it is possible to know the interviewee’s sex, objective
and subjective age (also used in Mathur, 1998), civil state, number of people living in
the household, level of education, profession, means of transport used (also used in
Mathur, 1998), technology usage (cell phone, internet and e-mail) and leisure activities
(also used in Mathur, 1998).
The shopper habits focuses on the shopping behaviour of the interviewee. This second
section allows a characterization of the shopper, namely if he enjoys shopping, if he
goes alone and if not, with whom. Then it clarifies his first and second choice of
destination for grocery shopping, associated with the normal frequency of visit and the
satisfaction level (in 5-point Lickert scale). Before ending, this section queries the
shopper about the declared determinant attributes (Alpert, 1971), or in other words, the
underlying motive of his choice of destination. This specific item was left as an open
question. Though a categorical format could help all relevant factors to be considered
when answering, it was assumed that a spontaneous association may inspire a more
truthful opinion. As Puchta (2004) defended “the person filling it in, is fenced in by
limited options and predetermined categories. The more the research participants’
actions are determined, the more are the research risks just chasing its own tail around
pre-existing ideas and expectations.”
The third section is dedicated to detecting the shopper’s motivations for shopping. As
Buttle (1992) defended, “motives are not internalised and hidden, but acted and
expressed”. In this perspective, what is declared in the questionnaire should be the true
reflection of what drives the customer to incur in the shopping task. The shopper’s
motivation list was based in the previously examined work of Westbrook and Black
(1985) that consisted of a scale of 17 items. Besides providing a solid foundation of
motivation structure, it served as a supplementary survey pre-test, giving even more
strength to the validity of the pre-test questionnaire of this research. Nonetheless, the
relevance of the items was checked with the 3 focus groups previously analyzed.
Additionally, using Westbrook and Black’s scale also allows comparisons of this
specific senior sample with the general sample of Ganesh, Reynolds and Luckett’s
Methodology
64
research8 (2007). However, since the scale was directed to a broad collection of retail
formats, not all the expressions were applicable. This happened the most with the items
for detecting stimulation motivation where the two original expressions were “seeing
mall exhibits while shopping” and “just looking around at interesting store displays”. To
better fit the grocery retail context, the two were replaced by “enjoying the music and
campaign animation of the establishment” and “trying out a product sample or passing
by the book area”.The shopper’s motivations scale was measured on a five-point scale,
ranging importance from “none”(1) to “extreme” (5).
Finally, the fourth section of the questionnaire is devoted to the importance of store
attributes for each shopper. The attribute expressions had their foundation mainly in Pan
and Zinkhan meta-analysis about retail patronage determinants (2006) and were
complemented with some items that resulted from the focus groups. For example, the
item about putting the groceries inside the bags and the item about the presence of a
cafeteria inside the store resulted from spontaneous references made during the focus
groups. The shopper’s attribute scale was also measured on a five-point scale ranging
from “I would not appreciate finding that” (1) to “I would love finding that” (5).
4.4.4. Data Analysis
After collecting the answered questionnaires, the information was introduced in a Excel
2007 worksheet. The data was then cleaned by removing very incomplete observations
or subjects’ underage. Only then were the variables transformed. For example, answers
resulting from open-ended questions were categorized into qualitative variables.
When the database was finally ready for analysis, two approaches were planned. A first
and straightforward analysis was developed using Microsoft Excel 2007, for sample
analysis and primary results, such as absolute and relative frequency analysis and
average comparisons. In a second more elaborate approach, correlation tables and box
plots illustrated bivariate relations, factor analysis unveiled possible latent issues
8 Which also uses Wesbrook and Black’s item scale (1985)

Methodology
65
underlying the questionnaire items and a clustering pattern was proposed, all recurring
to SPSS 16.0.
This chapter has exposed problems that are intended to be solved, the criteria used to
selecting the sample as well as the form to approach it. It also explained which
techniques were used and why, as well as the process for analysing the resulting
information. Being the methodology presented and justified, it is now possible to face
the outcome of the focus groups and the survey, aware of the origin of the information.
Therefore, the next chapter will be devoted to the interpretation of an output of a solidly
acknowledged scheme.

Empirical Results
66
Female71%
Male29%
Focus Groups participantsby sex
5. Empirical Results
The following chapter will centre the attention on the empirical evidence obtained both
with focus groups and survey. While the focus group results will be presented
following the structure of the retail patronage factors presented in chapter 3.1 (example:
price, convenience,..) , the survey results will have special regard to the type of analysis
(example: factor analysis, cluster analysis…).
5.1. Focus Groups Results
5.1.1. Participants Profile
As presented in the graphic bar (Figure 15), almost half of the participants (43%) were
in their 60s and only 9 % were above 80. The big majority of the interviewed were
female, representing 71% of the participants (Figure 16). Although male participants
actively shared their opinions, normally their accounts were indirect, since their
experience as retail customers revealed to be of a supportive nature.
When examining the civil status of the participants, it is easy to conclude that there are
two major groups. More than half are married and 40% are widowed. This variable
provides some clues to household composition of the interviewed, and consequently of
9%
11%
26%
17%
20%
9%
6%
3%
0%
5%
10%
15%
20%
25%
30%
from 50 to 55
from 55 to 60
from 60 to 65
from 65 to 70
from 70 to 75
from 75 to 80
from 80 to 85
more than 85
Age interval share %
Figure 16 | Gender shares Figure 15 | Age group shares

Empirical Results
67
their probable shopping behaviour. For example, widowed will frequently be an only
person1, with little need for big amounts of groceries, but higher needs of interaction.
married51%
divorced3%
single6%
widow40%
Civil Status of participants
Regarding subjective age, it is interesting to observe that almost every participant feels
younger than his/her chronological age. Also, perceptions vary greatly between age
intervals. The elderly claim to feel a bigger discrepancy (40 years) between the age they
are and the age they perceive of themselves. Curiously, the elderly are also the
interviewed that dare to reveal that they feel younger (in their thirties), even younger
than 50 year olds.
code age intervals I am I feel like I move like
1 from 50 to 55 53 37 37
2 from 55 to 60 58 48 40
3 from 60 to 65 62 47 49
4 from 65 to 70 68 48 50
5 from 70 to 75 71 54 59
6 from 75 to 80 77 63 57
7 from 80 to 85 82 35 55
8 more than 85 86 30 80
9 All ages 67 48 51
1 According to INE (2002) and Magalhães (2003), 14% of resident seniors in Portugal, are widowed and
living alone.
Figure 17 | marital status shares
Table 3 | Subjective average age by age groups

Empirical Results
68
0
10
20
30
40
50
60
70
80
90
100
0 1 2 3 4 5 6 7 8 9 10
I am
I feel like
I move like
Figure 18 | subjective average age by age groups
This analysis applied to variable gender, offered fewer conclusions. Discrepancies
between actual and felt age were similar between male and female participants, with
average of 19 years. When comparing with physical age (“I move like in my…”),
discrepancy was relatively higher for females than for males, 17 versus 12 years. In this
perspective, males seem to feel slightly more the weight of age upon their movements.
Finally, the last chart (Figure 19) illustrates the occupation area of the participants in
active life period. 20% of the interviewed dedicated their lives to education. 12% of the
interviewed answered that their occupation was house cleaning or housekeeping. This
variable can also deliver some hints of expected shopping behaviour. For example, it is
possible to hypothesize associations of the housekeeper to a higher involvement relation
to the shopping task.
20%
14%
11%
9%
6%
6%
6%
6%
6%
3%
3%
3%
3%
3%
3%
0% 5% 10% 15% 20% 25%
education
N/A
entrepreneurhip
housekeeping
civil service
bank
fashion
health
administrative
social assistance
finance
construction
commerce
art
housewife
Participants' Occupation
Figure 19 | Occupation shares

Empirical Results
69
5.1.2. Data Analysis
This section presents an overview of the registered POBAs of the occurred Focus
Groups, following the structure of the retail patronage factors: the product-, the store-
and the consumer-related. For a deeper perspective, please confer these interpretations
with the quotation tables in the appendix. The total transcription of the three focus
groups is also available on demand.
Product related
Price
Big retailers are perceived by the Focus Groups participants as being providers of better
prices and choice, comparing with the past scenario of just traditional commerce. They
often shared that they feel empowered by the present competition (Qt 32). They feel that
they have access to better deals, especially if they put some effort on market search
(Qt1). Although price is generally well evaluated, when regarding hypermarkets, some
participants defended that they were not competitive in all categories (Qt 5).
However, not all participants show the same enthusiasm about searching for better
prices, product by product. Several interviewees gave statements about only an overall
perceived price image of stores working as patronage factors (Qt 2; Qt 4).
Product Selection/Assortment
Regarding product selection and assortment, positive evaluations were made about
hypermarkets, revealing that this attribute favourably influences their patronage.
Generally, interviewees remarked about the wide offer given in such places,
2 Qt 3 is the third focus group quote possible to read in the appendix.

Empirical Results
70
concentrating in one place all that is needed: food, houseware, clothes and much more
(Qt6).
Still, product selection is not appreciated for its range depth. In other words, seniors
appreciate having a wide range of categories concentrated under one roof, but for
convenience purposes (Qt 7) .Based on the interviews, a senior customer will value a
place that gathers in the same place the most needed categories for them: fresh food
(meat, fish, fruit and vegetables), basic groceries, dairy products, cleaning products,
bookshop, pet care, and bakery. Very rarely did they bring up the enjoyment for having
abundant alternatives to choose from. Diversity was valued exceptionally in strategic
categories, such as bakery and sometimes dairy products (yogurts).
Perceived Product Quality
Several accounts lead to believe that product quality occupies an important position
when pondering senior buying decisions. (Qt 8) Moreover, statements from the focus
groups abundantly reveal that participants go to a given supermarket or shop, product
driven. In other words, it was recurrent to hear “I like to go to that place X because it
has very good Y” or “Oh, I like place X. it has such an excellent Y” (Qt 12).
However, generally the product quality attribute does not favour big retailers (Qt 10). A
strong consensus was gathered on where to find the best quality, when it comes to fresh
food: the neighbourhood shops (Qt9, Qt10). Most of the participants in the focus groups
declared that even if they went for groceries to a hypermarket, they would frequently go
to traditional commerce to buy meat, fish, fruit and vegetables. Though these products
are frequently more expensive in hypermarkets, they stated that the reason why they
preferred the neighbourhood shops was related to perceived higher quality (Qt 13)
It is important to highlight that in other product categories, supermarkets and
hypermarkets are not that badly regarded. There were even good evaluations about the

Empirical Results
71
bakery in several chain stores (Qt 12). Particularly for Lidl, very good remarks were
made about beauty products, cereals, desserts, chocolates, cookies and dairy products.
Store Related
Atmosphere
Looking back, the first hypermarkets operating in Portugal were far from being
positively evaluated for their atmosphere, because of issues such as crowdedness (Qt
14). Nevertheless, statements in the focus groups indicate that nowadays things
improved largely. And it seems that space is still a valued feature. In other words, when
choosing a Hypermarket, these customers value visiting wide settings, rather than
narrow ones. (Qt 15, Qt 16, Qt 17)
However, wide airy settings may not mean exactly a big area at all. Medium areas seem
to optimize the shopping visit by reducing the required path to stride and by allowing
the customer to be more aware of the layout and the way things are organized (Qt 21).
Explicit participations reveal that the hypermarket atmosphere is valued by the
interviewee. Temperature, music (Qt18) and other factors clearly stimulate some of the
participants, enhancing the hedonic value of their shopping experience (Qt 22).
Besides the temperature factor, lighting was also referred as a key factor for patronizing
a given hypermarket. As shared by LJP (female 65 years old, feeling 40), poor lighting
restricts the capacity of clear vision, obstructing a rigorous product evaluation. Also, it
may increase a sense of insecurity to the customer (Qt7). Another atmosphere detail that
was expressed in the majority of focus groups as an added-value were the inside coffee-
shops (Qt8). Implemented recently, these coffee shops provide both cafeteria service
and one of the few opportunities to rest for a moment, inside the store area as well as
opportunities for a chat.

Empirical Results
72
Convenience
Convenience, particularly the proximity of neighbourhood shops is greatly appreciated
by participants of the focus groups. This may be associated to the fact that a big
majority of the senior segment does not drive3 and ends up confined to alternatives of
their residence area. This happens for two main reasons. Firstly, the generations that are
presently over 65 still come from a time when cars were not available for all the
population, and even more so when talking about females. Secondly, because with age,
driving abilities diminish and so, seniors eventually have their driver’s licence expired.
Even when they still have it, they do not feel at ease to drive that much.
Given this fact, nearby shops were frequently spoken as the first and only alternative of
the participants. A special highlight was given upon special treatment received,
including home delivery, personalized calls warning when the shop closed for holidays,
etc,..
The supermarkets who manage to locate their stores in residence areas, like Pingo Doce,
end up marking the exception to the traditional commerce dominance in these contexts.
They were mostly mentioned by their proximity almost as being an extension of the
participants’ refrigerator. As OCB (OCB, female 64 feeling 60) and others (Qt12)
revealed: “Sometimes, since I have Pingo Doce just a step away, I think: Oh! Why
should I bulk up my freezer! They have freezers there...I go there to have a cup of
coffee near Pingo Doce and I’m back home in five minutes!”
Staff
The personalized service and support given by the store employees was one of the most
consensual and developed issues. This attribute was largely associated to the traditional
neighbourhood stores and was one important motive for patronizing a given store.
3 According do Marktest (2008), only 43% of Portuguese seniors possess a driver’s license against 68%
of the general Portuguese population, in 2006. Also, only 35.1% actually use the household vehicle.

Empirical Results
73
Staff is valued in various manners. On the one hand, responsiveness, closeness and
friendliness were stressed out as key qualities appreciated. In this perspective, the staff
seems to enhance their emotional shopping experience, by putting them at ease and
giving them a sense of community belonging (Qt23, Qt24). MRP (female 78 years old,
feeling 60) stated: “…I always leave the place with a new story, of the person who
assisted me.”
On the other hand, some participants valued staff for their knowledge about product use,
promotions and customers’ needs. At a more cognitive level, the customers here seek a
shortcut for information and risk reduction (Qt26; Qt 29) and are very disappointed
when they don’t succeed in this matter (Qt25).
Yet, some extreme exceptions appeared in two or three testimonials. From their view,
low service type of store gives them benefits of freedom of action or quick
accomplishment of the shopping task. OCB (female 64 years old, feeling 60) shares her
view: “The best about hypermarkets is that I can walk around without restraints, nobody
is getting on my nerves. For me it is! I just have to pay.” For the focus groups observed,
these testimonials were from male or younger participants (Qt27, Qt28).
Fast check outs
One feature that was pointed out as being a negative aspect of hypermarkets was the
long waiting lines to cash out. Interestingly, this opinion was spontaneously referred in
the majority of the groups (Qt 31). Some participants were more sympathetic about this
problem: defending that it is nobody’s fault, reminding about the self-cash-outs solution
or just congratulating the good examples. However, others were very harsh about this
aspect, since it is publicized as a promise of a large number of cashiers which is
normally unmet (Qt 32). Additionally, some people view an even darker side about
this reality, justifying that this problem persists intentionally, due to management choice
(Qt 30; Qt 33).

Empirical Results
74
Store Image
When asked about hypermarkets, the ideas that came out from the top of the head were
of four kinds. A big part of the interviewed just thought about “going for groceries”,
probably from the task perspective. However, COL (male, 70 years old, feeling 50)
referred “hobby”. He justified that most people go shopping just to kill time and that
the purchase happens often as a consequence, rather than the cause. The second kind of
relation expressed hypermarkets as a place that tempts consumption. Expressions varied
from “consumption cathedral” to “consumption” and “promotions” (Qt 34, 35, 36), but
all denote the idea of a force towards spending more than necessary. Finally, some of
the interviewed answered ideas related to the idea of a big place with a wide range of
alternatives to choose from. Here, the highlight is in how hypermarkets help them as
customers, making their life easier (Qt 37, Qt 38, Qt 41).
In agreement with the top of mind associations previously given, hypermarkets
represent, for a big share of the participants, a tempting place where people are driven to
purchase more than they need or should (QT384, QT39). For this reason, these
customers feel an urge to distance themselves from big stores, and show preference
towards small neighbourhood shops. MEM (female 83 years old, feeling 50) shared a
comic episode to the group: “I know a lady, if I may, that told me that once she went to
the supermarket to buy soap and came with a trolley full of stuff she did not need!”.
Stressing this notoriously strongly tempting nature of hypermarkets, some of the
participants defend that retailers exaggerate their efforts in advertisement and
promotions. In some cases, promotions were mentioned by the interviewees as being
even deceiving (Qt 42).
Another weakness in the hypermarkets image is related to the wide selection of
imported production. Seniors are especially sensitive about present difficulties in
Portuguese agriculture, since a big part of their segment has been close to a rural
lifestyle. For them, it is hard to understand the presence of such big quantities of

Empirical Results
75
imported fresh food, when they perceive that national production is underpriced,
sometimes to such an extent that makes farmers question if it’s worth harvesting and
witness the crops are being discharged or given away in a form of protest with EU
commerce politics. In this context, big retailers are seen by senior participants as
destructive entities of the national value, while traditional commerce is seen as the local
community that the senior segment wishes to support (Qt 43).
However, hypermarkets image has a more positive perspective. Some of the
interviewees presented a good evaluation for hypermarkets. These participants recalled
the scenario they witnessed before when hypermarkets didn’t exist at all in the country
(before 1985). Bearing this in mind, they find hypermarkets a good example for
competition, demanding better standards for the retail business in general (Qt 44)
Consumer Related
Attitudes towards shopping varied. Some interviewees claim to enjoy going shopping.
One participant in particular cheerfully confessed that shopping for her was a “vice”.
MRP, female 78 years old, feeling 60 said: “I can’t go out! If I go out, I always shop!”.
Other participants revealed that, comparing with the past, they were much more
conscious, trying to buy only what is effectively needed. (Qt45, Qt46) Finally, another
part of the interviewees presented a lot less enthusiasm about going shopping. Some of
them explained that going to a hypermarket was just a chore, having no fun associated.
Coincidence or not, people who see going out for groceries more as a task, were the
youngest of the group (54 and 58). AMF, (female, 54 years old, feeling 40) provided
two reasons for her feelings. Firstly, she reveals that she values the customer service
that is typical in her neighbourhood shops. Secondly, she clarifies that she does enjoy
shopping, but not for basics and grocery products (Qt 47).
Regarding the interviewed drive to shop, not all of the motivations referred in chapter
about retail patronage were equally evident. While affiliation was enthusiastically
expressed, choice optimization was rarely mentioned.
Empirical Results
76
Affiliation
Affiliation was one of the most strongly evidenced motivations in the participants of the
focus groups4. Particularly, with the elderly, going for groceries was a way to get out of
the house and have a social encounter. The statements showed social activity occurring
mainly in traditional commerce. When participants shared their social experiences in
shopping, they revealed enjoying a chat, being updated with the community news and
sharing their feelings with the employees (Qt 48, Qt 49, Qt 50). Social interaction
seems to be appreciated not only with employees or other customers but also with the
shopper’s companion. For senior consumers, in particular, going out for groceries with
grandchildren may be an opportunity to share pleasant experiences. For instance, MLN
(female 63 years old, feeling 50) was delighted to tell the group about her experience in
the book area with her granddaughter (Qt 51).
Anticipated Utility
For what was told in the interviews, anticipated utility is one of most frequent motives
for shopping for seniors. However, opposing to what Westbrook and Black (1985)
highlighted, it isn’t well known brand names or novelties which excite this segment the
most. Appreciating the simple things in life, what the interviewees gave evidence of
being very fond of is good food. This was also reflected in the pleasure in the form of an
expectation, demonstrated in talking and searching for groceries, underlining their
favourite things (ex: bread) (Qt 52). MBT (female 71 years old, feeling 50) gave her
example: “I got used to Pingo Doce… sometimes I also go to Minipreço, now that they
4 The only two participants that demonstrated being highly annoyed with this kind
of social interaction were RMC, a 51 year old female (feeling 30) and GJM, a 62 year
old man (feeling in his 60s).

Empirical Results
77
remodelled it in Amial. I think it has nice things,…and when it comes to bread, it’s what
most brings me there. There, the bread baked in wood-burning oven is simply terrific!”
Stimulation
When going for groceries, some of the participants confessed that it was a way to go out
for a stroll. Stimulation, therefore, can assume an important motivation for shopping
among the senior segment. The following account by MCMS (female 80 years old,
feeling 20) illustrates the amusing potential of going shopping for seniors: “One day I
bring the rice, the other day I bring the oil,… also for making me get out of home. (…)
And I go for groceries everyday…(…) I don’t go shopping for a month or for a week…
I chat, I find someone I know, to distract myself a little bit and get out of the house and
so I go out every day….But to supermarkets, I never go. To supermarkets I only go if
someone takes me along and it’s just to stroll. (…)” Coincidentally or not, both AAT
(Qt 34) and MCMS (Qt 35) from the eldest group age of the participants and happen to
be widowed. This leads to suspect that stimulation needs may achieve higher levels in
people who have more time and spend it by themselves.
Choice Optimization
The power of choice did not gather many enthusiasts from the focus groups participants.
Though they insisted on finding quality products, it did not take pleasure on the seeking
process. As MBT (female, 71 years old feeling 50) expressed: “I don’t appreciate those
huge spaces, where I get lost till I find the item on my shopping list. I just buy things
from the list, so I won’t purchase anything superfluous. Sometimes I even forget…that
something is missing.” The two exceptions were 64 year old APS and AMF (Qt 53),
hardly a senior since she is only 54. APS (female 64 years old, feeling 60) said: “There
are things that I like to buy at Pingo Doce, there are things that I buy at Lidl, there are
things that I fetch from Modelo.” In other words, APS seems to enjoy maximizing her
power of choice, by visiting the best of each store available.

Empirical Results
78
Role Enactment
In several occasions it was possible to recognize role enactment motivation in the
interviewed. One of the most commonly perceived conducts that may have a social
influence behind is the intention to compare and seek the lowest price, enacting a
responsible consumer role (Qt 54).
Another pattern that emerged from the participants was the feeling of responsibility
about their health, when choosing products. This was shown explicitly as illustrated
below and implicitly when referring or recommending healthy products among them,
such as white meats, fish, vegetables and fruit, dark bread, teas and soya milk (Qt 55).
This pro-health role applies not just for themselves, but for people in the same
household. Accounts were made about special support given to an aged parent and a
sick husband (Qt 56).
Finally, the role of defending national production was very prominent. Whether buying
from the local fruit shop, criticizing the extent of imported selection or preferring
Portuguese brand names, a very representative part of the interviewed are fond of
supporting the national economy. As PVQ (female 76 years old feeling 60) proudly said
in the interview: “That’s essential, supporting our things is essential. But, I also think
that what is Portuguese is good.”
Power and Authority
During the focus groups, no statement explicitly gave evidence of participants enjoying
the shopping experience for feeling a sense of power and authority. Nevertheless, some
comments reveal that some of the interviewees valued personalized attendance and
being treated as special (QT57, QT58). One good example of this is the account of AFF
(male 68 years old, feeling 40) which stated that the politeness of salespersons and
details like putting the groceries in the bags, could make him put less regard on price
issues (Qt 59)
Empirical Results
79
Negotiation
Pleasure in bargaining was never explicitly mentioned in the interviews. This fact might
be a consequence of focusing attention on retail types where negotiation is not an
option. Prices are already fixed and conditions are set by the Head Office. The nearest
statement to the negotiation topic was when 70 years old AOS (male feeling 50) talked
about his pleasure in going to the flea market: “I don’t know if you can manage this in
your work, a big hypermarket I really enjoy going are… the flea markets! We go to
Carvalhos market. I loooove going there….I always go with my wife. We run all the
market of Carvalhos, that is a relatively small market. (…) There in Carvalhos, a person
goes round the market, examines the prices of all the fruits, of pears, apples, whatever
and then we go for a second round and choose (the cheapest, says his wife)… we
already have our own sellers. Because we became customers of the vegetables seller,
the fruit seller,…” Even this account reveals more of a combination between the
importance of affiliation motivation and the price attribute, than a negotiation drive.
Therefore, based on the focus groups results, it is not possible to conclude that
negotiation has any relevance for the senior segment.
Opportunities
Layout Adjustment
When planning layouts, retailers commonly take into account issues related to the
business such as logistics efficiency, space saving, and profit maximizing. Recently,
consumer related issues were also added to the layout rationale. For instance, retailers
are trying to locate products in the way consumers use and perceive them. (Example:
presenting house ware products as displayed in a home).
Nevertheless, the consumer-sided rationale is still underdeveloped when dealing with
details that could help people with disabilities in general, seniors included. The ideal

Empirical Results
80
layout should distract people from their restrictions, making them feel a regular
customer. One of the suggestions made by the interviewed was locating heavy
merchandise, such as milk and water near the exit, to minimize the carrying weight
during the visit. Another disabling factor that was mentioned during the interviews was
the inconvenient positioning of products on the lower shelves. Small merchandise, like
spices and other ingredients, was pointed out as the worst thing to locate in such places,
but the price tags (not dependent on the size of the product) were also referred in the
same context. OCB (female 64 years old, feeling 60) shared her experience with the
group: “(…) When looking for those pepper sachets and stuff and mash potatoes, those
little packages… they were on those….Look!!! There shouldn’t exist those low shelves,
where a person to see the price that is there down under…Ihhh! Jesus!!!Lord!!! That’s
the worst thing about hypermarkets, for me. We have to bend ourselves on our knees
and we can’t see (…) I think that those prices underneath, nobody can see them well.
Put big size bottles there, put whatever they want, boxes with whatever…”
Groceries Home Delivery and Investing in Personalized Service
For the general contributions from the focus groups, it seems that senior consumers
enjoy visiting shops to see the product for themselves. Still, this doesn’t mean that all
shopping tasks are appreciated (Qt 39). Linked with the last section, it was shared more
than once, that carrying the groceries was one of the unpleasing and even painful
activities. OCB (female 64 years old feeling 60) was one of the interviewees who
complained about this fact: “The thing of…me with a trolley full of stuff, having to take
them all out for the cashier, then having to put them all over inside the trolley again,
then having to go to the car, taking things out again and putting them in the trunk, then
arriving home and beginning all over again…it’s just the perfect way to get a backache
for several days!! Indeed, exercise… this is a very bad exercise for me, at least for me it
is, in my case I have a disc hernia.”
On-line commerce could be a very good solution to deal with this difficulty but presents
some limitations for this target. It requires an extra-charge which is perceived by some

Empirical Results
81
as expensive. It eliminates the experience of actually visiting the store, which is a loss
for some of the participants. Finally, it is not an easy solution since internet purchasing
is not a common practice for seniors, even those who go to Senior Universities in
Portugal. When talking about on-line commerce, MLN (female 63 years old feeling 50)
recognized it as useful although not for her: “(…) But that’s an advantage, for people
with no time for shopping and that master the internet, and all that. It’s an advantage…”
Having these statements in mind, hypermarkets could improve the shopping experience,
adding-up personalized service and home delivery, providing attractive conditions for
seniors. It is useful to have in mind that these two issues were aspects referred as
positively distinguishing traditional commerce.
5.1.3. Conclusion
Three main features seem to influence the stated patronage behaviour.
The first highlighted attribute is convenience. To the senior participants, opening hours
and car parking were never an issue. Instead, short distance was permanently brought to
discussion. Proximity was frequently a pre-selection criterion for customers who don’t
drive; but it also permits more recurring visits to the patronized store. Several benefits
are argued to come from here. Storage requirements are reduced at the customer’s home
and food is consumed fresher. For the elderly, the shopping experience is also
maximized with more frequent visits, by multiplying outdoor activities and social
encounters.
This leads us to a second key feature: staff. Since affiliation is an important drive for a
big share of seniors when going out for groceries, the people encountered on the way
gain greater relevance. Store employees assume diverse roles in this context: giving a
sense of belonging, making the senior customer feel comfortable and in a familiar
atmosphere, being recognized, by giving personalized treatment.

Empirical Results
82
Although price is always taken into account, the participants tended to favour quality.
These interviews showed evidence that seniors strongly experience anticipated utility,
especially when it comes to fresh food, which seems to be a central value of their lives.
Consequently, searching for good fruit, vegetables, meat, fish and most importantly,
bread seem to define, not rarely, the place chosen for their groceries.
Medium sized places are preferred to large places, even knowing that the latter present
wider ranges of products. Given the amplified sensitivity of seniors, atmosphere is a
delicate two-fold variable. It should both amuse and empower the customer, making
him feel capable and entertained.
The following framework tries to sum up the results of the focus groups interpretations,
based on frequency of statements, intensity of opinions and evidence of agreement
among the group.
Figure 20 | motivations and attributes by focus groups relation strength

Empirical Results
83
5.2. Survey Results
5.2.1. Sample Analysis
Before jumping to any analysis, the database was subject to cleaning, which excluded
incomplete or badly given answers, and formatting, which consisted mostly of
transforming open questions answers into classified categories. For example,
professions were transformed into categories.
For initial examinations, the focus will be on the sample profile, giving a descriptive
evaluation about who answered the survey. Regarding the profile of the interviewed by
sex, the survey sample tends to be similar to the profile of students in senior
universities. Females are the majority, representing 78% of the alumni.
82% 78%
18% 22%
0%10%20%30%40%50%60%70%80%90%
100%
current survey Senior universities in Portugal (2008)*
Male
Female
The same cannot be said about the age profile of the sample. Comparing with the
RUTIS study, seniors above 59 are less representative in the current survey. In practice,
a whole slice of 20 percentual points are transferred to the upper age rank. However,
this fact happened deliberately since the universe of this research only considers people
over 55, which may not be the case of the RUTIS study.
Figure 21 | Gender share comparison.
Senior Universities in Portugal vs. current sample

Empirical Results
84
8%28%
52%
52%
40%20%
0%10%20%30%40%50%60%70%80%90%
100%
current survey Senior universities in Portugal
(2008)*
from 70
between 60 and 69
less than 59
Also, when observing education levels, it is possible to conclude that this survey sample
has higher education than the general sample of senior students of the RUTIS study.
This might be consequence of the geographical constraint to Oporto. In other words,
Oporto’s seniors may present an education level higher than the RUTIS study senior
average (which in this case includes only 8 universities: Santarém, Portimão, Oeiras,
Almeirim, Borba, Grândola, Gondomar and Gavião).
21% 23%
33%
59%
45%
18%
0%10%20%30%40%50%60%70%80%90%
100%
current survey Senior universities in Portugal
(2008)*
Superior
between 7º and 12º
above 6º ano
When it comes to occupations, three categories stood out from the crowd: technicians
and professionals of Intermediate level, experts from the scientific and intellectual
professions and administrative staff and similar. The technicians and professionals of
Figure 22 | Age group share comparison.
Senior Universities in Portugal vs. current sample
Figure 23 | education level share comparison.
Senior Universities in Portugal vs. current sample

Empirical Results
85
intermediate level5 represent 35% of the total sample. For this sample, this category has
a specially big participation of basic school teachers and bank clerks. The experts from
the scientific and intellectual professions, in second place, have 22% of the total share.
senior leaders of public
administration or
private businesses6%
experts from the scientific and intellectual
professions22%
Technical and Professional of
Intermediate level
35%
Administrative staff and Similar
19%
Services personnel and
Vendors
3%
factory workers, craftsme
n and similar
workers7%
unskilled workers
8%
Professions
The most common experts from this sample are teachers (excluding 1st cycle), nurses
and economists, who represent 81% of the category. Finally, the third most represented
group in the sample are from the “Administrative staff and Similar” category, with 19%.
These professionals are mainly office employees that are responsible for secretarial
work, classifying documents, etc…
Concerning marital status, more than half the sample (58%) is married. 42% is either
single, divorced, or widowed, but still only 28% declare living alone.
Examining the sample’s most frequent hobbies, it is possible to observe that 98% of the
seniors had two or more activities (“tv” and “others” are not considered here), which
reveal high dynamism, as proposed. The chart ranks the answers by descending order.
Items without the asterisk were activities of spontaneous answer (if “other”, specified),
which means that they may be underevaluated. Since the questionnaire was undertaken
Figure 24 |Occupation shares for the survey sample

Empirical Results
86
inside senior universities, almost everyone declared attending courses. The second most
often activity mentioned was physical exercise, which means for a large part of cases
going for a walk. Almost half of the sample declared travelling with some regularity,
and at least 25% carry out some kind of voluntary service or association activity. This
activity profile reveals that the studied sample fits in the active aging concept previously
referred in chapter two (Senior Lifestyle Changes).
Other criterion that shows seniors’ autonomy in today’s context is the technology
affinity. The survey asked about the usage of the following: mobile phone, internet and
email. Though mobile phone seems to be generally used (92%), internet and email are
used by less than half of the seniors from the sample (47% and 45%, respectively). This
fact has an impact on these shoppers behavior since it is expected to reduce their ability
to compare prices, obtain references and even shop online.
5.2.2. Results Validation
Some items of the questionnaire were analysed in order to verify coherence of answers.
For example, as it was expected, seniors that use car transportation for their shopping
94
75
74
44
36
33
28
25
15
14
13
12
8
0 20 40 60 80 100
courses*
physical exercise*
watching tv*
travel*
cinema/theater*
reading
others
volunteering and associativism*
gardening&agriculture
crafts
painting
family support and housework
cultural performance groups
Declared activities
Figure 25 | Declared activities’ frequencies for the survey sample

Empirical Results
87
had higher scores for “good parking lot” importance. As observed in the following box
plots, for the 0 scenario of the senior not using a car, the median is 2 and a half of the
responses are located in this score, or even below. For scenario 1, regarding seniors that
use car transportation, half of the answers are between 4 and 5.
The same happens for the variables internet usage vs. online shopping availability. All
seniors, except for seven, stated not using the internet and gave the minimum score to
the importance of having online shopping available. Maximum scores, as predicted,
were given by seniors that use the internet. However, 5 and 4 scores were outliers, and
the big majority claimed little enthusiasm about this attribute.
Figure 26 | Good parking lot vs car usage.
A boxplot analysis
Figure 27 | online shopping evaluation vs internet usage.
A boxplot analysis.

Empirical Results
88
5.2.3. Shopper Habits
Though grocery shopping is commonly thought of as an unpleasant task that needs to be
done, cases exist where it is most welcome, representing a break for a working student
or an opportunity to meet people. (Buttle,1992). Particularly, for this sample of senior
grocery shoppers, 75% said that shopping is something they appreciate. By cross-
analysing the available variables, it was possible to observe that seniors that do not
appreciate shopping tend to be married (76%), more frequently are from the experts
category (2) and above all, tend to have an e-mail. Observing the cross-table (Table 4)
makes clear that contrarily to seniors who appreciate shopping, the majority of seniors
that dislike this task have an email.
dislikes likes
has no email 36% 61%
has email 64% 39%
May email usage be a mediator for another latent factor, such intellectual activity or
virtual experience receptiveness? Or could it be a substitute of shopping, when
affiliation is the major drive? Though this issue may be inconclusive, it brings into
question if this can have statistical significance (for testing this, it would be necessary to
build a random sample, which is not the case).
Table 4 | Shopping enjoyment vs. email usage.
Relative frequencies.

Empirical Results
89
Observing the visit frequency, it is clear that almost half of the sample chooses to shop
for groceries on a weekly basis (4 times per month). This is applicable both to the first
choice store and to its alternative. For these two destinations, the main difference
detected is that alternatives stores are, for some, visited on a daily basis. For what was
captured in the Focus Groups, these cases happen when the alternative store represents a
convenience solution for purchasing last minute needs (quotation 40) or small
size/budget items (quotation 41).
4 4 11%
4 none 9%
4 1 6%
4 28 6%
8 4 6%
1 4 5%
2 4 4%
4 2 4%
1 28 3%
2 2 3%
4 12 3%
8 28 3%
28 none 3%
33%
Share of total
sample %
Others
average no. visits per
month
first choice
store
alternative
store
2%
11%13%
41%
14%
7%
2%
9%
0%
12%10%
30%
5%7%
1%
16%
0%
5%
10%
15%
20%
25%
30%
35%
40%
45%
0.5 1 2 4 8 12 16 28
first choice store
alternative store
Figure 28 | frequency of store visit for first choice and alternative store.
Table 5 | visit frequency typology ranking
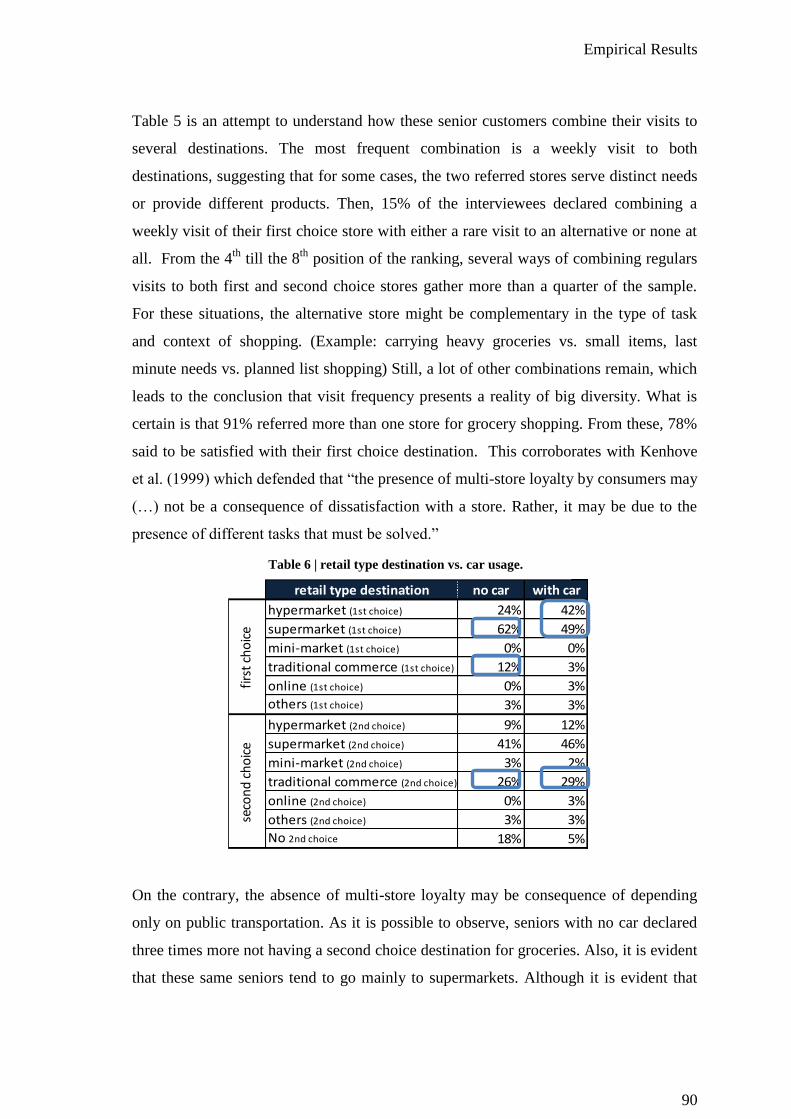
Empirical Results
90
Table 5 is an attempt to understand how these senior customers combine their visits to
several destinations. The most frequent combination is a weekly visit to both
destinations, suggesting that for some cases, the two referred stores serve distinct needs
or provide different products. Then, 15% of the interviewees declared combining a
weekly visit of their first choice store with either a rare visit to an alternative or none at
all. From the 4th
till the 8th
position of the ranking, several ways of combining regulars
visits to both first and second choice stores gather more than a quarter of the sample.
For these situations, the alternative store might be complementary in the type of task
and context of shopping. (Example: carrying heavy groceries vs. small items, last
minute needs vs. planned list shopping) Still, a lot of other combinations remain, which
leads to the conclusion that visit frequency presents a reality of big diversity. What is
certain is that 91% referred more than one store for grocery shopping. From these, 78%
said to be satisfied with their first choice destination. This corroborates with Kenhove
et al. (1999) which defended that “the presence of multi-store loyalty by consumers may
(…) not be a consequence of dissatisfaction with a store. Rather, it may be due to the
presence of different tasks that must be solved.”
retail type destination no car with car
hypermarket (1st choice) 24% 42%
supermarket (1st choice) 62% 49%
mini-market (1st choice) 0% 0%
traditional commerce (1st choice) 12% 3%
online (1st choice) 0% 3%
others (1st choice) 3% 3%
hypermarket (2nd choice) 9% 12%
supermarket (2nd choice) 41% 46%
mini-market (2nd choice) 3% 2%
traditional commerce (2nd choice) 26% 29%
online (2nd choice) 0% 3%
others (2nd choice) 3% 3%
No 2nd choice 18% 5%
firs
t ch
oic
ese
con
d c
ho
ice
On the contrary, the absence of multi-store loyalty may be consequence of depending
only on public transportation. As it is possible to observe, seniors with no car declared
three times more not having a second choice destination for groceries. Also, it is evident
that these same seniors tend to go mainly to supermarkets. Although it is evident that
Table 6 | retail type destination vs. car usage.

Empirical Results
91
they do appreciate hypermarkets (first choice 24% vs. second choice 9%), their
preference is concentrated mainly in proximity retailers: 74% visit supermarkets or
traditional commerce. Seniors with car, on the other hand divide evenly their first
choice between hypermarkets and supermarkets. Their preference only considers
traditional commerce, on a second choice context.
Analysing by insignia, it is possible to detect that almost half of the sample referred
visiting the supermarket chain Pingo Doce, either as first or second choice of
destination. On the second position of the ranking appears the hypermarket chain,
Continente. It is interesting to observe that while Continente is more frequently referred
as the first option, the ranking leader Pingo Doce is referred as a second choice
destination almost as often as first choice. It seems logical, that Continente will not have
the ability to be the nearby solution, typical of second choice destination. Pingo Doce,
however, may have the location characteristics to be the convenience shop for some and
dimension to be the main supermarket for others. The other insignias also mentioned
were Modelo, Lidl, Jumbo and Mini-preço. The “others” class includes chains that were
mentioned twice, the maximum, which include Intermarché, Corte Inglês, CNR and
Makro.
26%
32%
14%
7%
8%
5%8%
32%
11%
12%
14%
9%
9%
13%
Pingo Doce
Continente
Modelo
Lidl
Jumbo
Mini-Preço
others
1st choice
2nd choice
22
27
12
6
7
4
7
18
6
7
8
5
5
7
Pingo Doce
Continente
Modelo
Lidl
Jumbo
Mini-Preço
others
0 10 20 30 40 50
Referred destinations by insignia
2nd choice
first choice
Figure 30 | Visited insignias absolute frequencies Figure 30 | Visited insignias relative frequencies

Empirical Results
92
3.9 3.8 3.8
3.7
4.0
3.8
3.94.0 4.0
3.8
4.0 4.0 4.0
5.0
4.5
3.97
2.5
3.0
3.5
4.0
4.5
5.0
satisfaction score1st choice destination
satisfaction scorealternative destination
weighted average
global average
Regarding the declared satisfaction, most of the interviewed gave a positive evaluation
of the store they visited, being the average classification of 3.87 (Figure 31). The better
evaluated chains were Corte Inglês and Modelo Bonjour. Nevertheless, they scarcely
represent the stores chosen by the sample (only three people commented about both the
insignias). Curiously, the most referred visited store chain is the one which presents
lower satisfaction levels, together with Intermarché. Also, the second most visited store
chain, Continente, barely achieves the average classification of the sample.
proximity36%
price15%
convenience11%
product quality13%
promotions9%
product selection6%
staff3% store atmosphere
2%
client card and cupons
2%habit2%others
1%
Reasons for choosing a store
Figure 31 | Satisfaction score by insignia
Figure 32 | top of mind reason for choice of destination

Empirical Results
93
This leads to the question of why these senior customers choose the visited store if
others less chosen are better evaluated. More than a third of the inquired answered
choosing a given store because of its proximity (Figure 32). The satisfaction levels and
the reasons of choice seem coherent with Burnett’s work (1996), which defended that
senior dependency has predictive power over patronage behaviour, such as the salience
of proximity to home on store choice.
Examining other reasons that also influence the choice of destination, price, product
quality, convenience and promotions stand out. Summing up, it seems that the
traditionally most important factors in patronage decisions are the ones that move this
sample.
0
10
20
30
40
50
60
0%
10%
20%
30%
40%
50%
60%
70%
80%
90%
100%others
habit
client card and cupons
store atmosphere
staff
product selection
promotions
product quality
convenience
price
proximity
nº statements
Moreover, it is logical to question if there exists an association between each reason and
a given insignia. Since the frequency of clients is different for each insignia, it is only
possible to analyze the importance of each reason for visitors of each store, in a relative
approach. Lidl’s and Mini-Preço’s price image proves to have a proeminent position for
this sample. This fact is consistent with a Marktest study (2007) for a population
between 15 and 64, which concluded that Lidl and Mini-Preço had higher satisfaction
levels for this same factor. Pingo Doce’s main feature was proximity followed by
product quality. Continente was pointed out for proximity reasons too, but was also
remarked for its convenience and promotions. It is important to weigh the attributes
with the number of statements. For example, proximity was one third of the reasons
Figure 33 | top of mind reason by insignia. Relative frequencies.
Empirical Results
94
declared for Continente’s clients to select this insignia and this should be taken into
consideration. However the same cannot be said about Froiz. 100% of Froiz customers
highlighted this same reason, because only one opinion was given. Though promotions
were clearly not the most referred motive in general, it presented 15% of motives for
clients of Lidl and Continente to visit their selected store. For Lidl, this fact is coherent
with several statements that took place in the focus group phase. Comments such as: “I
see people running to Lidl because of their promotions” (MLN, 63 years old feeling 50)
and “I like Lidl for those kinds of things too.”[talking about a fierce promotion selling
tensiometers for a symbolic price] (OCB, 64years old, feelling 60) support the same
idea. Also interesting is to verify that store atmosphere was only mentioned for Pingo
Doce and client card and coupons was a motivation mostly referred by Modelo’s
clients.
5.2.4. Age vs. Shopper motivations and attribute importance
According to the results, it is possible to detect different trends on motivations’ and
attributes’ scores as age increases. Contrarily to what was expected, the variation of
these classifications did not present a clear continuous trend, when using subjective age
as the factor variable. With this criterion, only 3 items can lead to a possible conclusion.
Finding a bargain and dealing with a salesperson that is trying to please exhibit a raise
of importance as subjective age decreases. Possibly, the “subjective age” construct
expresses joviality pretentiousness for each inquired, rather than joviality per se.
However, analysing the traditional objective age by age levels many more variables
provide noteworthy suggestions.

Empirical Results
95
2.3
1.6
1.3
2.8
2.22.2
3.5
3.0
2.6
4.0
3.7
3.5
3.33.1
2.5
4.64.5
4.2
4.6
4.1
4.0
3.0 3.0
2.7
4.8
4.3 4.3
1.0
2.0
3.0
4.0
5.0
<59 between 60 till 69
>=70
buying online
negotiating price
shopping with people with similar tastes
Good parking
innovating products and novelties
Service quality
smooth music and nice decor
trying samples or enjoying the book areaclean and well lighted store
nice and attentive staff
More than one third of the variables tend to decline in importance as age increases.
Some of them are quite expectable to behave that way, such as buying online,
negotiating price, good parking and innovating products and novelties. Others are not
that obvious: smooth music and nice décor, service quality, clean and well lighted store,
nice and attentive staff and trying samples or enjoying the book area seem to be more
expendable as age increases. It is reasonable to wonder if these items importance
declination really has a meaningful relation with age or if age simply reduces
enthusiasm in general, overall.
Figure 34 | Descending trend of several item scores as objective age increases.

Empirical Results
96
2.42.5
3.2
3.9
4.24.4
3.33.5 3.5
2.0
2.72.9
1.0
2.0
3.0
4.0
5.0
<59 between 60 till 69
>=70
home or car delivery
home proximity
well known brands
talking with staff and customers
With the opposite behaviour, are the four following items: home or car delivery, home
proximity, well known brands and talking with staff and customers. The first two items
are facilitators of the delivery process which may seem harder to perform the older a
person becomes. Well known brands can be valued by their risk reduction function. The
more familiar the brand is, the easier it is to be selected and evaluated, and the less can
it be a reason for disappointment. Finally, talking with staff and customers tends to be a
motivation for shopping as people age. As already referred, people tend to see their
social network shrink as age goes forward, and shopping may be for some a way to turn
the other way around.
5.2.5. Shopper motivations and attribute importance
Attributes and motivations may present associations between themselves, caused by the
sharing of common factor. An easy example would be a shopper that is motivated by
discovering novelties when shopping, valuing a store that has an innovative product
selection. For detecting these relations in a precise way, correlations between attributes
and motivations were calculated. Since the values for both variables were in a lickert
scale (from 1 to 5) and therefore ordinal, Spearman’s correlation is the adequate
measure to use (See appendix for mathematical expression).
Figure 35 | Ascending trend of several item scores as objective age increases.

Empirical Results
97
Making use of SPSS, it is possible to promptly obtain the Spearman’s correlations
matrix for all the attribute and motivation variables. After a brief observation,
highlights were placed for some of the significant6 correlations with higher values
(above 0.4). Most of these correlations are rather predictable. Merchandise with
discount correlates with good prices in general (0.461), which is expectable, since both
are related with price orientation. Also, Being one of the first to have the latest fashion
or new products is powerfully related to Availability of novelties and new products
(0.494) and Getting to create a new “image” for myself or my home (0.418). This last
item is correlated as well with Shopping for a brand-new item to replace an older one
(0,500). Below are presented a few more items that present the same situation:
Item 1 Item2 Spearman
correlation
Quality of service
Friendliness of employees 0.584
Cleanliness and maintenance of well illuminated
store 0.401
friendliness of employees
Smooth music, decor and ambience 0.426
Cleanliness and maintenance of well illuminated
store 0.494
Cleanliness and maintenance of
well illuminated store: Smooth music, decor and ambience 0.494
Having a salesperson bring
merchandise out for you to choose
from:
Being waited on by a salesperson who is anxious
to please 0.620
Shopping with friends as a social
occasion
Shopping alongside other people who have
similar tastes as mine 0.571
Being waited on by a salesperson who is anxious
to please 0.408
Talking with salespeople and other
shoppers who are interested in the
same things as I am
Shopping alongside other people who have
similar tastes as mine 0.441
Getting to create a new “image” for myself or my
home 0.408
6 Significant at 0.01 level. However, significance is not an applicable concept for this study, since the
sample was not built randomly.

Empirical Results
98
5.2.6. Factor analysis
The items of the questionnaire aim to detect the shoppers’ underlying motivations and
valued attributes. In this research, all we have is data about accordance/discordance to
expressions that reflect a “hidden” rationale. For that purpose, factorial analysis is the
ideal technique to discover latent factors, because its “primordial goal is to provide a
score to constructs or factors that are not directly observable” (Maroco, 2007).
Factor analysing the motivation
variables7, a number of new variables
emerge. Using the criteria of
eigenvalue superior to 1, the number
of components that are retained are
six. The total of retained components
are able to explain 64% of the total
variance of the data. However, 25% of
the total variance is of exclusive
responsibility of the first component,
which presents an eigenvalue greater
then four. The KMO measure of
sample adequacy is 0.724, which is the
average level (Maroco, 2007).
Table 7 | Total variance explained by component
7 Using the recomendation referred in Maroco’s book (2007) for ordinal variables.
Total Variance Explained
Component
Initial Eigenvalues
Total % of Variance Cumulative %
1 4.163 24.488 24.488
2 1.609 9.464 33.952
3 1.443 8.487 42.439
4 1.370 8.058 50.497
5 1.222 7.186 57.683
6 1.011 5.947 63.630
7 .958 5.638 69.268
8 .872 5.132 74.400
9 .726 4.270 78.669
10 .633 3.725 82.394
11 .575 3.382 85.776
12 .555 3.263 89.039
13 .475 2.793 91.832
14 .426 2.507 94.339
15 .366 2.156 96.495
16 .343 2.015 98.510
17 .253 1.490 100.000
Extraction Method: Principal Component Analysis.

Empirical Results
99
The following table lists
the correlations between
the original variables and
the components. By
analysing the first column,
it is easily understood that
the first component
reflects the price
orientation motivation.
The highest scores are for
the variables:
“find_bargain”,
“compare_quality_prices”
and “price_negotiation”.
The second component,
oppositely, emphasizes
sociability variables, such
as “speak_clients_staff”,
“stroll with
acquaintances”,
“shopping_with_similar_t
astes”. This same
component, antagonizes the affiliation-related variables with the comparison shopping,
which is of a more rational nature. The third column, in turn, highlights “pleasing_staff”
and “staff_presents_choice”, both variables that relate with the power and authority
motivation. Also, “samples_or_book_area” presents a high value. Samples in particular
may be here associated to a pampering perspective. This same column seems to be
negatively related with “price_negotiation”, which seems to confirm the negative social
connotation of negotiating, already referred in the Retail Patronage chapter. The fourth
column demonstrates high values for the first three variables of the list: “replace_old”,
“new image”, and “being_pioneer”. These variables were associated to the anticipated
utility motivation, in Ganesh research (2007). The fifth column gives proeminence to
Rotated Component Matrixa
Component
1 2 3 4 5 6
replace_old .039 .120 .041 .801 .109 .034
new_image .140 .295 .129 .727 .047 .123
being_pioneer .239 -.051 .323 .555 .179 .103
shop_caution -.033 .002 .131 .205 .683 .171
find_bargain .385 .170 .160 .107 -.070 .467
compare_quality_prices .682 -.223 .051 .083 .138 .231
price_negotiation .709 .196 -.149 .097 .241 -.042
discount_defects .601 .147 .358 .082 -.310 -.058
exact_search .138 .047 .086 .061 .778 -.230
quick_shopping .109 .153 .248 -.193 .177 -.709
shopping_with_similar_tastes .205 .786 .152 .209 .002 .017
speak_clients_staff .593 .528 .080 .132 -.064 -.018
stroll_with_aquaintances -.071 .813 .248 .085 .074 .128
pleasing_staff -.046 .234 .730 .234 .056 -.048
staff_presents_choice .092 .149 .816 .216 .089 -.020
promotional_music_animation .145 .330 .202 -.038 .258 .638
samples_or_book_area .115 .127 .537 -.326 .307 .240
Extraction Method: Principal Component Analysis.
Rotation Method: Varimax with Kaiser Normalization.
a. Rotation converged in 9 iterations.
Table 8 | original motivation items vs components correlations

Empirical Results
100
two variables: “exact_search” and “shop_caution”. This is the mix of choice
optimization motivation with role enactment. Possibly, the item shop_caution, which
results from measuring accordance or not to the expression “Careful shopping as a way
to fulfill my household responsibilities”, was also felt as an exercise of optimizing
choice, for the interviewed. So, this component can be interpreted as mainly a choice
optimization factor. Finally, the sixth component seems to isolate an arousal seeking
motivation, because it scores high in “promotional_music_animation”, and
“find_bargain” and is negatively affected by “quick_shopping”. Summing up, the factor
analysis extracted six components that will be called: price orientation motivation,
affiliation factor, power and authority factor, anticipated utility factor, choice
optimization factor and Arousal factor.
Table 9 | Resulting motivation components and strongly related variables
Component strongly related variablesComponent's
chosen namecompare_quality_prices
price_negotiation
discount_defects
shopping_with_similar_tastes
speak_clients_staff
stroll_with_aquaintances
samples_or_book_area
pleasing_staff
staff_presents_choice
replace_old
new_image
being_pioneer
shop_caution
exact_search
find_bargain
quick_shopping (-)
promotional_music_animation
Price orientation
motivation
1
2affil iation
motivation
Arousal6
power and authority3
Antecipated Utility4
5 choice optimization
Comparing with Ganesh et al. (2007) factor analysis for motivations8, the results are
quite similar. From the seven dimensions found by these authors, 5 are also present in
this research: all, except role enactment and negotiation. Also, one new dimension
appears in this study: price orientation, which in some manner represents the negotiation
8 role enactment, negotiation, choice optimization, stimulation, anticipated utility, affiliation and power
and authority

Empirical Results
101
dimension directed to modern formats that largely compose the visited stores sample.
However it is important to stress that some dimensions are not strictly constructed in the
same way as the compared research. For example, arousal includes quick_shopping (-)
since it is the opposite of the goal of shoppers that intend to linger the shopping
experience.
The same way the factor analysis was pursued for motivation, the same procedure was
applied to attributes. Eight components were extracted for these variables, regarding
minimum value rule of 1 for their eigenvalues. The KMO measure of sampling
adequacy is 0.643, which is less than the factor analysis for motivations, but is still
acceptable (Maroco, 2007). With these eight components, it is possible to explain 67%
of the total variance of the total variables.
Table 10 | original attribute items vs components correlations
Rotated Component Matrixa
Component
1 2 3 4 5 6 7 8
solidarity_national_production .454 .467
-.361 .211 -.166 .093 -.157 .277
clean_clear_well_illuminated .751 .185 -.047 -.095 .075 -.029 .016 .157
smooth_music_nice_decoration .742 .092 .039 .107 .029 .067 .102 -.019
nice_acessible_staff .753 -.009 .201 -.185 .138 -.110 .022 .019
service_quality .620 .156 .327 -.052 .348 -.016 .042 -.200
putting_groceries_inbag .056 -.139 -.049 .219 -.236 .692 .176 .028
good_parking .220 .056 -.095 .092 .726 .087 .124 -.095
noqeues_checkouts -.030 .215 -.054 -.076 .357 .128 .693 .080
diverse_product_assortment .246 .725 .161
.147 .107 -.056 .164 -.060
recognized_brands .053 .368 .173 -.370 -.224 -.003 .328 .464
innovative_products .063 .719 .080 -.024 .097 .028 .011 -.026
home_car_delivery -.133 .134 .105 -.140 .219 .804 .003 .204
good_access .144 .162 .145 .015 .645 -.167 .022 .473
near_home .047 -.139 .154 .115 .068 .252 .080 .739
online_shopping .160 .347 .091 -.126 .212 .388 -.491 -.327
inside_cafeteria -.016 .035 .098 .733 .011 .130 .228 -.112
nearby_atm -.114 .083 .165 .747 .067 -.103 -.118 .249
good_quality_products .318 .027 .241 .194 -.012 .129 .649 .015
products_with_discount .038 .216 .764 .233 -.091 .025 -.052 .086
good_prices .209 .024 .779 .042 .050 .047 .140 .147
Extraction Method: Principal Component Analysis. Rotation Method: Varimax with Kaiser Normalization.

Empirical Results
102
The first component is strongly related to store atmosphere attributes
(clean_clear_well_illuminated and smooth_music_nice_decoration), service quality and
the staff’s friendliness and helpfulness. The second component is specifically dependent
on two product selection variables (diverse_product_assortment and
innovative_products), leaving behind the importance of the presence of recognized
brands (with a much lower coefficient: 0.368). The third component is clearly
highlighting price attributes, may it be in the form of HILO or EDLP format.
Interestingly, this third component is also negatively related to the store image attribute
that measures the importance of promoting solidarity campaigns or national production
association. The fourth component relates with enhanced retail services such as
nearby_atm and inside_cafeteria, but also negatively related to recognized brands. This
relation may be consequence of people that prefer enhancements are seekers of a simple
way of life, giving importance to comfort and not to brands, as long as they are good.
The fifth component is with no doubt the by car convenience factor. It presents high
coefficients for good_parking and good_access alone. The sixth component, in turn, is
related with convenience but not related to location specifically. It mixes two services
that help the delivery convenience: putting_groceries_inbag and home_car_delivery.
The seventh component antagonizes attributes that are directly related with time saving:
noqeues_checkouts and online_shopping. This same component is also strongly related
with good_quality_products. A possible interpretation is viewing this as product
checking factor. In other words, this factor may summarize the motivation of visiting
the store (instead of shopping online) in order to physically evaluate products. In this
perspective, it is natural to observe store proximity and fast checkouts as associated
variables since they are important facilitators for this kind of behavior. At last, the
eighth component seems to measure the high preference for a physical store nearby visit
in the opposite of buying online, so it sums up the by foot convenience motivation.
In sum, the factor analysis for these attribute variables gave origin to 8 components: the
atmosphere factor, the product selection factor, the price factor, the enhancements
factor, the by car convenience factor, the delivery convenience factor, the product
checking factor and the by foot convenience factor.
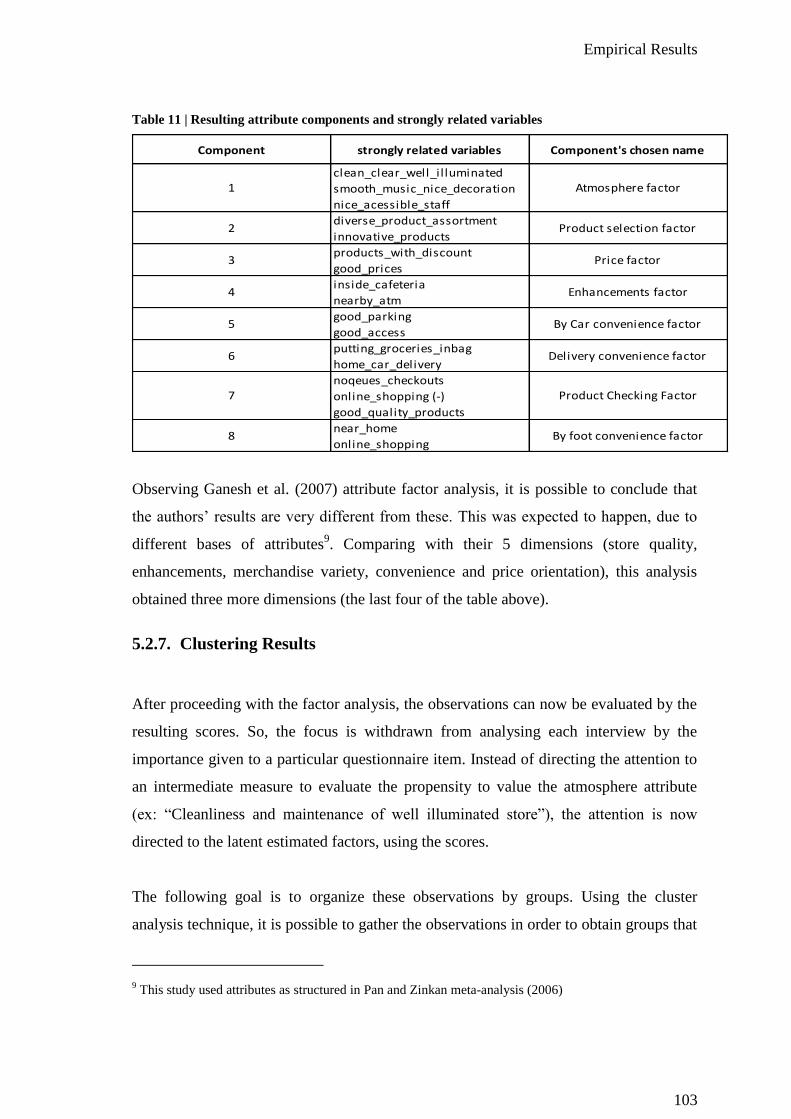
Empirical Results
103
Table 11 | Resulting attribute components and strongly related variables
Component strongly related variables Component's chosen name
clean_clear_well_il luminated
smooth_music_nice_decoration
nice_acessible_staff
diverse_product_assortment
innovative_products
products_with_discount
good_prices
inside_cafeteria
nearby_atm
good_parking
good_access
putting_groceries_inbag
home_car_delivery
noqeues_checkouts
online_shopping (-)
good_quality_products
near_home
online_shopping
Product Checking Factor7
By foot convenience factor8
4 Enhancements factor
5 By Car convenience factor
6 Delivery convenience factor
Atmosphere factor1
Product selection factor2
Price factor3
Observing Ganesh et al. (2007) attribute factor analysis, it is possible to conclude that
the authors’ results are very different from these. This was expected to happen, due to
different bases of attributes9. Comparing with their 5 dimensions (store quality,
enhancements, merchandise variety, convenience and price orientation), this analysis
obtained three more dimensions (the last four of the table above).
5.2.7. Clustering Results
After proceeding with the factor analysis, the observations can now be evaluated by the
resulting scores. So, the focus is withdrawn from analysing each interview by the
importance given to a particular questionnaire item. Instead of directing the attention to
an intermediate measure to evaluate the propensity to value the atmosphere attribute
(ex: “Cleanliness and maintenance of well illuminated store”), the attention is now
directed to the latent estimated factors, using the scores.
The following goal is to organize these observations by groups. Using the cluster
analysis technique, it is possible to gather the observations in order to obtain groups that
9 This study used attributes as structured in Pan and Zinkan meta-analysis (2006)
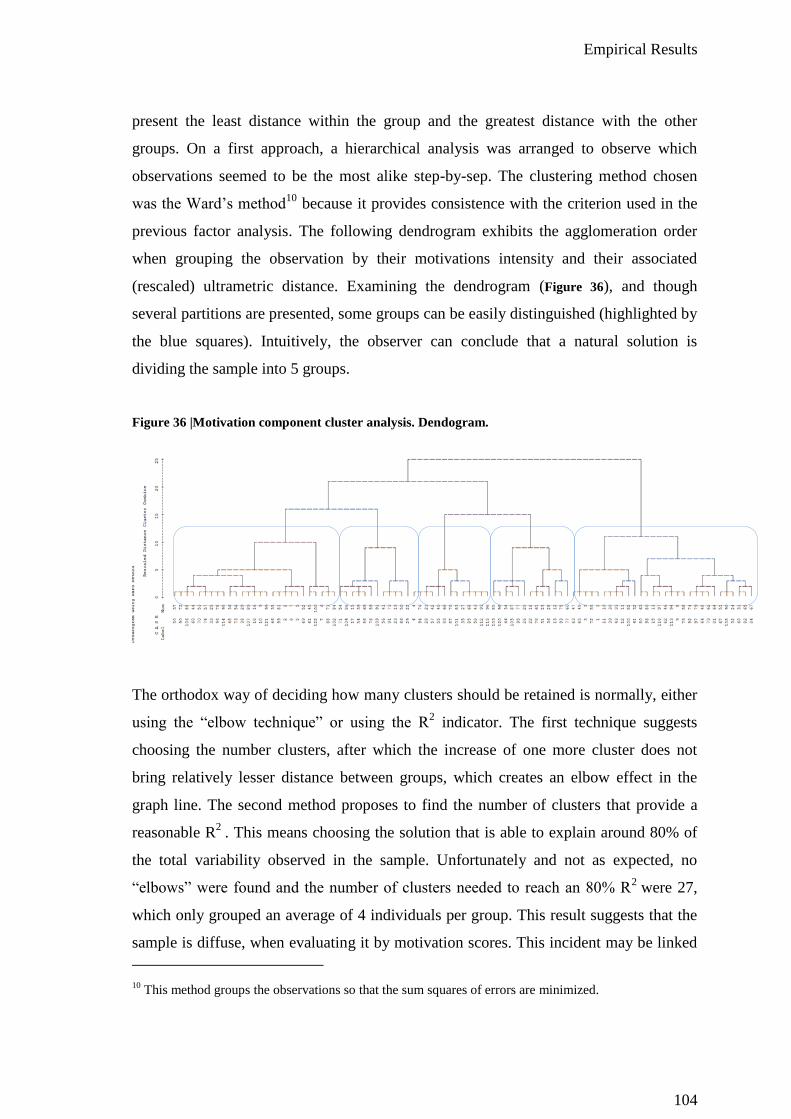
Empirical Results
104
present the least distance within the group and the greatest distance with the other
groups. On a first approach, a hierarchical analysis was arranged to observe which
observations seemed to be the most alike step-by-sep. The clustering method chosen
was the Ward’s method10
because it provides consistence with the criterion used in the
previous factor analysis. The following dendrogram exhibits the agglomeration order
when grouping the observation by their motivations intensity and their associated
(rescaled) ultrametric distance. Examining the dendrogram (Figure 36), and though
several partitions are presented, some groups can be easily distinguished (highlighted by
the blue squares). Intuitively, the observer can conclude that a natural solution is
dividing the sample into 5 groups.
Figure 36 |Motivation component cluster analysis. Dendogram.
The orthodox way of deciding how many clusters should be retained is normally, either
using the “elbow technique” or using the R2 indicator. The first technique suggests
choosing the number clusters, after which the increase of one more cluster does not
bring relatively lesser distance between groups, which creates an elbow effect in the
graph line. The second method proposes to find the number of clusters that provide a
reasonable R2
. This means choosing the solution that is able to explain around 80% of
the total variability observed in the sample. Unfortunately and not as expected, no
“elbows” were found and the number of clusters needed to reach an 80% R2
were 27,
which only grouped an average of 4 individuals per group. This result suggests that the
sample is diffuse, when evaluating it by motivation scores. This incident may be linked
10 This method groups the observations so that the sum squares of errors are minimized.

Empirical Results
105
with the initially referred fact that seniors are a very unpredictable segment (see chapter
2- in the end of the section “Senior lifestyle changes”), comparing with other age levels.
As the previously mentioned Silver’s study demonstrated, there are so many different
professional, personal or biological events that can occur in these age levels, that a very
wide variety of life cycle stages could be distinguished in the study. This reality could
explain the lack of strength found in this clustering. However, it is important to point
out that the diffuse sample can also be a result of a rather modest dimension of the
sample (n=100). If true, the best solution will be to develop further research with larger
samples.
21%
40%
53%
60%
66%71%
74%77%
80%430
326
258
217
184160
141124
110
0
50
100
150
200
250
300
350
400
450
500
0%
10%
20%
30%
40%
50%
60%
70%
80%
90%
100%
3 6 9 12 15 18 21 24 27
R2
no.clusters
Ward's R2
ultrametric distance
Nevertheless, it is still interesting to explore the 5 cluster analysis for this sample as an
insight to the senior segment. As previously referred in chapter 3 (“Clustering
Consumers”), 5 groups of consumers were found in Ganesh and Luckett’s study (2007):
the apathetic, the enthusiasts, the destination shoppers, the basic shoppers and the
bargain seekers. It is important to underline that this study was for a broader sample in
dimension (832), in age (no restrictions) and in retail formats (traditional mall, outlet
mall, discount store and category killer). However, the authors defended that their
solution should be applicable, independently of the format in focus. As proposed in their
research, “irrespective of the retail format, or the method employed, common shopper
Figure 37 | Ultrametric distance and Ward’s R2 evolution as clusters increase

Empirical Results
106
subgroups will be found amongst the customer base of traditionally different retail
formats” (Ganesh et al., 2007).
Assuming five clusters, it is possible to proceed with a k-means cluster analysis, which
is known as obtaining more rigorous results. Instead of hierarchical steps, this method
begins already with 5 divisions and tries to minimize the distance within groups through
successive iterations. For this cluster analysis only 8 iterations were necessary to
achieve the final result. Table 12 presents the centroids of the obtained clusters by
motivation factor and sets a portrait of each group11
.
Values 1 2 3 4 5
cm1_Price_orientation 0,24 -0,04 -0,37 0,57 -0,61
cm2_affiliation 0,53 -0,52 -0,71 -0,01 0,76
cm3_power_authority -0,56 0,81 -1,27 0,48 0,05
cm4_antecipated_utility 0,54 -1,14 -0,52 0,33 0,60
cm6_arousal -0,52 0,43 -0,18 -0,47 0,79
cm5_choice_optimization -1,27 -0,72 0,43 0,53 0,22
ca1_atmosphere 0,03 -0,06 -0,23 0,22 0,08
ca2_product_selection 0,23 -0,40 -0,31 0,35 -0,23
ca3_price -0,35 0,33 -0,42 0,17 0,08
ca4_enhancements -0,43 0,06 -0,11 0,17 -0,07
ca5_ByCarConvenience -0,16 0,10 -0,06 0,16 0,01
ca6_delivery_convenience -0,20 0,17 0,05 0,00 0,04
ca7_product_checking -0,29 -0,36 0,08 0,43 -0,33
ca8_ByFootConvenience -0,19 0,31 0,00 0,05 0,19
Clusters by Motivation Factors
The smallest cluster is number 1, with only 14 cases. It reveals relatively low scores for
choice optimization and arousal factors opposed with higher levels of affiliation and
anticipated utility. So, it seems that this segment wishes to perform the shopping task in
a simple and quick manner, which becomes more tolerable when there is an opportunity
to chat with other people or a chance to renew themselves or their home. This cluster
presented the highest average education level and a higher than average frequency of
married shoppers. They tend to go relatively more often to hypermarkets and traditional
11 Only motivation scores were used to build the clusters. The attribute factors (beginning with “ca”)
presented on Table 12 are included merely for cluster characterization purposes.
Table 12 | clusters centroids by factor
Empirical Results
107
neighbourhood shops than other segments. In comparison with other clusters, cluster 1
places higher importance in location, since they declared it relatively more often as their
primary reason for visiting their first option store. In contrast, their abstract evaluations
about proximity and good access presented lower averages than other groups. This
seems a contradiction and may imply that the interpretation of location was not the
same as proximity or good access.
The next group, cluster number 2, presented relatively low scores on most factors,
except for arousal and above all, power and authority. The things about shopping that
they seem to enjoy more than other groups are having staff pleasing them and
presenting them their choices. They also enjoy going to the book area and getting a free
sample is a very a welcomed treat. This segment exhibits a clear avoidance for
negotiation practices. However, it exhibits the highest average scores of price attributes.
Location appears to be important for them. Firstly, several items related with location
scored higher in average, as an abstract attribute. Secondly, convenience was the top
reason declared with more frequency for choosing their store, comparing with other
groups. Though this segment is the oldest in average, it is also the one that presented
more joviality than average (% difference between objective and subjective age). It also
displayed the highest technology level and maybe for that reason was also the group
that had relatively more cases of people choosing online shopping as their first option.
Comparing with the consumer clusters examined in chapter 3 (the apathetic, the
enthusiasts, the destination shoppers, the basic shoppers and the bargain seekers), only
one seems to match with this cluster analysis: the Basic shoppers. As observed in cluster
3, all motivations scored relatively low, except choice optimization, strongly related
with shopping cautiously and responsibly and searching exactly for what was planned to
be purchased. Most of the elements of this group revealed to prefer to go to
supermarkets and declared to be more satisfied with their adopted store than other
groups. Comparing with other groups, cluster 3 stated product quality as the reason for
choosing a store, more than average. Also, they do their groceries less often with their
spouses.
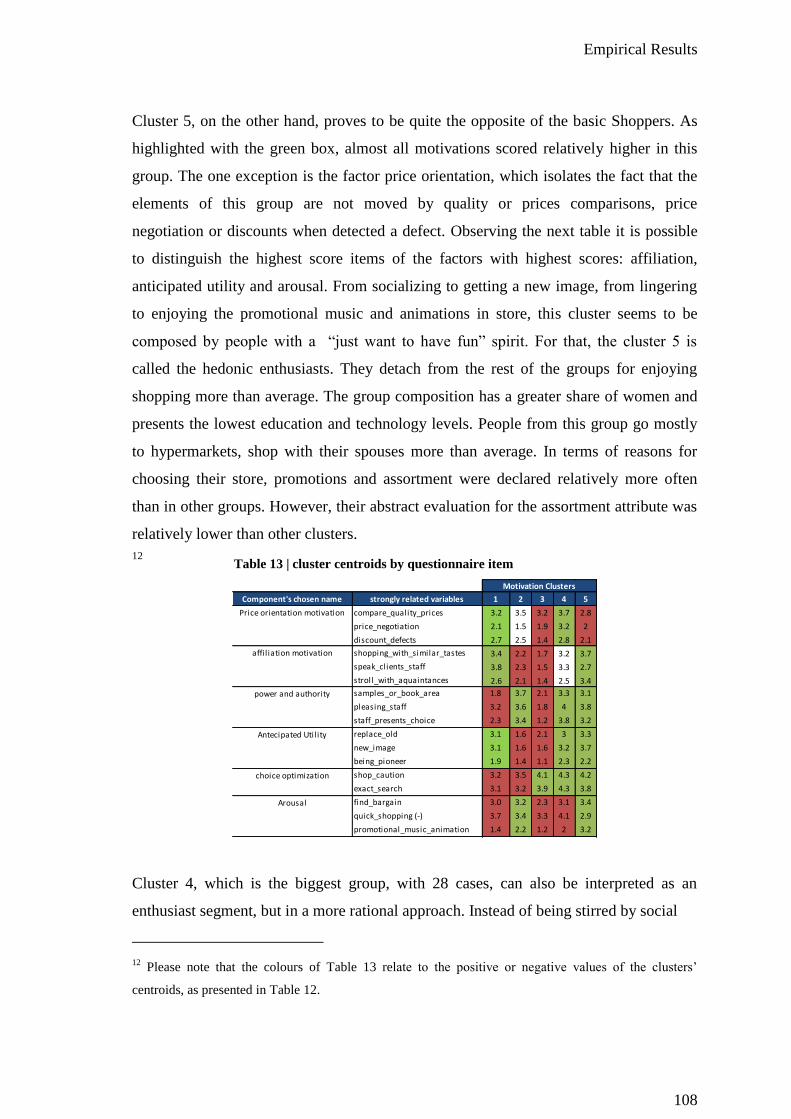
Empirical Results
108
Cluster 5, on the other hand, proves to be quite the opposite of the basic Shoppers. As
highlighted with the green box, almost all motivations scored relatively higher in this
group. The one exception is the factor price orientation, which isolates the fact that the
elements of this group are not moved by quality or prices comparisons, price
negotiation or discounts when detected a defect. Observing the next table it is possible
to distinguish the highest score items of the factors with highest scores: affiliation,
anticipated utility and arousal. From socializing to getting a new image, from lingering
to enjoying the promotional music and animations in store, this cluster seems to be
composed by people with a “just want to have fun” spirit. For that, the cluster 5 is
called the hedonic enthusiasts. They detach from the rest of the groups for enjoying
shopping more than average. The group composition has a greater share of women and
presents the lowest education and technology levels. People from this group go mostly
to hypermarkets, shop with their spouses more than average. In terms of reasons for
choosing their store, promotions and assortment were declared relatively more often
than in other groups. However, their abstract evaluation for the assortment attribute was
relatively lower than other clusters.
12
Component's chosen name strongly related variables 1 2 3 4 5
Price orientation motivation compare_quality_prices 3.2 3.5 3.2 3.7 2.8
price_negotiation 2.1 1.5 1.9 3.2 2
discount_defects 2.7 2.5 1.4 2.8 2.1
affil iation motivation shopping_with_similar_tastes 3.4 2.2 1.7 3.2 3.7
speak_clients_staff 3.8 2.3 1.5 3.3 2.7
stroll_with_aquaintances 2.6 2.1 1.4 2.5 3.4
power and authority samples_or_book_area 1.8 3.7 2.1 3.3 3.1
pleasing_staff 3.2 3.6 1.8 4 3.8
staff_presents_choice 2.3 3.4 1.2 3.8 3.2
Antecipated Utility replace_old 3.1 1.6 2.1 3 3.3
new_image 3.1 1.6 1.6 3.2 3.7
being_pioneer 1.9 1.4 1.1 2.3 2.2
choice optimization shop_caution 3.2 3.5 4.1 4.3 4.2
exact_search 3.1 3.2 3.9 4.3 3.8
Arousal find_bargain 3.0 3.2 2.3 3.1 3.4
quick_shopping (-) 3.7 3.4 3.3 4.1 2.9
promotional_music_animation 1.4 2.2 1.2 2 3.2
Motivation Clusters
Cluster 4, which is the biggest group, with 28 cases, can also be interpreted as an
enthusiast segment, but in a more rational approach. Instead of being stirred by social
12 Please note that the colours of Table 13 relate to the positive or negative values of the clusters’
centroids, as presented in Table 12.
Table 13 | cluster centroids by questionnaire item
Empirical Results
109
contact and animation, these elements are especially motivated with the rational
challenge that occurs during the shopping. What most attracts them are rigorous
comparisons of quality and prices, negotiation, the responsibility associated with the
purchase and the achievement of mastery in finding exactly what is needed.
Demographically, this group has a greater share of men and exhibits a lower age, in
average. When analysing the reasons for choosing their store, price and staff were
declared relatively more often than in other groups and also scored higher in similar
abstract evaluations.
In sum, the clusters obtained can be interpreted in the following way:
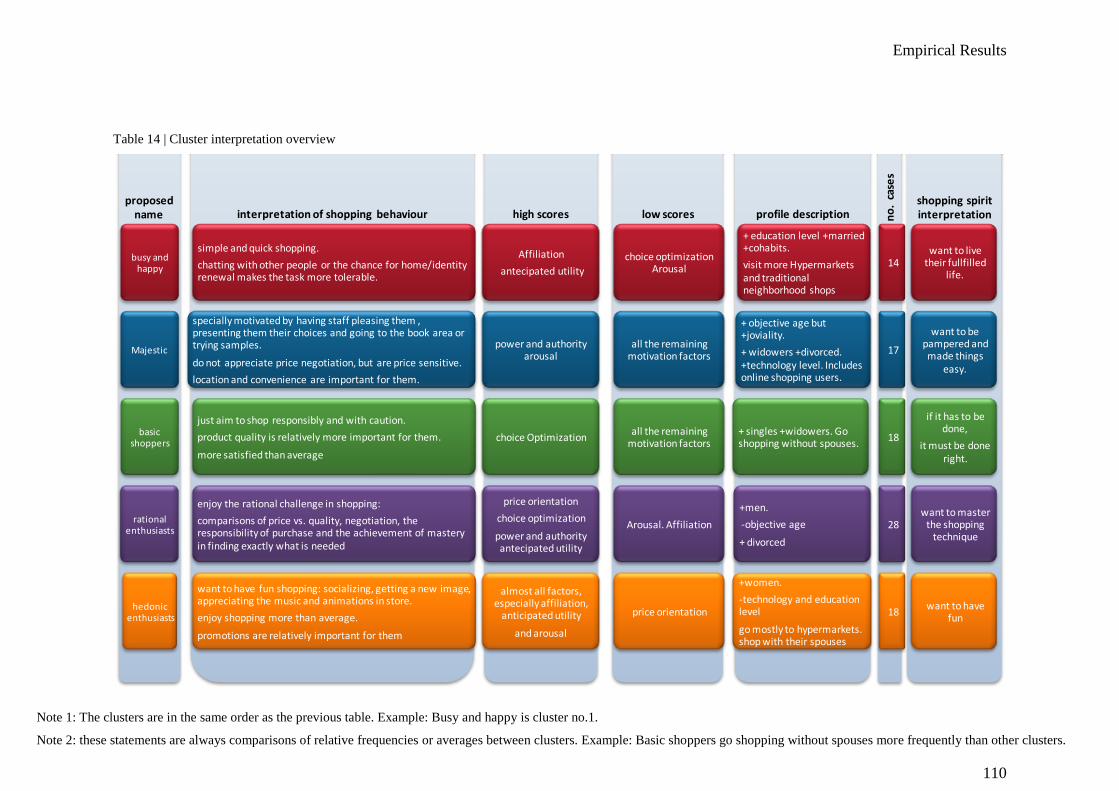
Empirical Results
110
Table 14 | Cluster interpretation overview
proposed name
busy and happy
Majestic
basic shoppers
rational enthusiasts
hedonic enthusiasts
interpretation of shopping behaviour
simple and quick shopping.
chatting with other people or the chance for home/identity renewal makes the task more tolerable.
specially motivated by having staff pleasing them , presenting them their choices and going to the book area or trying samples.
do not appreciate price negotiation, but are price sensitive.
location and convenience are important for them.
just aim to shop responsibly and with caution.
product quality is relatively more important for them.
more satisfied than average
enjoy the rational challenge in shopping:
comparisons of price vs. quality, negotiation, the responsibility of purchase and the achievement of mastery in finding exactly what is needed
want to have fun shopping: socializing, getting a new image, appreciating the music and animations in store.
enjoy shopping more than average.
promotions are relatively important for them
high scores
Affiliation
antecipated utility
power and authority arousal
choice Optimization
price orientation
choice optimization
power and authority antecipated utility
almost all factors, especially affiliation,
anticipated utility
and arousal
low scores
choice optimization Arousal
all the remaining motivation factors
all the remaining motivation factors
Arousal. Affiliation
price orientation
profile description
+ education level +married +cohabits.
visit more Hypermarkets and traditional neighborhood shops
+ objective age but +joviality.
+ widowers +divorced. +technology level. Includes online shopping users.
+ singles +widowers. Go shopping without spouses.
+men.
-objective age
+ divorced
+women.
-technology and education level
go mostly to hypermarkets. shop with their spouses
no
. ca
ses
14
17
18
28
18
shopping spirit interpretation
want to live their fullfilled
life.
want to be pampered and made things
easy.
if it has to be done,
it must be done right.
want to master the shopping
technique
want to have fun
Note 1: The clusters are in the same order as the previous table. Example: Busy and happy is cluster no.1.
Note 2: these statements are always comparisons of relative frequencies or averages between clusters. Example: Basic shoppers go shopping without spouses more frequently than other clusters.

Empirical Results
111
5.2.8. Conclusion
Overall Results summary
After database cleaning, a first approach to the sample allowed concluding that while
female/male shares of this sample are similar to the Portuguese senior universities
population, the age and education level were much higher (RUTIS, 2008).
Professionally, a relevant share of the interviewee worked as teachers, nurses or in some
kind of secretarial work. In their hobbies, besides attending courses, 75% declared
practicing physical exercise and almost half affirmed travelling regularly. Before further
analysis, relations between car usage and good parking lot importance were verified for
validation purposes. The same confirmation was done for internet usage and online
shopping availability importance. Both were demonstrated with success.
Regarding shoppers’ habits, more than 90% of the interviewees stated going to more
than one destination to shop groceries and one third of the sample declared combining a
weekly visit to the first choice store, with variable visits to an alternative store. Pingo
Doce was the most referred supermarket chain, either as first or second option, followed
by the hypermarket Continente. Pingo Doce was pointed out more often than others for
its proximity and product quality. On the other hand, Continente, which was also
frequently referred for its proximity, was declared to be chosen for its convenience and
promotions, more often than other stores. Though Pingo Doce is allegedly the most
visited store for this sample, it presented lower than average satisfaction levels, which
leads to believe that for some of these seniors, choice may be restricted to location
factors. If so, there may be a share of the senior segment which asks for better targeting
from neighbourhood commerce.
When observing motivation and attribute evaluations as objective age increases, it was
possible to detect that more than one third declined in importance. Though buying
online or innovating products are items the average scores of which are predictable to
decline, the same is not that clear about others, such as service quality or nice and

Empirical Results
112
attentive staff. This leads to believe that possibly seniors present less enthusiasm about
most attributes as they age. Among the four items that displayed an increasing trend of
average scores, two are attributes that facilitate the delivery process (home or car
delivery, home proximity) and one is a risk reducer (well known brands). Just one was a
positive motivation for shopping: talking to staff and customers.
The factor analysis section was useful to discover the underlying motivations and
valued attributes that actually explain the shopper’s behaviour. It revealed six
components which were named as price orientation, affiliation, power and authority,
anticipated utility, choice optimization and arousal. These factors were very close to the
proposed by Ganesh et al. (2007) research, when analysing motivations. The same
analysis for attributes, however, brought different conclusions. Eight components
emerged from the 20 original items: atmosphere, product selection, price,
enhancements, by car convenience, delivery convenience, product checking, and by foot
convenience. Comparing with Ganesh et al. (2007) research, relevant differences were
noticed which is comprehensible since some items were added. The first big difference
was that Ganesh’s convenience attribute unfolds into three types of convenience, in this
study. The second difference is a brand new factor, product checking, that may express
the wish of a shopper to physically visit the store in order to evaluate products with their
own senses, and then leave without any delay.
Finally, the next purpose of the analysis was to form uniform clusters to examine what
types of senior shoppers exist, when considering motivation. Though the sample
revealed to be very diffuse, it was possible to find five groups of senior shoppers in an
exploratory approach: The busy and happy, majestic, basic shoppers, rational
enthusiasts and hedonic enthusiasts. Comparing with a similar analysis for a wider age
level (Ganesh et al, 2007) only two clusters presented similarities: the basic shoppers
and enthusiastic. Both exhibit basic shoppers, a group of shoppers that appear generally
unmotivated to shop, except for one thing choice optimization, which expresses the
motivation to complete the shopping task effectively and to find “precisely the right
product to fit one’s demands.” (Westbrook and Black, 1985) However, opposite to
Ganesh et al. work (2007), the apathetic group did not emerge. Only enthusiasts appear

Empirical Results
113
to have relevance among the questioned seniors. Additionally, instead of appearing
unified, they are unfolded into rational and hedonic enthusiasts. Both groups present
high scores, but while rational enthusiasts enjoy the mental exercise of comparing
prices or the search of the right product, hedonic enthusiasts take pleasure mostly in
social contact and promotional animations in store. Bargain seekers, which were
representative in Ganesh et al. study, did not play an important role. Curiously in this
research, it materializes mixed up with an unexpected factor. Named as majestic, this
cluster was the highest in average scores for the price attribute. This cluster puts high
value on good prices in general and presence of merchandise on discount, but does not
appreciate any kind of bargaining practice. But additionally, this cluster was one of the
most driven by power and authority issues. They enjoy being waited on by a
salesperson who is anxious to please, having a salesperson bring merchandise out for
you to choose from and trying free samples or enjoying the book area . Finally, another
new cluster comes into sight in this study: the busy and happy. This cluster is not
exceptionally committed to the shopping task.
Often married and with an above average number of cohabits, the busy and happy value
quick and simple shopping, possibly because they have other goings-on in their limited
time. When they go shopping, they welcome above all the social contact and the act of
renewal embedded in the shopping experience. This cluster is quite coherent with the
new age senior lifestyle, described as increasingly more participative in cultural life and
Figure 38 | Cluster pattern Ganesh et al. (2007) vs. this study
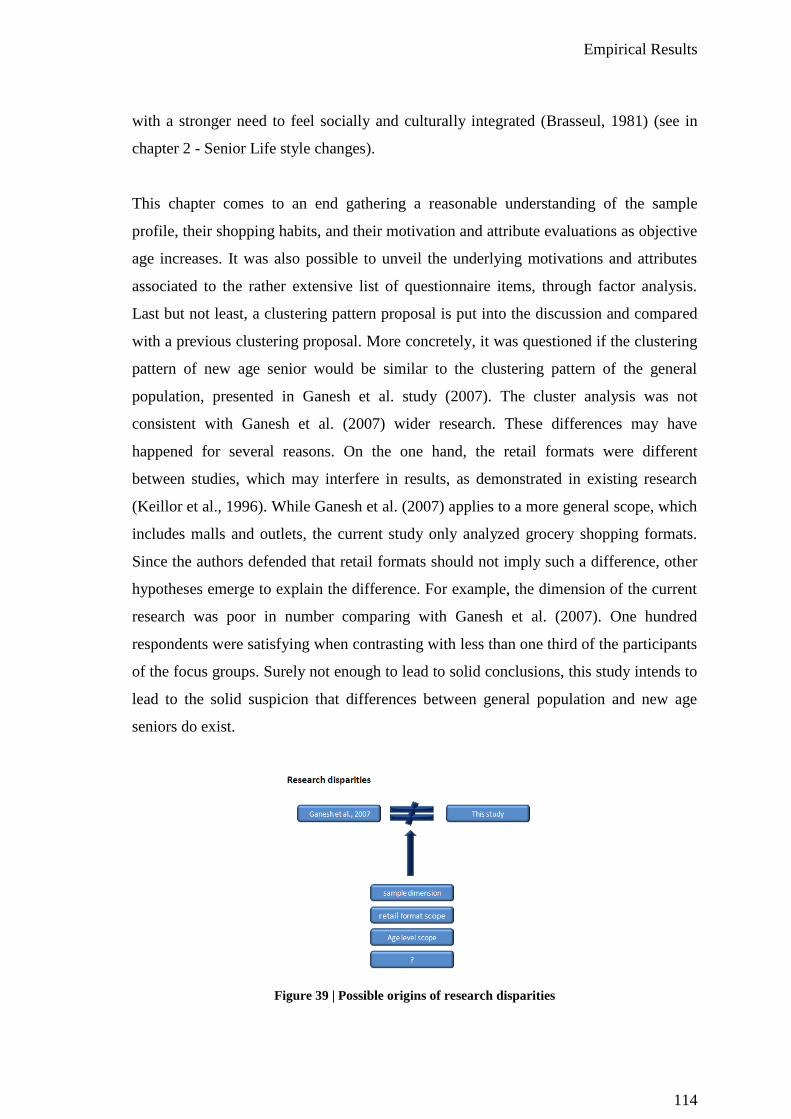
Empirical Results
114
with a stronger need to feel socially and culturally integrated (Brasseul, 1981) (see in
chapter 2 - Senior Life style changes).
This chapter comes to an end gathering a reasonable understanding of the sample
profile, their shopping habits, and their motivation and attribute evaluations as objective
age increases. It was also possible to unveil the underlying motivations and attributes
associated to the rather extensive list of questionnaire items, through factor analysis.
Last but not least, a clustering pattern proposal is put into the discussion and compared
with a previous clustering proposal. More concretely, it was questioned if the clustering
pattern of new age senior would be similar to the clustering pattern of the general
population, presented in Ganesh et al. study (2007). The cluster analysis was not
consistent with Ganesh et al. (2007) wider research. These differences may have
happened for several reasons. On the one hand, the retail formats were different
between studies, which may interfere in results, as demonstrated in existing research
(Keillor et al., 1996). While Ganesh et al. (2007) applies to a more general scope, which
includes malls and outlets, the current study only analyzed grocery shopping formats.
Since the authors defended that retail formats should not imply such a difference, other
hypotheses emerge to explain the difference. For example, the dimension of the current
research was poor in number comparing with Ganesh et al. (2007). One hundred
respondents were satisfying when contrasting with less than one third of the participants
of the focus groups. Surely not enough to lead to solid conclusions, this study intends to
lead to the solid suspicion that differences between general population and new age
seniors do exist.
Figure 39 | Possible origins of research disparities

Empirical Results
115
Research Questions Answers
After analyzing the results of both focus groups and survey, it is now possible to
address the research questions examined in chapter 1. Firstly, what was questioned in a
general way was what differences could be noticed between new age seniors and
traditional seniors, regarding their shopping motivations and preferences. Or in a more
concrete way, it was inquired if the statements about shopping preferences and
motivations of seniors found in the literature review correspond with the shopping
preferences and motivations of the seniors of this study sample. This general subject
was unfolded in several specific questions which will be now examined.
Do New Age seniors put as little regard on refined store atmosphere elements as
traditional seniors?
One of the research questions was finding out if new age seniors put as little regard on
refined store atmosphere elements as traditional seniors are stated to put. The focus
group participants give importance to atmosphere when it facilitated the shopping visit.
Therefore, instead of more refined attributes such as décor or music background, the
issues that were valued during discussion were lighting and space. Lighting was
declared to be an important attribute to assure a good perception of the store and its
products. Space, on the other hand, was valued in relative terms. Rather than a big
establishment, these seniors described enjoying a medium-sized store, with wide “airy”
corridors, where the layout is familiar for them, making them feel comfortable and in
control. Turning to the survey results, when asking the top of mind reason for choosing
a store, only 2% of the inquired answered issues related with atmosphere. These rare
answers were always associated to Pingo Doce, which was the most visited chain for
the studied sample. This last association also occurred during the focus groups. So,
regarding atmosphere, traditional and new age seniors seem to have a similar behaviour.

Empirical Results
116
Do new age seniors put the same value on affiliation and negotiation issues when
shopping as traditional seniors?
Also, it was questioned if new age seniors also put the same value on affiliation issues
when shopping as traditional seniors. For the focus groups participants, affiliation was
one of the most strongly evidenced motivations. The people encountered on their
shopping errands gain greater relevance and store employees assume several roles:
giving a sense of belonging, making the senior customer feel comfortable and in a
familiar atmosphere, being recognized, by giving personalized treatment. However,
according to the questionnaire results, the same is not concluded. For instance, only 3%
of the inquired mentioned staff as their main reason for their choice of store. When
analysing issues related to the affiliation motivation, all three items presented average
scores above the general average for motivations (3.0). Shopping alongside other people
who have similar tastes as mine, Talking with salespeople and other shoppers who are
interested in the same things as I am, Shopping with friends as a social occasion
presented average scores of 2.9, 2.7 and 2.5 respectively. However, it is noticeable that
talking with staff and customers is one of the 4 rare items that present a raise of
importance as age increases. In another perspective, it was evident that Dealing with a
sales person that is trying to please exhibits a raise of importance as subjective age
decreases. A possible interpretation is that shoppers who feel younger put higher value
in staff, but in a service angle. In sum, since focus groups and survey results suggest
opposite conclusions, this question needs to be more explored. Either focus groups
participants did not speak for the whole, being more of an exception, or the
survey/focus group results may be reflecting what the inquired thought to be a “should
be” answer, instead of their sincere feelings about the subject. Instead of the affiliation
motivation, what did stand out was that new age seniors put high value in having staff at
their service, the younger they feel.
Since Westbrook and Black (1985) empirical studies of shopper motivations noticed
that a mostly older age segment derived satisfaction from negotiation with salespeople,
the same question was raised for new age seniors in particular. Based on focus group
remarks, negotiation did not appear to be important and almost never mentioned.

Empirical Results
117
According to the survey results, the same conclusion is reached. Negotiation issues
were scored relatively low. The questionnaire item negotiating price and obtaining a
discount when defects exist presented average scores of 2.2 and 2.3. Besides being
above the middle of the scale, meaning just a minor appreciation (I would somewhat like
it), these items were much below the general average score for all attributes (3.7) and
were the lowest scores attributes, after the buying online accessibility. Additionally,
negotiating price became less valued as objective age increased for this sample.
Therefore, if traditional seniors derive in fact satisfaction from negotiating, then new
age seniors exhibit a solid difference in this issue.
Will the senior segment present different clusters to the ones presented by Ganesh 2007
for shoppers in general? Do New Age seniors also exhibit apathetic shopping
behaviour?
According to Lesser and Hughes shoppers typology study (1986), older consumers were
highly associated to the apathetic segment, presenting limited enthusiasm for shopping
and it was questioned if new age seniors also exhibit apathetic shopping behaviour.
Concerning attitude towards shopping, the focus groups participants’ opinions varied
between the two extremes. While some were extremely enthusiastic about the shopping
experience, others saw it as a mere task where contention must rule. However, the latter
attitude was mostly noted in the youngest group (between 54 and 58). Regarding the
survey results, several indicators lead to believe that new age seniors are not apathetic
about shopping. To begin with, a big majority, 73% of the inquired, declared enjoying
shopping for groceries. Also, from the groups resulting from the cluster analysis, none
followed the apathetic cluster’s pattern found in Ganesh et al. (2007), which presents
low scores for all motivations. The most similar group matches the basic shopper, which
has low scores for all motivation factors except choice optimization. But the other way
around, enthusiasts were clearly represented in one of the groups of this study.
Therefore, if traditional seniors tend to be apathetic about shopping, as Lesser and
Hughes defended, new age seniors do not seem to match this profile and are
consequently, relatively more enthusiastic.

Empirical Results
118
Does this segment put such a big emphasis on location, disregarding price and
brand diversity?
Another research question intended to understand if the new age segment emphasized
the location attribute as much as the traditional senior, disregarding price and brand
diversity. Both focus groups and survey reveal that location is a vital attribute, when
choosing the store to visit. The focus groups participants stressed that, besides being an
obvious facilitating factor for people that do not drive, proximity also allows a more
frequent visit, which enables other benefits such as maximizing social encounters and
outdoor activities, lower storage needs and fresher food. Observing the survey results,
more than one third (36%) of the sample spontaneously declared choosing their store for
proximity reasons. Coincidently, one third (33%) of the sample declared not using car
transportation for grocery shopping. Additionally, it was possible to observe that as
objective age increases, good parking importance declines while home proximity and
home or car delivery raise its average score. This leads to suspect that proximity
importance may be associated to car usage, which in turn is less frequent as people age.
If so, assuring a good location may be the decisive factor to capture the eldest senior
segment, even when talking about a relevant share of new age seniors, as defended by
Lesser and Hughes (1986). Still, price was the second most frequent answer detaining a
15% share of the sample, followed by product quality, convenience and promotions.
Also, when evaluating attributes in abstract it was clear that price and product quality
and price were the most valued, with average scores of 4.4 and 4.3. In absolute terms,
these scores are very high, almost reaching the maximum scale value, which means “I
would love that”. In relative terms, these scores are not only higher than the average
score of all the attributes evaluated, but also revealed to be equal or even superior to the
location items (home proximity =4.3; good access=4.1). Moreover, the motivation
Finding a bargain was one of the rare questionnaire items that exhibited a raise of
importance as subjective age decreases. So, price may be a strong driver, especially for
seniors who feel younger. Product selection, on the other hand, was not so essential for
the interviewees. Nevertheless, it was still referred by 6% of the sample as the main
factor for their choice of destination and was evaluated within average, in abstract.
Also, recalling the focus groups interventions about product selection, it was perceived

Empirical Results
119
that instead of a wide range of products, a medium size store would be preferred. In
conclusion, even for this new age seniors’ sample, location may be a strong determinant
factor of choice. For a relevant share of interviewees, that are young at heart but already
facing physical impediments for driving, choice might be restricted, forcing to
underplay other attributes, such as product selection and even price. However, there is
still a bigger share remaining that will decisively give priority to price and quality. In
sum, though a relevant share of new age seniors present similarities with the traditional
ones when it concerns the store location constraint in choice, another more relevant
share is not as dependent, demanding good price and quality.
Is store image still the attribute that triumphs over the distance barriers?
One more topic that was raised to debate was about the power of store image, which
exceptionally triumphed over the distance barriers, opposite to the other remaining
attributes, when analysing traditional seniors. It was questioned if new age seniors
would present a similar reaction. According to survey results, this topic was not possible
to evaluate. Store image is difficult to measure and the study questionnaire only
contained one related item (importance of Solidarity or National Production campaigns
in abstract terms), which would not be enough to reach any conclusion. In focus groups,
though store image evaluations about specific store chains did not transpire, a general
view about hypermarkets came to light. Though hypermarkets are globally well-
considered in relation to most prices and convenience aspects, they were also evaluated
as expensive for some categories such as fresh fruit. Since this sample is still close to
countryside origins they are aware of the big difference between national producer
prices and hypermarket prices. To aggravate, a relevant part of participants confront the
difficulties that the national agriculture is facing with the increasing imports of fruits
and vegetables. For this reason, the focus groups participants tend to prefer
neighbourhood shops for these products, which are in fact closer. So, for what was
observed in empirical results, store image was not seen as overriding location factors.
No conclusions were obtained here.

Empirical Results
120
In what do New Age seniors exhibit different shopping behaviour, comparing with
traditional seniors?
Summing up, comparing with traditional seniors (as they are described in the literature
review), the two main differences detected in new age seniors concerning their shopping
motivations and preferences were an inferior negotiating tendency and a lower
propensity to exhibit an apathetic profile. The strength of affiliation motivation in new
age seniors remains unclear, but it is possible to suspect that staff as a service
component is well appreciated since the questionnaire item Dealing with a sales person
that is trying to please increased its importance as subjective age decreased. The
clustering pattern of new age seniors also presents a different pattern from Ganesh et al.
(2007) results for an all age group population. If the age levels are proven to be the sole
accountable for these differences then it is possible to propose that the only cluster that
remains the same is the basic shopper. In that scenario, new age seniors do not present
an apathetic profile and present instead two types of enthusiastic (rational and hedonic).
Also, instead of bargain seekers which declare openly their strive for prices and
discounts, the cluster that appears for this segment are the majestic, which are also
relatively price sensitive but are not fond of negotiating and declare valuing having staff
pleasing them. Finally, another new cluster appears: the busy and happy. They value
quick and simple shopping more than average. Since they are relatively more
accompanied (frequently more married and with an above average number of cohabits),
this segment may be more time- restricted. Though the shopping task is relatively less
central in their lives, when they go shopping, they do welcome the social contact and
the renewal embedded in the shopping experience. The busy and happy seem to match
perfectly the New Age senior lifestyle, which has been described as increasingly more
active in cultural and social life.
Conclusion
121
6. Conclusion
The current study aimed to identify the New Age senior shopping profile, by
understanding their underlying motivations and attribute preferences when shopping for
their groceries.
The following chapter will go over the main points approached in this dissertation. It
will reflect on the contribution of each chapter, highlighting major empirical findings
and conclusions. Afterwards, a reflection will be developed on the impact of such
conclusions in the business environment, in the section of managerial implications.
Before ending, a section dedicated to limitations and suggestions for further research
will point out several frailties found in this research, to assure a critical point of view
and to try to turn the shortcomings into an opportunity of improvement in future studies.
6.1. Overview and major findings
During the Senior Segment literature review (Chapter 2), it was possible to attain a
deeper knowledge of the elderly shopper. An insight of how age influences consumer
behavior was analyzed. However, a Guatemalan proverb is becoming more and more
useful day by day: “everyone is the age of their heart”. In other words, it was perceived
that the contemporary senior is not necessarily the stereotype that has been observed in
the past and that a New Age senior is emerging. Besides presenting what distinguishes
the New Age seniors from the traditional seniors, several reasons were pointed out to
explain why we are entering a ”New Age for ageing” such as the baby boomers
character, demographic trends, recent active ageing policies, advancements in science
and the change of life events timings.
After devoting attention to the senior segment, the chapter about retail patronage
(Chapter 3), focused on understanding why consumers, being seniors or not, shop where
they do. This literature review demonstrated how so many factors can be taken into

Conclusion
122
account during this decision process. Besides the classical product-related attributes,
such as price and perceived quality, store-related attributes were proven to influence
store selection. Convenience, atmosphere, personnel, among others, all are weighed for
this matter. Also, and to increase this subject complexity, the last decades of research
reveal that even the shoppers’ motivations for shopping are implied in this decision
process. For instance, Westbrook and Black’s proposal (1985) presented as basic drives
for shopping: power and authority, negotiation, anticipated utility, choice optimization,
role enactment, affiliation and stimulation. In this perspective, chapter 3 expresses the
retail patronage concept as a rather unexpected cocktail, where the motivation mix of
each shopper will result in the right amount of ingredients (read attributes) for an ideal
store.
The next step was to combine the retail patronage rationale to the senior shopper,
directing the spotlight towards the New Age segment. In the methodological
considerations (chapter 4), the challenge of better understanding the New Age senior
shopper is detailed into several research questions. To answer them, three focus groups
and a survey were taken into action to provide empirical support. This required special
methodological considerations on how New Age seniors should be sampled, how to
obtain the best receptivity of this group, when addressing them as seniors, and which
form of communication promised to be the most successful. Taken into account the
New Age senior profile described in chapter 2, the sample was built based on the
assumption that senior universities’ students were an excellent example of the target
population: dynamic people over 55, showing interest in learning and in participating in
cultural and social activities.
Recalling Mark Twain’s quote, “Age is an issue of mind over matter. If you don’t mind,
it doesn’t matter.” After examining the outcome of this exploratory study in chapter 5,
a richer insight to the New Age seniors’ reality was achieved. It’s time to dare
answering to the first question of this dissertation. Does age matter in shopping, even if
you don’t mind?
Conclusion
123
Seniors will be seniors
As dynamic as New Age seniors may be, still there are age barriers that are not possible
to ignore. Biological and psychological changes eventually occur with aging,
disregarding the spirit. Consequently, New Age seniors also face some constraints
which lead them to value similar attributes as much as traditional seniors do. Empirical
support provided evidence to that fact for store atmosphere and location.
As already proven for traditional seniors, New Age seniors do not seem to give great
importance to store atmosphere. Exceptions were made for good lighting and space,
since both work as shopping facilitators. Good lighting assures a good perception of the
store. Space (airy but not big) is valued when the layout is familiar and when too much
mobility is not required.
“Location, location, location” is here applied more than ever. Besides atmosphere, the
power of location seems to be a common ground for traditional and New Age Seniors.
Both focus groups and survey results give evidence that proximity is a key factor for
store selection. Additionally, several analysis lead to believe that this attribute is
especially decisive for seniors that do not use car transportation. Even when young at
heart, a relevant share of New Age seniors still face physical impediments for driving,
which restrains the area for store selection, similarly as for traditional seniors.
Tradition is not what it used to be
While physical impediments still appear as age increases, New Age seniors do present a
different energetic spirit that nearly makes age an issue that does not matter that much.
Or at least it does not matter as much as it used to. When observing this study’s results,
it is possible to notice rupture of what is traditionally observed in seniors.
For instance, negotiation, which is referred in previous research as relevant motivation
for traditional seniors, generally scored low in this study. There was a general avoidance

Conclusion
124
of negotiation issues, which leads to believe that there is a negative connotation of this
practice for the respondents.
Affiliation motivation, on the other hand, is rather unclear for New Age seniors. While
focus groups participants provided several statements which give the impression that
affiliation is highly valued in all aspects when shopping, survey results lead to believe
that this issue has minor importance. Quantitative analysis provides evidence to suspect
shoppers who feel younger put higher value in staff, but in a service angle (more related
to power and authority motivation).
Finally, New Age seniors present a major difference comparing to the traditional. While
the latter has been proven to have high propensity to be apathetic shoppers, New Age
seniors seem to be the contrary. Besides frequent declarations of shopping enjoyment,
this study did not come across an apathetic profile in the cluster analysis. In the
opposite, two types of enthusiasts (hedonic and rational) appeared to be relevant.
Segmenting a segment
The clusters found for New Age seniors not only differ from the traditional seniors but
they also present different clusters comparing to the general population (Ganesh et al.,
2007). Except for the basic shopper that appears in both perspectives, the New Age
senior clustering presents specificities that deserve better exploration. Though the
analysed data was highly scattered, five clusters were proposed for New Age shopper
typologies: the busy and happy, the majestic, the basic, the rational enthusiasts and the
hedonic enthusiasts. By identifying them and their associated key motivations, it is
possible to focus on increasing benefits on the attributes they give greater importance
to, which in turn enhances their satisfaction.

Conclusion
125
6.2. Managerial Implications
Mass-merchandise retailers should adapt to the emerging demographic trend. Since
seniors are becoming more increasingly relevant, this means targeting higher… in age.
According to the results of this study, it is possible to draw the New Age elderly perfect
store profile.
Irrespective of being a New Age or a traditional senior, a medium size store located in
the neighbourhood is perceived as ideal. Location appears to be a crucial factor for both
kinds of seniors, possibly because of decreasing car usage, as seniors age. However, a
small-sized store does not mean a narrow one. Although atmosphere does not appear to
be determinant for choice of destination for both traditional and New Age seniors, the
layout must assure the inexistence of stalled corridors and good lighting is valued.
Layouts are therefore important as long as they distract seniors from their restrictions,
making them feel just like a regular customer. According to focus groups statements,
this could mean product positioning such as putting milk and water near the exit, or
avoiding small items in low shelves. Additionally, this may be the origin of already
observable trends in stores: rest areas, magnifying glasses, etc…
Overcoming the supremacy of the location attribute, the two most valued attributes are
the classics: quality and price. Moreover, diversity is not detected as a strong
requirement and power of branding does not score high (both in survey and focus
groups). Therefore, one way to provide quality for modest prices may be through own
labels. It is also important to point out that perceived product quality is specially
mentioned for fresh food categories, according to focus group statements. In this
context, it is possible to perceive that traditional commerce has a vantage point for
providing national produce, in priority, which also offers lower prices.
Regarding price, it is important to notice that even the most price-sensitive cluster of the
New Age senior sample does not appreciate bargaining.
It is possible to notice that this perfect store profile is very similar to what is observed
for the most visited store chain in this study. Nevertheless, satisfaction scores for this

Conclusion
126
generally preferred destination is around 3.7, which is slightly above average and
timidly reaching the 4 score, which would reveal a solidly satisfied shopper. For that
reason, it appears that there is still work to be done to match the senior shopper
requirements. In that context, the clustering results may work as a clue to help to
understand what further motivations are still to be met.
According to the cluster analysis, apathetic shoppers do not seem relevant in the New
Age senior’s sample. On the contrary, enthusiast shoppers unfold into hedonic and
rational. This turns up to be a positive panorama, since the aim is to attract customers
who are already easily attracted to some kind of components of the shopping task. If so,
the online shopping solution risks being the opposite of what is demanded by this
segment (unless they are from the busy and happy cluster). Though home delivery (by
phone or personal demand) may be valued, the online format1 may eliminate part of the
task that is actually appreciated, such as the affiliation or the product-checking factors.
Contrarily, this rationale may induce the start off of other innovating actions. One
example can be happy hour promotions in low peak periods. In this case, benefits can be
enlarged at schedules that are mainly possible to seniors by providing, for example,
more availability of staff. However, this same action will possibly not succeed with the
busy and happy, who have multiple requests to reconcile.
In sum, within the diversity of the whole population, the seniors own diversity may be
puzzling. As Piper and Capella (1993) claim, “the diversity of the market makes target
market selection more complex with results being less certain”. The fact that seniors are
so diverse makes them a segment difficult to target, but not without rewards. The best
action is surely to maintain a segment analysis posture and to carry on understanding
deeper the New Age senior.
1 which is unpopular among seniors for its technology ability requirements

Conclusion
127
6.3. Limitations and Suggestions for Further Research
Examining this research as a whole, some limitations were found that must be
considered for an honest and critical point of view and as an instrument to develop,
when stepping forward.
Firstly, this research was focused partly on baby boomers reaching their retirement
years, in a context where seniors’ segment growth is empowering them not only in
number and resources but also institutionally, through the emergence of active ageing
policies in developed countries. Consequently, conclusions aim to be valid only for the
near generations and not necessarily for other generations, such as generations Y or X.
For future generations, it is not possible to draw assumptions, and the biggest certainty
is the changeability of the older consumer requirements. However, what is proposed
here is that baby boomers are shattering the paradigm of the seniors’ way of living.
Concerning the Focus Group stage, some issues must be taken into account. The fact
that the groups interviewed were already formed and known to each other is frequently
understood as a participation facilitator for the discussion. Nevertheless, the within
groups proximity could also have led to a less desirable outcome. As Gibbs (1997)
defended, “the method of focus groups discussion may also discourage some people
from trusting others with sensitive or personal information.” For example, promoting an
upper rank chain or restraining from giving importance to price factors could have
happened for the purpose of achieving a status image towards fellow colleagues.
Regarding the survey phase, the sample was small, not built randomly and was limited
to the Greater Oporto area. Therefore, another sample building method or a different
geographical area might lead to different conclusions about senior shopping behaviour.
In other words, the quantitative results can not claim to be representative, but more of
an exploratory nature. They are a middle point between the narrow focus group scope
and a broader survey that would have to reach a wider share of the target population.
Conclusion
128
Besides, it should be pondered if the results of this study are effectively comparable
with Ganesh et al. cluster analysis (2007), which was for a much broader scope of retail
formats. Though the authors expected their results to apply to all formats, results leave a
reasonable doubt about it. In Zinkhan and Pan’s research, in 2006 it was suggested
further exploration of the effect of age on retail patronage across various store types and
product types (e.g. convenience versus non convenience goods).
Also, it is important to point out a research obstacle hard to overcome. The absence of
an apathetic cluster in this study may be either result of the inexistence of apathetic new
age senior shoppers or it may well be consequence of a self-selection bias. As referred
by Ganesh et al. (2007), “more enthusiastic shoppers could have been more likely to
participate”. In that perspective, apathetic shoppers may have slipped away from the
sample, precisely for their lack of motivation about grocery shopping issues.
Lastly, the age concept needs to be re-examined. Though chronological age presents an
objective view, which is easier to put into practice, subjective age isolates better the
group in focus. However, this last criterion has a very personal nature, which detaches
from the scientific approach of any academic study. As it was possible to conclude by
the results, the questionnaire measures for subjective age seem to have detected better
the joviality pretension, rather than the joviality per se. For a deeper view about
subjective age, different measures need to be explored. As defended by Gillham (2000),
“questionnaires are self-conscious things. Are the answers (…) what people really
think”?

Bibliography
129
Bibliography
(2008), Revista Focus, vol. 461., 13 August.
(2009), '2009 summer national senior games: Fast facts', Access year: 2009.
http://www.2009seniorgames.org/pdf/09_FastFacts.pdf
(2009), 'População sénior gosta de viajar', Turismo de Lisboa.
Ahmad, R. (2003), 'Benefit segmentation: A potentially useful technique of segmenting
and targeting older consumers', International Journal of Market Research, vol. 45, no.3,
pp. 373-388.
Alpert, M. l. (1971), 'Identification of determinant attributes: A comparison of methods',
Journal of Marketing Research, vol. Vol. VIU, no.May, 191, pp. 184-191.
Baker, R. (2008), 'Mature thinking', In-Store, February.
Berry, L. L., K. Seiders and D. Grewal (2002), 'Understanding service convenience',
Journal of Marketing, vol. 66, no.July, pp. 1-17.
Beyer, A. M. (2008), 'The beauty of focus groups', Global Cosmetic Industry, vol. 176,
no. 1, pp. 32-33.
Bitner, M. J. (1992), 'Servicescapes: The impact of th physical surroundings on
customers and employees', Journal of Marketing, vol. 56, pp. 57-71.
Bloch, P. H., N. M. Ridgway and S. A. Dawson (1994), 'The shopping mall as
consumer habitat', Journal of Retailing, vol. 70, no.1, pp. 23-42.
Boulding, W., A. Kalra, R. Staelin and V. A. Zeithaml (1993), 'A dynamic process
model of service quality: From expectations to behavioral intentions', Journal of
Marketing Research, vol. 30, no.1, pp. 7-27.
Briesch, R. A., P. K. Chintagunta and E. J. Fox (2009), 'How does assortment affect
grocery store choice?', Journal of Marketing Research, vol. XLVI, no.April
2009, pp. 176–189.
Brito, P. Q. (2008), 'Conceptualizing and illustrating the digital lifestyle of youth',
Working Paper no. 207, LIAAD/INESC-Porto, Faculdade de Economia da
Universidade do Porto pp.1-25
Burnett, J. J. (1996), 'Comparing the patronage selection criteria of the elderly:
Chronological age versus dependency', The international Review of Retail,
Distribution and Consumer Research, vol. 6, no.3, pp. 243-257.

Bibliography
130
Buttle, F. (1992), 'Shopping motives constructionist perspective', Service Industries
Journal, vol. 12, no.3, pp. 349-367.
Carrilho, M. J. and L. Patrício (2008), 'A situação demográfica recente em portugal',
Revista de Estudos Demográficos, vol. 42, no. 4.
Chernev, A. and R. Hamilton (2009), 'Assortment size and option attractiveness in
consumer choice among retailers', Journal of Marketing Research, vol. XLVI,
no.June 2009, pp. 410–420.
Correia, I. (2008), 'Marketing relacionado a causas - factores que influenciam a compra
de produtos solidários', Master Thesis, FEP
Dabholkar, P. A. (1996), 'Consumer evaluations of new technology-based self-service
options: An investigation of alternative models of service quality', International
Journal of Research in Marketing, vol. 13, no.1, pp. 29-51.
Darley, W. K. and J.-S. Lim (1993), 'Store-choice behavior for pre-owned merchandise',
Journal of Business Research, vol. 27, pp. 17-31.
d'Astous, A. (2000), 'Irritating aspects of the shopping environment ', Journal of
Business Research, vol. 49, pp. 149-156.
Deaton, A. (2005), 'Franco modigliani and the life cycle theory of consumption', in
Convegno Internazionale Franco Modigliani, February 17th–18th, Rome.
Dobbelstein, T. and K. Klebl (2006), 'Development of the generation 50plus and their
effects on retail marketing: An insight into the german market', Academic
Journal of Vaal University of Technology, vol. 3.
Dodds, W. B. and K. B. M. D. Grewal (1991), 'Effects of price, brand, and store
information on buyers' product evaluations', Journal of Marketing Research, vol.
28, no.3, pp. 13.
Donovan, R. and J. Rossiter (1982), 'Store atmosphere: An environmental psychology
approach', Journal of Retailing, vol. 58, no.1, pp. 34-57.
Doyle, P. and I. Fenwick (1974), 'How store image affects shopping habits in grocery
chains', Journal of Retailing, vol. 50, no.4, pp. 39-52.
Dychtwald, M. K. (1997), '"Marketplace 2000: Riding the wave of population change"',
Journal of Consumer Marketing, vol. 14, no.4, pp. 271-275.
Elliott, R. (1994), 'Addictive consumption: Function and fragmentation in
postmodernity', Journal of Consumer Policy, vol. 17, no.2, pp. 159-179.
Farrington, M. (2007), 'A senior moment', Brand Strategy, no. 210, pp. 8-8.

Bibliography
131
Ford, D., L.-E. Gadde, H. Hakansson and I. Snehota (2006), The business marketing
course: Managing in complex networks, Chichester: John Wiley & sons Ltd.
Forman, A. M. and V. Sriram (1991), 'The depersonalization of retailing: Its impact on
the "Lonely" Consumer', Journal of Retailing, vol. 67, no.2, pp. 18.
Ganesh, J., K. E. Reynolds and M. G. Luckett (2007), 'Retail patronage behaviour and
shopper typologies: A replication and extension using a multi-format, multi-
method approach', Journal of the Academy of Marketing Science, vol. 35, pp.
369-381.
Gibbs, A. (1997), 'Focus groups', Social Research Update, no.19, pp. 8.
Gillham, B. (2000), Developing a questionaire, London - New York: Continuum.
Gordon, T., H. R. Moser and W. E. Warren (2002), 'Serving the needs of matures
citizens: Strategies and techniques for targeting the 50+ population', Services
Marketing Quaterly, vol. 24(1).
Green, B. (2003), 'Age group marketing', National Jeweler, vol. 97, no. 3.
Grégoire, Y. (2003), 'The impact of aging on consumer responses: What do we know?',
Advances in Consumer Research, vol. 30.
Grewal, D., J. Baker, M. Levy and G. Voss (2003), 'The effects of wait expectations and
store atmosphere evaluations on patronage intentions in service-intensive retail
stores', Journal of Retailing, vol. 79, pp. 259-268.
Haynes, P. J. (1990), 'Hating to wait: Managing the final service encounter', The
Journal of Services Marketing, vol. 4, no.4, pp. 20-26.
Huddleston, P., J. Whipple and A. VanAuken (2004), 'Food store loyalty: Application
of a consumer loyalty framework', Journal of Targeting, Measurement and
Analysis for Marketing, vol. 12, no.3, pp. 213-230.
IEFP (2001), 'Classificação nacional de profissões – versão 1994',no, Instituto de
Emprego e Formação Profissional
INE (1999), 'As gerações mais idosas ', Série de Estudos, vol. 83.
INE (2002), O envelhecimento em portugal: Situação demográfica e socio-económica
recente das pessoas idosas, Lisbon: Serviço de Estudos sobre a População do
Departamento de Estatísticas Censitárias e da População.
INE (2003), 'Projecções de população residente em portugal 2000-2050', Informação à
comunicação social.
INE (2007), 'População', Indicadores Sociais 2006.

Bibliography
132
INE (2009), 'Estatísticas demográficas 2008', População e Sociedade.
J.Joseph Cronin, J., M. K. Brady and G. T. M. Hult (2000), 'Assessing the effects of
quality, value and customer satisfaction on consumer behavioral intentions in
service environments', Journal of Retailing, vol. 76, no.2, pp. 193-218.
Jacob, L. (2008), 'Participação activa da população idosa na sociedade', Revista
Rediteia, vol. 42.
Kassaye, W. W. (1990), 'The role of haggling in marketing: An examination of buyer
behavior', The Journal of Consumer Marketing, vol. 7, no.Fall 1990, pp. 53-62.
Keillor, B. D., R. S. Parker and R. C. Erffmeyer (1996), 'The evaluative criteria of the
elderly in a retail experience: Product-related vs. Store-related factors', Journal of
Marketing Management (10711988), vol. 6, no.2, pp. 61-71.
Kenhove, P. V., K. DeWulf and W. VanWaterschoot (1999), 'The impact of task
definition on store-attribute saliences and store choice', Journal of Retailing, vol.
75, no.1.
Korgaonkar, P. K., D. Lund and B. Price (1985), 'A structural-equation approach toward
examination of store attitude and store patronage behavior', Journal of Retailing,
vol. 61, no.2, pp. 39-60.
Kress, V. E. and M. F. Shoffner (2007), 'Focus groups: A practical and applied research
approach for counselors', Journal of Counseling and Development, pp. 189-194.
Lesser,J. A. and M. A. Hughes (1986), 'Towards a typology of shoppers', Business
Horizonsno.November-December 1986, pp. 56-62.
Lindquist, J. D. (1974), 'Meaning of image: A survey of empirical and hypothetical
evidence', Journal of Retailing, vol. 50, no.4, pp. 29-116.
Lusa (2009), 'Computador para seniores comercializado a partir de setembro', SOL 16
de Junho.
Lyon, P., D. Kinney and A. Colquhoun (2002), 'Experience, change and vulnerability:
Consumer education for older people revisited', International Journal of
Consumer Studies, vol. 26, no.3, pp. 178-187.
Magalhães, M. d. G. (2003), 'Quem vive só em portugal', Revista de Estudos
Demográficos, vol. 33, no. 4, pp. 55-68.
Mano, H. (1999), 'The influence of pre-existing negative affect on store purchase
intentions', Journal of Retailing, vol. 75, no.2, pp. 24.
Marktest (2008), A outra geração: Os séniores, Marktest.

Bibliography
133
Marktest.com (2007), 'Distribuição moderna em portugal', Marktest.
Maroco, J. (2007), Análise estatística - com utilização do spss, 3rd Edition ed.: Edições
Sílabo.
Martineau, P. (1958), 'The personality of the retail store', Harvard Business Review, vol.
36, no.1, pp. 47-55.
Mathur, A., E. Sherman and L. G. Schiffman (1998), 'Opportunities for marketing travel
services to new-age elderly', Journal of Services Marketing, vol. 12, no.4, pp.
265-277.
McGoldrick, P. (2002), Retail marketing, second ed. New York: McGraw-Hill
Education.
McGoldrick, P. J. and C. P. Pieros (1998), 'Atmospheres, pleasure and arousal: The
influence of response moderators', Journal of Marketing Management, vol. 14,
no.1/3, pp. 173-197.
Mochis, G., C. Curasi and D. Bellenger (2004), 'Patronage motives of mature
consumers in the selection criteria of food and grocery stores', Journal of
Consumer Marketing, vol. 21, no.2, pp. 123-133.
Mochis, G. and A. Mathur (2006), 'Older consumer responses to marketing stimuli: The
power of subjective age', Jounal of Advertising Research, vol. September 2006,
pp. 339-346.
Monteiro, H. and F. Neto (2008), 'Universidades da terceira idade: Da solidão à
motivação', vol. Doctoral Thesis, Faculdade de Psicologia e de Ciências da
Educação da U. P.
Moore, M. and J. Carpenter (2006), 'The effect of price as a marketplace cue on retail
patronage', Journal of Product & Brand Management, vol. 15, no.4, pp. 265-
271.
Morgan, D. L. (1997), Focus groups as qualitative research, 2nd ed.: SAGE
Publications.
OECD (2006), Ageing and employment policies - statistics on average effective age of
retirement, OECD. Available at
http://www.oecd.org/document/47/0,3343,en_2649_34747_39371887_1_1_1_1,
00.html
Ou, W.-M., R. Abratt and P. Dion (2006), 'The influence of retailer reputation on store
patronage', Journal of Retailing and Consumer Services, vol. 13, pp. 221–230.
Pak, C. and A. Kambil (2006), 'Over 50 and ready to shop: Serving the aging consumer',

Bibliography
134
Journal of Business Strategy, vol. 27, no.6, pp. 18-28.
Pan, Y. and G. M. Zinkhan (2006), 'Determinants of retail patronage: A meta-analytical
perspective', Journal of Retailing, vol. 82, no.3, pp. 229-243.
Parasuraman, A., V. A. Zeithaml and L. L. Berry (1988), 'Servqual: A multiple-item
scale for measuring consumer perceptions of service quality', Journal of
Retailing, vol. 64, no.1, pp. 5-6.
Patterson, P. G. (2007), 'Demographic correlates of loyalty in a service context ',
Journal of Services Marketing, vol. 21, no.2, pp. 112-121.
Piper, W. S. and L. M. Capella (1993), 'Male grocery shoppers' attitudes and
demographics', International Journal of Retail & Distribution Management, vol.
21, no.5.
Portal do Cidadão (2008), 'Acesso à reforma/aposentação antecipada', Access year:
2009.
http://www.portaldocidadao.pt/PORTAL/pt/Dossiers/DOS_est++225++na+altur
a+de+descansar++o+que+preciso+para+pedir+a+reforma.htm?passo=4
Puchta, C. and J. Potter (2004), Focus group practice, London: SAGE Publications.
Quilter, J. (2003), 'Grey pride', In-Store, December, pp. 21-23.
Roberts, J. A. and C. Manolis (2000), 'Baby boomers and busters: An exploratory
investigation of attitudes toward marketing advertising and consumerism',
Journal of Consumer Marketing, vol. 17, no.6, pp. 481-499.
RUTIS, N.-. (2008), A caracterização das utis Available at http://www.rutis.org/cgi-
bin/reservado/scripts/command.cgi/?naction=4&mn=EkpFuVlEZFVUvrjMAo.
Sherman, E., L. G. Shiffman and A. Mathur (2001), 'The influence of gender on the
new-age elderly's consumption orientation', Psychology & Marketing, vol. 18,
no.10, pp. 1073-1089.
Silvers, C. (1997), 'Smashing old stereotypes of 50-plus america', Journal of Consumer
Marketing, vol. 14, no.4, pp. 303-309.
Sinha, S. T. a. P. K. (2008), 'Choice of a retail store and retail store format: A
hierarchical logit model', Working Paper April 3rd, Indian Institute of
Management.
Sihori, N., E. W. McLaughlin and D. R. Wittink (1998), 'A model of consumer
perceptions and store loyalty intentions for a supermarket retailer', Journal of
Retailing, vol. 74, no.2, pp. 223-245.
Smithson, J. (2000), 'Using and analysing focus groups: Limitations and possibilities',

Bibliography
135
International Journal of Social Research Methodology, vol. 3, no.2, pp. 103-
119.
Solgaard, H. S. and T. Hansen (2003), 'A hierarchical bayes model of choice between
supermarket formats', Journal of Retailing and Consumer Services, vol. 10, pp.
169-180.
Solomon, M. R. (1985), 'Packaging the service provider', The Service Industries
Journal, vol. 5, no.July, pp. 64-72.
Soriano, V. and B. Nair (2002), 'So many seniors, so few specialty retailers', ICSC
Research Quarterly, vol. 9, no.2.
Szmigin, I. and M. Carrigan (2001), 'Learning to love the older consumer', Journal of
Consumer Behaviour, vol. 1, no.1, pp. 22-34.
Tang, C. S., D. R. Bell and T.-H. Ho (2001), 'Store choice and shopping behavior: How
price format works', California Management Review, vol. 43, no.2, pp. 56-74.
Tauber, E. M. (1972), 'Why do people shop?', Journal of Marketing, vol. 36, pp. 46-49.
Veloso, E. (2008), 'A análise da política da terceira idade em portugal, de 1976 a 2002',
VI Congresso Português de Sociologia. Mundos sociais: Saberes e Práticas, pp.
1-12.
Veloso, E. C. (2000), 'As Universidades da terceira idade em Portugal : Contributos
para uma caracterização.', IV Congresso Português de Sociologia, 17-19 April,
Coimbra.
Waerden, P. v. d., A. Borgers and H. Timmermans (1998), 'The impact of the parking
situation in shopping centres on store choice behaviour', GeoJournal, vol. 45,
pp. 309–315.
Walters, R. G. and H. J. Rinne (1986), 'An empirical investigation into the impact of
price promotions on retail store performance', Journal of Retailing, vol. 62, no.3,
pp. 237.
Westbrook, R. A. and W. C. Black (1985), 'A motivation-based shopper typology',
Journal of Retailing, vol. 61, no.1, pp. 78-103.
Woodside, A. G. and R. J. Trappey (1992), 'Finding out why customers shop your store
and buy your brand: Automatic cognitive processing models of primary choice',
Journal of Advertising Research, vol. 32, no.6, pp. 59-78.
Yoo, C., J. Park and D. J. MacInnis (1998), 'Effects of store characteristics and in-store
emotional experiences on store attitude', Journal of Business Research, vol. 42,
pp. 253–263.

Bibliography
136
Yoon, C., G. Laurent, H. Fung, R. Gonzalez, A. Gutchess, T. Hedden, R. l. Lambert-
Pandraud, M. Mather, D. Park, E. Peters and I. Skurnik (2005), 'Cognition, persuasion
and decision making in older consumers', Marketing Letters, vol. 16, no.3-4, pp. 429-
441.
Youn-Kyung, K., K. Jikyeong and K. Minsung (2005), 'The relationships among family
and social interaction, loneliness, mall shopping motivation, and mall spending of older
consumers', Psychology & Marketing, vol. 22, no.12, pp. 995-1015.
Zaltman, G., R. K. Srivastava and R. Deshpande (1978), 'Perceptions of unfair
marketing practices: Consumerism implications', Advances in Consumer
Research, pp. 247-253.
Zeithaml, V. A. (1988), 'Consumer perceptions of price, quality, and value: A means-
end model
and synthesis of evidence', Journal of Marketing, vol. 52, no.3, pp. 2-22.

Appendix

Appendix
138
7. Appendix
7.1. Focus group questionnaire
This is a translated version of the brief questionnaire responded by each participant
before the occurrence of the focus group interview. This information supported the
focus group sample analysis.
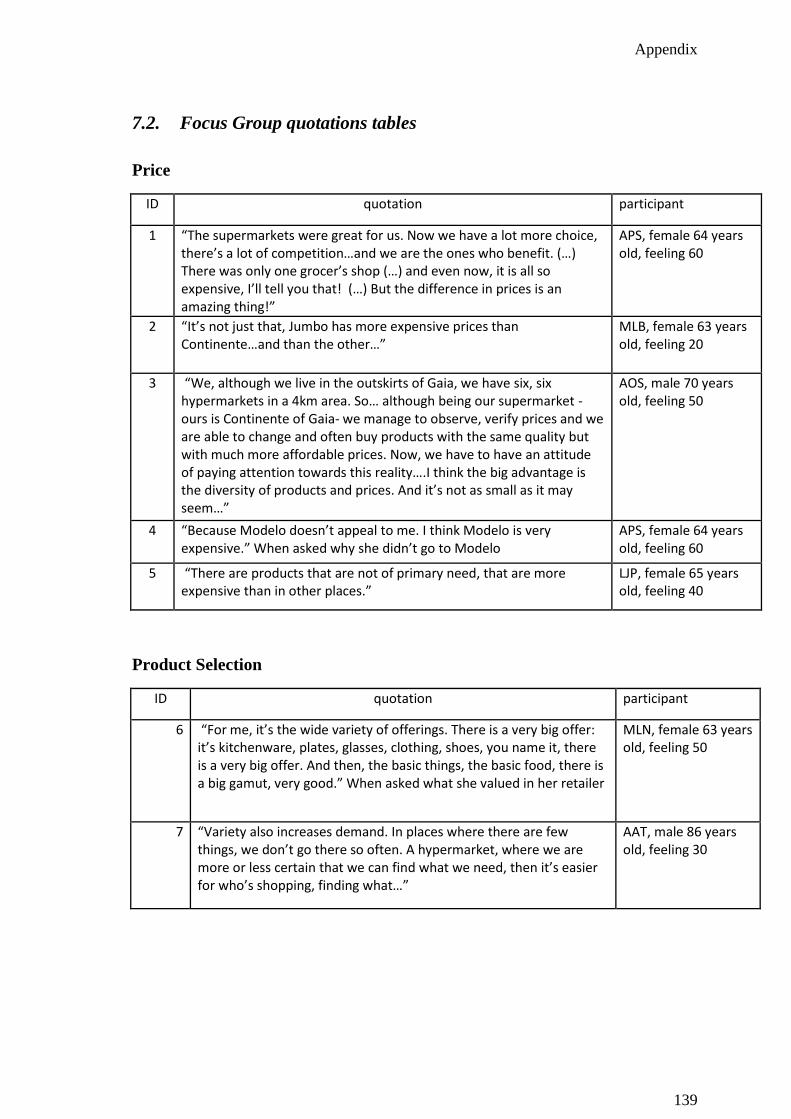
Appendix
139
7.2. Focus Group quotations tables
Price
ID quotation participant
1 “The supermarkets were great for us. Now we have a lot more choice, there’s a lot of competition…and we are the ones who benefit. (…) There was only one grocer’s shop (…) and even now, it is all so expensive, I’ll tell you that! (…) But the difference in prices is an amazing thing!”
APS, female 64 years old, feeling 60
2 “It’s not just that, Jumbo has more expensive prices than Continente…and than the other…”
MLB, female 63 years old, feeling 20
3 “We, although we live in the outskirts of Gaia, we have six, six hypermarkets in a 4km area. So… although being our supermarket - ours is Continente of Gaia- we manage to observe, verify prices and we are able to change and often buy products with the same quality but with much more affordable prices. Now, we have to have an attitude of paying attention towards this reality….I think the big advantage is the diversity of products and prices. And it’s not as small as it may seem…”
AOS, male 70 years old, feeling 50
4 “Because Modelo doesn’t appeal to me. I think Modelo is very expensive.” When asked why she didn’t go to Modelo
APS, female 64 years old, feeling 60
5 “There are products that are not of primary need, that are more expensive than in other places.”
LJP, female 65 years old, feeling 40
Product Selection
ID quotation participant
6 “For me, it’s the wide variety of offerings. There is a very big offer: it’s kitchenware, plates, glasses, clothing, shoes, you name it, there is a very big offer. And then, the basic things, the basic food, there is a big gamut, very good.” When asked what she valued in her retailer
MLN, female 63 years old, feeling 50
7 “Variety also increases demand. In places where there are few things, we don’t go there so often. A hypermarket, where we are more or less certain that we can find what we need, then it’s easier for who’s shopping, finding what…”
AAT, male 86 years old, feeling 30

Appendix
140
Quality
ID quotation participant
8 “Food…and the quality of food. Not the price, but the quality is what matters to people our age.”
MEM female, 83 year old, feeling 50
9 “If its meat, or fruit. I don’t appreciate supermarkets when it comes to fruit”.
Non identified voice
10 “(…) I told her that I wasn’t pleased by the way the products were being sold, all being touched. And when the fruit isn’t good quality, it isn’t that much patted,…but when it is bad quality, you know…the worse it gets, because…and that’s a shame…”
MF, male 70 years old, feeling 70
11 “Not just for the people there, but also because of the quality of the meat.” When asked why she went to neighbourhood shops
PVQ, female 76 years old, feeling 60
12 “Another important thing about supermarkets, since i live nearby one, and I think it is very useful for me… we don’t spend that much in supermarkets, except in bread, it’s bread Alentejo style, it’s granny’s bread, it’s bread like bakers around here don’t know how to do…It’s a bread with a rich mixture of rye and wheat, dark bread…I appreciate what everyone does, right? I go there to bring bread….”
MF, male 70 years old, feeling 70
13 “And normally, I don’t buy fruit, or fish, or meat in the hypermarkets. Just rice, pasta, and those sort of things…cleaning products. Fruit I always buy in the traditional commerce, always, always, and meat and fish too…because I think they don’t have as much quality. Maybe I’m wrong, but….even fruit and everything.”
MAS,female 58 years old, feeling 40
Store Atmosphere
ID quotation participant
14 “Now it’s not that bad, but when Continente opened, I hated going there. Now, it’s not like that, mind you. Probably, because it was the first, you went with the trolley forward and were always being pushed by the trolley in the back…Oh, Jesus! It was terrible…that made me crazy!!! A person wanted to move around, and a family of 4 or 5 members would stop the trolley and a person would not know where to move to… I was rooted to the spot and that made me crazy. Some went one way, others stopped right in the middle, …(…) but fundamentally, it was a chaos of people, entire families went there…”
OCB, female 64 years old, feeling 60
15 “I like it when it is spacious.” ASN, female 78 years old, feeling 70

Appendix
141
16 When asked what they valued when going to a hypermarket: “Air” Non identified voice
17 “But I’ll tell you one thing, if I were to go, it would still be in ex-Carrefour, because the space is wider, it’s more open.”
OCB, female 64 years old, feeling 60
18 When asked what they valued when going to a hypermarket: “Smooth music”
Non identified voice
19 “I have already gone to Jumbo of Parque Nascente. I don’t like Parque Nascente, it’s very dark. I went there for the stores, but it’s hard to see things well…Dark, and without examining things, I don’t buy…I like Continente, the attendees , you can notice that Continente does things better everyday…”
LJP, female 65 years old, feeling 40
20 “Now, every hypermarket is concerned about having a little coffee-shop running inside, where a person can enjoy a cup of coffee, where a person can have a cupcake… but not every supermarket has that…. In the hypermarkets, that concern already exists. That concern doesn’t exist in every supermarket and I think it would be very interesting. Sometimes, a person goes out for groceries and would have a cup of coffee, but there is no machine, there’s nothing…And it’s something that adds to a place.”
MLN, female 63 years old, feeling 50
21 “I don’t like too big places, where I lose myself trying to find the things from the list I carry. (…) And Pingo Doce, It’s like this …not too big not too small and I already learned where things are placed, so I don’t take long (…)”.
MBT, female 70 years old, feeling 50
22 “Another excellent thing that supermarkets provide is, on those hot summer days, I leave shut the door unlocked and calmly go to the supermarket, for a walk, watching all those things and entertaining myself and feeling the coolness of that air conditioning, it even gets hard to leave.”
MF, 70 years old male
Staff
ID quotation participant
23 “It counts for us to be welcomed almost as if we were family. XXXX , that I know it is an overstatement… a familiar handling from the employees…. They don’t know a thing about my life, neither do I about theirs, but they are considerate, do you understand?”
MEM, female 80 years old, feeling 50

Appendix
142
24 “The small neighbourhood shops, for example. Going to the bakery, or going to…It is the place where we know all the news from the village! ... I only go there from time to time, but when my wife goes there…to a bakery just 1 km away, she lingers half an hour or more…and she brings all the gossip. It has the proximity advantage, the closeness to people.”
AOS, male 70 years old, feeling 50
25 “And then, they are not well informed! I’ll tell you a story briefly. There were some photo albums in promotion, that were being publicized in Dica and I got there and asked the employee: -The photo albums…did they run out already? They were just from yesterday’s and there is nothing left here. - well, that I don’t know… (…) but maybe the cashier has a clue. So, I went to the cashier and asked: -Miss, so and so,… -Look, I don’t know because I went on vacation -Then, to whom should I ask to know that and that? - to the section employee. -But he directed me to come to you. -Then,…I don’t know. It’s amazing! They never know a thing!”
JR, male 73 years old, feeling 40
26 “I think it is very important that assistance is a little bit personalized where we are already known…. -Look, this is not your size. You see? By creating empathy, we’ll go with the flow (…) -yes, you may exchange If you need.”
MEM, female 80 years old, feeling 50
27 “but those that are near the doorway have a tendency to know a little more, to chat a little more than they should! And those sort of things for me, for example, bother me, irritate me! I don’t like it at all!”
RMC, female 51 years old, feeling 30
28 “Oh, I don’t like it! One reason why I choose to go shopping in the hypermarket is precisely so I don’t have to have contact with a soul. I go there, I leave the park and it’s over. I don’t like it….” When speaking about personalized assistance
GJM, male 62 years old, feeling 60
29 “It is very important that they know about products…(…) … They give their suggestion and so we feel oriented, when we’re not sure about the right way to use a given product, right?”.
MLN, female 63 years old, feeling 50
Check-outs
ID quotation participant
30 “Because they know that people need the products….” AMF, female 54 years old, feeling 40

Appendix
143
31 “what my colleague just said: avoiding waiting lines, in the cash outs.” - When asked about what should be changed in hypermarkets
MBT, female 71 years old, feeling 50
32 “There‘s a hypermarket, “that much of cash outs” and whatever…when you go there, there are half a dozen employees.”
AJT, male 68 years old, feeling 50
33 “People have told me many times that they leave the waiting lines on purpose, so that people, the customers may say “ahhh…this place has always so many visitors, so many…”, …but I think that it is not valid. People value being attended quickly and not the number of customers there may be.”
MLN, female 63 years old, feeling 50
Store Image
ID quotation participant
34 “Consumption cathedral” MEM, female 83 years old, feeling 50
35 “Consumption” AMF, female 54 years old, feeling 40
36 “Promotions” MF, male 70 years old, feeling 70
37 “For me, it reminds me of a place where I can find everything I need.”
GJM, male 62 years old, feeling 60
38 “Nowadays, I run from hypermarkets as the devil runs from the cross! (…) First, because we are less at home now, and second because when I go to these hypermarkets, some time later I know I’ll have a headache…god!! And almost every time I leave the place, I carry a trolley full of stuff convinced that I haven’t purchased what took me there in the first place!”
OCB, female 64 years old, feeling 60
39 “I don’t enjoy going there, because I buy what I don’t need. I’ll rather go to the traditional little markets, I prefer…and I only buy what I need. In the supermarket, I go there for the appealing boxes, the packages, for novelties, while the other places I don’t. And sometimes, I don’t even use what I buy. I keep it because it is nice-looking and I put the package in a little corner.”
Non identified voice
40 “I have my mailbox overloaded…” MCMS, female 80 years old, feeling 20

Appendix
144
41 “It’s easier… finding everything in the same place, than having to go around…”
MIV, female 70 years old, feeling 60
42 “Listen, what they shouldn’t do and do, is misleading advertising! That’s distasteful!! Frequently it doesn’t match, specially with prices…For example, when we go shopping and there’s a product that we see that it’s a specific package being publicized, but it doesn’t mention the weight and when we get there, instead of having a kilo, it’s 750 grams, for instance… “
JR, male 73 years old, feeling 40
43 “And we here, a country mainly agricultural, with all fields abandoned, as you also know, all abandoned, right? We have onion from Spain, we have potatoes from France, we have other stuff from Italy, we have Morocco, we have vegetables that come from South America, a huge thing and little is merchandise that we can call Portuguese! There’s bananas from Costa Rica, there’s pineapple from wherever…”.
MF, male 70 years old, feeling 70
44 “(…) there are two things that happened with the appearance of the hypermarkets: one was the hygiene, the hygiene was such a thing….On the other hand, the shop owners of those days were very greedy, it was just taking the money for themselves , they did not invest. When the hypermarkets emerged, most of them immediately began perking up their little shops.”
AFF, male 68 years old, feeling 40
Attitude towards shopping
ID quotation participant
45 “(…) once I was a big spender due to health issues. I wanted to value myself, since I was depressed. Once in a while, I bought stuff not worth buying, that I thought would interest me.”
AAT, male 86 years old, feeling 30
46 “Well, as age goes by, consumption, whether food, (…) or clothes, that feeling of need gradually diminishes. And so, whether it is in a supermarket, or a mini-market, a person contains itself a litlle more and isn’t eager to consume, like some years before. It may not be true for everybody, but it is for me. And then, the wallet…”
Non identified voice
47 “I leave the place angry as a bull, because I spent money in pasta, rice and whatever… And it is a pleasure for the family and…what I enjoy is buying a pair of shoes, or whatever, not in a supermarket! Lol I don’t go for groceries for pleasure, it’s a duty.”
AMF, female 54 years old, feeling 40

Appendix
145
Affiliation
ID quotation participant
48 “The small local markets, for example. Going to the bakery, or going to….It’s the spot where you can find out all the news about the village.”
AOS, male 73 years old, feeling 50
49 “There’s a supermarket where I go on a daily basis, because it is near my home. And normally, I created an empathy with the cashier that I had never met…every time I go to the checkouts, I look for that cashier to choose her lin… and such friendliness I felt for the girl that, by Christmas I decided to bring her a little rose button, and the girl was moved…”
MLN, female 63 years old, feeling 50
50 “I love it, I love… -Oh, you look annoyed today! - Uff! Today I’m just infuriated, and so on and so on… And that’s it, I like it… I talk about everything! That’s why I enjoy it ”
AMF, female 54 years old, feeling 40
51 “Look, one thing I enjoy in Continente is the book area, err…which is very good. It has very recent works, and particularly where Carrefour used to be, the place is well prepared to accommodate kids, with little chairs. I have been bringing my granddaughter there, and I sit her there on those little chairs and then she stares at the book pictures. And then we go there put the book back, and take another one and put it back and… it is really pleasant. It encourages reading habits in children and how to handle books, doesn’t it? That section is really amusing, I also enjoy passing by.”
MLN, female 63 years old, feeling 50
Antecipated utility
ID quotation participant
52 “Chocolates and some yogurts. It was there that I began seeing meal yogurts, that now are seen everywhere. It was the first place where I began seeing…cherry, raspberry, strawberry...” talking about Lidl
MLN, 63 years old feeling 50

Appendix
146
Choice optimization
ID quotation participant issue
53 “It’s misleading advertising, in promotions. It’s the product they want to sell off. I went there Monday to Modelo and it draw my attention…an olive oil, the most expensive olive oil that there was…and did not sell, it wasn’t sold because people are having hard times, and it was that one that was with 50% on card. The other things, no. It’s not what we want to buy that is 50% off. It’s what they want to sell!! I have the Modelo card and I don’t use it. I didn’t subscribe, I didn’t subscribe! They gave me the modelo card, they gave me the papers….They always ask me like this: -do you have Modelo card? I always answer no.” Talking about client card that gives 50%on selected products
AMF, female 54 years old, feeling 40
Choice Optimization (exception of)
Role enactment
ID quotation participant
54 “(…) we must do our homework. We go to get a glimpse around the stores and then go to buy the same thing, the same product, but cheaper.”
MLB, female 63 years old, feeling 20
55 As MLN (female 63 years old feeling 50) told the group: “(…) I am very selective now. And then, at our age, that is different from yours, in our age, we are already somewhat concerned about health issues. We already look for what is recommended for us.”
56 “(…) I go there for groceries of course, on purpose, because there are Diese Products there. There’s flat tummy tea, that I buy for my mother, bowels…(laughter)…And I, my mother is already very old, and has those problems , and I go there to buy that tea, because I don’t find it in Pingo Doce.” - justifying occasional choice to visit Continente chain for health reasons
MLB, female 63 years old feeling 20

Appendix
147
Power and authority
ID quotation participant
57 “I always go to the same place. Because I know the vendor! He already knows what I like. I turn up and say: -I came to buy shoes. And he just asks: -Brown or black? And with remaining clothes it is somewhat the same. He perfectly knows my shoe number and my preferences.”
GJM, male 62 years old, feeling 60
58 “Look, and in particular, that it offers personalized assistance, I’m very fond of it.” When asked what she appreciated in a store
MCS, female 69 years old, feeling 50
59 “I, for example, choose to go to Dolce Vita. The way I am treated there has nothing to do with…. Even the groceries, they put everything in the bags. There’s another one in Gaia, around S.Felix da Marinha,…I went there twice, and they also do that. In other words, the politeness with which they treat us leads us sometimes to forget that we were buying something more expensive.- (moderator: So you think it’s worth it, am I correct?) - Yes, yes, it’s worth it. A person feels like a person. We feel valued and that’s important.”
AFF, male 68 years old, feeling 40

Appendix
148
7.3. Survey Questionnaire
Preparing the retail industry for the senior segment
This survey intends to collect information for a Marketing master thesis research from the
Economics College of Oporto. It intends to study the senior segment motivations and the
attributes that this segment most values in fast moving consumer goods retail stores.
Thank you for participating!
1. Gender: M___ F___
2. Marital stats: ________________________
3. No. cohabits__________
4. Educational level________________________________________________________________
5. Former occupation:___________________________________________________________________
6. How do you normally use you spare time? tv fitness/exercise travelling
courses cinema/theater volunteering
other: ______________________________________
7. Cross if any of the following are used: e-mail internet mobile phone
8. Which mean of transportation do you normally use? ______________________________________
9. Do you enjoy shopping? Yes___ No___
10. Do you normally go for groceries for your household? Yes___ No___
If the answer was no, it will not be necessary to answer to the remaining questions.
11. Do you normally go for groceries accompanied? Yes___ No___
a. If so, with whom do you normally go? _______________________
12. How do you do your groceries for your home?
A ) Which is your first choice?
____________________________________
How frequently do you go there?
Daily
Weekly
Monthly
Other:_______________________
Do you feel satisfied?
Not a bit just a bit
Indifferent
Fairly a lot
Why do you choose this place?
___________________________________
B ) Which is your second choice?
____________________________
How frequently do you go there?
Daily
Weekly
Monthly
Other:_______________________
Do you feel satisfied?
Not a bit just a bit
Indifferent
Fairly a lot
Why do you choose this place?
___________________________________
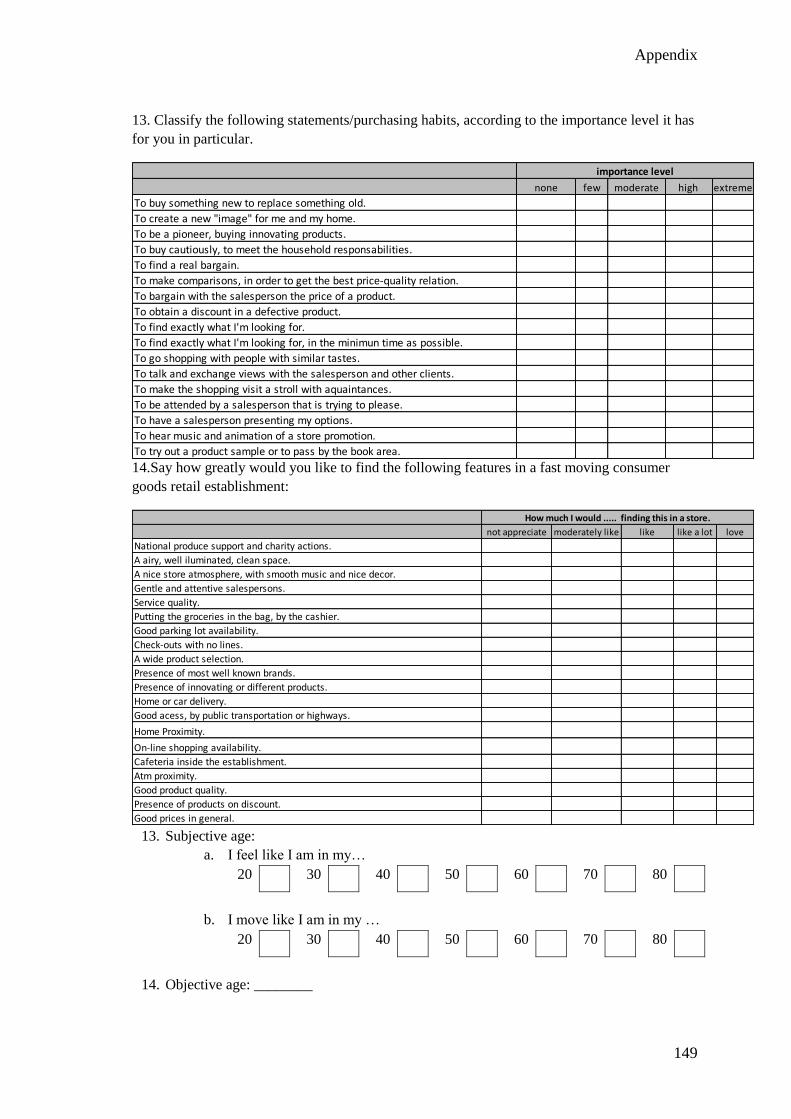
Appendix
149
13. Classify the following statements/purchasing habits, according to the importance level it has
for you in particular.
none few moderate high extreme
To buy something new to replace something old.
To create a new "image" for me and my home.
To be a pioneer, buying innovating products.
To buy cautiously, to meet the household responsabilities.
To find a real bargain.
To make comparisons, in order to get the best price-quality relation.
To bargain with the salesperson the price of a product.
To obtain a discount in a defective product.
To find exactly what I'm looking for.
To find exactly what I'm looking for, in the minimun time as possible.
To go shopping with people with similar tastes.
To talk and exchange views with the salesperson and other clients.
To make the shopping visit a stroll with aquaintances.
To be attended by a salesperson that is trying to please.
To have a salesperson presenting my options.
To hear music and animation of a store promotion.
To try out a product sample or to pass by the book area.
importance level
14.Say how greatly would you like to find the following features in a fast moving consumer
goods retail establishment:
not appreciate moderately like like like a lot love
National produce support and charity actions.
A airy, well iluminated, clean space.
A nice store atmosphere, with smooth music and nice decor.
Gentle and attentive salespersons.
Service quality.
Putting the groceries in the bag, by the cashier.
Good parking lot availability.
Check-outs with no lines.
A wide product selection.
Presence of most well known brands.
Presence of innovating or different products.
Home or car delivery.
Good acess, by public transportation or highways.
Home Proximity.
On-line shopping availability.
Cafeteria inside the establishment.
Atm proximity.
Good product quality.
Presence of products on discount.
Good prices in general.
How much I would ..... finding this in a store.
13. Subjective age:
a. I feel like I am in my…
20 30 40 50 60 70 80
b. I move like I am in my …
20 30 40 50 60 70 80
14. Objective age: ________

Appendix
150
7.4. Spearman Correlation
The mathematical expression is similar to Pearson’s correlation:
Where
However, since there are several ties1, Spearman’s correlation should be calculated as
presented:
Where ) is the correction factor for ties,
is the number of groups of tied observations for the variable ,
and is the number of tied observations for each group of ties for the variable
(Siegel & Castellan, 1988)2.
1 Repetitions of the same value between observations, for a given variable
2 Cited in Maroco, J. (2007). Análise Estatística - Com utilização do SPSS, Edições Sílabo.


