
1
SYNTHESIS, CHARACTERIZATION AND PRELIMINARY ANTIMICROBIAL
ACTIVITIES OF SOME AZO LIGANDS DERIVED FROM
AMINOANTIPYRINE AND THEIR Co(II), Fe(III), AND Os(VIII) COMPLEXES
BY
AGBO, NDIDIAMAKA JUSTINA
PG/M.SC/06/40881
DEPARTMENT OF PURE AND INDUSTRIAL CHEMISTRY,
UNIVERSITY OF NIGERIA NSUKKA.
FEBRUARY, 2010
2
TITLE PAGE
DEPARTMENT OF PURE AND INDUSTRIAL CHEMISTRY FACULTY
OF PHYSICAL SCIENCES, UNIVERSITY OF NIGERIA, NSUKKA
RESEARCH PROJECT
SYNTHESIS, CHARACTERIZATION AND PRELIMINARY ANTIMICROBIAL
ACTIVITIES OF SOME AZO LIGANDS DERIVED FROM
AMINOANTIPYRINE AND THEIR Co(II), Fe(III), AND Os(VIII) COMPLEXES .
A RESEARCH PROJECT SUBMITTED IN PARTIAL FULFILLMENT OF THE
REQUIREMENT FOR THE AWARD OF MASTERS OF SCIENCE DEGREE IN
INORGANIC CHEMISTRY
BY
AGBO NDIDIAMAKA JUSTINA
PG/ M. SC /06/40881

3
DEDICATION
To Engr Agbo Mathias; my beloved husband; Ezichi and Akaeze my children

4
CERTIFICATION
Agbo Ndidiamaka Justina a postgraduate student in the department of Pure and
Industrial Chemistry, University of Nigeria, Nsukka, with Reg No PG/M.Sc/ 06/40881,
has satisfactorily completed the requirement for course and research work for the degree
of masters of science in Chemistry.
The work embodied in this thesis is original and has not been submitted in part or
full for any diploma or degree in this or any other University.
Dr .P.O Ukoha Dr. P.O.Ukoha
(Supervisor) (Head of Department)

5
ACKNOWLEDGMENT
The completion of this research project is both a humbling experience and a daunting
task. Thankfully, numerous talented people helped, and their collective efforts have
greatly improved the final result. First and foremost, I was privileged to have been
supervised by Dr. P.O.Ukoha whom I consulted throughout the project. His profound
understanding of the chemical ideas and facts in the work helped in shaping every stage
of this research.
I wish to acknowledge the assistance of all the people in my house, Aunty Gloria,
Desmond, Chinyere, Chidinma and the Mother of the house, Dr. J.U. Eze for their
wonderful support and for taking care of my kids Ezichi and Akaeze during the period of
my research.
In addition, I am also indebted to Mr B.E Ezema and Alioke Chinelo for their friendly
concerns and advice.
Finally, I thank my beloved husband Engr. Agbo, Mathias for his financial support and
understanding during this period.
To God be the glory
6
ABSTRACT
Synthesis, electronic, infrared ,NMR, and preliminary antimicrobial
activities were carried out on three new azo-ligands derived from 4-
aminoantipyrine namely: 1,2-dihydro-1,5-dimethyl-2-phenyl-4-[(E)-(2,3,4-
trihydroxyphenyl)-3H-pyrazol-3-one (H3L), 7-[(E)-(2,3-dihydro-1,5-
dimethyl-3-oxo-2-phenyl-1H-pyrazol-4-yl)diazenyl]-1H-indole-2,3-dione
(L) and 1,2-dihydro-4-(E)-[3-hydroxy-4{(E)-phenyldiazenyl}-1-
naphthalenyl]-1,5-dimethyl-2-phenyl-3H-pyrazol-3-one(HL) and their
Co(II), Fe(III) and Os(VIII) complexes. Their coordination chemistries with
Co(II), Fe(III), and Os(VIII) respectively have been investigated. The
stoichiometry and molar conductance studies of the complexes were equally
determined. Stoichiometric studies indicated the complexes formed by
Co(II) and Os(VIII) with H3L to have 2:1 ligand to metal mole ratio. The
[Fe(H2L)2]+ complex could not be determined by this method. For L ligand,
it had 1:1 ligand to metal mole ratio stoichiometry with Co(II) and Fe(III)
ions. The Os(VIII) complex of L ligand was not isolated. For HL ligand,
both [Co(HL)2(OH2)2] and [Fe2O(HL)2Cl2] have 2:1 ligand to metal mole
ratio . The [Os(HL)2(O)2Cl2] could not be determined by this method. Based
on the spectroscopic studies, H3L was observed to be bidentate and ligated
via its azo nitrogens and carbonyl group to Os(VIII) . In coordinating to

7
Co(II) and Fe(III) the ligand displayed terdenticity. The azo nitrogen,
carbonyl oxygen and one oxygen of the trihydroxylbenzene were involved .
L was observed to be terdentate through the participation of isatin nitrogen,
azo nitrogen and carbonyl group of antipyrine to Co(II) ion. In bonding with
Fe(III), it was observed to be bidentate through the participation of its azo
nitrogens and its carbonyl group from antipyrine . HL was observed to be
bidentate through the participation of azo nitrogen and carbonyl group of
antipyrine in bonding with both Co(II) and Fe(III) and Os(VIII). The
sensitivity of clinical isolates of Pseudomonas aeruginosa, Staphylococcus
eureus, Candida albican and Escherica coli towards the ligands and
complexes were determined via the agar-well diffusion method. Ampicilin
was used as control.
.
8
TABLE OF CONTENTS
PAGE
TITLE PAGE - ……………………………………………………………………….I
DEDICATION ……………………………………………………………...III
CERTIFICATION - …………………………………………………………......IV
ACKNOWLEDGEMENT---. - ………………………………………………………V
ABSTRACT - - - ……………………………………………………..VI
TABLE OF CONTENTS ……………………………………………………………VIII
LIST OF SCHEMES / FIGURES ………………………………………………………X
LIST OF TABLES - …………………………………………………………………XII
ABBREVIATIONS ….. …………..…………………………………………...….XIV
CHAPTER ONE: INTRODUCTION- ……………………………………………….1
1.1 Pyrazolones and pyrazolidine ….……………………………………………….1
1.2 Antipyrine ……………………………………………………………………….2
1.3 Aminoantipyrine - ……………………………………………………………7
1.4 Dipyrone………….. ……………………………………………………………9
1.5 Derivatives of 3, 5-pyrazolidindione - ………………………………………11
1.5.1 Phenylbutazone -... ………………………………………………………….11
1.5.2 Oxyphenbutazone - ………………………………………………….13
1.6 Objectives of the present research …………………………………………..13
9
CHAPTER TWO: LITERATURE REVIEW ………………………………………15
2.1 Brief review of coordination chemistry of azo-pyrazolone/derivatives
…………………………………………………………………………………..15
22 Cobalt (II) – azopyrazolone/derivative complexes - …………………...18
2.3 Fe(III)-azopyrazolone/derivative complexes - …………………………..24
2.4 Brief review of methods of characterizing complexes …………………….........26
2.4.1 Stiochiometric studies of complex ions ….……………………………………...26
2.4.1.1 Job’s continuous variations method - …..……………………………………...27
2.4.1.2 Mole –ratio method ……………………………………………………………28
2.4.1.3 Slope- ratio method - …………………………………………………………30
2.4.2 Ultraviolet and Visible spectroscopy……….…………………………………….31
2.4.3 Infrared spectroscopy ….. ….. ……. .. . ………………………………...32
2.4.4 Nuclear Magnetic Resonance spectroscopy- …………………………………..32
2.5 Pharmcology of coordination compounds of iron, cobalt- ………………………33
2.6 Other uses of compound of azopyrazolones/derivatives- ………………………..36
CHAPTER THREE : EXPERIMENTAL
3.1 Materials ...…………………………………………………………………….37
3.1.1 Reagents / Micro organisms ..…………………………………………………...37
3.1.2 Instruments / Apparatus …. .-….……………………………………………...38
3.2 Methods ………………………....…………………………………………….38
3.2.1 Preparation of the azo ligands - …………………………………………...38
3.2.2 Preparation of complexes - …………………………………………………...39
3.2.3 Stoichiometry of the complexes ……………………………………….........40
10
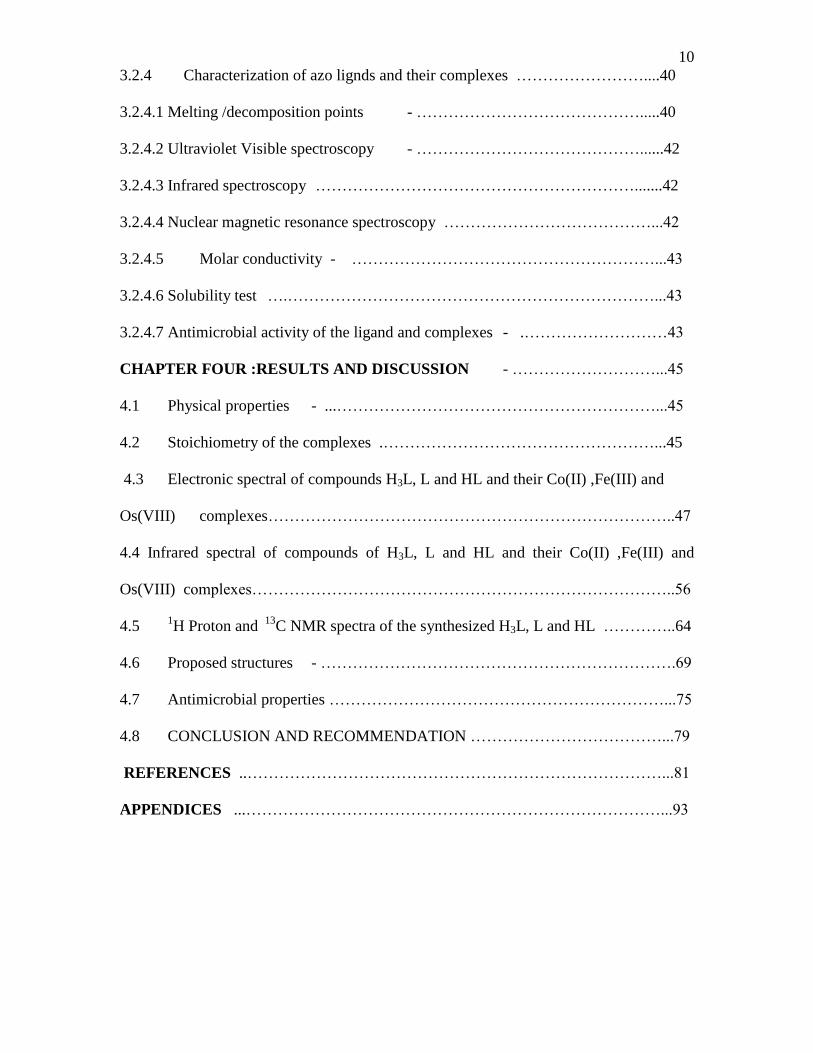
3.2.4 Characterization of azo lignds and their complexes ……………………....40
3.2.4.1 Melting /decomposition points - …………………………………….....40
3.2.4.2 Ultraviolet Visible spectroscopy - ……………………………………......42
3.2.4.3 Infrared spectroscopy …………………………………………………….......42
3.2.4.4 Nuclear magnetic resonance spectroscopy …………………………………...42
3.2.4.5 Molar conductivity - …………………………………………………...43
3.2.4.6 Solubility test ….……………………………………………………………...43
3.2.4.7 Antimicrobial activity of the ligand and complexes - .………………………43
CHAPTER FOUR :RESULTS AND DISCUSSION - ………………………...45
4.1 Physical properties - ...……………………………………………………...45
4.2 Stoichiometry of the complexes .……………………………………………...45
4.3 Electronic spectral of compounds H3L, L and HL and their Co(II) ,Fe(III) and
Os(VIII) complexes…………………………………………………………………..47
4.4 Infrared spectral of compounds of H3L, L and HL and their Co(II) ,Fe(III) and
Os(VIII) complexes……………………………………………………………………..56
4.5 1H Proton and
13C NMR spectra of the synthesized H3L, L and HL …………..64
4.6 Proposed structures - ………………………………………………………….69
4.7 Antimicrobial properties ………………………………………………………...75
4.8 CONCLUSION AND RECOMMENDATION ………………………………...79
REFERENCES ..……………………………………………………………………...81
APPENDICES ...……………………………………………………………………...93

11
LIST OF SCHEMES/FIGURES
Scheme. 1.1 The 5-pyrazolone derivatives ……………………………………………….2
Scheme 1.2 Synthesis of antipyrine……………………...……………………………..3
Scheme 1.3 Tautomeric forms of antipyrine …………………………………………….4
Scheme 1.4 Benzoylation of antipyrine. ...…………………………………………….5
Scheme 1.5 Structure of 4-aminoantipyrine and aminopyrine .……………………….8
Scheme 1.6 Synthesis of aminopyrine ………………………………………………….8
Scheme 1.7 Synthesis of 3-aminoantipyrine …………………………………………….9
Scheme 1.8 The structure of Sodium [(2,3,dihydrogen-1,5-dimethyl-3-oxo-2-phenyl-1-
H- Pyrazol-4-yl) methylamino] methane suphurnate. ..………………………………...10
Scheme 1.9 Structure of 3,5-pyrazolindinedione derivatives …………..……………...11
Scheme 1.10 Structure of phenylbutazone .…………………………………………...11
Scheme 2.1 Reactions of azopyrazolone ...…………………………………………...16
Scheme 2.2 Complex formation in azopyrazolone …………………………………...16
Figure 1 The Job’s plot of absorbance against volume fraction of ligand ...…………...28
Figure. 2. The slop ratio plot for absorbance against mole ligand per mole ratio……..29
Figure 4 : Job’s curve for [Co(HL)2(OH2)2 ….…………………………………………...48
Figure 5 ; Job, s curve for [Os(HL)2(O)2Cl2] …………………………………………...48
Figure 6: Job’ s curve for [CoLCl2(OH2)] ..……………………………………………...49
Figure 7 : Job’s curve for [Fe2O(L)2Cl2]……………….………………………………49
Figure 8 Job’s curve for [Co(H2L)2] ……………….…………………………………50
12
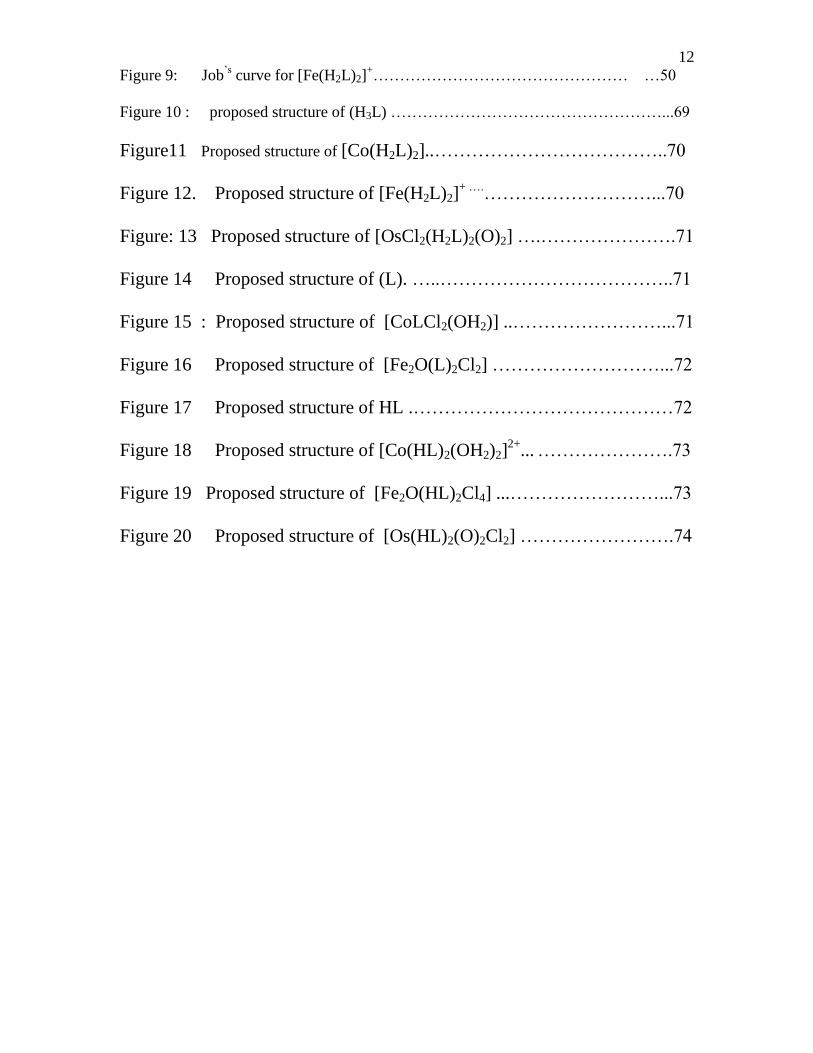
Figure 9: Job’s curve for [Fe(H2L)2]
+………………………………………… …50
Figure 10 : proposed structure of (H3L) ……………………………………………...69
Figure11 Proposed structure of [Co(H2L)2]..………………………………..70
Figure 12. Proposed structure of [Fe(H2L)2]+ ….
………………………...70
Figure: 13 Proposed structure of [OsCl2(H2L)2(O)2] ….………………….71
Figure 14 Proposed structure of (L). …..………………………………..71
Figure 15 : Proposed structure of [CoLCl2(OH2)] ..……………………...71
Figure 16 Proposed structure of [Fe2O(L)2Cl2] ………………………...72
Figure 17 Proposed structure of HL .……………………………………72
Figure 18 Proposed structure of [Co(HL)2(OH2)2]2+
... ………………….73
Figure 19 Proposed structure of [Fe2O(HL)2Cl4] ...……………………...73
Figure 20 Proposed structure of [Os(HL)2(O)2Cl2] …………………….74

13
LIST OF TABLES
Table 1.1 Derivatives of 5-pyrazolone …...………………………………………………2
Table 1.2 The derivatives of 3,5-pyrazolindinedione. ...………………………………..11
Table 3.1 Summary of Reagents used for the Synthesis and Antimicrobial Test .……..37
Table 3.2 Summary of Microorganisms used …………………………………...............38
Table 3.3 The determination of Job,s continuious variation method …………………...41
Table 4.1 The Colour, texture, melting point, molar- conductivity and percent yield of
ligands and complexes…………………………………………………………………..46
Table 4.2 Stoichiometric Results ...……………………………………………………...51
Table 4.3 The electronic spectra of H3 L, [Co(H2L)2], [Fe(H2L)2]+ and
[OsCl2(H2L)(O)2]………………………………………………………………………51
Table 4.4 Electronic Spectra Of L, [CoLCl2(OH2)] and [FeO(L)2Cl2]…………………53
Table 4.5 The electronic spectra of HL, [Co(HL)2(OH2)2]2+
,[Fe2O(HL)2Cl2] and
[Os(HL)2(O)2Cl2]….…………………………………………………………...53
Table 4.6 Infrared spectral properties of H3L , [Co(H2L)] , [Fe(H2L)2]+ and
[OsCl2(H2L)2(O)2]….…………………………………………………………………...57
Table 4.7. The Infrared Absorption Frequencies (cm-1
) of (L) and its complexes……...61
Table 4.8 The infrared spectra assignments of HL and its complexes. ………………...63
Table 4.9: Proton (1H) and spectra of H3L [ in ppm from TMS, CDCl3 + CD3OD]. .65
Table 4.10 13
C NMR assignment for H3L ……………………………………..65
Table 4.11 The 1H NMR spectral data of L in CDCl3 relative to TMS (ppm) …...67
Table 4.12 THE 13
C NMR Spectral Data of L ..……………………………………....67
Table 4.13 1H NMR spectra data of HL. ..………………………………………….68

14
Table 4.14: Tthe 13
C NMR spectral data of HL...……………………………………..68
Table 4.15: Antimicrobial activities of the ligands and complexes……………………..75
Table 4:16: Minimum inhibitory concentration (MIC). ………………………………..76
15
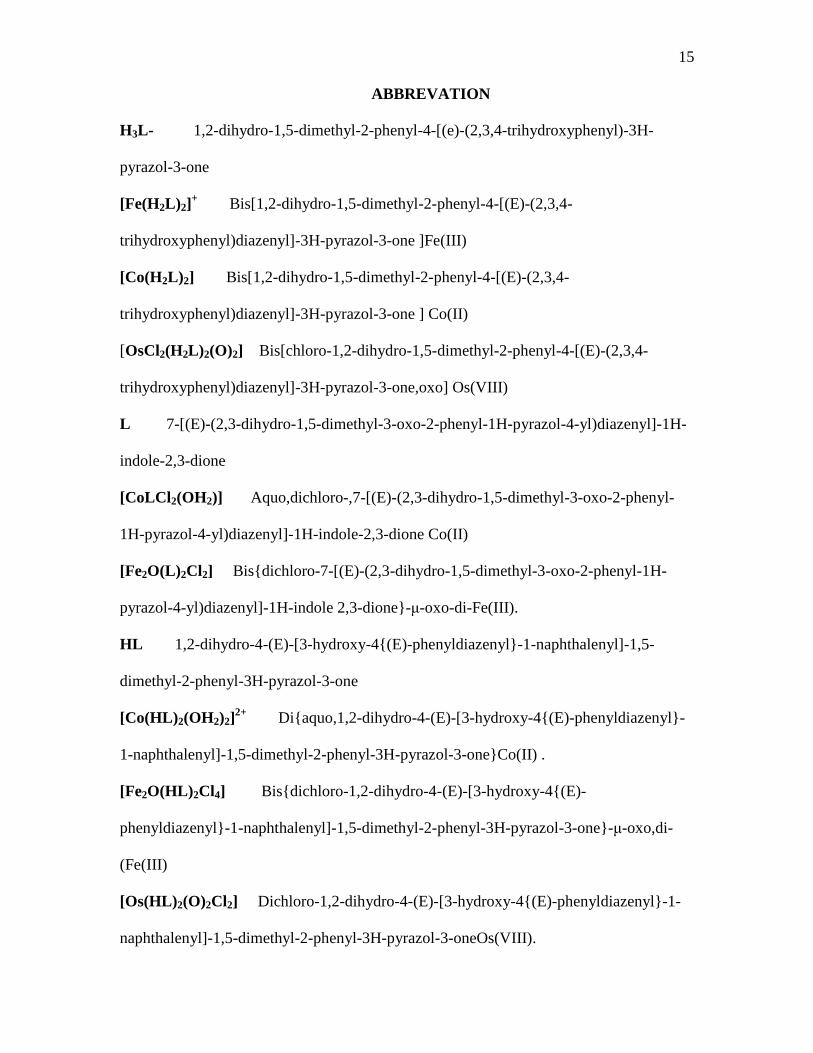
ABBREVATION
H3L- 1,2-dihydro-1,5-dimethyl-2-phenyl-4-[(e)-(2,3,4-trihydroxyphenyl)-3H-
pyrazol-3-one
[Fe(H2L)2]+ Bis[1,2-dihydro-1,5-dimethyl-2-phenyl-4-[(E)-(2,3,4-
trihydroxyphenyl)diazenyl]-3H-pyrazol-3-one ]Fe(III)
[Co(H2L)2] Bis[1,2-dihydro-1,5-dimethyl-2-phenyl-4-[(E)-(2,3,4-
trihydroxyphenyl)diazenyl]-3H-pyrazol-3-one ] Co(II)
[OsCl2(H2L)2(O)2] Bis[chloro-1,2-dihydro-1,5-dimethyl-2-phenyl-4-[(E)-(2,3,4-
trihydroxyphenyl)diazenyl]-3H-pyrazol-3-one,oxo] Os(VIII)
L 7-[(E)-(2,3-dihydro-1,5-dimethyl-3-oxo-2-phenyl-1H-pyrazol-4-yl)diazenyl]-1H-
indole-2,3-dione
[CoLCl2(OH2)] Aquo,dichloro-,7-[(E)-(2,3-dihydro-1,5-dimethyl-3-oxo-2-phenyl-
1H-pyrazol-4-yl)diazenyl]-1H-indole-2,3-dione Co(II)
[Fe2O(L)2Cl2] Bis{dichloro-7-[(E)-(2,3-dihydro-1,5-dimethyl-3-oxo-2-phenyl-1H-
pyrazol-4-yl)diazenyl]-1H-indole 2,3-dione}-μ-oxo-di-Fe(III).
HL 1,2-dihydro-4-(E)-[3-hydroxy-4{(E)-phenyldiazenyl}-1-naphthalenyl]-1,5-
dimethyl-2-phenyl-3H-pyrazol-3-one
[Co(HL)2(OH2)2]2+
Di{aquo,1,2-dihydro-4-(E)-[3-hydroxy-4{(E)-phenyldiazenyl}-
1-naphthalenyl]-1,5-dimethyl-2-phenyl-3H-pyrazol-3-one}Co(II) .
[Fe2O(HL)2Cl4] Bis{dichloro-1,2-dihydro-4-(E)-[3-hydroxy-4{(E)-
phenyldiazenyl}-1-naphthalenyl]-1,5-dimethyl-2-phenyl-3H-pyrazol-3-one}-μ-oxo,di-
(Fe(III)
[Os(HL)2(O)2Cl2] Dichloro-1,2-dihydro-4-(E)-[3-hydroxy-4{(E)-phenyldiazenyl}-1-
naphthalenyl]-1,5-dimethyl-2-phenyl-3H-pyrazol-3-oneOs(VIII).

16
CHAPTER ONE
INTRODUCTION
1.1 PYRAZOLONE AND PYRAZOLIDINE DIONE DERIVATIVES:
Pyrazolone is a five - membered lactam ring compound containing two nitrogen
atoms and ketone in the same molecule. Lactam structure is an active nucleus in
pharmacological activity. Pyrazolone is an active moiety as a pharmaceutical ingredient,
especially in the class of nonsteroidal anti-inflammatory agents used in the treatment of
arthritis and other musculoskeletal and joint disorders1
The term pyrazolone sometimes refers to nonsteroidal anti-inflammatory agents.
Pyrazolone class nonsteroidal anit-inflammatory drug (NSAID) includes phenylbutazone,
oxyphenbutazone, dipyrone, and ramifenazone. Antipyrine (also called phenazone) is a
pyrazolone class analgesic agent in solutions in combination with other analgesic such as
benzocaine, and phenylphrine2 .
Pyrazolone derivatives are also used in preparing dyes and pigments3 .
2, 3-Dimethyl -1-phenyl -5-pyrazolone (antipyrine) has been discovered as antipyretics of
the quinoline type4. This discovery initiated the beginning of the German drug industry
that dominated the field for approximately 40 years.
Phenylbutazone, was originally developed as a solubilizer for the insoluble
aminopyrine. It is now used for the relief of many forms of arthritis in which capacity it
has more than an analgesic action in that it also reduces swelling and spasm by an anti –
inflammatory action.
17
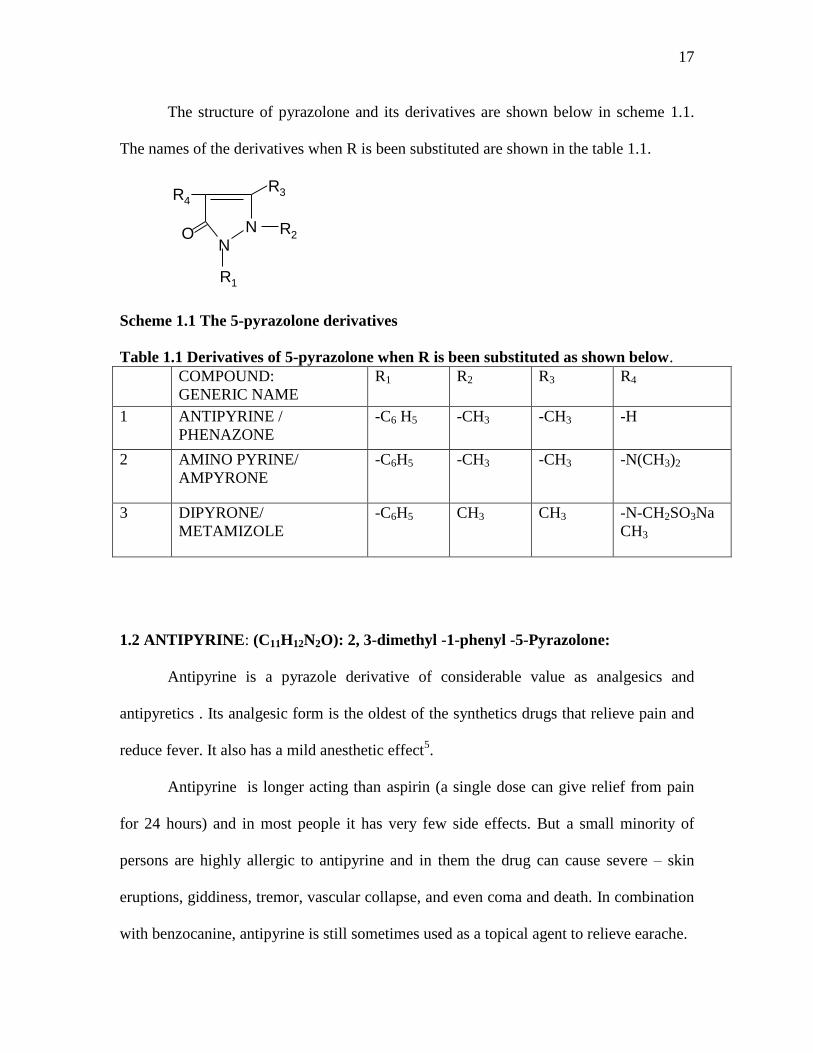
The structure of pyrazolone and its derivatives are shown below in scheme 1.1.
The names of the derivatives when R is been substituted are shown in the table 1.1.
ON
N
R3
R2
R4
R1
Scheme 1.1 The 5-pyrazolone derivatives
Table 1.1 Derivatives of 5-pyrazolone when R is been substituted as shown below.
COMPOUND:
GENERIC NAME
R1 R2 R3 R4
1 ANTIPYRINE /
PHENAZONE
-C6 H5 -CH3 -CH3 -H
2 AMINO PYRINE/
AMPYRONE
-C6H5 -CH3 -CH3 -N(CH3)2
3 DIPYRONE/
METAMIZOLE
-C6H5 CH3 CH3 -N-CH2SO3Na
CH3
1.2 ANTIPYRINE: (C11H12N2O): 2, 3-dimethyl -1-phenyl -5-Pyrazolone:
Antipyrine is a pyrazole derivative of considerable value as analgesics and
antipyretics . Its analgesic form is the oldest of the synthetics drugs that relieve pain and
reduce fever. It also has a mild anesthetic effect5.
Antipyrine is longer acting than aspirin (a single dose can give relief from pain
for 24 hours) and in most people it has very few side effects. But a small minority of
persons are highly allergic to antipyrine and in them the drug can cause severe – skin
eruptions, giddiness, tremor, vascular collapse, and even coma and death. In combination
with benzocanine, antipyrine is still sometimes used as a topical agent to relieve earache.
18
The use of antipyrine has been greatly reduced since its undesirable side effects
have been recognized5.
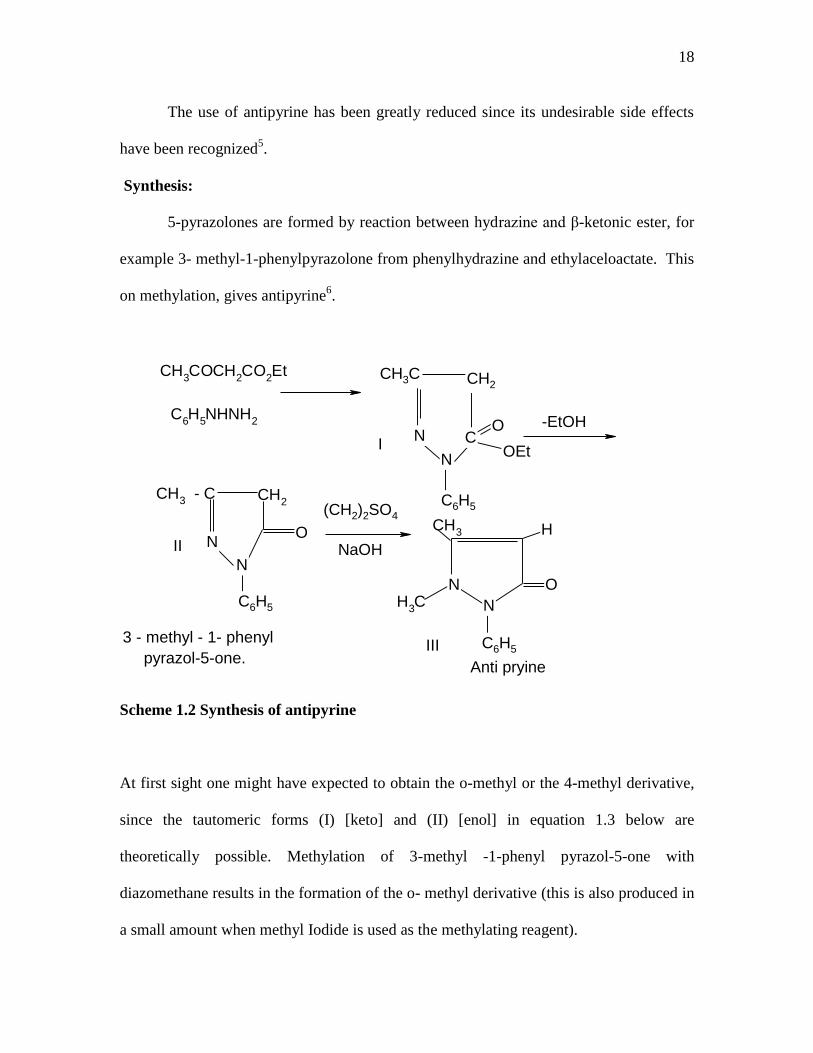
Synthesis:
5-pyrazolones are formed by reaction between hydrazine and β-ketonic ester, for
example 3- methyl-1-phenylpyrazolone from phenylhydrazine and ethylaceloactate. This
on methylation, gives antipyrine6.
CH3COCH
2CO
2Et
C6H
5NHNH
2
CH3 - C CH
2
CH3
H3C
CH3C CH2
OEt
C6H5
-EtOHON C
N
N
N
O
C6H5
(CH2)2SO4
NaOH
N
N
O
H
C6H53 - methyl - 1- phenyl
pyrazol-5-one.Anti pryine
I
II
III
Scheme 1.2 Synthesis of antipyrine
At first sight one might have expected to obtain the o-methyl or the 4-methyl derivative,
since the tautomeric forms (I) [keto] and (II) [enol] in equation 1.3 below are
theoretically possible. Methylation of 3-methyl -1-phenyl pyrazol-5-one with
diazomethane results in the formation of the o- methyl derivative (this is also produced in
a small amount when methyl Iodide is used as the methylating reagent).

19
ON
N
N
NN
N O
Me
Ph
OH
Me
Ph
Me
Ph
H
(I) (II)
(III)
Scheme 1.3 Tautomeric forms of antipyrine
This raised some doubts as to the structure of antipyrine, since for its formation, the
tautomeric form (I) must also be postulated. The structure of antipyrine was shown to be
that given in structure (III) in eqaution 1.2 above by its synthesis from phenyl hydrazine
and ethylacetoacete6.
PHYSICAL AND CHEMICAL PROPERTIES.
Antipyrine is odourless, colourless crystal or a white powder. It is very soluble in
water, alcohol or chloroform, less soluble in ether and its aqueous solution is neutral to
litmus paper. However, it is basic in nature. This is due to presence of nitrogen at position
2. It has a melting point of 110-1130C. It decomposes when distilled at atmospheric
pressures but has a boiling point of 141-1410C under high vacuum and 319
0C at 174 mm.
Its molecular weight is 188.23.
It forms a variety of salts and double salts. Alkylation’s at 600C gives mainly the
metholalide of the 5-alkoxypyrazole but meltylation at temperature yields 4-
methylantipyrine and 1-phenyl-3-4,4-trimethyl -5-pyrazole. Higher saturated alkyl hadide
20
at 130 -2000C
give mainly resins, but one or two alkyl or benzyl groups can be introduced
in the 4 – position7.
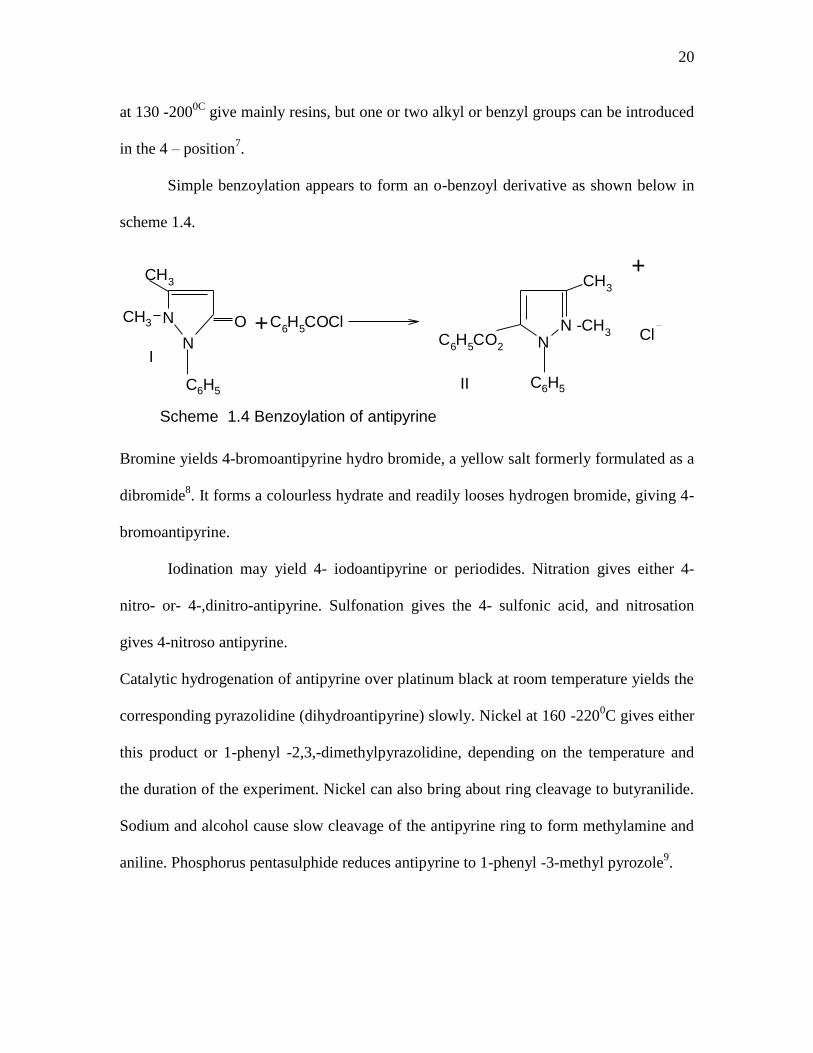
Simple benzoylation appears to form an o-benzoyl derivative as shown below in
scheme 1.4.
O
N
N
CH3
C6H
5COCl
ClC6H
5CO
2 NN -CH
3
CH3
C6H5
CH3
C6H5
+
+
II
I
Scheme 1.4 Benzoylation of antipyrine
Bromine yields 4-bromoantipyrine hydro bromide, a yellow salt formerly formulated as a
dibromide8. It forms a colourless hydrate and readily looses hydrogen bromide, giving 4-
bromoantipyrine.
Iodination may yield 4- iodoantipyrine or periodides. Nitration gives either 4-
nitro- or- 4-,dinitro-antipyrine. Sulfonation gives the 4- sulfonic acid, and nitrosation
gives 4-nitroso antipyrine.
Catalytic hydrogenation of antipyrine over platinum black at room temperature yields the
corresponding pyrazolidine (dihydroantipyrine) slowly. Nickel at 160 -2200C gives either
this product or 1-phenyl -2,3,-dimethylpyrazolidine, depending on the temperature and
the duration of the experiment. Nickel can also bring about ring cleavage to butyranilide.
Sodium and alcohol cause slow cleavage of the antipyrine ring to form methylamine and
aniline. Phosphorus pentasulphide reduces antipyrine to 1-phenyl -3-methyl pyrozole9.
21
The antipyrine ring has been opened by alcoholic potassium hydroxide at 1300 to form N-
methyl-N1-phenylhydrazine. Antipyrine is stable to 30% hydrochloric acid at 180
0, but
above 2000 it yields aniline, methylamine, and ammonia
10.
Also azo coupling of 3-methyl -1- phenyl 5- pyrazolone or of related compounds
give 4-azo pyrazolone, derivatives which are of interest as wool, food, and photographic
dyes11
.
APPLICATION:
Antipyrine is a pyrazolone class analgesic agent in a liqiud solution (eg Auralgan)
in combination with other analgesics such as benzocaine, and phenylepherine as mention
above. It has been used as an antipyretic but replaced due to the possibility of
agranulocytosis side effect12
Generally antipyrine (2,3-dimethyl-1-phenyl- 5-pyrazolone) and its derivatives
have a diversity of application including biological13
, clinical14
and pharmacological
areas15
.Antipyrines have been also reported to be used as analytical reagents in the
determination of some metal ions16-17
. Also antipyrine containing azo group have been
investigated to have significant biological antifungal, antibacterial activities and some
industrial achiviements18
. Considerable study have been devoted to ligands that derived
from either 4-amino or 4 –formylantipyrine19
.
Among the pharmacological application they are used as antipyretics, analgesic,
anti –rheumatic and anti- inflammatory drugs.
ANTIPYRETIC DRUGS: These are drugs that prevent or reduce fever by lowering the
body temperature from a raised state. However, they will not affect the normal body
22
temperature if one does not have fever. It causes the hypothalamus to override an
interleukin – induced increase in temperature. The body will then work to lower the
temperature and the result is a reduction in fever.
Most are also used for other purposes. Example, the most common antipyretics in
the United States are aspirin and acetaminophen (paracetamol), which are used primarily
as pain relievers20
.
ANALGESIC DRUGS: (colloquially known as a painkiller) this is any member of the
diverse group of drugs used to relieve pain (achieve analgesia). It acts in various ways on
the peripheral and central nervous system: They include paracetamol, the non steroidal
anti-inflammatory drugs (NSAIDS) such as the salicylates, narcotic drugs such as
morphine synthetic drugs with narcotic properties such as tramadol and various others.
Some other classes of drugs not normally considered analgesics are used to treat
neuropathic pain syndromes. These include tricyclic antidepressants and
anticonvulsants21
.
ANTI- INFLAMMATORY DRUGS: This refers to the property of a substances or
treatment that reduces inflammation. It makes up one half of analgesics, remedying pain
by reducing inflammation as opposed to opioids which affect the brain22
.
1.3 AMINOANTIPYRINE (C13H17N3O).
In this project, the area of interest is on 4-aminoantipyrine. Its molecular formula
is C11H13N3O. It is a pale- yellow crystal with melting point ranging between 106 -1100C.
Its IUPAC name is 4-amino-2, 3, dimethyl -1- phenyl -3- pyrazolin-5-one.
23
CH3
O
Ph
NH2
N
N
CH3
O
Ph
N
N
CH3
NCH
3
H3C
H3C
5-pyrazolone
Amino pyrine (2,3-dimethyl 4- dimethylamine - 1- phenyl -pyrazolin -5-one.)
4- Amino antipyrine
I
II
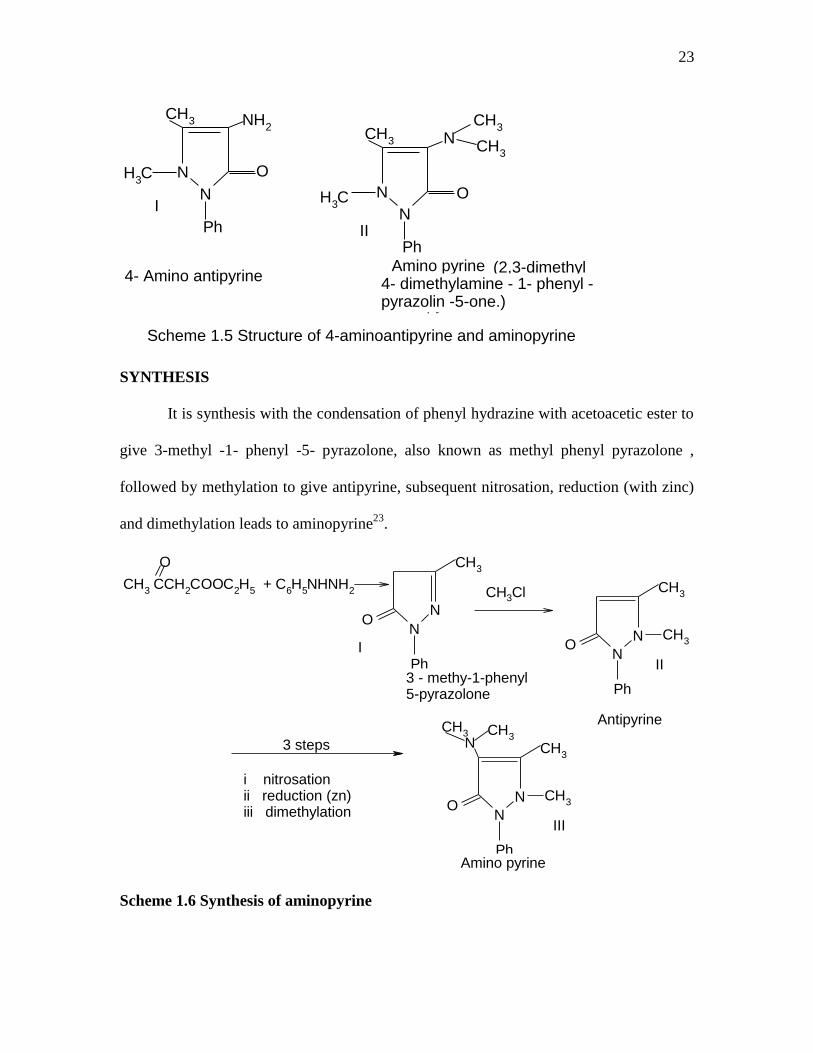
.Scheme 1.5 Structure of 4-aminoantipyrine and aminopyrine
SYNTHESIS
It is synthesis with the condensation of phenyl hydrazine with acetoacetic ester to
give 3-methyl -1- phenyl -5- pyrazolone, also known as methyl phenyl pyrazolone ,
followed by methylation to give antipyrine, subsequent nitrosation, reduction (with zinc)
and dimethylation leads to aminopyrine23
.
CH3 CCH
2COOC
2H
5 + C
6H
5NHNH
2
O CH3
N
NO
Ph
CH3
O
Ph
CH3
CH3
N
N
N
CH3
CH3
O
Ph
N
N
CH3
3 - methy-1-phenyl 5-pyrazolone
CH3Cl
Amino pyrine
Antipyrine
i nitrosation ii reduction (zn) iii dimethylation
3 steps
I
II
III
Scheme 1.6 Synthesis of aminopyrine
24
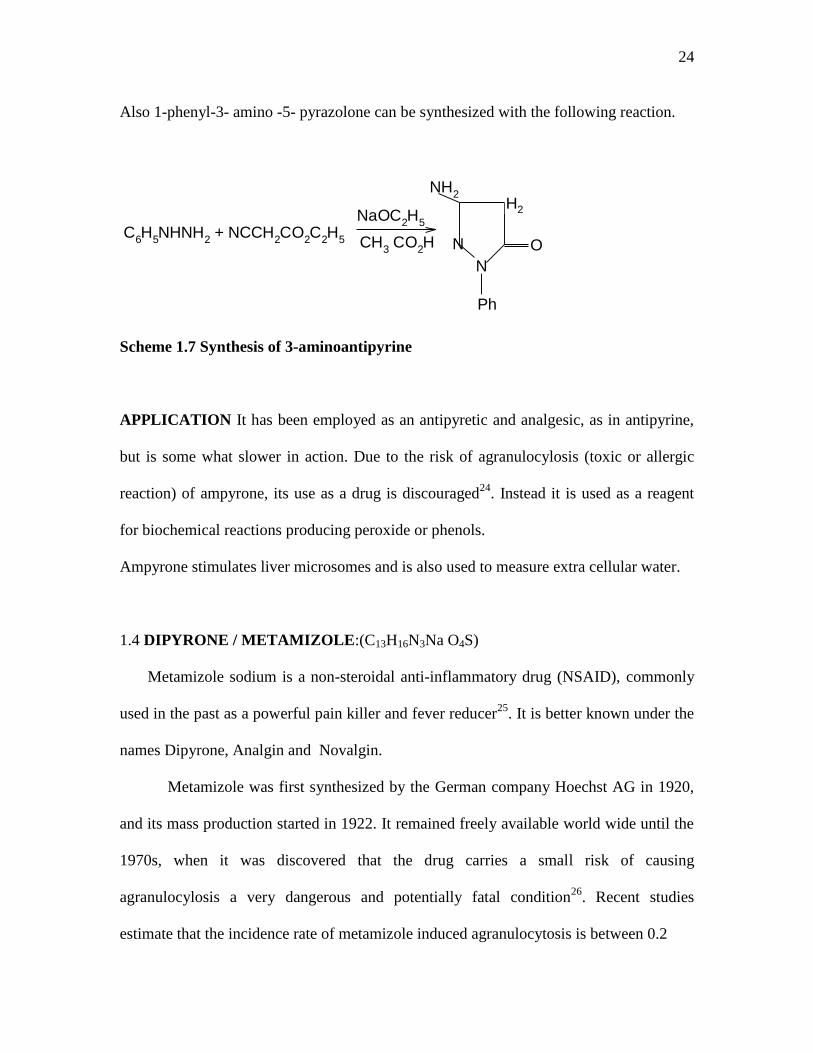
Also 1-phenyl-3- amino -5- pyrazolone can be synthesized with the following reaction.
C6H
5NHNH
2 + NCCH
2CO
2C
2H
5
NaOC2H
5
CH3 CO
2H
Ph
NH2
N
ON
H2
Scheme 1.7 Synthesis of 3-aminoantipyrine
APPLICATION It has been employed as an antipyretic and analgesic, as in antipyrine,
but is some what slower in action. Due to the risk of agranulocylosis (toxic or allergic
reaction) of ampyrone, its use as a drug is discouraged24
. Instead it is used as a reagent
for biochemical reactions producing peroxide or phenols.
Ampyrone stimulates liver microsomes and is also used to measure extra cellular water.
1.4 DIPYRONE / METAMIZOLE:(C13H16N3Na O4S)
Metamizole sodium is a non-steroidal anti-inflammatory drug (NSAID), commonly
used in the past as a powerful pain killer and fever reducer25
. It is better known under the
names Dipyrone, Analgin and Novalgin.
Metamizole was first synthesized by the German company Hoechst AG in 1920,
and its mass production started in 1922. It remained freely available world wide until the
1970s, when it was discovered that the drug carries a small risk of causing
agranulocylosis a very dangerous and potentially fatal condition26
. Recent studies
estimate that the incidence rate of metamizole induced agranulocytosis is between 0.2
25
and 2 cases per million person days of use, with approximately 7% of all cases fatal
(provided that all patients have access to urgent medical care). In other words, one should
expect 50 to 500 deaths annually due to metamizole in a country of 300 million,
assuming that every citizen takes the drug once a month.
Metamizole was banned in Sweden in 1974, in USA in 1977, more than 30
countries, including Japan, Australia, Iran, and part of the European Union, have
followed suit. In these countries, metamizole is still occasionally used as a veterinary
drug25,26
. In Sweden, the ban was lifted in 1995 and re-introduced in 1999.
In the rest of the world (especially in Spain, Mexico, India, Brazil, Russia,
Bulgaria and third world countries),metamizole is still freely available over the counter,
remains one of the most popular analgesics, and plays an important role in self –
medication26
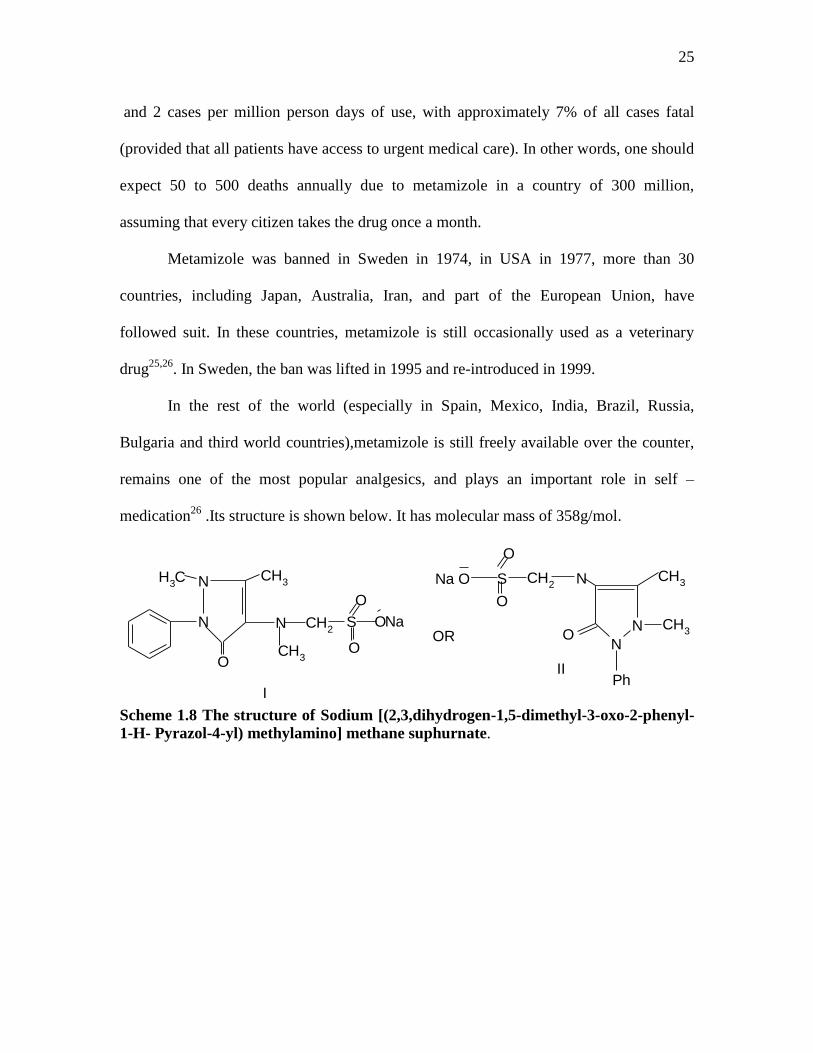
.Its structure is shown below. It has molecular mass of 358g/mol.
CH3O
CH3H
3C
N
N
N CH2
S Na
O
O
O
CH3
O
Ph
CH3
S CH2
O
O
N
N
NNa O
OR
I
II
Scheme 1.8 The structure of Sodium [(2,3,dihydrogen-1,5-dimethyl-3-oxo-2-phenyl-
1-H- Pyrazol-4-yl) methylamino] methane suphurnate.
26
1.5 DERIVATIVES of 3, 5- PYRAZOLIDINEDIONE
C6H
5NHNH
2 + NCCH
2CO
2C
2H
5
NaOC2H
5
CH3 CO
2H
Ph
NH2
N
ON
H2
Scheme 1.9 Structure of 3,5-pyrazolindinedione derivatives.
Table 1.2 The derivatives of 3,5-pyrazolindinedione.
Compound Name R1 R2
1 PHENYLBUTAZONE
/BUTAZOLIDIN
-C6 H5 - C4 H9
2 OXYPHENBUTAZONE/ OXALID,
TANIDEARIL -C6 H4 (OH)(P)
- C4 H9
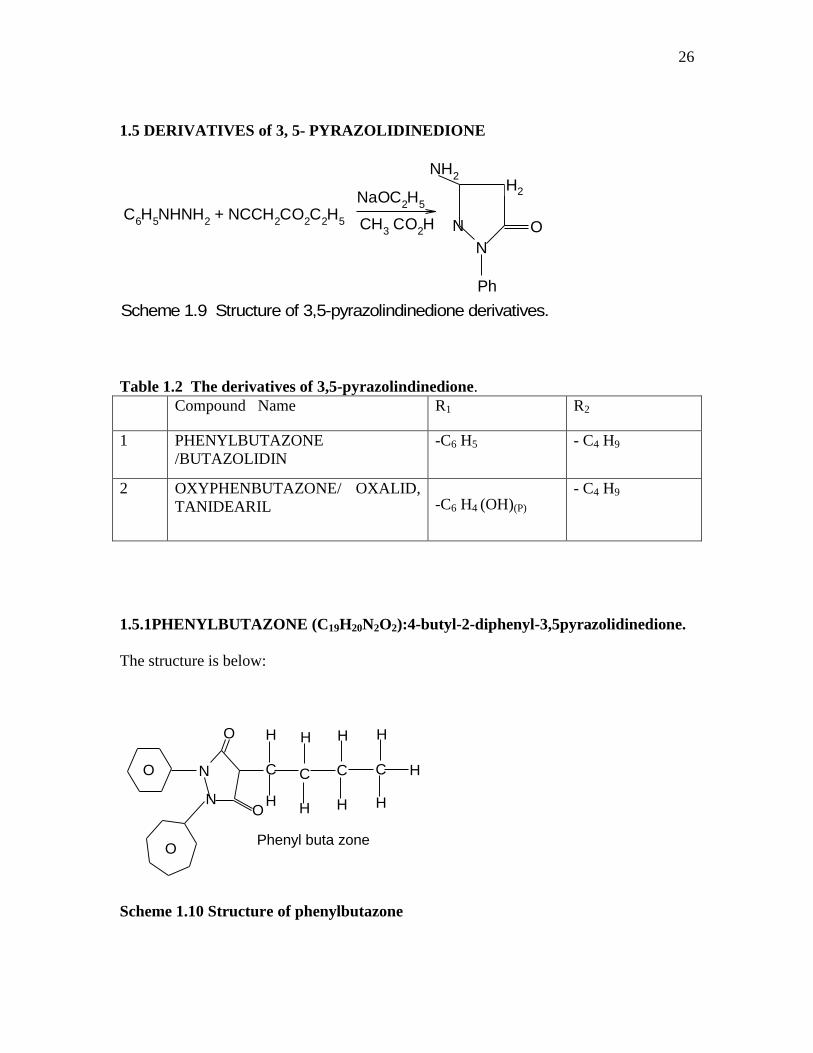
1.5.1PHENYLBUTAZONE (C19H20N2O2):4-butyl-2-diphenyl-3,5pyrazolidinedione.
The structure is below:
N
N
O
O
C C CC
H
HH
HH
H
H
H
O
O
H
Phenyl buta zone
Scheme 1.10 Structure of phenylbutazone

27
It is a crystalline substance. It has a slightly aromatic odour and is freely soluble
in ether, acetone, and ethyl acetate, very slightly soluble in water, and is soluble in
alcohol (1:20). Despite its name, phenylbutazone is chemically unrelated to the class of
chemicals known as benzones (common e.g. includes oxybenzone, dioxybenzone,
azobenzone and sulisobenzone)27
SYNTHESIS: It is prepared by condensing n- butyl malonic acid or its derivatives with
hydrazobenzene to get 1,2-diphenyl-4-n-butyl-3,5- pyrazolidinediene27
. Alternatively, it
can be prepared by treating 1,2,-diphenyl-3,5-pyrazolidinedione obtained by a procedure
analogous to the foregoing condensation, with butylbromide in 2N sodium hydroxide at
700C or with n-butyl aldhyde followed by reduction utilizing Raney nicked catalyst.
Which are used as active ingredients in sunscreen formulations for protection against
UVB rays2.
APPLCIATION:
Phenylbutazone is a Non-Steroidal Ant –Inflammatory Drug (NSAIDS) for the
treatment of chronic pain, including the symptoms of arthritis. It use is limited by such
severe side effects as suppression of white blood cell production and aplastic anemia.
The Non-steroidal anti-inflammatory drug of phenylbutazone is commonly used in horses
for the following purposes.
ANALGESIA: It is a Pain reliever. It relieves pains from infections and musculoskeletal
disorders including sprains, over use injuries, tendonitis, orthralgias, arthritis, and
laminitis. Like other NSAIDS, acts directly on musculoskeletal tissue to control

28
inflammation, there by reducing secondary inflammatory damage, alleviating pain, and
restoring range of motion. It does not cure musculoskeletal ailments or work well on
colic pain.
Phenylbutazone may be administered orally (via paste, powder or feed –in) or
intravenously. It should not be given intramuscularly or injected in any place damage and
edema may also occur if the drug is injected respectively into the same vein28
.
1.5.2 OXYPHENBUTAZONE (C13H14N2O3):
4-Butyl-1-(4-hydroxyphenyl)-2-phenyl-3,5-pyrazolidinedione is a metabolite of
phenylbutazone and it has the same effectiveness, indications, side effects, and
contraindications. Its only apparent advantage is that it causes acute gastric irritation less
frequently.
The metabolite of phenylbutazone, differs only in the para location of one of its phenyl
groups where a hydrogen atom is replaced by a hydroxyl group.
1.6 OBJECTIVES OF THE PRESENT RESEARCH
This work reports the synthesis, characterization and preliminary antimicrobial
activities of some azoligands derived from aminoantipyrine and their Co(II), Fe(III) and
Os(VIII) complexes. This is aimed at synthesizing some new azo ligands by coupling
reaction between 4-aminoantipyrine with 1,2,3 trihydroxylbenzene, isatine and
azophyneyl-2-naphthol respectively. Synthesizing complexes of Co(II), Fe(III) and
Os(VIII) with the prepared azo ligands. Characterizing the ligands and their complexes
on the basis of their melting point, molar conductivity, electronic, infrared and 1H and
13C

29
Nuclear Magnetic Resonance spectra. Proposing the structures for the synthesized ligands
and their complexes on the basis of their spectral information. Testing these synthesized
ligands and complexes for antimicrobial activity.
30
CHAPTER TWO
LITERATURE RIEVIEW
2.1 Coordination Chemistry of Azo-Pyrazolones/Derivatives
Metal coordination compounds with azo ligands:
The chemistry of metal coordination compounds with azo ligands provides an
illustrative example of the investigation into a number of key problems of the area, such
as fitting the ligand to stereo- and electronic requirements of the metal center, stereo- an
regioselective approach to the complexes with the targeted type of the coordination site,
stabilization of a certain tautomeric form in the ligand .
The azo coupling reaction is a widely used method for the preparation of azo
derivatives of pyrazol-5-ones, e.g. 4-aryl(hetaryl)pyrazol-5-ones II29-32
. Treatment of II
with POCl3 replaces the carbonyl oxygen in II by a chloro substituent III. The chloride
could be exchanged with a primary amine to form (IV)30
or with a sulfide to give (V)32-
36.

31
RN Y EtOH
0.c
NN
R
O
R NN
H
R
NN
R
R NN
RPOCl
3
NN
R
R NN
H
RCl
NN
R
R NN
RH NR
140.c
Na2S
DMSO
N
R
H
S
NN
R
O
R NN
H
R
NN
R
O
R
1
2-
R=Ar, Het; R , R =Alk,Ar1 2
III
1
refl., 12h 1
60 ,4h
5-6h
22
2
3
II III
IV
V
2
1
2
1
Scheme 2.1 Reactions azopyrazolone
Azo pyrazolone compounds readily form metal chelate complexes upon treatment
with metal salts (preferably; acetates) in methanol or ethanol solution (VI).
NN
R
O
R NN
HN
N
R
R N=N
OM/n
Ar
R2
R1
Ar
MYMeOH
Sheme 2.2 Complex formation in azopyrazolone.
1
2
II
2
1
, =Alk,Ar;
n=2,3
VI
+refl., 30min
n

32
The azohydrazonic forms many tautomer. This is the characteristic property of azo
pyrazolone compounds II37,38-43.
In the azo-pyrazolones, up to four prototropic isomers may be involved in the
tautomeric equilibrium37,30,31,35,42,43.44.
As has been reported by NMR spectroscopy
(solutions)34,36,40,48
and X-ray structural determinations (solid phase)37,42,44,46,47
, the
hydrazone IIa represents energy preferred isomeric forms of most of compounds II.
Stereochemical configuration of a metal center in tetra coordinated metal chelate
complexes of azo ligands is determined by the nature of the metal. As shown by X-ray
studies, the trans-planar coordination sites are characteristic of the Ni(II),Cu(II) and
Pd(II) complexes , whereas similar Co(II) and Zn (II) complexes have the tetrahedral
structure38,49-51
. In Pt(II) metal chelate complex, two trans-planar (40-45%) and cis-
planar (4-6%) configurational isomers were reported and isolated in a pure form52
.
According to the X-ray diffraction data, Fe(III) complexes of azo-pyrazolone have been
reported to have penta coordinated trigonal bipyramidal structure53
. The same structural
effect was reported also for the azomethine analogues of Fe(III) of azo-pyrazolone54-57
.
Also 1-(2-thiazolyazo)-2-naphthalenol) has been reported to coordinate
equatorially to six-coordinate Fe(III) ion to give octahedral environments, around the
metal ion anchor69
.
The metal ions at higher oxidation numbers, e.g. Co(III)31
and Ru(III)36
can form
octahedral complexes with bidentate azo ligands. The octahedral configuration of a metal
center has been proven by X-ray determinations for the Fe(III) complexes (Bis[4-azo]-3-
methyl-1-phenyl-5-thioxo-1,5-dihydro-4h-pyrazol-4-one quinolin-8-ylhydrazone)32
.
33
Intrachelate isomerism is the type of bond-linkage isomerism58,59
that are found in
the metal chelate complexes containing several competitive donor centers in a
coordination site. In the azo ligands II, IV,V such a role may be played by each of the
two nitrogens of an ambidental azo group 49,54,59
.
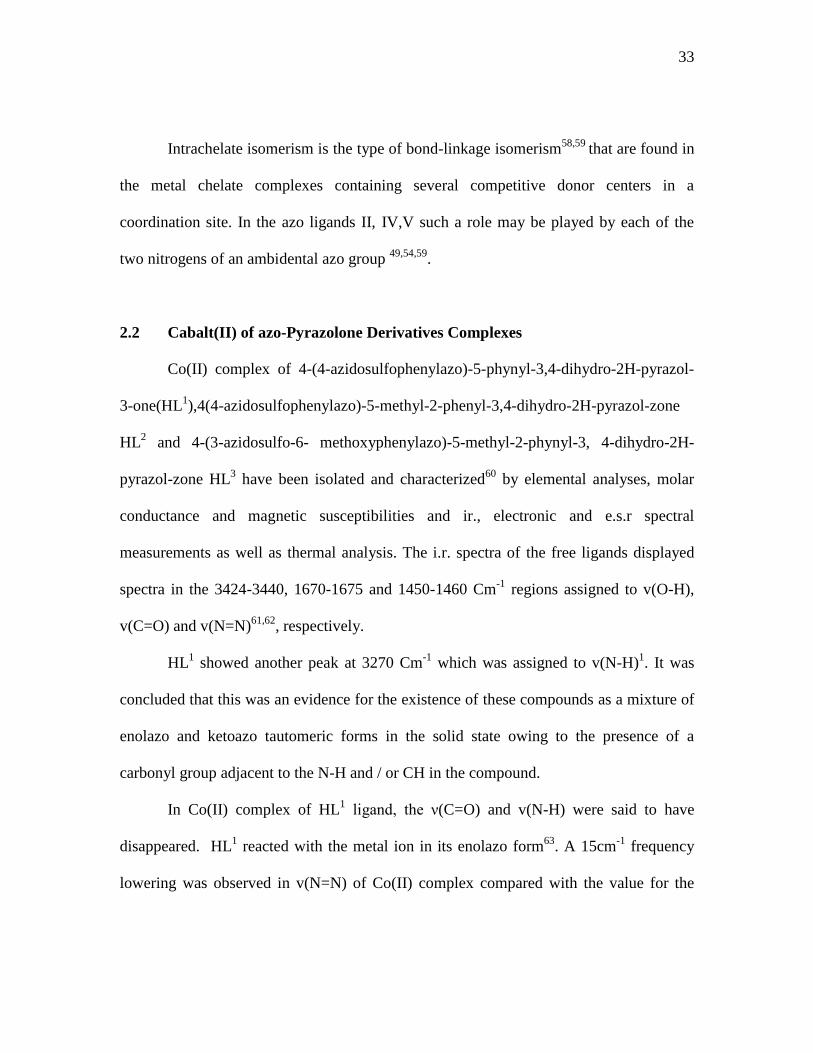
2.2 Cabalt(II) of azo-Pyrazolone Derivatives Complexes
Co(II) complex of 4-(4-azidosulfophenylazo)-5-phynyl-3,4-dihydro-2H-pyrazol-
3-one(HL1),4(4-azidosulfophenylazo)-5-methyl-2-phenyl-3,4-dihydro-2H-pyrazol-zone
HL2 and 4-(3-azidosulfo-6- methoxyphenylazo)-5-methyl-2-phynyl-3, 4-dihydro-2H-
pyrazol-zone HL3 have been isolated and characterized
60 by elemental analyses, molar
conductance and magnetic susceptibilities and ir., electronic and e.s.r spectral
measurements as well as thermal analysis. The i.r. spectra of the free ligands displayed
spectra in the 3424-3440, 1670-1675 and 1450-1460 Cm-1
regions assigned to v(O-H),
v(C=O) and v(N=N)61,62
, respectively.
HL1 showed another peak at 3270 Cm
-1 which was assigned to v(N-H)
1. It was
concluded that this was an evidence for the existence of these compounds as a mixture of
enolazo and ketoazo tautomeric forms in the solid state owing to the presence of a
carbonyl group adjacent to the N-H and / or CH in the compound.
In Co(II) complex of HL1 ligand, the ν(C=O) and v(N-H) were said to have
disappeared. HL1 reacted with the metal ion in its enolazo form
63. A 15cm
-1 frequency
lowering was observed in v(N=N) of Co(II) complex compared with the value for the
34
corresponding free ligands. This indicated coordination of an v(N=N) group to metal;
The peaks which appeared between 420-435cm-1
region were assignable to (M-N)64
.
The peaks assigned to v(N=N), v(C=N) (pyrazolone) and v(SO2)65
of the complex
occurred at nearly the same wave numbers as in their corresponding free ligands. He
suggested that these groups were not involved in bonding to metal ion. The spectra of HL
aqua complexes showed broad bands centered in the 3400-3425cm-1
range, medium to
weak peaks in the 1610 – 1620 cm-1
range and peaks in the 850 – 890 cm-1
range that
become more apparent in the aqua complexes, assignable to stretching, scissoring and
twisting rocking vibrational modes of coordinated water molecules, respectively64
, Samir
S. kandil revealed that the HL ligands coordinated to enolic oxygen of the pyrazolone
moiety and the azo group, with water molecules.
The Co(II) complexes possessed magnetic moments in the 4.65 – 4.86 B.M.
range, within that reported for free-spin octahedral or tetrahedial geometry cobalt (II)
complexes68
. The [CoL1
2(H2O)2] compound showed a V2 band which was attributed to
the (4T1g(F) 4A2g(F) transition) at 605 nm and a V3 band (assigned to the
4T1g(F)
4T1g(P) transition) at 510 nm, which leaded to 10 Dq = 7940 cm
-1 and the B=935 cm
-1.
The [CoL2
2(H2O)2] compound had a V2 band at 620 nm and a V3 band at 520 nm with
10Dq = 8500 cm-1
B=895 cm-1
. The 10Dq values were comparable reported to be with
those published for the octahedral geometry cobalt (II) complexes with the CoN2O4
chromophore
The [CoL3
2] compound exhibits a relatively intense peak at 565 nm assigned to
4A2
4T2(f) transition in tetrahedial cobalt (II) complexes
68.

35
Secondly, Cobalt(II)complex of 1-(2-thiazolyano)-2-naphthalenol had been
investigated69
. The compound was characterized by elemental and thermal analysis,
molar conductance, IR, magnetic and diffuse reflectance spectra. The complex was found
to have the formulae [M(L)2] for M = Co(II). The molar conductance data revealed that
the complex was non-electrolyte.
The electronic spectra of Co(II) chalets showed three bands at 215, 254 and 311
nm which were attributed to the π π* and n π
* transitions respectively, within the
ligand. Co(II) complex gave three bands at 12,820, 15,552 and 17, 574 cm-1
. The fourth
region at 25, 574 cm-1
was referred to the charge transfer band (L MCT). The bands
observed were assigned to the transition 4T1g(f)
4T2g(f) (V1),
4T1g(f)
4A2g(f) (V2) and
4T1g(f) v
4T2g(p)(V3), respectively. These suggested that there was an octahedral geometry
around Co(II) ion70,71
. The magnetic susceptibility measurement (5.15B.M) indicated an
octahedral geometry71
.
The IR spectra of the free ligand mentioned above and its metal chelate were
carried out in the 4000-400 cm-1
range. The IR spectrum of the ligand showed a broad
band at 3500-3050 cm-1
, which was attributed to the phenolic OH group. This band was
still broad in the complex which they said it was difficult to attribute it to the involvement
of phenolic OH group in coordination. The involvement of the deprotonated phenolic OH
group in chelation was confirmed by the blue-shift of the (C-O) stretching band, which
was observed at 1215 cm-1
in the free ligand, to the extent of 5-16 cm-1
in the complex72
.
The v(N=N) stretching band in the free ligand was observed at 1579 cm-1 72,73
. This band

36
shifted to higher frequency values upon complexation which suggested that
coordination was through the azo group (M←N)72
.
In the far-IR spectra of the complex, the non ligand bands observed at 422-472
and 473-506 cm-1
region were assigned to the v(M-N) stretching vibrations of the azo and
N3 thiazole nitrogen, respectively74
. They concluded that the bonding of oxygen to the
metal ion was by the occurrence of band at 504 as the result of v(M-O)72,74.
Finally, they
concluded that the IR spectra indicated that the ligand (HL) behaved as monobasic acid
and the coordination sites being Ar-OH, - N=N-, and the N3 atom of the thiazole moiety.
Thirdly, Co(II) complexes of 4-formylazohydrazo aniline antipyrine has been reported75
.
The ligand and complex were characterized by IR, electronic spectra, molar
conductivities, magnetic susceptibilities and ESR.
The 1H NMR spectrum of 4-formylazohydrazoaniline antipyrine (HL) showed
strong signals at 2.413 and 3.260 PPM, due to C-CH3 and N-CH3 protons respectively.
The spectrum also showed signals at 10.419, 8.349, and 6954 PPM, assigned to intra
molecular hydrogen bonding (NH….O), intermolecular hydrogen bonding to the solvent
and CH3-N protons respectively. The electronic spectra of all the cobalt (II) complexes
investigated, consist of two bands, one in the 15380 – 16130 cm-1
and other band in the
19050 – 19610 cm-1
regions, which indicated the octahedral stereochemistry of the
complexes.
The IR spectrum of the ligand showed bands at 3190, 1655, 1635, 1608 and 1530
cm-1
assigned to v(N-H) V(C=O), v(C=O)b of the pyrazolone ring, (C=N) and v(N=N)

37
respectively. The bands corresponding to V(N-H) and N(C=O) at the side chain
disappeared in all the Co(II) complexes. This indicated that the ligand reacted in the enol-
hydrazo form and the oxygen atom coordinated through its enolic form.
Two of cobalt (II) complexes showed that the V(C=O) of the pyrazolone ring shifted to
lower frequency as a result of its band at the same frequency as that of the free ligand,
which indicated that the carbonyl oxygen of the pyrazolone ring does not coordinate. In
all the Co(II) complexes the peaks corresponding to V(N=N) appeared at the same
frequency as that of the free ligand, which means that azo nitrogens were not involved in
coordination.
The above arguments indicated that the ligand behaves as a monovalent or neutral
tridentate ligand and coordination took place via the carbonyl oxygen of the pyrazolone
ring, azo methine nitrogen and the enolic oxygen or carbonyl oxygen atom, for instsnat,
the ligand was said to have reacted in the enol-hydrazo or keo-azo form. That Co(II)
complex which does not coordinate through azo nitrogen and carbonyl group of
pyrazolone behaved as a neutral bidentate ligand. Coordination took place through the
azomethine nitrogen and the carbonyl oxygen of the side chain.
Other bands were observed around 500, 460 – 425 cm-1
, assigned to v(M-O)76
and V(M-
N)76
respectively. The chloro complexes showed additional band at 350-320 cm-1
assigned to v(M-Cl)77
. The molar conductivities was said to be done in DMSO (10-3
M)
solution. It was observed that the complexes behavd as non electrolytes 78
.
Finally, Cobalt (II) complex of Arylazo derivatives of 5-amino pyrazole (2-(5-
amino-3-methyl-1-phenyl-IH-pyrazol-4-ylazo)benzoic acid have been reported79
and

38
studied by the aid of elemental analysis, mass, IR, Raman, 1H – NMR spectroscopy
magnetic measurements, UV-Visible, and molar conductance.
The molar conductance values of 10-3
M of complex was done in DMF at 250C were
found to be in the range of (11.9 – 27.5) Ohm-1
mole-1
cm2 which indicated the non
electrolytic nature of complex 72,73
.
The electronic absorption spectra of metal complex in DMF solution showed a red shift
for π-π electronic transition band. [Co(L). H2O] showed one broad band in the visible
region at 20,181 cm-1
assigned to 4T1g(f)
2T1g(f). The magnetic moment was recorded
to be 6.04 B.M. This corresponded with tetrahedral geometry of cobalt metal ion82
.
The 1H – NMR spectrum of the ligand showed signals at 2.5 and 2.4 ppm
which they assigned to CH3 protons of solvent83
and CH3 protons attached to the pyrazole
moiety84
. The signal at 3.3 ppm was attributed to COOH moiety.
The band remained the same in Co(II) complex which indicated carboxylic group
was not involved in coordination. There were other multiple signals between 6.9 – 8.0
ppm, assigned to 9 aromatic protons and NH2 protons. The IR spectra of the free ligand
displayed a sharp band at 3464 and 3317 cm-1
which they assigned to asymmetric and
symmetric vibrations of v(NH) respectively. Cobalt (II) complex showed this band at
lower wave number. This indicated that coordination took place through N atom of the
amino group 85
.
The band at 1396 cm-1
was assigned to N=N vibrational mode. This band shifted
to lower frequency in the spectrum of Co(II) complex. They concluded that the azo group
39
was involved in coordination (M←N)86
. IR and Raman spectra showed ν(C=O) as very
weak band at 1743 – 1747 cm-1
. It indicated the participation of carboxylic group in
chelation as carboxylate ion after its protonation but this was not observed in the Raman
spectra of the complex. The bands between 510, 446 – 461 and 405 – 427 cm-1
were
assigned to M-O, M-N of azo group and M-N of nitrogen of amino group.
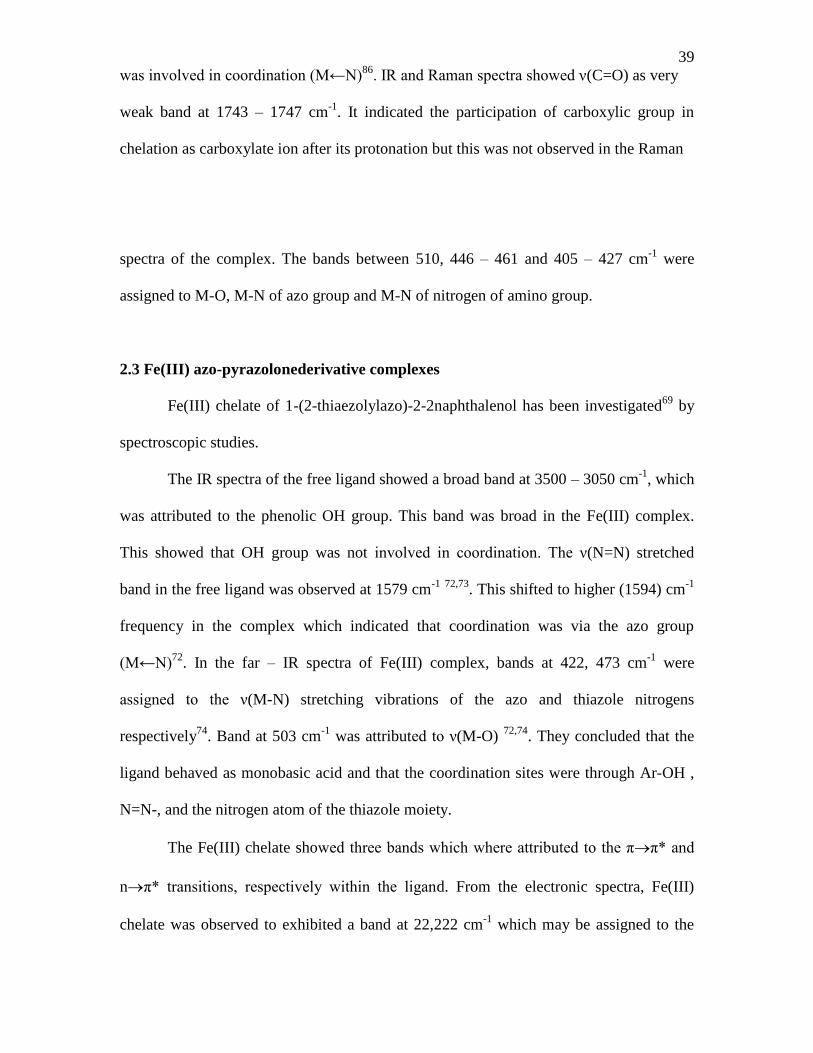
2.3 Fe(III) azo-pyrazolonederivative complexes
Fe(III) chelate of 1-(2-thiaezolylazo)-2-2naphthalenol has been investigated69
by
spectroscopic studies.
The IR spectra of the free ligand showed a broad band at 3500 – 3050 cm-1
, which
was attributed to the phenolic OH group. This band was broad in the Fe(III) complex.
This showed that OH group was not involved in coordination. The ν(N=N) stretched
band in the free ligand was observed at 1579 cm-1
72,73
. This shifted to higher (1594) cm-1
frequency in the complex which indicated that coordination was via the azo group
(M←N)72
. In the far – IR spectra of Fe(III) complex, bands at 422, 473 cm-1
were
assigned to the ν(M-N) stretching vibrations of the azo and thiazole nitrogens
respectively74
. Band at 503 cm-1
was attributed to ν(M-O) 72,74
. They concluded that the
ligand behaved as monobasic acid and that the coordination sites were through Ar-OH ,
N=N-, and the nitrogen atom of the thiazole moiety.
The Fe(III) chelate showed three bands which where attributed to the ππ* and
nπ* transitions, respectively within the ligand. From the electronic spectra, Fe(III)
chelate was observed to exhibited a band at 22,222 cm-1
which may be assigned to the

40 6A1g
5T1g (G) transition in octahedral geometry of the complex
73. The
6A1g
5T1g
transition appears to be split into two bands at 12,554 and 17,482 cm-1
. The observed
magnetic moment of Fe(III) complex was 5.37 B.M. Thus, the complex formed has
octahedral geometry around the Fe(III) ion75
. The band observed at 26,954 cm-1
was
attributed to ligand-to-metal charge transfer band.
The low values of the molar conductance of the complex suggested that Fe(III)
complex was a non-electrolyte.
Secondly,Fe(III) complex of 4-formylazohydrazoaniline antipyrine has been
investigated by means of spectroscopic studies 75
. The 1H NMR spectrum of the ligand
showed strong signals at 2.413 and 3.260 PPM, due to C-CH3 and N-CH3 protons
respectively. The spectrum also showed signals at 10.419, 8.349 and 6.95 ppm, assigned
to intramolecular hydrogen bonding (NH …O), intermolecular hydrogen bonding to the
solvent and CH3-N protons respectively.
The IR spectrum of the ligand showed band at 3190, 2180, 1655, 1635, 1608, and
1530cm-1
assigned to ν (N-H) ν(CN), ν(C =O)a, ν (C=O) of the pyrazolone ring,
ν(C=N) and ν (N =N) respectively IR spectra bands of the Fe(III) complex ν (C=N)
shifted to lower frequency. This was said to be because of its involvement in
coordination.
The peaks corresponding to ν(N –H) and ν(C =O) of the side chain disappeared in the
spectra of Fe(III) complex. They said that it was because, the ligand reacted in the
enolhydrazo form and the oxygen atom coordinated in its enolic form. The ν(C = O) peak

41
of the pyrazolone in the complex shifted to lower frequency as a result of its
coordination.
The peaks corresponding to ν(N =N) in the complex appeared at the same
frequency in the free ligand which indicated that azo nitrogens were not involved in
coordination. The ligand behaved as a monovalent or neutral tridentate ligand and
coordination took place via the carhonyl oxygen of the pyrazolone ring, azomethine
nitrogen and the enolic oxygen or carbonyl oxygen atom, viz the ligand reacted in the
enol-hydrazo or keto-azo form.
The complex also showed other peaks at 500cm-1
, 440cm-1
& 380cm-1
, assigned to ν(M-
O)70
, ν(M-N) and ν(M –Cl)71
.
The electronic absorption spectra of iron (III) complex showed two bands around
17390 and 22220cm-1
being assigned to 6A1g →
4T1g and
6A1g →
4T2g transitions
respectively. This indicated the octahedral geometry of the Fe(III) complex.
2.4 BRIEF REVIEW OF METHODS OF CHARACTERIZING COMPLEXES
2.4.1 STIOCHIOMETRIC STUDIES OF COMPLEX IONS
Stoichiometry is one of the most useful tools for elucidating the composition of
complex ions in solution and determining their formation constants.
The power of the technique lies in the fact that quantitative absorption measurement can
be performed without disturbing the equilibria under consideration.
Although must spectrophotometric studies of complexes involve systems in which
a reactant or a product absorbs, this condition is not a necessity provided that one of the
42
components can be caused to participate in a competing equilibrium that does produce
an absorbing species. For example, complexes of Fe(III) with non-absorbing liquid might
be studied by investigating the affect of this ligand on the colour of the Fe(II) –
Orthphenanthroline complex. The function constant and the composition of the non
absorbing species can then be evaluated provided the corresponding data are available for
the phenanthroline complex.
Three of the most common techniques employed for complex-ion studies are the
method of continuous variation, the mole – ratio method and the slope –ratio method.
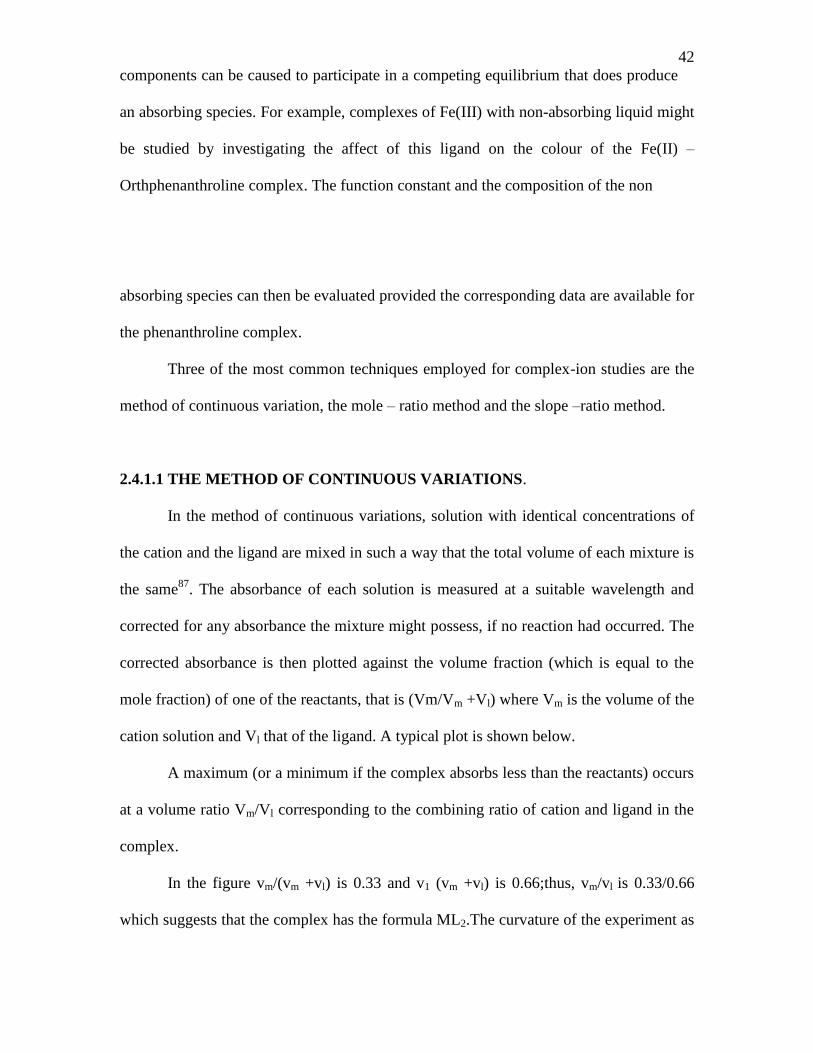
2.4.1.1 THE METHOD OF CONTINUOUS VARIATIONS.
In the method of continuous variations, solution with identical concentrations of
the cation and the ligand are mixed in such a way that the total volume of each mixture is
the same87
. The absorbance of each solution is measured at a suitable wavelength and
corrected for any absorbance the mixture might possess, if no reaction had occurred. The
corrected absorbance is then plotted against the volume fraction (which is equal to the
mole fraction) of one of the reactants, that is (Vm/Vm +Vl) where Vm is the volume of the
cation solution and Vl that of the ligand. A typical plot is shown below.
A maximum (or a minimum if the complex absorbs less than the reactants) occurs
at a volume ratio Vm/Vl corresponding to the combining ratio of cation and ligand in the
complex.
In the figure vm/(vm +vl) is 0.33 and v1 (vm +vl) is 0.66;thus, vm/vl is 0.33/0.66
which suggests that the complex has the formula ML2.The curvature of the experiment as
43
shown in the sketch is the result of incompleteness of the complex – formation or
reaction. By measuring the deviations from the theoretical straight lines indicated in the
figure, a formation constant for the complex can be calculated.
To determine whether more than one complex forms between the reactants, the
experiment is ordinarily repeated with different reactant concentrations and at several
wavelengths88
.
Fig 1 The Job’s plot of absorbance against volume fraction of ligand
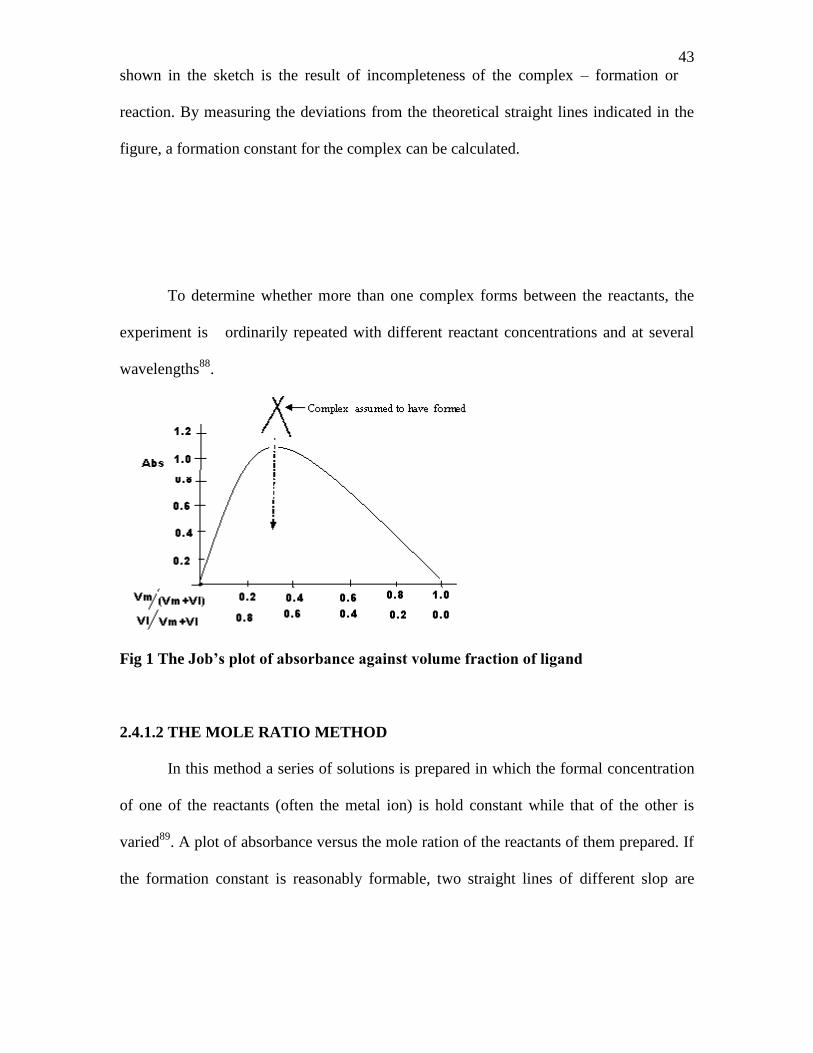
2.4.1.2 THE MOLE RATIO METHOD
In this method a series of solutions is prepared in which the formal concentration
of one of the reactants (often the metal ion) is hold constant while that of the other is
varied89
. A plot of absorbance versus the mole ration of the reactants of them prepared. If
the formation constant is reasonably formable, two straight lines of different slop are
44
obtained; the intersection occurs at a mole ratio that corresponds to the combining ratio
in the complex. Typical mole –ratio plots are shown below.
Note that the ligand of the 1:2 complexes absorbs at the wavelength selected; as a
result, the slope beyond the equivalence point is greater than zero.
The uncomplexed cation involved in the 1:1 complex absorbs, since the initial point has
an absorbance greater than zero.
From the experimental plots, the formation constant can be obtained.
If the complex formation reaction is relatively incomplete, the mole-ratio plot appears as
a continuous smooth curve with no straight – line portions that can be extrapolated to
give the combining ration. Such a reaction can sometimes be forced to completion by the
addition of a several hundred fold excess of the ligand until the absorbance becomes
independent of further additions. The constant absorbance can then be employed to
calculate the molar absorptivity of the complex by assuming that essentially the entire
metal ion has combined with the ligand, and that the complex concentration is equal to
the concentration of the metal one can then successively assume that the complex has
various compositions. Such as 1:1,1:2 and so forth to calculate equilibrium
concentrations. The composition that gives constant numerical values for the formation
constant over a under concentration range can then be assumed to be that for the complex
45
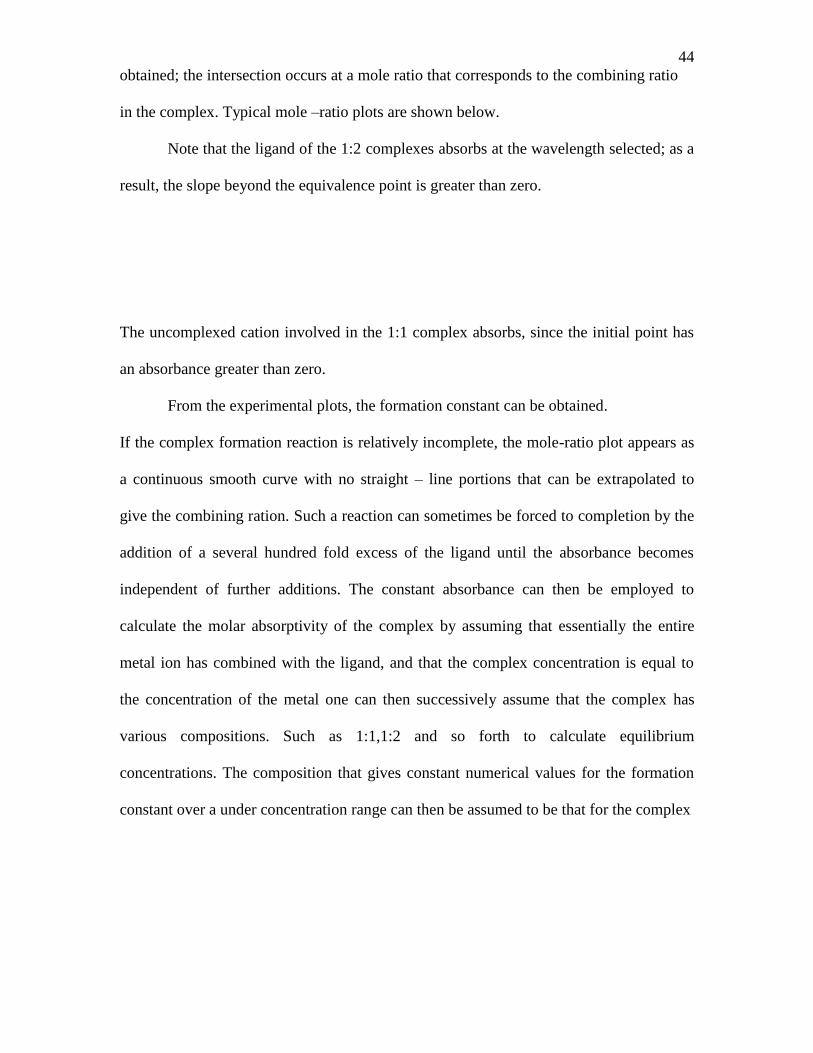
Fig. 2. The slop ratio plot for absorbance against mole ligand per mole cation.
A mole - ratio plot may reveal the stepwise formation or five or more complex as
successive slope charges, provide the complexes have different molar absorptivities and
provided the formation constants are sufficiently different.
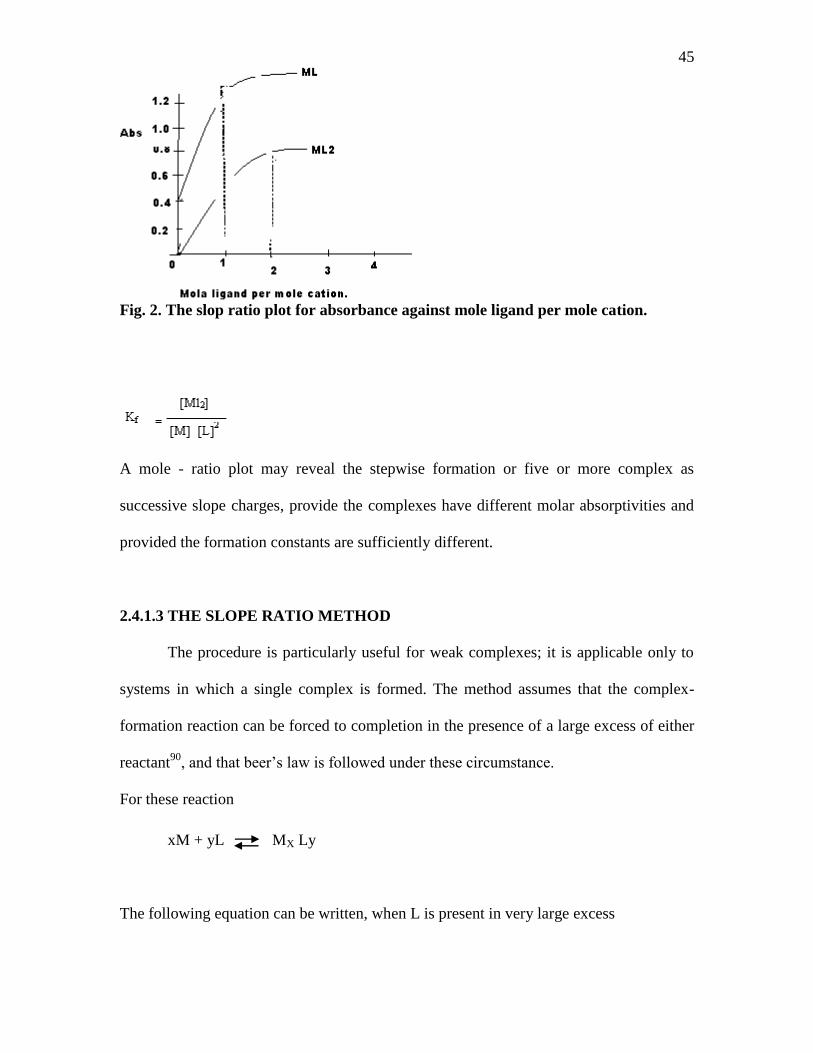
2.4.1.3 THE SLOPE RATIO METHOD
The procedure is particularly useful for weak complexes; it is applicable only to
systems in which a single complex is formed. The method assumes that the complex-
formation reaction can be forced to completion in the presence of a large excess of either
reactant90
, and that beer’s law is followed under these circumstance.
For these reaction
xM + yL MX Ly
The following equation can be written, when L is present in very large excess
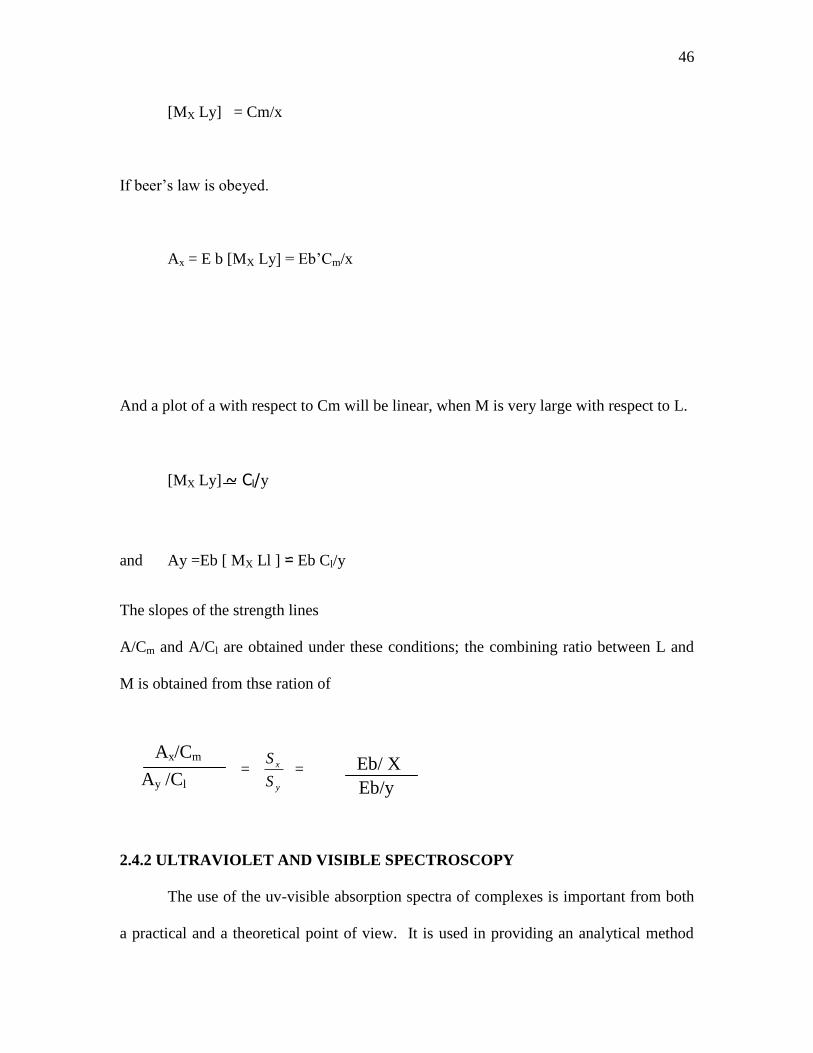
46
[MX Ly] = Cm/x
If beer’s law is obeyed.
Ax = E b [MX Ly] = Eb’Cm/x
And a plot of a with respect to Cm will be linear, when M is very large with respect to L.
[MX Ly] ~ Cl/y
and Ay =Eb [ MX Ll ] ⋍ Eb Cl/y
The slopes of the strength lines
A/Cm and A/Cl are obtained under these conditions; the combining ratio between L and
M is obtained from thse ration of
= y
x
S
S =
2.4.2 ULTRAVIOLET AND VISIBLE SPECTROSCOPY
The use of the uv-visible absorption spectra of complexes is important from both
a practical and a theoretical point of view. It is used in providing an analytical method
Ax/Cm
Ay /Cl Eb/ X
Eb/y
47
for the determination of the concentrations of complex species in solution140
and also
furnishes information on the structure and stability of complexes. The visible and
ultraviolet spectra of compound and ions are associated only with transitions between
electronic energy levels of certain types or groups of atoms within the componud141
and
do not characterize the molecule as a whole. This spectroscopy depends more on the
theory of molecular orbital and it helps to explain the electronic transitions which the
orbitals are involved in. The uv-visible absorption involves employing n, σ or π orbitals,
and their excited states140,142
. And this absorption promotes electronic transitions like σ-
σ*, n - σ*, n → π*, and π → π*. The ultraviolet region involves two distinct regions; the
near-uv (400nm to 190nm) and far – uv (190nm to 100nm).
2.4.3 INFRARED SPECTROSCOPY
This spectroscopy has become an indispensable tool for the determination of
structural information concerning organic substances. Their analyses have been used for
determining the presence or absence of specific functional groups in a compound140
.
When infrared light is passed through a sample of a compound, some of the frequencies
are absorbed while others are transmitted through the sample without being absorbed.
The energy of most molecular vibrations corresponds to that of the infrared region of the
electromagnetic spectrum. The usual range of an infrared spectrum commonly used is
between 4000cm-1
and 625cm-1
and this is the mid-infrared region141
. The region of
frequencies lower than 650cm-1
is called the far-infrared region and that of frequencies
48
higher than 4000cm-1
is called the near-infrared region. Functional groups have
vibration frequencies characteristic of that functional group within well-defined regions
2.4.4 NUCLEAR MAGNETIC RESONANCE SPECTROSCOPY
The Nuclear Magnetic Resonance phenomenon was first observed in 1946 and it
is concerned with the magnetic properties of certain atomic nuclei notably the nucleus of
the hydrogen atom and that of the carbon-13 isotope of carbon140
. This NMR generally is
observable because certain nuclei behave like bar magnets having magnetic moments
(i.e.spin). Nuclear Magnetic Resonance Spectroscopy gives information on the
environments in which the nuclei of atoms are found in molecules and compounds and
also measure how many atoms are present in each of these environments. A nucleus in a
particular chemical environment is characterized by a chemical shift. That is to say that
resonance is always expressed in terms of this chemical shift (ppm). The resonance
position of the reference material/compound used in NMR spectroscopy is zero and it is
called tetramethylsilane, TMS. For proton NMR, its chemical shift is between zero to ten
tau (0-10τ) or ten to zero delta (10-0δ) while for carbon-13, it is between zero to two
hundred and thirty (0 - 230ppm)143
.
2.5 PHARMACOLOGY OF COORDINATION COMPOUNDS OF IRON AND
COBALT.
2.5.1 IRON IN PHARMACEUTICAL STUDIES.

49
Formulations with improved bioavailability and reduced toxicity for the
supplementation of dietary iron are being sought. Phospholipids – encapsulated ferrous
sulfate is an example 91
Other applications of iron are closely analogous properties and
interactions with reactive oxygen species. Iron is believed to be an essential co-factor in
the cytotoxic activity of the anti-cancer drug bleomycin, which catalyses production of
reactive oxygen species in close proximity to DNA. The role of individual domains of
the bleomycin molecule has been revisited. This has resulted in improved understanding
of the modular design, including the nature and role of the iron- binding site92
, the
purimidine group 93
the threonine side chain 94
the bithiazole moiety 95
and the valeric
acid linker 96
Iron complexes of Salicylic acid 97
and his (salicylic) glycine 98
participate
in the generation of toxic radical species. In the latter case this induces DNA damage and
lipid damage in the presence of sulfite, possibly true formation of the sulfuroxyl radical.
It is suggested that such process as may contribute to the biological toxicity of iron, iron
– chelating agents such as pyridoxal iso-nicotinoyl hydrazones 99
have been shown in
vitro to protect against such damage induce by “Free” (ie weakly chelated) iron. On the
other hand iron complexes may also protect against radical damages, by demonstrating
SOD – like activity, exemplified by a series of iron (III) complexes of pentaaza macro
cyclic ligands [FeCl2 L]- [which probably exist as [Fe (H2O)2 L]
+ in aqueous solution)
102.
The magnetism of iron compounds can be exploited in drug targeting by
combining drugs with magnetic materials such as metallic iron, iron oxides and ferrites,
and then magnetically guiding the particles to the target site. The magnetic properties of
iron. (Synthetic iron oxides or the ferroprotein ferritin) 101
, find application as contrast
50
agents in MRI. Iron oxide particles conjugated to transferring accumulate selectively in
rat mammary carcinomas, leading to a significant [4%] localized decrease in MRI signal,
thus allowing in Vivo detection of tumours102
. Another developing application of
magnetic iron containing materials is the treatment of tumors, by using an alternating
external magnetic field to induce hyperthermia in tissue to which magnetite particles,
continued with in cationic liposome, have been delivered 103.
Complexes of iron, especially ferrocene derivatives, have previously been shown
to exhibit carcinostatic properties, and 4 - ferrocenylbutanoic acid has been coupled
reversibly (via amide bond formation) to water soluble polymers bearing pendant amine
groups to give carcino static conjugates104
2.5.2 COBALT IN BIOLOGICAL STUDIES.
In previous years complexes of Co(III) containing mustard – like ligands have
been described as part of a programme to design hypoxia-activated prodrugs for cancer
treatment. The complexes are designed to release active nitrogen mustard groups upon
reduction. (Selectively in hypoxic tissue from kinetically nert Co(III) to labile Co(II).
This programme has continued with the synthesis of dithiocarbamate complexes [Co®2
L]2 . (L = N,N-bis (2-chloro ethyl) ethylamine diamine or N, N- bis (2-chloro ethyl)
ethylene diamine, R=diethyl -, dimethyl-, or pyrrolidine-dithiocarbamate). Although
previous complexes have shown hypoxia-selective cytotoxicity, these complexes do not

51
because the re-oxidation of the reduced species by O2 is too slow to compete with
release of the mustard104
Use of the + - emitting radionuclide
105.Co for positron emission tomography
(PET) applications has been reported. It is proposed that cobalt, administered as CoCl2.
mimics the distribution of calcium, which is deposited at sites of tissue damage resulting
from ischemia. This offers the opportunities to image these sites in vivo, and imaging of
ischemic brain damage in stroke patients 105, 106
has been reported. Use of CoCl2 to
radiolabel hymphocytes for imaging inflammatory processes in vivo has also been
reported107
.
2.6 OTHER USES OF COORDINATION COMPOUNDS OF AZO
PYRAZOLONES/DERIVATIVES.
Generally, azo compounds have been reported to have biological activity108-111
as
well as industrial importance112
. Azo pyrazole derivatives and their metal complexes can
be used as inkjet; they have got fastness properties for dying papers113
and posses high
dying power on fibers114
. They can also be used in subtractive photographic process and
for the production of color transparencies and color pictures115
and have may
applications.
Azo compounds have been also reported to be involved in a number of biological
reactions such as inhibition of DNA, RNA and protein synthesis, carcinogenesis and
nitrogen fixation116-118
. Furthermore, they have been proved to have biological activity
against bacteria and fungi119-120
. About 5 to 8, arylazo-8-hydroxyquinoline derivatives
and their complexes with transition metals have been reported to be active against
bacteria 121
.
52
Azo derivatives allow the achievement of coloured layers of optics applications
such as fitters, transformers of solar energy, non-linear optics and laser environments 116-
118.
Metal complexes of azo compounds containing a heteroaryl ring systems find
various applications122
. Metal complexes of a series of heterocyclic azo compounds,
prepared by coupling diazotized 2- aminothiazole with 1, 3 – dicarbonyl compounds122
,
thiauracil123
, thymine124
and substituted phenolic compound122,125
, had been reported to
be used as a spectrophotometric reagent for the determination of Pd(II) and Co(II)126
,
UO2(II)127
, Cu(II) and Zn(II) ions128,129
. It could also be, also used in the extraction130
and separation131,132,133
of metal ions.
CHAPTER THREE
EXPERIMENTAL
3.0 MATERIALS
3.1 Reagents/Microorganisms
All reagents used were of analytical grade, only few were of reagent grade and
these were all used without further purification. A list of the reagents employed during
synthesis of the ligands with their complexes, dyeing and antimicrobial analysis are given
in Table 3.1. The microorganisms used were classified before use for analysis and these
are summarized in Table 3.2.
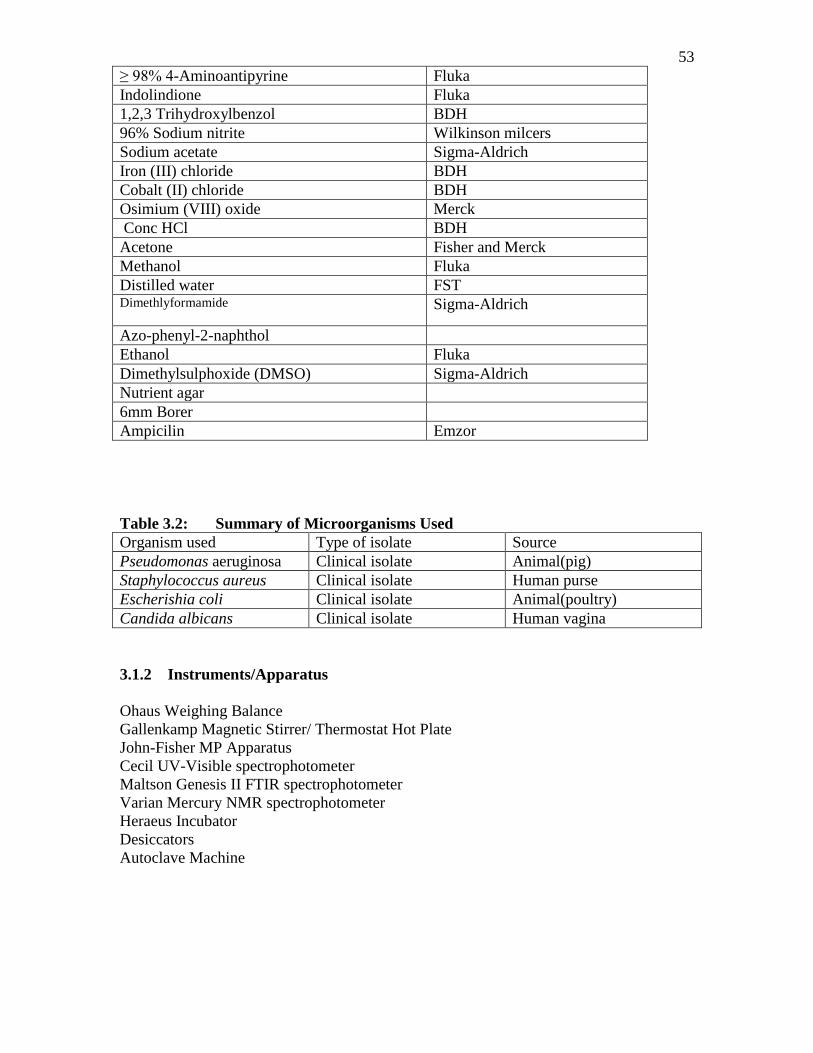
Table 3.1: Summary of Reagents used for the Synthesis and Antimicrobial Test
Reagents Source
53
≥ 98% 4-Aminoantipyrine Fluka
Indolindione Fluka
1,2,3 Trihydroxylbenzol BDH
96% Sodium nitrite Wilkinson milcers
Sodium acetate Sigma-Aldrich
Iron (III) chloride BDH
Cobalt (II) chloride BDH
Osimium (VIII) oxide Merck
Conc HCl BDH
Acetone Fisher and Merck
Methanol Fluka
Distilled water FST Dimethlyformamide Sigma-Aldrich
Azo-phenyl-2-naphthol
Ethanol Fluka
Dimethylsulphoxide (DMSO) Sigma-Aldrich
Nutrient agar
6mm Borer
Ampicilin Emzor
Table 3.2: Summary of Microorganisms Used
Organism used Type of isolate Source
Pseudomonas aeruginosa Clinical isolate Animal(pig)
Staphylococcus aureus Clinical isolate Human purse
Escherishia coli Clinical isolate Animal(poultry)
Candida albicans Clinical isolate Human vagina
3.1.2 Instruments/Apparatus
Ohaus Weighing Balance
Gallenkamp Magnetic Stirrer/ Thermostat Hot Plate
John-Fisher MP Apparatus
Cecil UV-Visible spectrophotometer
Maltson Genesis II FTIR spectrophotometer
Varian Mercury NMR spectrophotometer
Heraeus Incubator
Desiccators
Autoclave Machine
54
Other apparatus employed involves glass-wares of various types, reflux condensers,
thermometers, retort stands, gloves, filter papers (11cm, 9cm), masking tape, rubber
tubings, wash bottles, , automated and disposable pipettes, stringes. .
3.2 METHODS
3.2.1 PREPARATION OF THE AZO LIGANDS
3.2.1:1.SYNTHESIS OF 1,2-DIHYDRO-1,5-DIMETHYL-2-PHENYL-4-[(E)-(2,3,4-
TRIHYDROXYPHENYL)-3H-PYRAZOL-3-ONE(H3L)
H3L was prepared following the method Heinosuke Yasuda134
. 3.045g (30mmole)
of 4-aminoantipyrine was dissolved in dilute hydrochloric acid (25mL Conc. HCl in
125mL H2O) and diazotized with sodium nitrite solution (0.5g in 50mL water) below 50C
with hand stirring. The resulting diazotized 4-aminoantipyrine was poured into a mixture
of an appropriate 1.89g (30mmoles) of 1,2,3 trihydroxylbenzol and crystalline sodium
acetate (62g in 750mL of water) using mechanical stirring at room temperature. The
coloured product which separated was collected and washed with methanol / water. All
the compounds were recrystalized and stored in a desicator over CaCl2.
Other ligands such as 7-[(E)-(2,3-dihydro-1,5-dimethyl-3-oxo-2-phenyl-1H-
pyrazol-4-yl)diazenyl]-1H-indole-2,3-dione
(L) and 1,2-dihydro-4-(E)-[3-hydroxy-4{(E)-phenyldiazenyl}-1-naphthalenyl]-1,5-
dimethyl-2-phenyl-3H-pyrazol-3-one(HL) were prepared following the procedure stated
above.
55
3.2.2 PREPARATION OF COMPLEXES
Generally, the metal compounds and various azo ligands respectively were
reacted together in a 1.2 mole ratio.
3.2.2.1 SYNTHESIS OF [Co(H2L)2]
[Co(H2L)2] was prepared following the method of El.Saied et. al135
. The metal
solution (0.4753g ,2mmole CoCl2 6H2O) was stirred magnetically at 60oC with (0.324g
,1mmole) of the H3L in about 50mL EtOH in a 250mL quick fit round bottomed flask for
a period of 6 hours. The solution was kept in the freezer to crystallized. The resulting
solids were filtered off, recrystalized in ethanol and stored in a desicator over CaCl2.
[Fe(H2L)2]+,[OsCl2(H2L)2(O)2],[CoLCl2(OH2)],[Fe2O(L)2Cl2],
[Co(HL)2(OH2)2]2+
, [Fe2(HL)2Cl2] and [Os(HL)2(O)2Cl2] were also prepared following
the procedure described above.
3.2.3 STOICHIOMETRY OF THE COMPLEXES
The stoichiometries of [Co(H2L)2] ,Fe(H2L)2]+,[OsCl2(H2L)2(O)2],[CoLCl2(OH2)],
[Fe2O(L)2Cl2], [Co(HL)2(OH2)2]2+
, [Fe2(HL)2Cl2] and [Os(HL)2(O)2Cl2] complexes were
determined by employing Job’s continuous variation method of analysis 136
. This was
done by the preparation of 10-3
M solution of the synthesized ligands and the various
metal salts. For each reaction performed, a total of 11 different mixtures were made. This
involved varying the volumes of each metal and ligand to a total 1.0mL. (See Table 3.3).
4mL of absolute ethanol was then added into each mixture and this in turn totaled a
volume of 5mL. These mixtures were corked, shaken and then allowed to stand and react
56
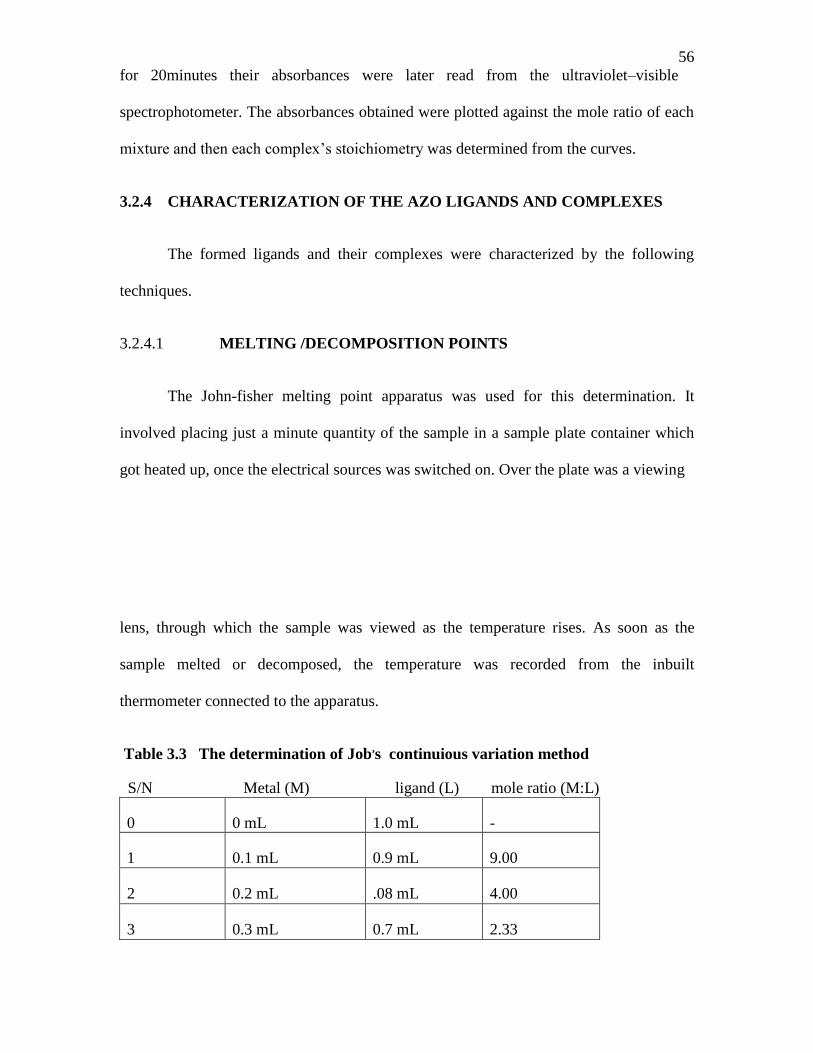
for 20minutes their absorbances were later read from the ultraviolet–visible
spectrophotometer. The absorbances obtained were plotted against the mole ratio of each
mixture and then each complex’s stoichiometry was determined from the curves.
3.2.4 CHARACTERIZATION OF THE AZO LIGANDS AND COMPLEXES
The formed ligands and their complexes were characterized by the following
techniques.
3.2.4.1 MELTING /DECOMPOSITION POINTS
The John-fisher melting point apparatus was used for this determination. It
involved placing just a minute quantity of the sample in a sample plate container which
got heated up, once the electrical sources was switched on. Over the plate was a viewing
lens, through which the sample was viewed as the temperature rises. As soon as the
sample melted or decomposed, the temperature was recorded from the inbuilt
thermometer connected to the apparatus.
Table 3.3 The determination of Job,s continuious variation method
S/N Metal (M) ligand (L) mole ratio (M:L)
0 0 mL 1.0 mL -
1 0.1 mL 0.9 mL 9.00
2 0.2 mL .08 mL 4.00
3 0.3 mL 0.7 mL 2.33
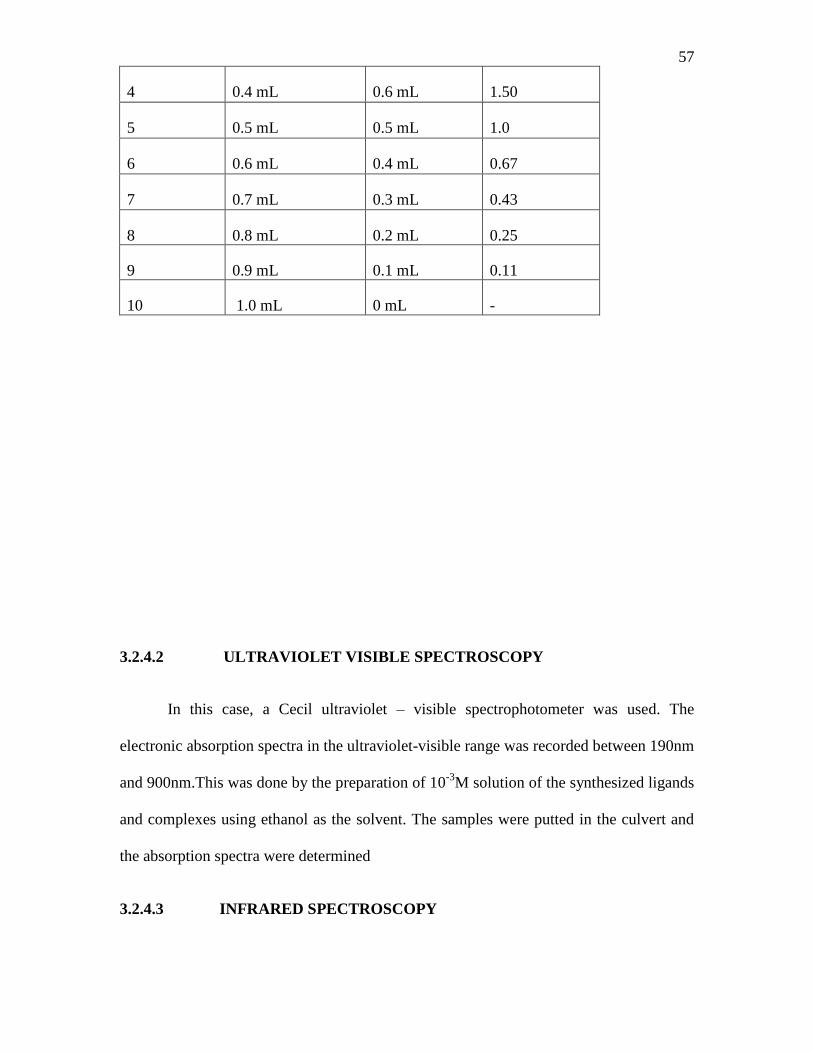
57
4 0.4 mL 0.6 mL 1.50
5 0.5 mL 0.5 mL 1.0
6 0.6 mL 0.4 mL 0.67
7 0.7 mL 0.3 mL 0.43
8 0.8 mL 0.2 mL 0.25
9 0.9 mL 0.1 mL 0.11
10 1.0 mL 0 mL -
3.2.4.2 ULTRAVIOLET VISIBLE SPECTROSCOPY
In this case, a Cecil ultraviolet – visible spectrophotometer was used. The
electronic absorption spectra in the ultraviolet-visible range was recorded between 190nm
and 900nm.This was done by the preparation of 10-3
M solution of the synthesized ligands
and complexes using ethanol as the solvent. The samples were putted in the culvert and
the absorption spectra were determined
3.2.4.3 INFRARED SPECTROSCOPY

58
Infrared spectra were recorded on a Matson Genesis II Fourier Transformed
infrared spectrophotometer using Nujol Mull. The important infrared bands such as
(N=N), (N-H), (OH), (C=C) stretches (both asymmetric and symmetric indicating
the formation of the ligands and their complexes were studied).
3.2.4.4 NUCLEAR MAGNETIC RESONANCE SPECTROSCOPY
Here a 200MHz Varian mercury nuclear magnetic resonance spectrophotometer
was used to record both the 1H and
13C NMR spectra. The proton (
1H) NMR spectra was
recorded as solution in DMSO while the machine was operating at 200MHz at 50.40C
and was referenced to the residual solvent peaks of CDCl3. CD3OD, and (CD3)CO. The
13C NMR spectra was recorded while the instrument was operating at 50Mz at 180
0C
and 92.90C and it was also referenced to the same residual solvent peaks used for the
proton NMR.
3.2.4.5 MOLAR CONDUCTIVITY
The 0.5g of complexes was dissolved in 5mL of methanol each. The molar conductivity
measurement was determined using Milwaukee Conductimeter type CD 600 series.
3.2.4.6 SOLUBILITY TEST
About 0.0lg of the each compound were added to 5cm3 portion of the solvent
(water methanol, ethanol, acetone, DMF, DMSO) with vigorous shaking after each

59
addition. If all the solute particles dissolved to give a homogeneous mixture the
compound was said to be very soluble (Vs) in the solution.
However, if part of the solute dissolved, the compound was considered slightly
soluble (ss) in the solvent. If the solute does not dissolve at all after adding the solvent
and shaking the solute is classified as insoluble (IS) in the solvent.
3.2.4.7 ANTIMICROBIAL ACTIVITY OF THE LIGANDS AND THEIR
COMPLEXES
The preliminary screening of the antimicrobial activity of the synthesized ligands
and their complexes in DMSO was examined by using a gar- well diffusion
method128,129.
.
20mg/ml each of ligands and complexes were constituted by dissolving 0.02g of
each in 1mL of DMSO. A single colony of each test bacteria was suspended in 2mL of
sterile nutrient broth. The suspension of each test bacteria was used to inoculate the
surface of the already prepared nutrient agar and the excess fluid drained into discard pot
containing disinfectant. Using a cork borer of 6mm in diameter, wells were bored in the
inoculated agar plates. With a micropipette, 50L of each test compound was delivered
into the well. The plates were left on the bench for 30mins to allow the extract to diffuse
into the agar. There after, the plates were incubated at 370C for 24 hours. After
incubation, the plates were observed for inhibition zones around the wells, the diameters
of the zones were measured with meter rule.
60
On the basis of preliminary test, the compound affecting significant zones of
inhibition were then selected and used for the minimum inhibitory concentration (MIC)
determination by double serial dilution of test compound.
Ampicilin was used as the reference standard. The bacteria which include
Escherichia coli, Pseudomonas aeruginosa, Staphylococcus aureus and Fungus Candidia
albicans were obtained from stock culture (clinical isolate) and were maintained
separately on solid medium containing agar. All the material used was sterilized.
CHAPTER FOUR
RESULTS AND DISCUSSION
4.1 PHYSICAL PROPERTIES
The physical properties of ligands and complexes are presented in Table 4.1
The molar conductance values of the complexes are present in Table 4.1. The value of
[Co(H2L)], complex was too low to be accounted for any dissociation, therefore it was
considered to be nonelectrolyte132
indicating coordination of anions. The molar

61
conductance values of [OsCl2(H2L)2(O)2],[CoLCl2(OH2)],[Fe2O(L)2Cl2],
[Fe2O(HL)2Cl2], and [Os(HL)2(O)2Cl2] reveal that they are essentially non-electrolytes.
This is because there was no dissociation of ions on all of them. Fe(H2L)2]+ and
[Co(HL)2(OH2)2 behaved as 2:1 electrolyte133
when compared with CuSO4 salt which
was used as the control .
The percentage yields of these compounds were calculated to be low for the entire
compound.
4.2 STOICHIOMETRY OF THE COMPLEXES.
The Job’s continuous variation curves for [Co(H2L)2]
,[OsCl2(H2L)2(O)2],[CoLCl2(OH2)],[Fe2O(L)2Cl2], [Co(HL)2(OH2)2]2+
, [Fe2(HL)2Cl2]
complexes, as presented in Figure 1- 9 . In all the graphs absorbencies were plotted
against ligand to metal mole ratios. The intercept was traced down to determine the
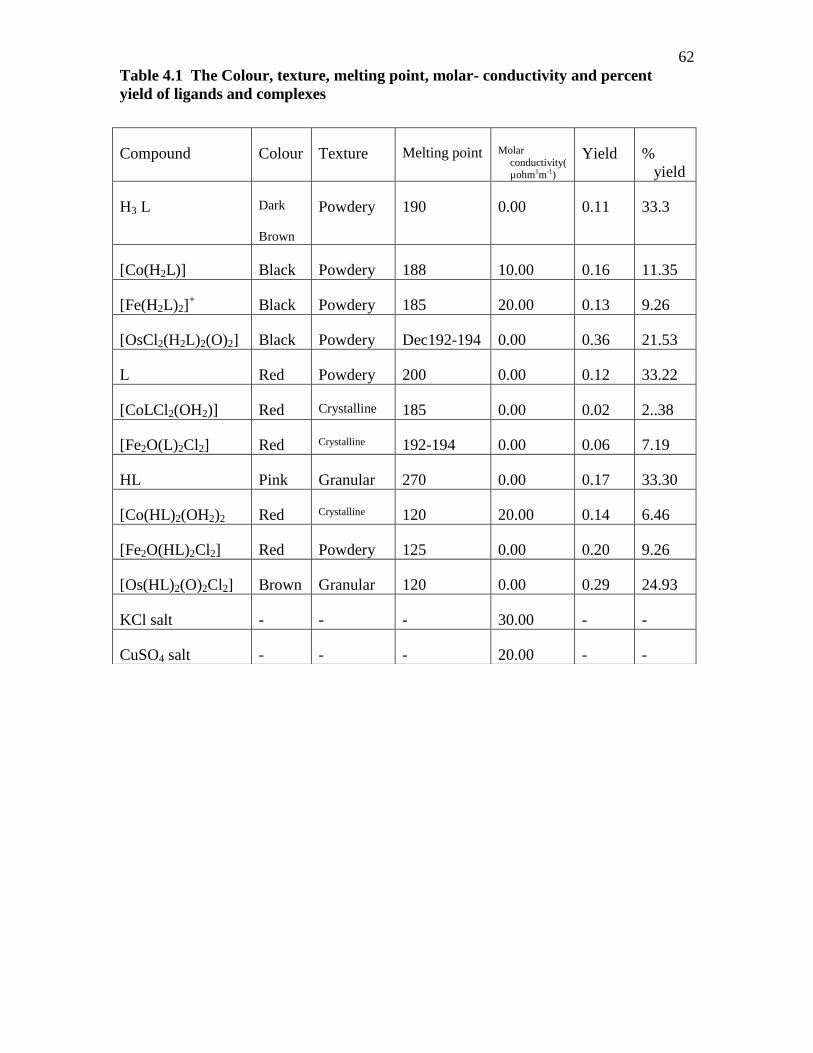
62
Table 4.1 The Colour, texture, melting point, molar- conductivity and percent
yield of ligands and complexes
Compound Colour Texture Melting point Molar
conductivity(µohm1m-1)
Yield %
yield
H3 L Dark
Brown
Powdery 190 0.00 0.11 33.3
[Co(H2L)] Black Powdery 188 10.00 0.16 11.35
[Fe(H2L)2]+ Black Powdery 185 20.00 0.13 9.26
[OsCl2(H2L)2(O)2] Black Powdery Dec192-194 0.00 0.36 21.53
L Red Powdery 200 0.00 0.12 33.22
[CoLCl2(OH2)] Red Crystalline 185 0.00 0.02 2..38
[Fe2O(L)2Cl2] Red Crystalline 192-194 0.00 0.06 7.19
HL Pink Granular 270 0.00 0.17 33.30
[Co(HL)2(OH2)2 Red Crystalline 120 20.00 0.14 6.46
[Fe2O(HL)2Cl2] Red Powdery 125 0.00 0.20 9.26
[Os(HL)2(O)2Cl2] Brown Granular 120 0.00 0.29 24.93
KCl salt - - - 30.00 - -
CuSO4 salt - - - 20.00 - -

63
ligand to metal mole ratio. Table 4.2 give an over view of each complexes’ ligands –
metal mole ratio as contained in the complex.
[Co(H2L)2] and [OsCl2(H2L)(O)2] complexes were observed to have the same ligand to
metal mole ratio of 2:1 while [Fe(H2L)2]+ could not be isolated using this method .
The [CoLCl2(OH2)] and [FeO(L)2Cl2] complexes show a 1:1 (ligand to metal)
stoichiometry.
[Co(HL)2(OH2)2]2+
and [Fe2O(HL)2Cl2] complexes have 2:1 ligand to metal mole ratio
stoichiometry respectively, while [Os(HL)2(O)2Cl2] Complex gave no determinate
results.
4.3 ELECTRONIC SPECTRAL PROPERTIES
[CoLCl2(OH2)]Cl2(OH2)] , [FeO(L)2Cl2] as obtained from methanol solutions are
presented in Table 4:3,4.4 and 4.5 .The various absorption bands for each ligand with its
complexes are grouped for better clarity.
The electronic spectral of H3L and its complexes in Table 4.3 with regards to
band position and intensity are similar to each other. The spectra of H3L shows strong
bands which are attributed to be mainly due to * transitions of the conjugated
bonds and n * transitions of the non-bonding electrons in the ligand.

64
In all the graphs, absorbencies were plotted against ligand to metal
mole ratio
Fig 4: Job’s curve for [Co(HL)2(OH2)2]
Fig 5 ; Job,scurve for [Os(HL)2(O)2Cl2]
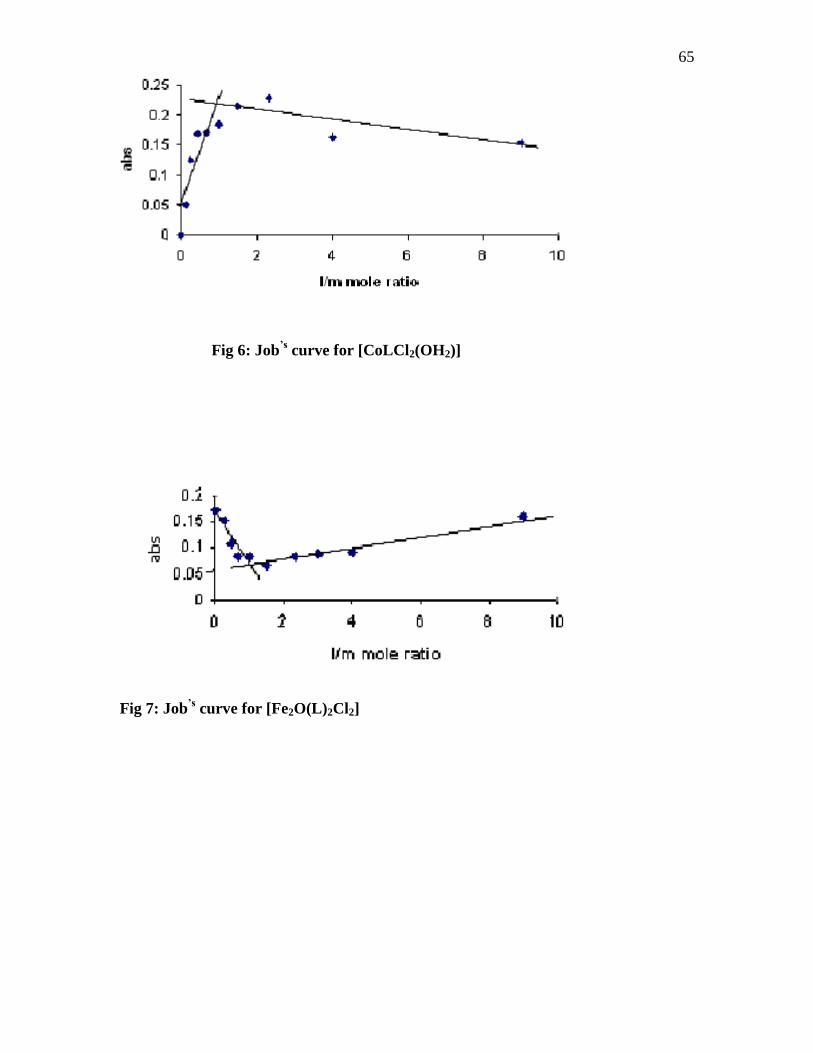
65
Fig 6: Job’s curve for [CoLCl2(OH2)]
Fig 7: Job’s curve for [Fe2O(L)2Cl2]
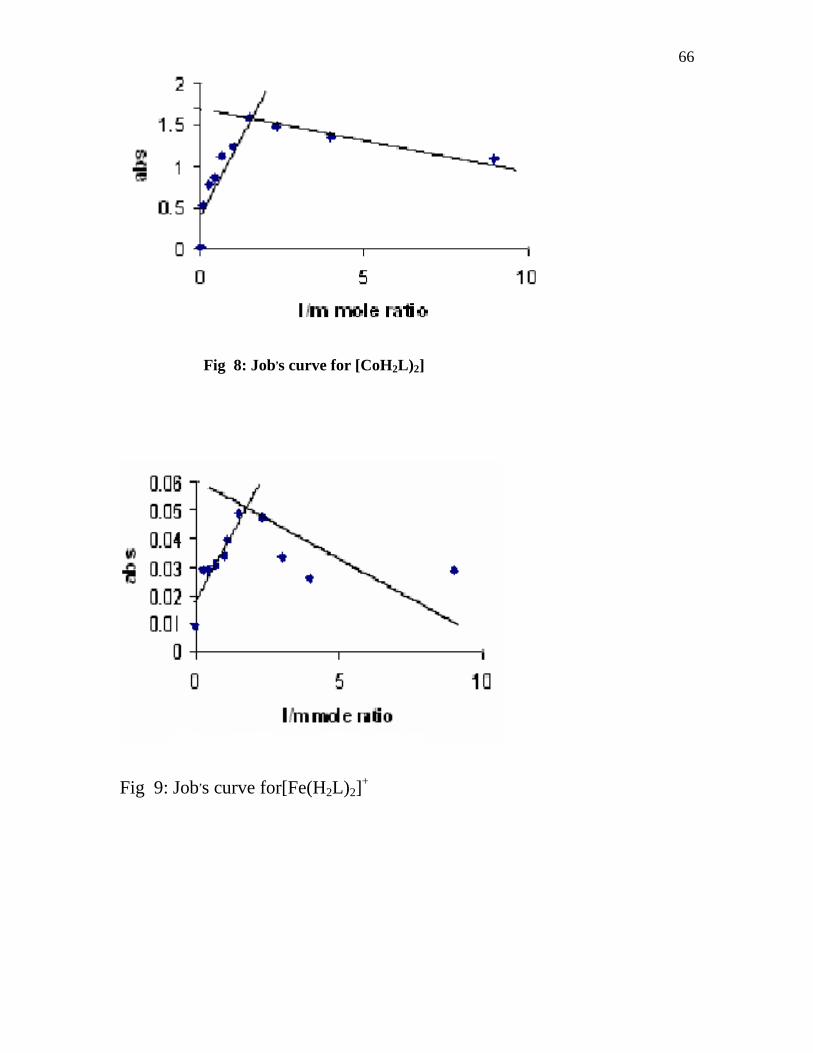
66
Fig 8: Job,s curve for [CoH2L)2]
Fig 9: Job,s curve for[Fe(H2L)2]
+

67
TABLE 4.2: STOICHIOMETRIC RESULTS OF ALL THE COMPLEXES
Complex ligand / metal mole ratio
[Co(H2L)2] 2L:M
[Fe(H2L)2]+ nd
[OsCl2(H2L)(O)2] 2L:M
[CoLCl2(OH2)] L:M
[FeO(L)2Cl2] L:M
[Co(HL)2(OH2)2]2+
2L:M
[Fe2O(HL)2Cl2] 2L:M
[Os(HL)2(O)2Cl2] nd
nd-not determined , M- metal, L –ligand
Table 4.3 The electronic spectra of H3 L, [Co(H2L)2], [Fe(H2L)2]+ and
[OsCl2(H2L)(O)2]
1
(cm-1
)
ε1
(Mol-1
cm-1)
2
(cm-1
)
ε2
(Mol1cm-1)
3
(cm -1
)
ε 3
(Mol-1 cm-1)
4
(cm- 1 )
ε4
(mol-1
cm-1
)
H3 L 47846 14372 40160 99215 35911 80784 26595 88740
[Co(H2L)2] 47845 18848 39370 15818 22321 14424
[Fe(H2L)2]+ 47846 18651 37735 11232
[OsCl2(H2L)(O)2] 48309 65062 39370 43812 26455 65312 23923 49062
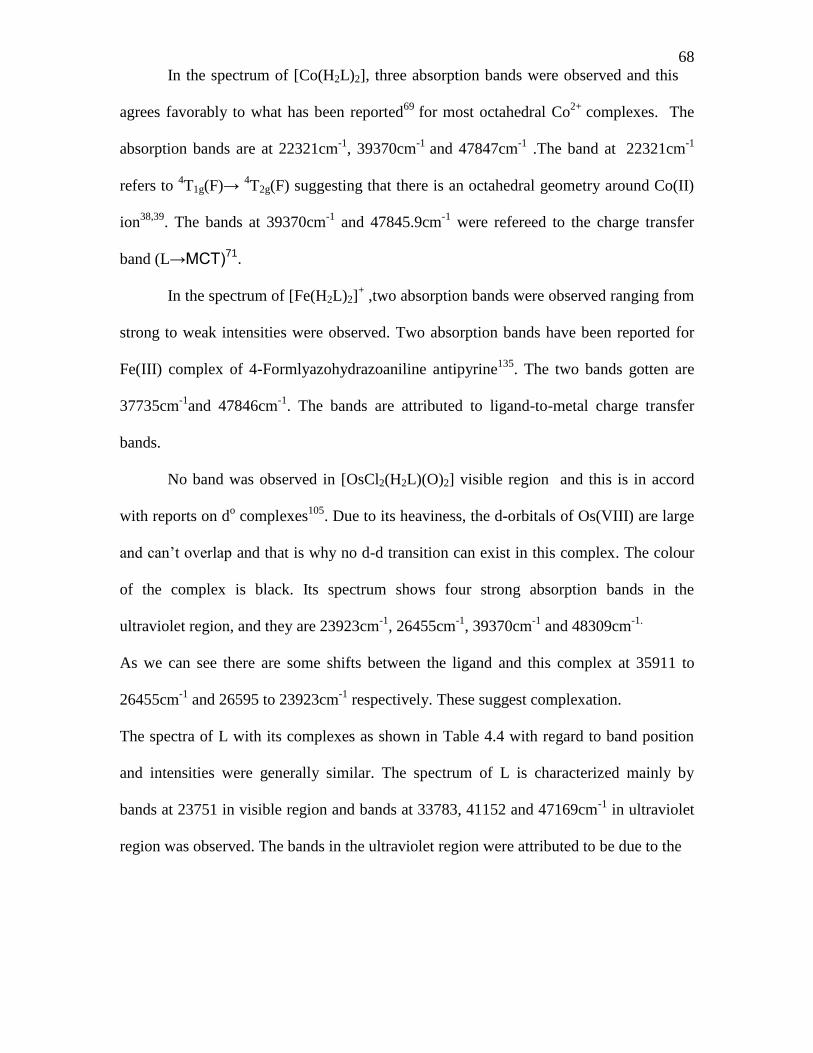
68
In the spectrum of [Co(H2L)2], three absorption bands were observed and this
agrees favorably to what has been reported69
for most octahedral Co2+
complexes. The
absorption bands are at 22321cm-1
, 39370cm-1
and 47847cm-1
.The band at 22321cm
-1
refers to 4T1g(F)→
4T2g(F) suggesting that there is an octahedral geometry around Co(II)
ion38,39
. The bands at 39370cm-1
and 47845.9cm-1
were refereed to the charge transfer
band (L→MCT)71.
In the spectrum of [Fe(H2L)2]+ ,two absorption bands were observed ranging from
strong to weak intensities were observed. Two absorption bands have been reported for
Fe(III) complex of 4-Formlyazohydrazoaniline antipyrine135
. The two bands gotten are
37735cm-1
and 47846cm-1
. The bands are attributed to ligand-to-metal charge transfer
bands.
No band was observed in [OsCl2(H2L)(O)2] visible region and this is in accord
with reports on do complexes
105. Due to its heaviness, the d-orbitals of Os(VIII) are large
and can’t overlap and that is why no d-d transition can exist in this complex. The colour
of the complex is black. Its spectrum shows four strong absorption bands in the
ultraviolet region, and they are 23923cm-1
, 26455cm-1
, 39370cm-1
and 48309cm-1.
As we can see there are some shifts between the ligand and this complex at 35911 to
26455cm-1
and 26595 to 23923cm-1
respectively. These suggest complexation.
The spectra of L with its complexes as shown in Table 4.4 with regard to band position
and intensities were generally similar. The spectrum of L is characterized mainly by
bands at 23751 in visible region and bands at 33783, 41152 and 47169cm-1
in ultraviolet
region was observed. The bands in the ultraviolet region were attributed to be due to the
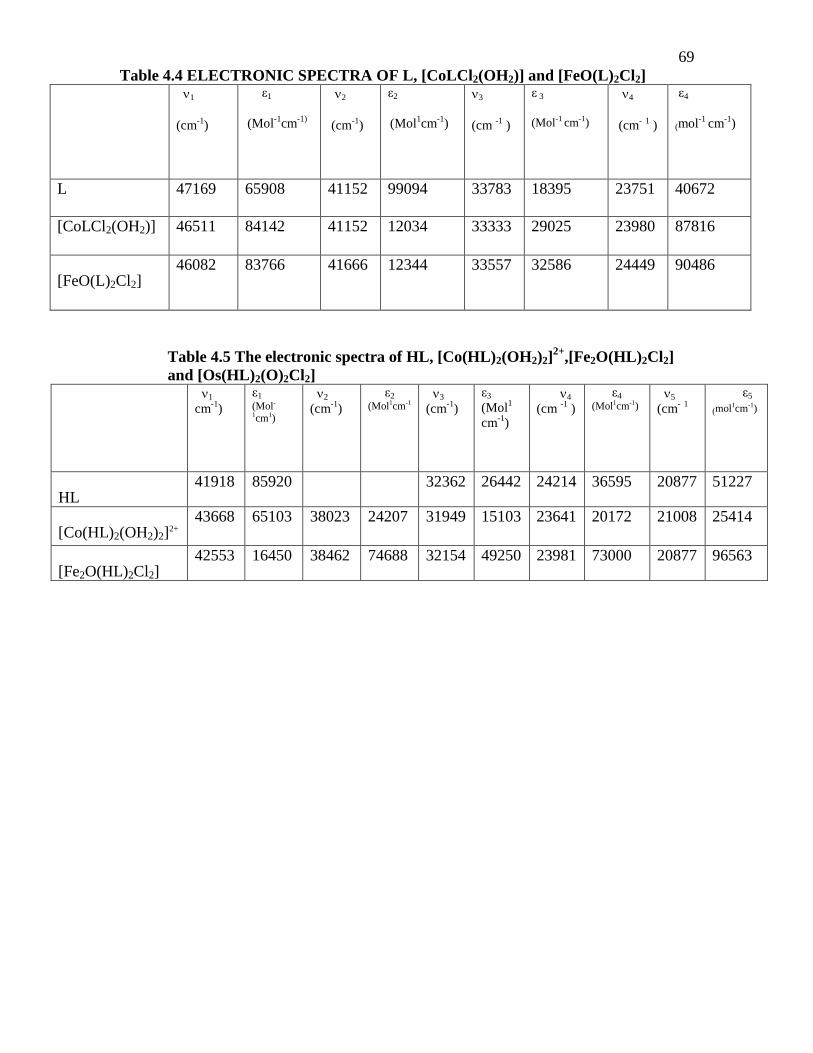
69
Table 4.4 ELECTRONIC SPECTRA OF L, [CoLCl2(OH2)] and [FeO(L)2Cl2] 1
(cm-1
)
ε1
(Mol-1
cm-1)
2
(cm-1
)
ε2
(Mol1cm
-1)
3
(cm -1
)
ε 3
(Mol-1 cm-1)
4
(cm- 1 )
ε4
(mol-1
cm-1
)
L 47169 65908 41152 99094 33783 18395 23751 40672
[CoLCl2(OH2)] 46511 84142 41152 12034 33333 29025 23980 87816
[FeO(L)2Cl2] 46082 83766 41666 12344 33557 32586 24449 90486
Table 4.5 The electronic spectra of HL, [Co(HL)2(OH2)2]2+
,[Fe2O(HL)2Cl2]
and [Os(HL)2(O)2Cl2]
1
cm-1
)
ε1 (Mol-
1cm1)
2
(cm-1
)
ε2
(Mol1cm-1 3
(cm-1
)
ε3
(Mol1
cm-1
)
4
(cm -1
)
ε4
(Mol1cm-1) 5
(cm- 1
ε5
(mol1cm-1)
HL 41918 85920 32362 26442 24214 36595 20877 51227
[Co(HL)2(OH2)2]2+
43668 65103 38023 24207 31949 15103 23641 20172 21008 25414
[Fe2O(HL)2Cl2] 42553 16450 38462 74688 32154 49250 23981 73000 20877 96563
70
*
transition which is orbitally allowed resulting as a result of conjugation in the
ligand whereas the other bands were most likely due to n - * transition.
The spectrum of [Fe2O(L)2Cl2] was characterized by a total of four absorption
bands ranging from strong to shoulder intensities. The absorption bands are at 24449cm-1
,
33557cm-1
, 41666cm-1
, and 46082cm-1
.The band at 24449cm-1
was attributed to
6A1g→
5T2g(G) transition in octahedral geometry of the complex
71. The bands at 33557cm
-
1, 41666cm
-1, and 46082cm
-1 were mainly attributed to metal to ligand charge transfer or
vice versa existing in this complex. In considering tentatively the Job’s stoichiometric
result, this absorption band was in agreement with a d5 octahedral complexes
71, . In the
literature, four transitions have been reported for Fe(III) complex of azopyrazolone.
Fe(III) complex of (4-azo)-3-methyl-1-phenyl-5-thioxo-1,5-dihydro-4H-pyrazol-4-one
quinolin-8-ylhydrazone have been reported to have a pentacoordinated trigonal
bipyramidal structure71
. The same structural effect has been reported for azomethine
analogues69,134,55,56,,57.
.
The pale red colour of [Fe2O(L)2Cl2] can give an insight into the octahedral
geometry case with some d5 complexes of Fe(III).
A spectrum of [CoLCl2(OH2)] shows four absorption bands ranging between strong and
broad intensity . Its absorption peaks centered at 23980cm-1
, 33333cm-1
, 41152cm-1
and
46511cm-1
can be attributed to be due to charge transfer. Basically, literatures have
shown that for any geometry of cobalt (II) complexes, three absorption bands should be
expected124
but in this case four absorptions peaks were observed. Based on job’s
stoichiometric result and spectral results, this complex is likely to be octahedral in
geometry. There for, its absorption peak at 23980cm-1
was related to one of the multiple
absorption bands comprising three overlapping peaks at about 21600cm-1
. This band was

71
attributed either to spin orbit coupling effect or to transitions to doublet states. From the
spectrum, no transition was attributed to the 46511cm-1
value. It could be attributed to
high intensity. It also could be probably be due to overlapping by a charge transfer band69
in the ultraviolet region.
Considering the electronic spectra of HL with that of its complexes (Table 4.5)
with regards to band position and intensity, their spectra show much similarity. The
observed absorption bands for HL spectrum at 20877cm-1
, 24214cm-1
and 32362cm-1
,
41918cm-1
were attributed to be due to * transitions of the conjugated bonds and n
* transitions of the non-bonding electrons in the ligand .
In the spectrum of [Co(HL)2(OH2)2]2+
, five absorption bands were observed. The
bands are at 21000cm-1
,23641cm-1
,31949cm-1
,38022cm-1
and 43668cm-1
. These bands can
be attributed to be due to charge transfer69
. Based on job’s continuous variation result and
some spectral data, [Co(HL)2(OH2)2]2+
is said to be an octahedral complex. A shift from
20877cm-1
of HL to 23641cm-1
in [Co(HL)2(OH2)2]2+
, showing evidence of
complexation was observed in the ligand’s spectrum in relation to the complex’s
spectrum.
Five absorption bands were observed in the spectrum of [Fe2O(HL)2Cl2]. The
bands are at 20877cm-1
,23981cm-1
32154cm-1
38462cm-1
and 42553cm-1
.The bands at
20877cm-1
and 23981cm-1
were attributed to 6A1g→
5T2g(G) transition in pseudo
octahedral geometry69
of the complex73
. The bands at 32154cm-1
38462cm-1
and
42553cm-1
were mainly attributed to metal to ligand charge transfer or vice versa existing
in this complex. A shift from 20877of ligand to 23981 of complex showing evidence of
complexation was observed in the relation electronic spectrum of the complex.
72
[Os(HL)2(O)2Cl2] reveals also five absorption bands all in the ultraviolet region .
Since this complex is a d0 complex, then there are no d electrons for transition. The dark
brown colour of this complex gives an in sight that its transition is largely due to metal to
ligand charge transfer or vice versa. Its spectrum shows strong bands at 20877cm-1,
20877cm-1
, 23566cm-1
32154cm-1
, 38760cm-1
and 42373cm-1
. It was observed that there
is a small shift from 24214, 41918cm-1
of HL to 23866, 42373cm-1
of [Os(HL)2(O)2Cl2]
respectively.
4.4 INFRARED SPECTRAL PROPERTIES
The characteristic frequencies of the various ligands and complexes and their
assignments are listed in Table 4.6, 4.7 and 4.8 respectively.
The infrared spectra of the ligand and its complexes were recorded in the range
400- 4000cm-1
. The selected vibration peaks shown in Table 4.4 give the relevant
functional groups of the ligand. The bond formed between the ligand and metal ions are
elucidated by comparing the spectra of the ligand and their corresponding metal
complexes.
The vibration peak with broad intensity at 3420.90cm-1
was assigned to (OH)
stretching vibration. The other relatively medium and shoulder peaks observed at
2925.73cm-1
and 2854.83cm-1
have been attributed to (CH3) and (N-CH3) stretching
respectively. The bands at 1734.47cm-1
and 1645.10cm-1
attributed to (C=0) stretching
vibration. The weak peaks at 1565cm-1
and 1556cm-1
was assigned to (N=N) stretching
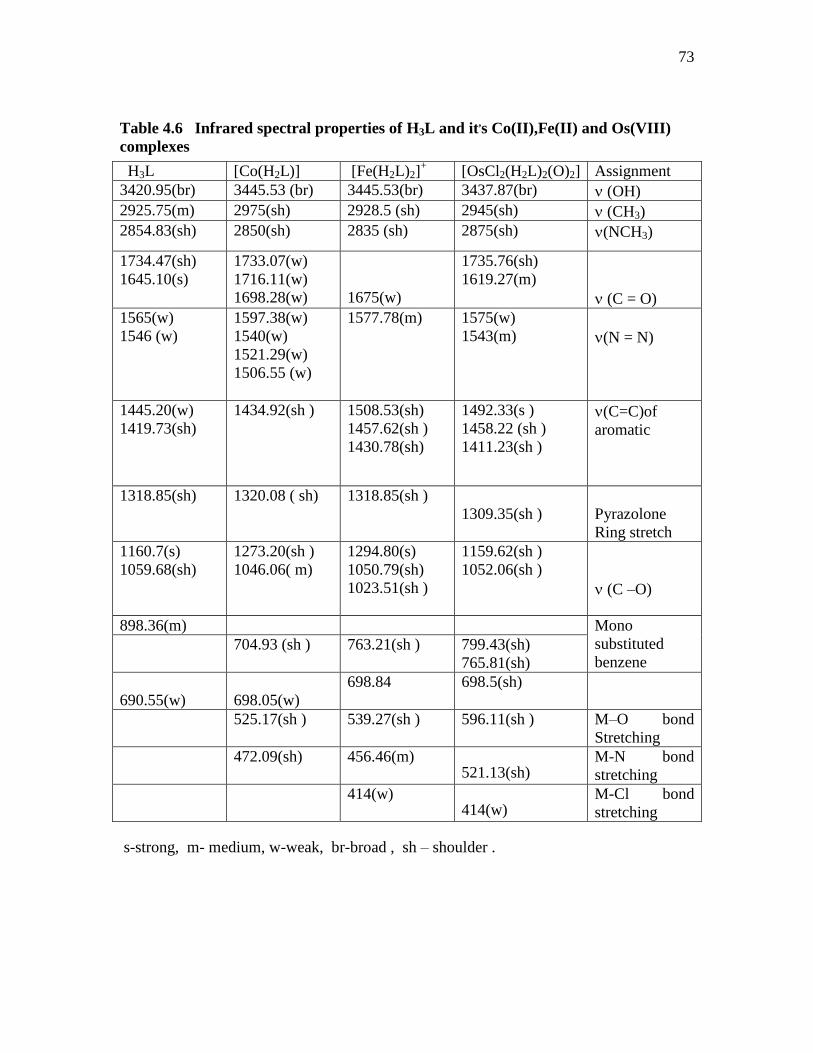
73
Table 4.6 Infrared spectral properties of H3L and it,s Co(II),Fe(II) and Os(VIII)
complexes
s-strong, m- medium, w-weak, br-broad , sh – shoulder .
H3L [Co(H2L)] [Fe(H2L)2]+ [OsCl2(H2L)2(O)2] Assignment
3420.95(br) 3445.53 (br) 3445.53(br) 3437.87(br) (OH)
2925.75(m) 2975(sh) 2928.5 (sh) 2945(sh) (CH3)
2854.83(sh) 2850(sh) 2835 (sh) 2875(sh) (NCH3)
1734.47(sh)
1645.10(s)
1733.07(w)
1716.11(w)
1698.28(w)
1675(w)
1735.76(sh)
1619.27(m)
(C = O)
1565(w)
1546 (w)
1597.38(w)
1540(w)
1521.29(w)
1506.55 (w)
1577.78(m) 1575(w)
1543(m)
(N = N)
1445.20(w)
1419.73(sh)
1434.92(sh )
1508.53(sh)
1457.62(sh )
1430.78(sh)
1492.33(s )
1458.22 (sh )
1411.23(sh )
(C=C)of
aromatic
1318.85(sh)
1320.08 ( sh)
1318.85(sh )
1309.35(sh )
Pyrazolone
Ring stretch
1160.7(s)
1059.68(sh)
1273.20(sh )
1046.06( m)
1294.80(s)
1050.79(sh)
1023.51(sh )
1159.62(sh )
1052.06(sh )
(C –O)
898.36(m) Mono
substituted
benzene
704.93 (sh )
763.21(sh )
799.43(sh)
765.81(sh)
690.55(w)
698.05(w)
698.84 698.5(sh)
525.17(sh )
539.27(sh )
596.11(sh )
M–O bond
Stretching
472.09(sh) 456.46(m) 521.13(sh)
M-N bond
stretching
414(w) 414(w)
M-Cl bond
stretching
74
vibration while the peak at 1445.20,cm-1
and 1419cm-1
was assigned to (C=C) stretching
vibration12
.
The vibrational peak at 1318.85cm-1
was then attributed to pyrazolone ring stretch. The
peaks at 1160.70cm-1
and 1059.68cm-1
were assigned to (C-O) vibrational stretch72
. The
peaks at 898.36cm-1
and 690.55w were due to mono substituted benzenes and benzene’s
breathing respectively.
In the spectrum of [Co(H2L)] a broad absorption peak center at 3445.53cm-1
from
its spectrum is due to (OH). The peak shifted from 3420.9cm-1
of the ligand to
3445.53cm-1
of the complex. This suggests that part at the hydroxyl group was involved
in bonding69
.
The peaks with weak intensity at 1733.07cm-1
, 1716.11cm-1
and 1698.28cm-1
were assigned to carbonyl stretching. The values are less than that obtained for the ligand
suggesting the participation of the carbonyl in the coordination with the metal ion. At
1597.38 and 1540cm-, peaks assigned to azo group (N=N) was also observed. There is
also an increase from that of its ligand which also suggested that the azo (N=N) was also
involved in coordination with the metal ion72,73
. The peaks at 1273.20 and 1046.06cm-1
reveal a shift from values listed for the ligand which also indicate that C-O group was
involved in bonding with metal ion69
.
The spectra of [Co(H2L)] was observed to show some shift for the absorption
peak for the (OH) stretching. This indicates that coordination occurred by involving some
of the hydroxyl groups in bonding with Co (II) ion.
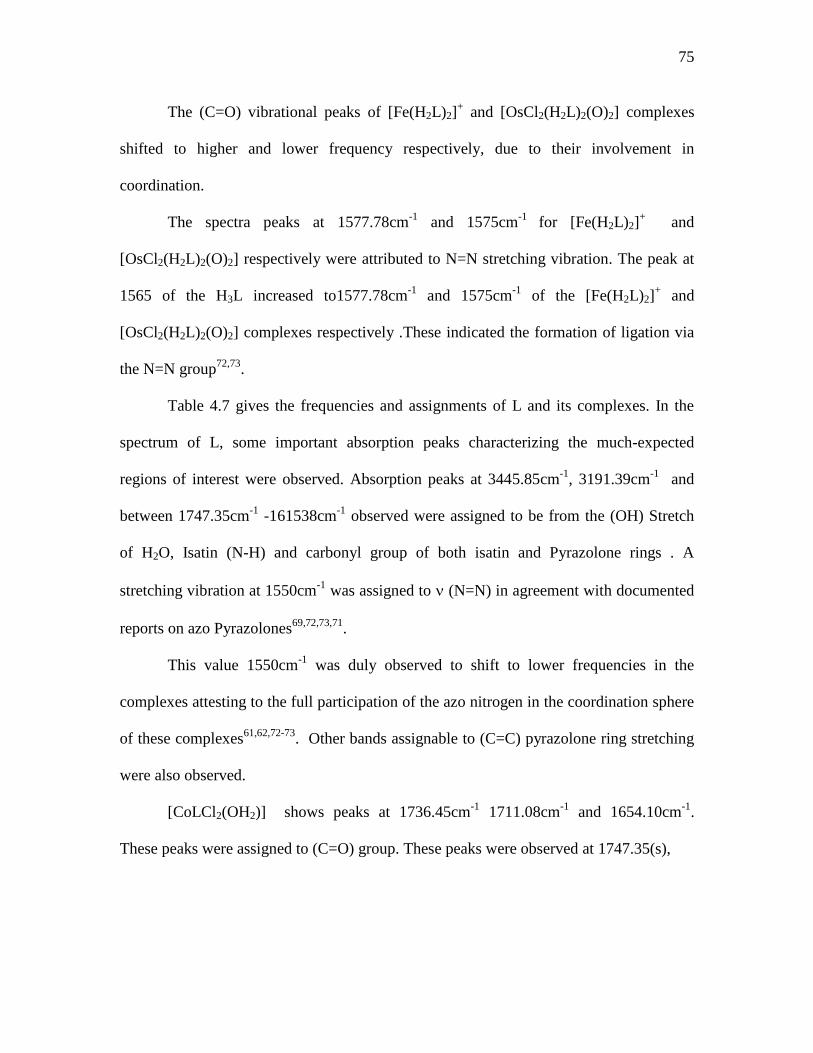
75
The (C=O) vibrational peaks of [Fe(H2L)2]+ and [OsCl2(H2L)2(O)2] complexes
shifted to higher and lower frequency respectively, due to their involvement in
coordination.
The spectra peaks at 1577.78cm-1
and 1575cm-1
for [Fe(H2L)2]+ and
[OsCl2(H2L)2(O)2] respectively were attributed to N=N stretching vibration. The peak at
1565 of the H3L increased to1577.78cm-1
and 1575cm-1
of the [Fe(H2L)2]+ and
[OsCl2(H2L)2(O)2] complexes respectively .These indicated the formation of ligation via
the N=N group72,73
.
Table 4.7 gives the frequencies and assignments of L and its complexes. In the
spectrum of L, some important absorption peaks characterizing the much-expected
regions of interest were observed. Absorption peaks at 3445.85cm-1
, 3191.39cm-1
and
between 1747.35cm-1
-161538cm-1
observed were assigned to be from the (OH) Stretch
of H2O, Isatin (N-H) and carbonyl group of both isatin and Pyrazolone rings . A
stretching vibration at 1550cm-1
was assigned to (N=N) in agreement with documented
reports on azo Pyrazolones69,72,73,71
.
This value 1550cm-1
was duly observed to shift to lower frequencies in the
complexes attesting to the full participation of the azo nitrogen in the coordination sphere
of these complexes61,62,72-73
. Other bands assignable to (C=C) pyrazolone ring stretching
were also observed.
[CoLCl2(OH2)] shows peaks at 1736.45cm-1
1711.08cm-1
and 1654.10cm-1
.
These peaks were assigned to (C=O) group. These peaks were observed at 1747.35(s),
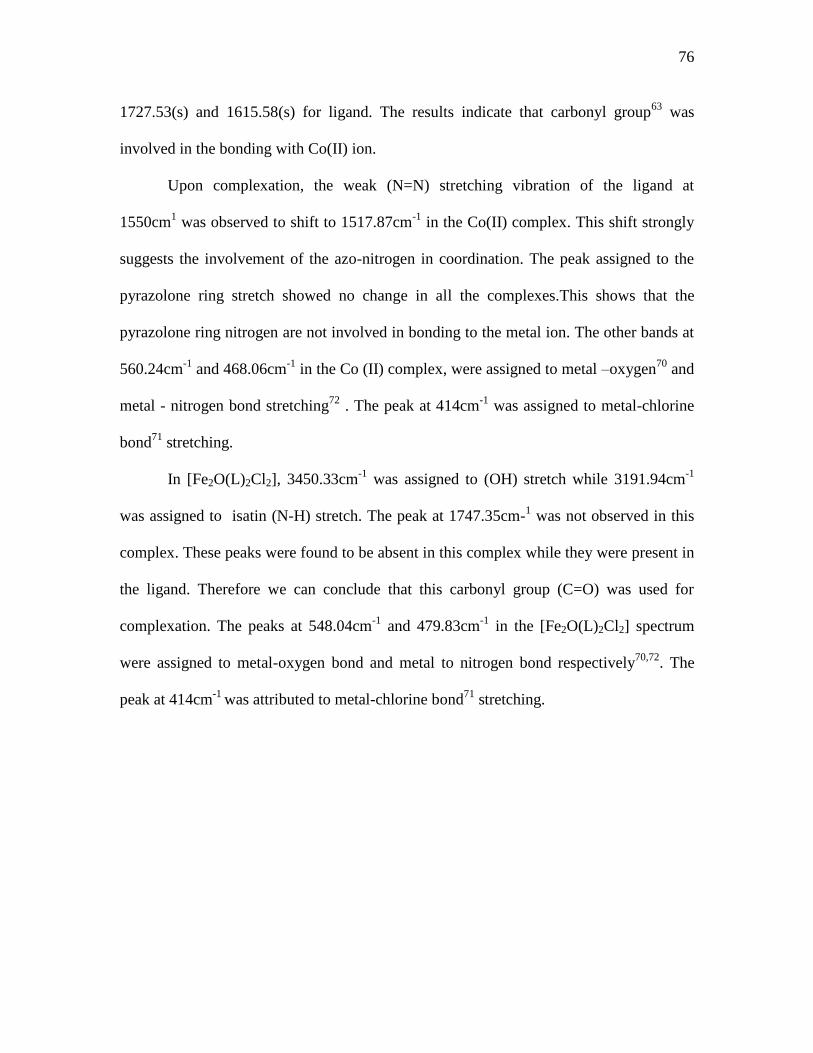
76
1727.53(s) and 1615.58(s) for ligand. The results indicate that carbonyl group63
was
involved in the bonding with Co(II) ion.
Upon complexation, the weak (N=N) stretching vibration of the ligand at
1550cm1 was observed to shift to 1517.87cm
-1 in the Co(II) complex. This shift strongly
suggests the involvement of the azo-nitrogen in coordination. The peak assigned to the
pyrazolone ring stretch showed no change in all the complexes.This shows that the
pyrazolone ring nitrogen are not involved in bonding to the metal ion. The other bands at
560.24cm-1
and 468.06cm-1
in the Co (II) complex, were assigned to metal –oxygen70
and
metal - nitrogen bond stretching72
. The peak at 414cm-1
was assigned to metal-chlorine
bond71
stretching.
In [Fe2O(L)2Cl2], 3450.33cm-1
was assigned to (OH) stretch while 3191.94cm-1
was assigned to isatin (N-H) stretch. The peak at 1747.35cm-1 was not observed in this
complex. These peaks were found to be absent in this complex while they were present in
the ligand. Therefore we can conclude that this carbonyl group (C=O) was used for
complexation. The peaks at 548.04cm-1
and 479.83cm-1
in the [Fe2O(L)2Cl2] spectrum
were assigned to metal-oxygen bond and metal to nitrogen bond respectively70,72
. The
peak at 414cm-1
was attributed to metal-chlorine bond71
stretching.

77
Table 4.7. The Infrared Absorption Frequencies (cm-1
) of (L) and its complexes.
L [CoLCl2(OH2)] [Fe2O(L)2Cl2] Assignment
3445.85 (sh) 3412.18(br) 3450.33 (sh) (OH)
3191.39 (m) 3191.94 (m) (N-H) of isatine
(C-CH3)
(N-CH3)
(C=O)
(N=N)
(C-C)
2916(sh)
2832.8(sh)
2925.05(sh)
2834 (sh)
2916 (sh)
2814.17 (sh)
1747.35(S)
1727.53(s)
1615.58(s)
1736.45(sh)
1711.08(sh)
1654.10(m)
1727.25 (s)
1615.63 (s)
1550(w) 1517.87(w) -
1483.09(sh)
1460.51(s)
1401.881(sh)
1457.4(sh)
1483.01(sh)
1460.66(s)
1402.01(sh)
1331.56(s) 1337.06(sh)
1318.13(sh)
1331.68(s) ()Pyrazolone ring
1289.49 (sh)
1201.18 (m)
1189.16(sh)
1112.05(sh)
1095.18(m)
1243.00(sh)
1159.03(sh)
1059.84(m)
1289.70(sh)
1269.48(sh)
1244.53(sh)
1201.43(m)
1112.13(w)
1095.35(m)
(C-O)
945.69(m) 945.87(m)
885.31(sh)
816.96(sh)
885.52(sh)
816.86(sh)
Substituted Benzene
771.13(m)
735.81(m)
661.26(sh)
637.06(sh)`
661.46(m)
637.44(sh)
ring breathing
560..24(sh) 548.04(w)
538.13(w)
M–O bond stretching
468.06(sh) 479.82(sh)
M-N bond stretching
414(w) 414 (w) M-Cl bond strerch
s-strong, m = medium, w=weak, br = broad.
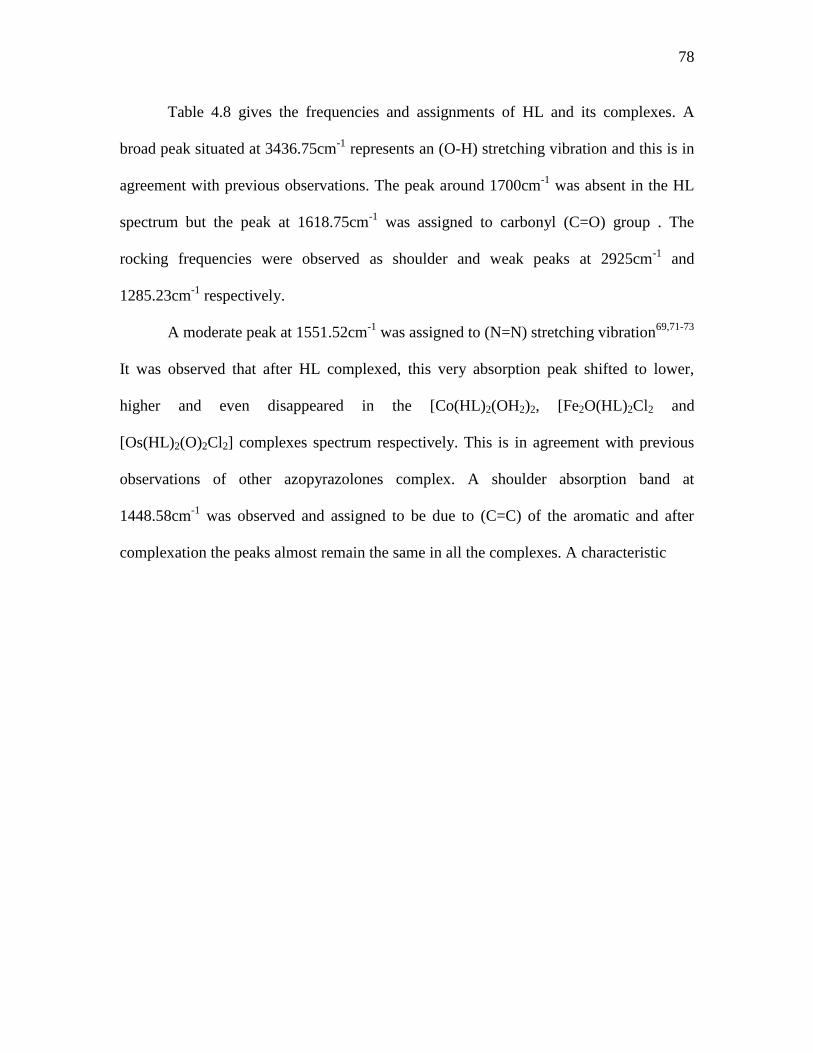
78
Table 4.8 gives the frequencies and assignments of HL and its complexes. A
broad peak situated at 3436.75cm-1
represents an (O-H) stretching vibration and this is in
agreement with previous observations. The peak around 1700cm-1
was absent in the HL
spectrum but the peak at 1618.75cm-1
was assigned to carbonyl (C=O) group . The
rocking frequencies were observed as shoulder and weak peaks at 2925cm-1
and
1285.23cm-1
respectively.
A moderate peak at 1551.52cm-1
was assigned to (N=N) stretching vibration69,71-73
It was observed that after HL complexed, this very absorption peak shifted to lower,
higher and even disappeared in the [Co(HL)2(OH2)2, [Fe2O(HL)2Cl2 and
[Os(HL)2(O)2Cl2] complexes spectrum respectively. This is in agreement with previous
observations of other azopyrazolones complex. A shoulder absorption band at
1448.58cm-1
was observed and assigned to be due to (C=C) of the aromatic and after
complexation the peaks almost remain the same in all the complexes. A characteristic

79
Table 4.8 The infrared spectra assignments of HL and its complexes.
HL [Co(HL)2(OH2)2] [Fe2O(HL)2Cl2] [Os(HL)2(O)2Cl2] Assignment
3436.75(br) 3437.97(br) 3446.04(br) 3444.10(br) (OH )
2125 (sh) 2925.40(m) 2930(sh) 2925(sh) (C-CH2)
2854.23(w) 2854.23(sh) 2855(sh) 2850(sh) (N-CH3)
- 1738.88(sh) - 1765(sh)
( C = O ) 1618.75(s) 1634.63(m) 1618.18(s) 1621.53(m)
1551.52(m) 1515.98(sh) 1557.88(sh) ( N=N )
1503.07(sh) 1504.61(s) 1504.73(sh)
1448.32(sh) 1455.99(w) 1448.54(m) 1449.99(sh) ( C = C )
of aromatic
1388.45(sh) 1385(sh) 1397.46(sh) 1388.80(sh) Pyrazolone
ring stretch
1208.98(w) 1246.26(sh) 1255.33(sh) 1256.96(sh)
1210.49(sh)
( C-O) 1145.46(s) 1161.41(sh) 1144.95(s) 1146.04(sh)
1072.12(sh) 1064.80(sh) 1035(sh) 1035(sh
984(sh
902.88(sh)
950(sh) 984.65(sh
901.55(sh)
Substituted
benzenes 871.74(sh)
839.78(mn
839.47(s)
830(sh)
780.74(w)
748.2(sh)
775(w)
751.70(s)
752.61(sh
682.7(sh)
695(sh)
607.97sh
682.76(m) Ring
breathing
541.41(sh) 510(sh) (M-O)
stretch
494.75(s) 490(sh) (M-N)
stretch
414(w) 428(w) 414(w) (M-Cl)
stretch
S= Strong, M- medium, w- Weaker, br-Broad .

80
peak assignable to aromatic pyrazolone ring stretch was observed around 1448.32cm-1
.The (C-O) stretching vibration was observed between 1388.45cm-1
to 1072.12cm1 peaks.
In the spectra of the complexes some of the peaks observed for (C-O) stretch in
the ligand shifted to lower frequencies in both complexes, showing an involvement of
C-O in the complexation.
4.5 1H PROTON AND
13C NMR SPECTRA OF THE SYNTHESIZED
COMPOUNDS
1H and
13C NMR of H3L, L and HL.
The 1H and
13C NMR for these ligands were obtained as solutions at approximately 4000
and 400 MH3 respectively using tetramethylsilane (TMS) as reference. The peaks and
their assignments are as shown in Table 4.9 to .4.14
The proton nuclear magnetic resonance spectrum results for H3L are shown in
Table 4.9. The peak at 2.42ppm (3H,s) indicates the C- CH3 methyl protons of the
pyrazolone ring. 3.22ppm (3H,s) shows the N-CH3 Protons of the pyrazolone ring. The
peak at 6.41-7.02(ppm) were assigned to (1H,d) of the phenyl group138,139
. The five
phenol protons was seen at (7.42) ppm (5H,m).
The 13
C NMR spectral data in Table 4.10 gave some signal at 120.804,
130.015ppm, 128.740ppm and 143.525ppm of the phenyl group of pyrazolone ring
respectively. The peak a 108.133pp is attributed to methyl group of pyrazolone. Similar
observation has been reported138
elsewhere .The peak at 159.065ppm indicates the
presence of carbonyl carbon139
at C8. The peaks at 134.597ppm, 133.565ppm and

81
Table 4.9: Proton (1H) and spectra of H3L [ in ppm from TMS, CDCl3 + CD3OD].
Peaks ( ) Assignment.
2.42 (3H,s)
C- CH3 methyl protons from pyrazolone
ring
3.22 (3H,s)
N- CH3 methyl protons from pyrazolone
ring
6.41 (1H, d)
H-C = C-H proton of phenyl group
7.02 (1H, d) H-C = C-H proton of phenyl group.
7.42(5H, m) Phenyl protons.
s-singlet, d- doublet, m-multiplet.
Table 4.10 13
C NMR ASSIGNMENT FOR H3L
Position of carbon 13
C NMR Value structure showing carbon numbering
C1 120.805 ppm
NCH3
CH3
3
OH
OH
OH
N =N
ON
1
2
4
67
8
9
10
11
13
1
4
5
12
1
2
C2 130.015 ppm
C3 128.740 ppm
C4 133.391 ppm
C5 108.233 ppm
C6 134.597 ppm
C7 143.428 ppm
C8 159.065 ppm
C9 149.278ppm
C10 147.525ppm
C11 143.525ppm
C12 1133.365ppm
C13 119.621ppm
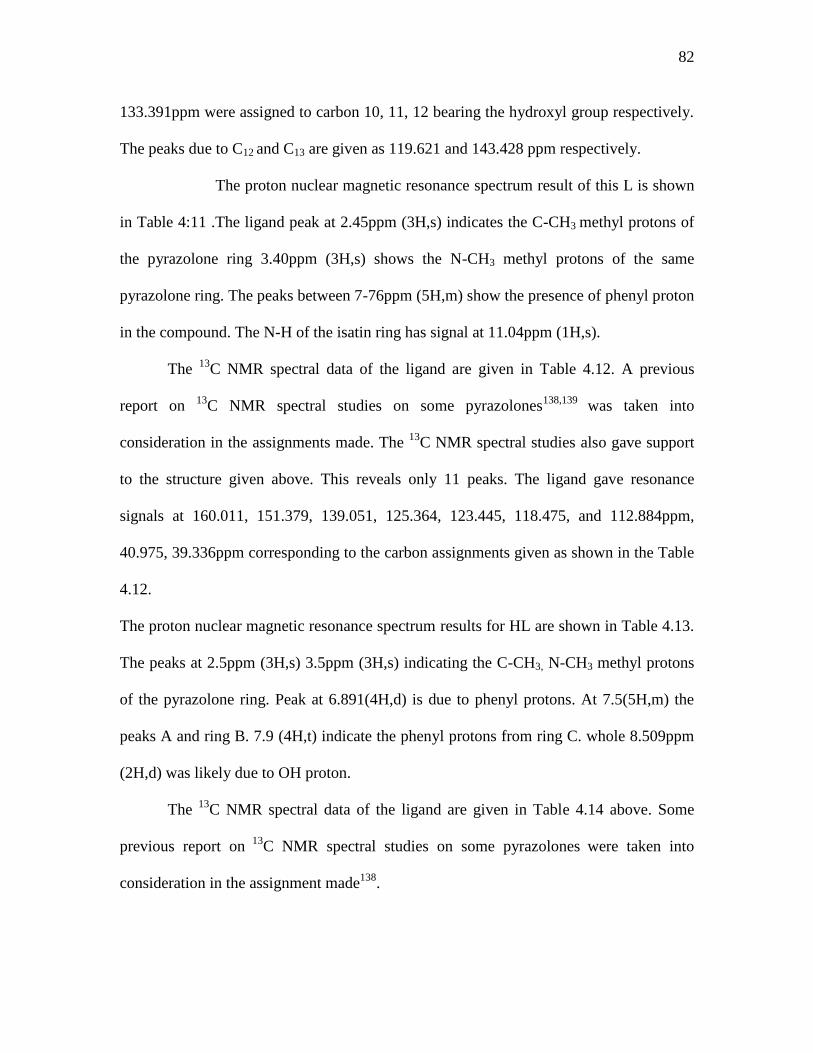
82
133.391ppm were assigned to carbon 10, 11, 12 bearing the hydroxyl group respectively.
The peaks due to C12 and C13 are given as 119.621 and 143.428 ppm respectively.
The proton nuclear magnetic resonance spectrum result of this L is shown
in Table 4:11 .The ligand peak at 2.45ppm (3H,s) indicates the C-CH3 methyl protons of
the pyrazolone ring 3.40ppm (3H,s) shows the N-CH3 methyl protons of the same
pyrazolone ring. The peaks between 7-76ppm (5H,m) show the presence of phenyl proton
in the compound. The N-H of the isatin ring has signal at 11.04ppm (1H,s).
The 13
C NMR spectral data of the ligand are given in Table 4.12. A previous
report on 13
C NMR spectral studies on some pyrazolones138,139
was taken into
consideration in the assignments made. The 13
C NMR spectral studies also gave support
to the structure given above. This reveals only 11 peaks. The ligand gave resonance
signals at 160.011, 151.379, 139.051, 125.364, 123.445, 118.475, and 112.884ppm,
40.975, 39.336ppm corresponding to the carbon assignments given as shown in the Table
4.12.
The proton nuclear magnetic resonance spectrum results for HL are shown in Table 4.13.
The peaks at 2.5ppm (3H,s) 3.5ppm (3H,s) indicating the C-CH3, N-CH3 methyl protons
of the pyrazolone ring. Peak at 6.891(4H,d) is due to phenyl protons. At 7.5(5H,m) the
peaks A and ring B. 7.9 (4H,t) indicate the phenyl protons from ring C. whole 8.509ppm
(2H,d) was likely due to OH proton.
The 13
C NMR spectral data of the ligand are given in Table 4.14 above. Some
previous report on 13
C NMR spectral studies on some pyrazolones were taken into
consideration in the assignment made138
.
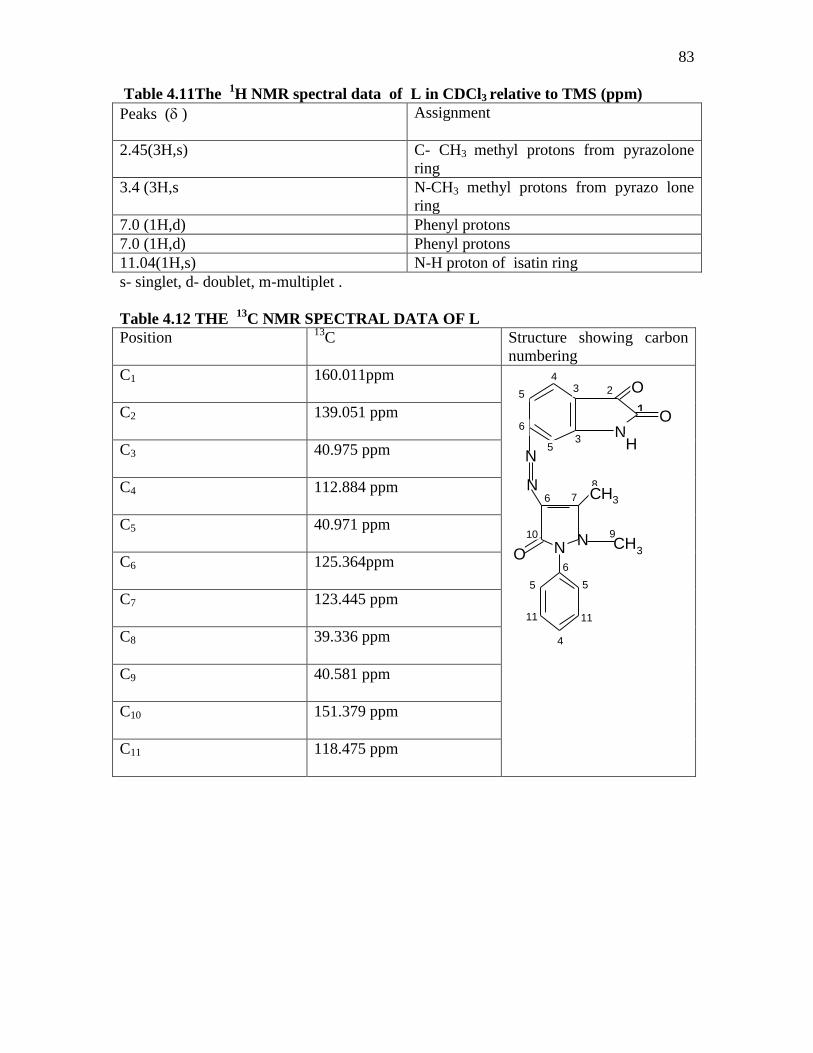
83
Table 4.11The 1H NMR spectral data of L in CDCl3 relative to TMS (ppm)
Peaks ( ) Assignment
2.45(3H,s) C- CH3 methyl protons from pyrazolone
ring
3.4 (3H,s N-CH3 methyl protons from pyrazo lone
ring
7.0 (1H,d) Phenyl protons
7.0 (1H,d) Phenyl protons
11.04(1H,s) N-H proton of isatin ring
s- singlet, d- doublet, m-multiplet .
Table 4.12 THE 13
C NMR SPECTRAL DATA OF L
Position 13
C Structure showing carbon
numbering
C1 160.011ppm
N
N
N CH3N
O
N
CH3
1
3
4
5
6
7
8
910
O
53 2
6
O6
55
11
H
11
4
C2 139.051 ppm
C3 40.975 ppm
C4 112.884 ppm
C5 40.971 ppm
C6 125.364ppm
C7 123.445 ppm
C8 39.336 ppm
C9 40.581 ppm
C10 151.379 ppm
C11 118.475 ppm

84
Table 4.13 1H NMR spectra data of HL.
Peaks ( ) Assignment
2.5 (3H,s)
C- CH3 methyl protons from pyrazolone
ring
3.5(3H,s)
N-CH3 methyl protons from pyrazolone
ring
6.891 (4H,d)
Phenyl protons
7.5(5H,m) A+B
Phenyl protons from ring A & B
7.9 (4H,t) (c)
Phenyl protons from ring C
8.509 (2H,d) Likely from OH protons in the ring
s- singlet, d-doublet, t- triplet, m-multiplet.
Table 4.14: the 13
C NMR spectral data of HL
Position of
carbon
13C NMR
Structure showing carbon numbering
C1 121,965ppm
N N
5
OH
97
6
8
13
CH3
N
N
NN
O12
1
22
1
8
10
3
A
C
21
4B
7
4
1 2
11
6
9
6
CH3
3
C2 126.540 ppm
C3 124.605 ppm
C4 130.516 ppm
C5 129.802 ppm
C6 133.406 ppm
C7 129.590 ppm
C8 128.778 ppm
C9 128.490 ppm
C10 140.674 ppm
C11 119.965 ppm
C12 119.965 ppm
C13 145.758 ppm
A= phenylgroup in pyrazolone ring. B=phenyl group of the azo naphthol .C= second benzene ring of naphthol
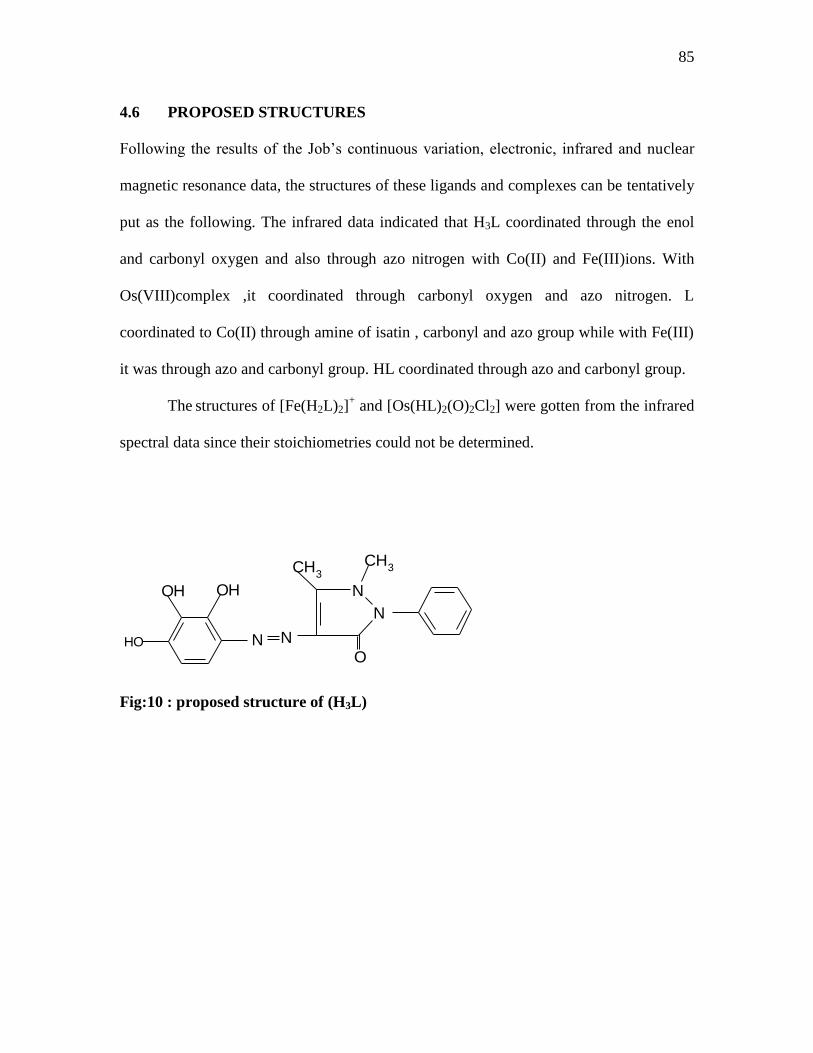
85
4.6 PROPOSED STRUCTURES
Following the results of the Job’s continuous variation, electronic, infrared and nuclear
magnetic resonance data, the structures of these ligands and complexes can be tentatively
put as the following. The infrared data indicated that H3L coordinated through the enol
and carbonyl oxygen and also through azo nitrogen with Co(II) and Fe(III)ions. With
Os(VIII)complex ,it coordinated through carbonyl oxygen and azo nitrogen. L
coordinated to Co(II) through amine of isatin , carbonyl and azo group while with Fe(III)
it was through azo and carbonyl group. HL coordinated through azo and carbonyl group.
The structures of [Fe(H2L)2]
+ and [Os(HL)2(O)2Cl2] were gotten from the infrared
spectral data since their stoichiometries could not be determined.
CH3CH
3
OHOH
HO
O
N
N
N N
Fig:10 : proposed structure of (H3L)
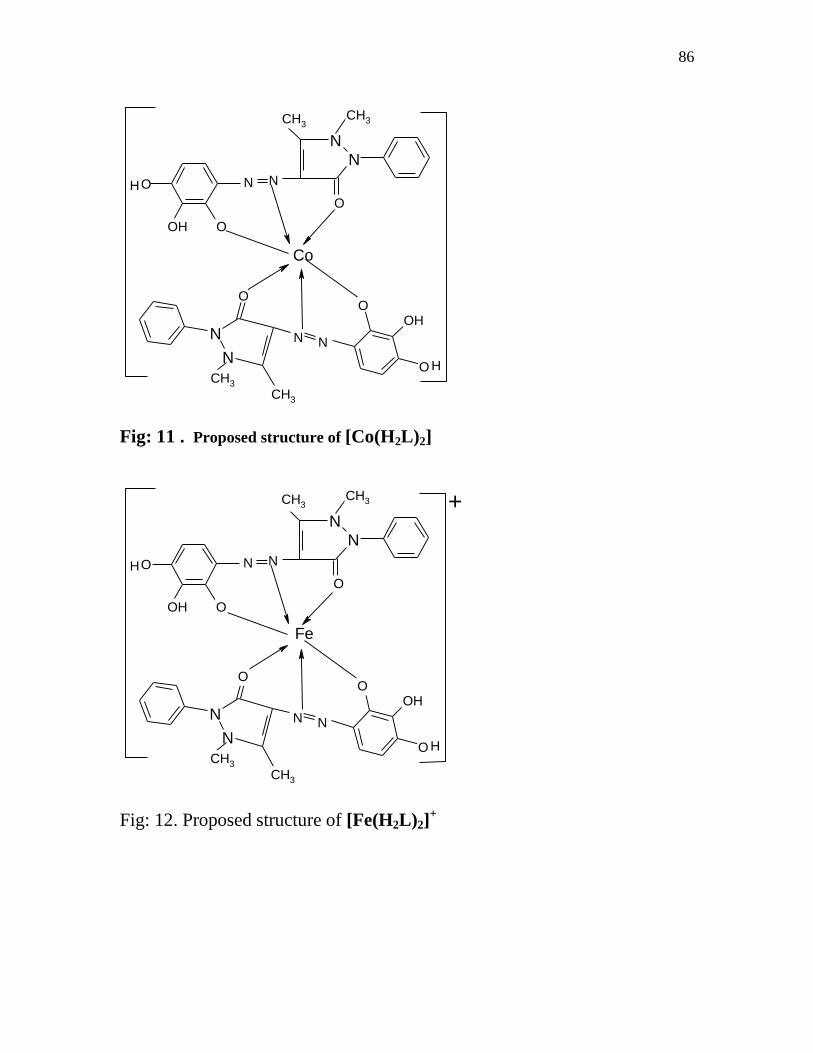
86
N
N
N
N
Co
O
O
CH3CH3
N N
OH O
OH
CH3
CH3
NN
OHO
O H
Fig: 11 . Proposed structure of [Co(H2L)2]
N
N
N
N
Fe
O
O
CH3CH3
N N
OH O
OH
CH3
CH3
NN
OHO
O H
+
Fig: 12. Proposed structure of [Fe(H2L)2]+
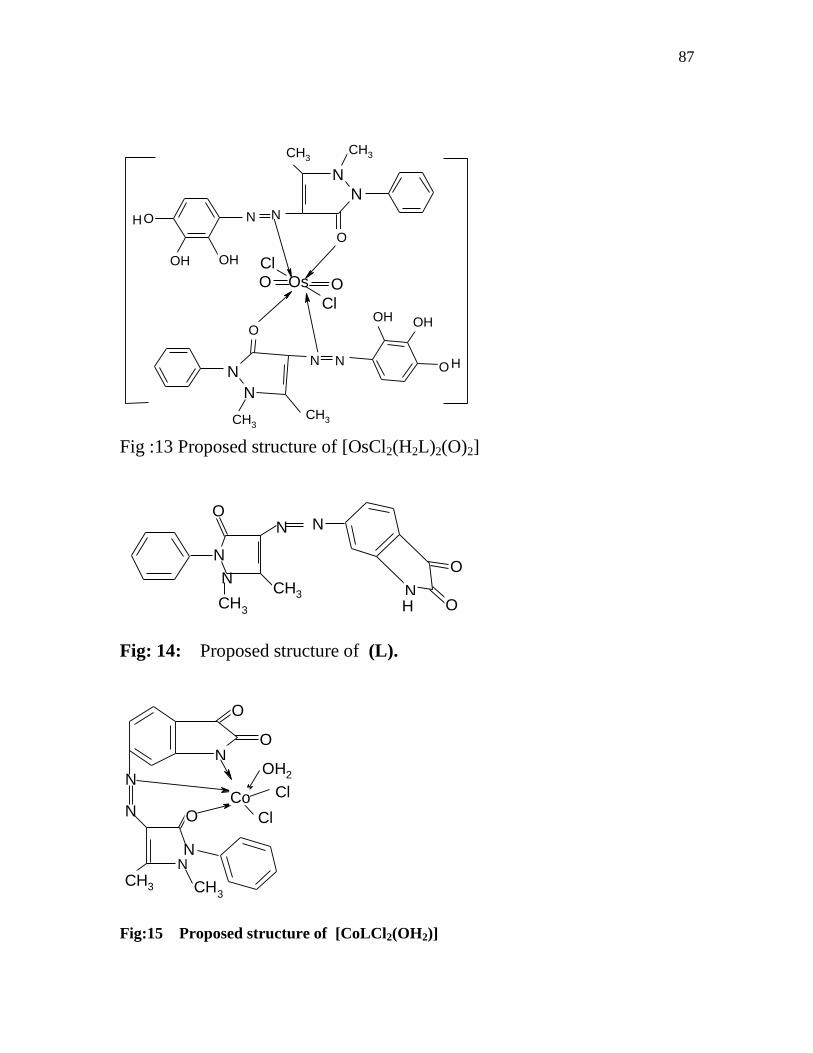
87
N
N
N
N
Os
O
CH3CH3
N N
OH
OH
OH
O
CH3CH3
NN
OH
O H
OH
O O
Cl
Cl
Fig :13 Proposed structure of [OsCl2(H2L)2(O)2]
N
N
CH3
N
NO
O
NCH3
OH
Fig: 14: Proposed structure of (L).
N
N
CH3
NN
O
N
CH3
O
O
OH2
Cl
Cl
Co
Fig:15 Proposed structure of [CoLCl2(OH2)]
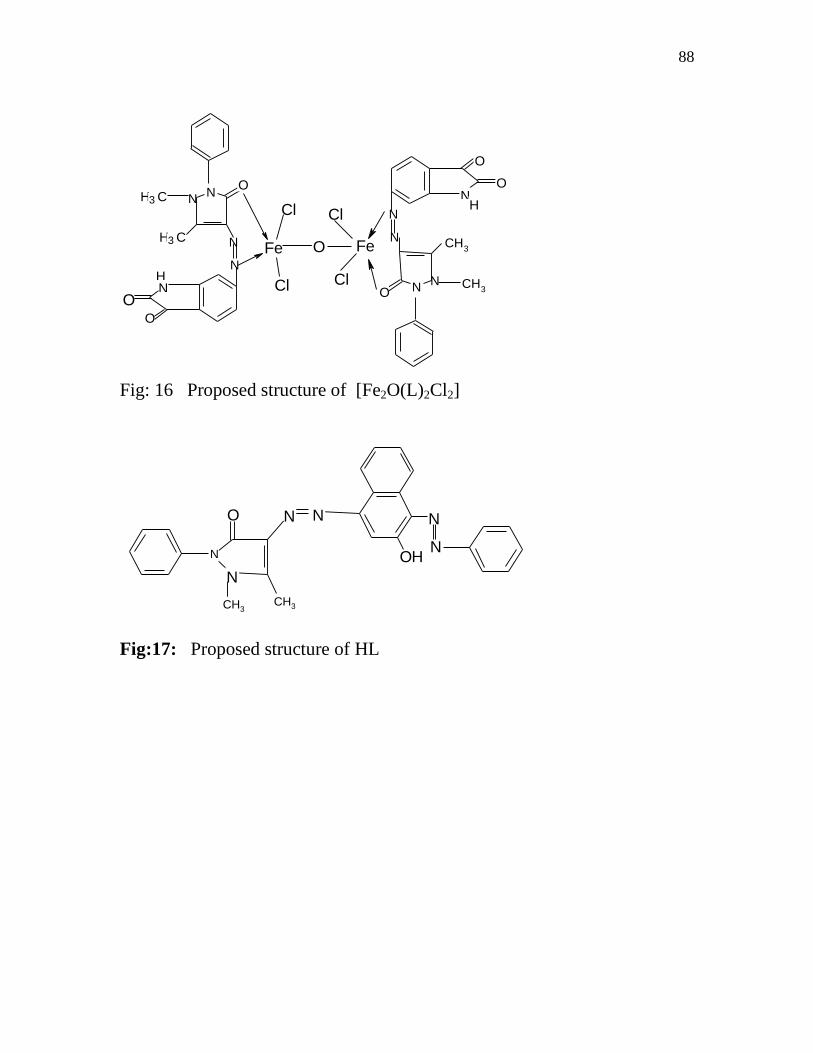
88
N
N
N CH3N
N
N
NNH C3
H C3
Cl Cl
Cl Cl
Fe Fe CH3
O
NO
O
H
O
NO
O
H
O
Fig: 16 Proposed structure of [Fe2O(L)2Cl2]
N
N
OH
O NN
N
N
CH3CH3
Fig:17: Proposed structure of HL
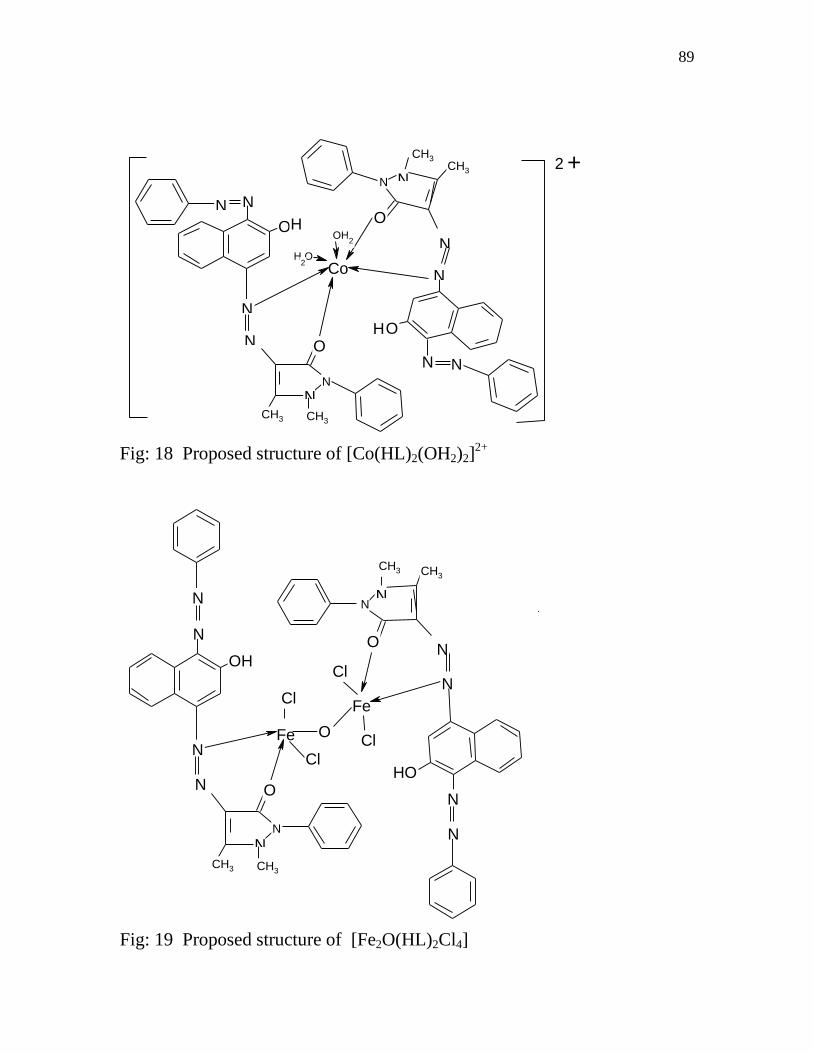
89
NN
OH2
H O2
Co
NN
N
N
NN
CH3
O
CH3
O
N
N
N
NN
CH3
O
CH3
O
H
H
2 +
Fig: 18 Proposed structure of [Co(HL)2(OH2)2]
2+
Fe
Fe
N
N
N
NN
CH3
O
CH3
OH
Cl
O
Cl
N
N
N
NN
CH3
O
CH3
HO
Cl
Cl
N
N
Fig: 19 Proposed structure of [Fe2O(HL)2Cl4]
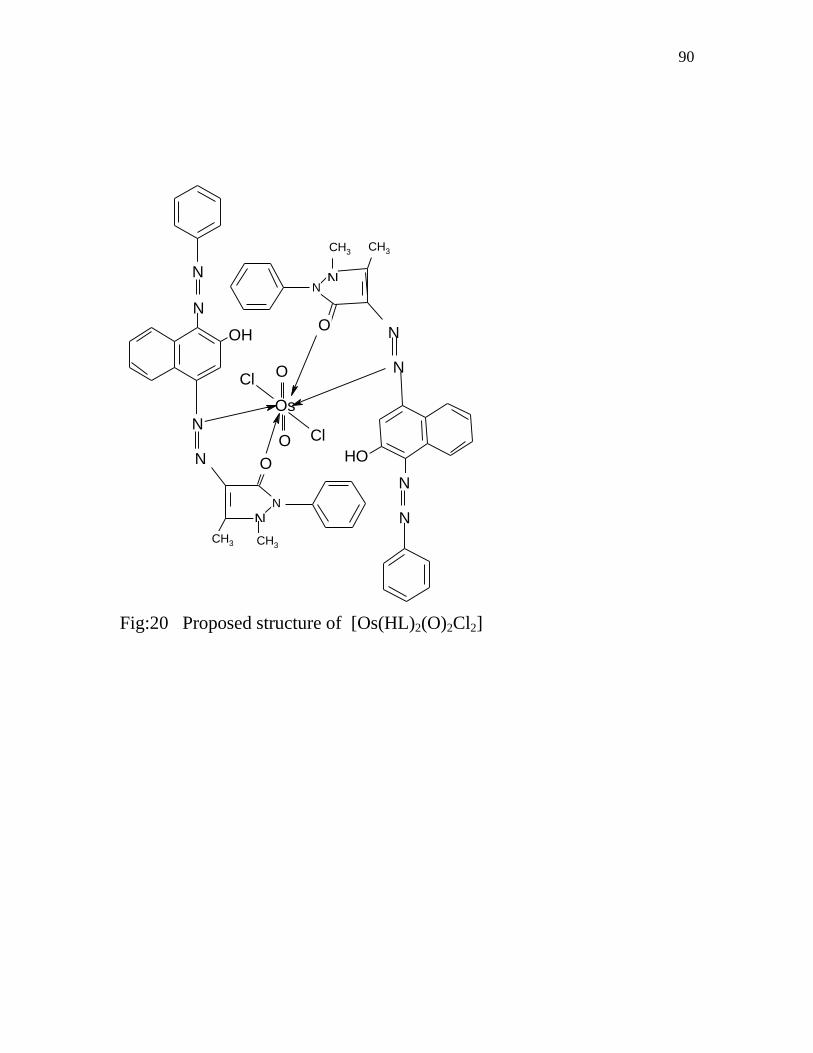
90
Os
N
N
N
NN
CH3
O
CH3
OH
N
N
N
NN
CH3
O
CH3
HO
N
N
O
O Cl
Cl
Fig:20 Proposed structure of [Os(HL)2(O)2Cl2]
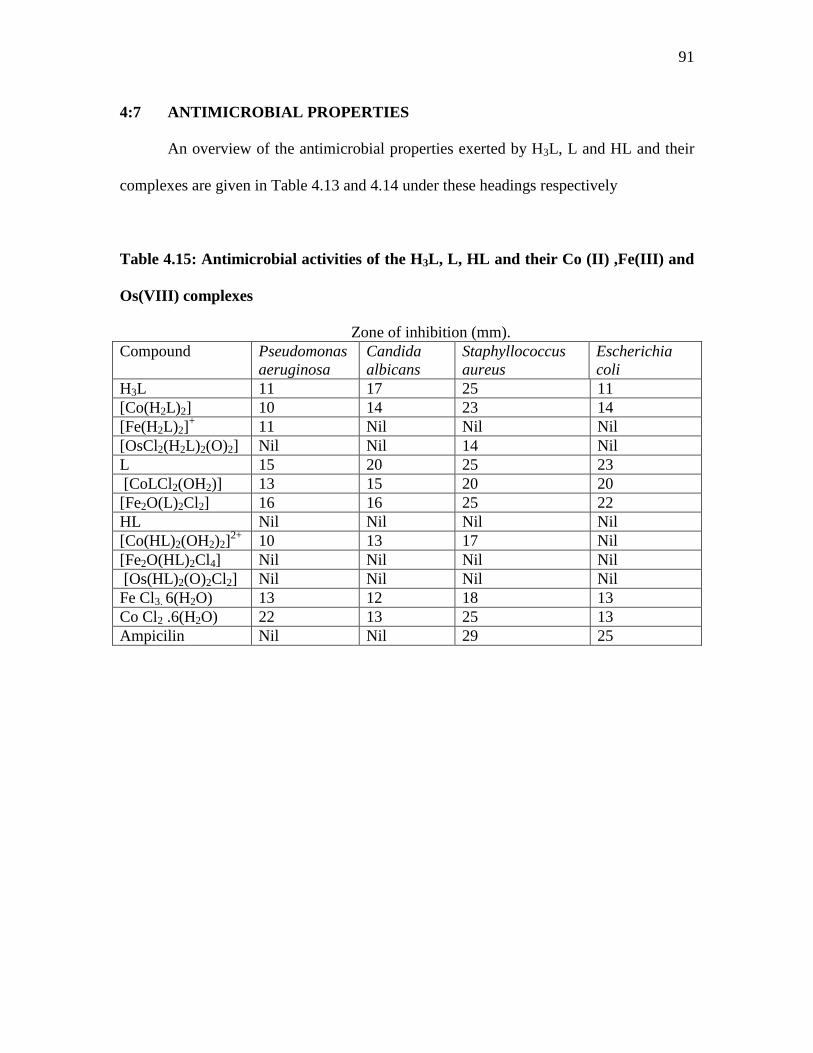
91
4:7 ANTIMICROBIAL PROPERTIES
An overview of the antimicrobial properties exerted by H3L, L and HL and their
complexes are given in Table 4.13 and 4.14 under these headings respectively
Table 4.15: Antimicrobial activities of the H3L, L, HL and their Co (II) ,Fe(III) and
Os(VIII) complexes
Zone of inhibition (mm).
Compound Pseudomonas
aeruginosa
Candida
albicans
Staphyllococcus
aureus
Escherichia
coli
H3L 11 17 25 11
[Co(H2L)2] 10 14 23 14
[Fe(H2L)2]+
11 Nil Nil Nil
[OsCl2(H2L)2(O)2] Nil Nil 14 Nil
L 15 20 25 23
[CoLCl2(OH2)] 13 15 20 20
[Fe2O(L)2Cl2] 16 16 25 22
HL Nil Nil Nil Nil
[Co(HL)2(OH2)2]2+
10 13 17 Nil
[Fe2O(HL)2Cl4] Nil Nil Nil Nil
[Os(HL)2(O)2Cl2] Nil Nil Nil Nil
Fe Cl3. 6(H2O) 13 12 18 13
Co Cl2 .6(H2O) 22 13 25 13
Ampicilin Nil Nil 29 25

92
Table 4:16: Minimum inhibitory concentration (MIC) for H3L, L,HL and their Co
(II) ,Fe(III) and Os(VIII) complexes
Organism - Pseudomonas aeruginosa, H3L 11 Nil Nil Nil Nil
[Co(H2L)2] 10 Nil Nil Nil Nil
L 15 Nil Nil Nil Nil
[CoLCl2(OH2)] 13 Nil Nil Nil Nil
[Fe2O(L)2Cl2] 15 10 Nil Nil Nil
[Co(HL)2(OH2)2]2+
10 Nil Nil Nil Nil
Ligand/complexes Organism - Escherichia coli ( E2)
H3L 11 Nil Nil Nil Nil
[Co(H2L)2] 14 12 10 Nil Nil
L 23 20 17 12 10
[CoLCl2(OH2)] 20 17 12 10 10
[Fe2O(L)2Cl2] 22 17 14 12 10
[Co(HL)2(OH2)2]2+
Nil Nil Nil Nil Nil
Organisms – Staphyllococcus aureus
Ligand/complexes Zone of inhibition (mm).
20g/mL 10g/mL 5 g/mL 2.5 g/mL 1.5g/mL
H3L 25 20 19 18 15
[Co(H2L)2] 23 19 16 15 12
L 25 22 19 14 12
[CoLCl2(OH2)] 20 16 15 11 Nil
[Fe2O(L)2Cl2] 25 20 17 11 Nil
[Co(HL)2(OH2)2]2+
17 14 11 Nil Nil
Organisms –Candida albicans.
H3L 17 15 12 10 Nil
[Co(H2L)2] 14 Nil Nil Nil Nil
L 20 14 11 Nil Nil
[CoLCl2(OH2)] 15 10 Nil Nil Nil
[Fe2O(L)2Cl2] 15 10 Nil Nil Nil
HL 13 Nil Nil Nil Nil

93
The activities of the ligands and complexes were checked against gram-positive
bacteria. The zones of inhibition in (mm) of the standard drug Ampiclin against gram
positive bacteria Staphylococcus aureus and fungus Candida albicans were observed to
be 29mm and Nil respectively. Under the same conditions the activity of the standard
drug Ampicilin (control) against gram negative bacteria Pseudomonas aeruginosa
(clinical), was found to be Nil.
In Table 4:14, ligand H3L and its [Co(H2L)2] complex, ligand L and its
[CoLCl2(OH2)] and [Fe2O(L)2Cl2] complexes, were observed to have high activities
against those organisms. Because of their very good antimicrobial activities their
minimum inhibitory concentration (MIC) was determined.
It was found that H3L and its [Co(H2L)2] complex have good activity on
Staphylocous aureus even up to the last concentration that is ,at 1.5g/mL. Their
inhibition zones are 15 and 12mm respectively. H3L has activity against Candida –
albican at concentration 2.5g/mL which is 10mm.
L and the complexes [CoLCl2(OH2)] and [Fe2O(L)2Cl2] had activity against
Staphylococcus aeureus, up to concentration 2.5g/mL and also on Escherichia coli, the
activities proceed till the last concentration 1.5g/mL and their zones of inhibitions of ,
10 overall.
On Candida-albican its complexes had little activities. Their inhibition zones
14,10,10 respectively.
On Candida –albcan, L, and its complexes were active at concentration 10g/mL.
94
The [Co(HL)2(OH2)2]2+
complex of HL had activities on Staphylococcus up to 11mm at
concentration 5g/mL.
Generally, Ampicilin, which was used as control, had no activities on
Pseudomonas aeruginosa, and Candida-albican. While on Staphylococcus and
Escherichia coli. It had activities up to 29 and 25mm respectively.
FeCl3.6(H2O) had activities on all the microorganisms used. On Pseudomonas
aeruginosa - 13mm, on Candida – albicans,-12mm, Staphylococcus aureus -18mm and
Escherichia coli-13mm.
[CoCl2.6(H2O)] also had good activities on all the microorganisms used. On
Pseudomonas aeruginosa - 22, on Candida–albican -13, Staphylococcus -25 and finally
on Escherichia coli -13mm.
95
4.8 CONCLUSIONS AND RECOMMENDATION
The H3L, L, HL and [Fe(H2L)2]+, [Co(H2L)2],[OsCl2(H2L)2(O)2].
[CoLCl2(OH2)],[Fe2O(L)2Cl2],[Co(HL)2(OH2)2]2+
, [Fe2O(HL)2Cl4] and[Os(HL)2(O)2Cl2]
complexes were successfully synthesized. The H3L, L, HL and complexes were
characterized by spectral, stoichiometry, molar conductance and biological activities data.
The spectral data showed the absences of pie-bonding interaction in the complexes.
Bonding of the ligand to the central metal atom in the complexes most probably occurred
by s-bonding through the participation of enol oxygen, carbonyl oxygen and azo nitrogen
group of pyrazolone ring.
Based on these data, an octahedral geometry have been
assigned to all the complexes of the ligands except Fe(III) complex of L and HL which
have square planar geometry.
Metal –ligand mole ratio indicated a 1:2 for all the complexes except for Fe(III)
complex of L and HL which have 2:2 mole ratio, making the complexes a monochelates.
The molar conductivity value revealed that [OsCl2(H2L)2(O)2], [CoLCl2(OH2)],
[Fe2O(HL)2Cl4], [Os(HL)2(O)2Cl2] and [Fe2O(L)2Cl2] are non electrolytes while only
[Co(HL)2(OH2)2]2+
and [Fe(H2L)2]+ behaved as 2:1 electrolyte when compared with
CuSO4 salt.
The H3L and L have higher antimicrobial activity than their complexes suggesting
that the good activities were as a result the ligands . [Co(HL)2(OH2)2]2+
has higher
activity than its HL suggesting that cobalt contributed for the inhibitions of the micro
organism.

96
The antimicrobial properties of these ligands and complexes indicated that they could be
used in pharmaceutical industries for further uses.

97
REFERENCES:
1. http://www the free dictionary. Com/pyrazolones,2002
2. http://en.wikipedia.org/wiki/phenazone, 2009
3. Gernot A,Eller and Wolfgang Holzer;(2006); A one step synthesis of pyrazolone
Althanstrasse 14;1090 vienna
4. Delgado,J.N,and Remers,W.A(1991);Organic medicinal and pharmaceutical
chemistry;9th
ed. J.B.Lippincett co.USA,pp668-670.
5. Greenwood.N.;Eamshaw.A(1997).Chemistry of the element,2nd
ed; Butterworth
Heimemann,Oxford, U.K
6. Finar I.L;(1982);Organic Chemistry volume 1,Toppan printing Co(S) pte Ltd, p
846.
7. Elder Field;R.C.(1957), Five membered heterocycles containing heteroatoms and
their benzo derivatives .vol 6, John willey and sons Inc; new york, pp 153-157.
8. Poddak,s v;Sarkar A.K and Adihya J.N(19630; Reactions of pyrazolone
derivative with metallic ions and their Application in analytical chemistry., India
asscciation for the cultivation of science, Jadavpur, caloutla 32,India
9. http://en.wikipedia.org/wiki/phenazolone
10. . Brugnolotti.m.,Corsio Coda.A, Desimoni.C.,F aita.G.,(1988).,Tetrahedron, vol.
14. pp 5229
11. Robert .A.Harte. (1968)., The Journal of Immunology, 34 , 443-439.
12. Mehisch DR(2002); J. Am.Dem. Assoc.133(7) 861-71
13. Carciuaescu,D.G.,(1975),:An R Acta Farm, 43,265.

98
14. Hosier, J.,(1986): J. Invest. Dermatol 74, 51.
15. Meffin, P.J.,Williams , R.L., Blaschke,T.F.and Rowland, M.,(1977); J Pharm. Sci
66, 135.
16. Olenovieh N.I and Kovalchuk L.I., Zh Anal.Khim.,28, 2126(1975)
17. Kacci. A.,Langemann A and Zeller. P., Experimenta. 20, 503(1961)
18. El.Saied F.A., El-Bahanasaway R.M, Abdel Azzem M and El-Sawaf A.K.,
Polyhedron, 13, 1781(1994)
19. El-Saied.E.A,Ayad.M.I., Issa.R.M., and ALY,S.A;(2001): Synthesis and
characterization of iron (III) Formylazohydrazo aniline antipyrine.Polish. J. chem.
75, 773.
20. http://en.wikipedia.org/wiki/phenazolone,2002.
21. Dwokin R H,Backonja. M and . Row botham M.L, et al (2003); Advances in
neuro pathic pain: diagnosis, mechanisms and treatment recommdations. Arch,
Neurol 66(11): 1524-34
22. Rogers.J, Periodontol (2008); The inflammatory response in Alzheimer,s disease
23. Snyder, H.R., (1968) Organic Synthesis . John willey and Sons.,28, 87-88.
24. Wells, A.F., (1984),Structural inorganic chemistry 5th
ed, Oxford University
press., Oxford U.K.
25. Wong.A,(2002);WHO Pharmaceuticals News letter. No 1, pp 15.
26. Blackstrom, M., Hagg.S., Mjorndal T., Dahlquist R.,(2002);Utilization pattern of
metamizole in northern Sweden and risk estimates of
agranulocytosis.http://www.ncbi.nlm.nih.gov/sites/entrez.
99
27. Gohl L.S,.(2007); The carcinogenic potencThe carcinogenic potency project of 1-
phenyl-3 methyl,-5-pyrazolone. C.P.@ potency berkeled,edu.
28. http://en.wikipedia.org/wiki/phenazolone, 2007
29. Michaelis, A. Liebigs Ann. 1904, 338, 137.
30. Nivorozhkin, A.L.; Toflund, H.; Nivorozhkin, L.E.; Kamenetskaya, I.A.;
Antsyshkina, A.S.;Porai-Koshitz, M.A. Trans. Met. Chem. 1994, 19, 319.
31. Emelens, L.C.; Cupertino, D.C.; Harris, S.G.; Owens, S.; Parsons, S.; Swart, ;
Tasker R.W.; P.A.; White, D.J. J. Chem. Soc., Dalton Trans. 2001, 1239
32. Uraev, A.I.; Nivorozhkin, A.L.; Kurbatov, V.P.; Korobov, M.S.; Lysenko, K.A.;
Antipin,M.Yu.; Pavlenko, D.A.; Garnovskii, A.D. Izvest. AN. Ser. Khim. 2003 in
press.
33. Snavely, F.A.; Trahanovskii, W.S.; Suydam, F.H. J. Org. Chem. 1962, 27, 994.
34. Snavely, F.A.; Trahanovsky, W.S.; Suydam, F.H. Inorg. Chem. 1964, 3, 123.
35. Hinsche, G.; Uhlemann, E.; Zeigan, E.; Engelhard, G. Z. Chem. 1981, 21, 414.
36. Hinsche, G.; Uhlemann, E.; Weler, F. Z. Naturforsch., Teil B. 1996, 51, 1355.
37. Minkin, V.I.; Garnovskii, A.D.; Elguero, J.; Katritzky, A.R.; Denisko, O.V. Adv.
Het. Chem.2000, 76, 157.
38. Price, R. In The Chemistry of Synthetic Dyes; Venkataraman, K. Ed.; Acad. Press:
NewYork, Chapter 7, 1970; Vol.3.
39. Cordon, P.F.; Gregory, P. Organic Chemistry in Color; Acad. Verlag: Berlin,
1983.
100
40. Zollinger, H. Color Chemistry Synthesis Properties and Application of Organic
Dyes;Verlag Chemie: Weinheim, 1987.
41. Zollinger, H. Diazochemistry Aromatic and Heteroaromatic Compounds. VCH:
Weinheim,1994.
42. Elguero, J.; Marzin, C.; Katritzky, A.R.; Linda, P. Tautomerizm of Heterocycles.
Adv.Heterocycl. Chem. Suppl. 1; Academic: New York, 1976.
43. Fedorov, L. A. NMR Spectroscopy of organic analytical reagents and their
complexes with metal ions; Science: Moscow, 1987.
44. Kuzmina, L.G.; Grigoryeva, L.P.; Struchkov, Yu.T.; Vezhkova, Z.I.; Zaitsev,
B.E.; Zaitseva,V.A.; Pronkin, P.P. Khim. Geterotsykl. Soedin. 1985, 816.
45. Connor, J.A.; Kennedy, R.J.; Daves, H.M.; Hursthouse, M.B.; Walker, N.P. J.
Chem. Soc.,Perkin Trans. 1990, 203.
46. Whitaker, A. Acta Crystallogr., Sect. C 1988, 44, 1587.
47. Bertolasi, V.; Gilli, P.; Ferretti, V.; Gilli, G. Acta Crystallogr., Sect. B 1994, 50,
617.
48. Kogan, V.A.; Kochin, S.G.; Antsyshkina, A.S.; Sadikov, G.G.; Garnovskii, A.D.
Mendeleev Commun. 1997, 239.
49. Dyachenko, O.A.; Atovmyan, L.O.; Aldoshin, S.M.; Tkachev, V.V. Zhurn. Struct.
Khim.1978, 19, 829.
50. Mukherjee, A. K.; Mukherjee, D. P. K. Acta Crystallogr., Sect. C 1986, 42, 793.
51. Sui, K.; Peng, S.M.; Bhattacharya, S. Polyhedron 1999, 18, 631.
101
52. Kogan, V.A.; Kochin, S.G.; Antsyshkina, A.S.; Sadikov, G.G.; Garnovskii, A.D.
Mendeleev.Commun. 1999, 82.
53. Alexander D. Garnovskii,* Ali I. Uraev, and Vladimir I. Minkin, Metal
complexes from aryl and hetarylazocompounds, ARKIVOC 2004 (iii) 29-41
54. Garnovskii, A. D.; Kharisov, B. I. Eds.; Synthetic Coordination and
Organometallic Chemistry; Marcel Dekker: New York, 2003.
55. Garnovskii, A. D.; Nivorozhkin, A.L.; Minkin, V. I. Coord. Chem. Rev. 1993,
126, 1.
56. Garnovskii, A.D.; Vasilchenko, I.S. Russ. Chem. Rev. 2002, 71, 943.
57. Garnovskii, A.D.; Vasilchenko, I.S.; Garnovskii, D.A. Modern aspects of
synthesis of metallocomplexes. Basic ligands and methods; LaPO; Rostov on
Don, 2000.
58. Burmeister, J.L. Coord. Chem. Rev. 1990, 105, 65.
59. Garnovskii, A.D; Garnovskii, D.A.; Vasilchenko, I.S.; Burlov, A.S.; Sadimenko,
A.P.; Sadekov, I.D. Russ. Chem. Rev. 1997, 66, 389.
60. Samir S. Kandil, (1998), Transition Met. Chem., 23, 461±465.
61. Maciejewska.D and Skulaski .L, Pol. J. Chem., 58, 903 (1984).
62. Masoud .M.S and Zaki .Z.M, Transition Met. Chem., 13, 321 (1988).
63. Kandil. S.S, Ali Y.L and El Barbary. A, Synth. React. Inorg.Met.-Org. Chem.,
22, 83 (1992).
64. Nakamoto. O, Infrared and Raman Spectra of Inorganic and Coordination
Compounds, Wiley-Interscience, New York, 1986.

102
65. Silverstein, .R.M, Bassler G.C and Morrill. T.C, Spectrometric Identi®cation of
Organic Compounds, 5th Edit., Wiley-Interscience,New York, 1991.
66. Kalia .K.C and Chakravorty . A, J. Org. Chem., 35, 2231 (1970).
67. Bryant. G.M, Fergusson J.E, and H. K. J. Powell, Aust. J. Chem.,24, 257 (1971).
68. Ochiai,E.I., Bioinorganic Chemistry ± An Introduction, Allyn and Bacon,
Boston, MA, 1977, Ch. 13.
69. Omar.M.M., Gehad G. Mohamed∗ (2005), Spectrochimica Acta Part A 61 ,
929–936
70. Mohamed.G, Abd El-Wahab.Z.H ., J. Therm. Anal. 73 (2003) 347.
71. Mondal.N, Dey.D.K, Mitra.S, Abdul Malik.K.M., Polyhedron 19 (2000) 2707.
72. Mohamed.G.G., El-Gamel.N.E.A., Teixidor.F., Polyhedron 20 (2001).2689
73. Mohamed.G.G, El-Gamel.N.E.A, Nour El-Dien.F., Synth. React.. Inorg. Met.
Org. Chem. 31 (2001) 347.
74. Mohamed.G.G., Spectrochim. Acta Part A 57 (2001) 411.
75. El-Saied.E.A,Ayad.M.I., Issa.R.M., and ALY,S.A;(2001): Synthesis and
characterization of iron (III) Formylazohydrazo aniline antipyrine.Polish. J. chem.
75, 773-778.
76. Aly . F. A ; Abu.El.Wafa. Sim and El Ries M.A . , (1985) Egypt . J/ chem, 28
,447
77. Ferrari; M.B ; fara G.G; La .Franchi M; , Pchzzic andFarasconi’M;(1991) .Inorg.
Chem .Acta . 181 , 253 .
78. Amcough A.W and Plowman R.A,(1970), Aust.J.Chem.,23, 699

103
79. Abo El-Ghar.M.F., Abdel-Ghani.N.T, Badr.Y and El-Borady.O.M ., ISESCO
Science and Technology Vision Vo l u m e 3 - N u m b e r 3 - M a y 2 0 0 7 ( 5 8 -
6 3 )
80. Sallaby.A.M, Mostafa .M.M and Bekhet.M.M., (1978). J. Inorg. Nacl. Chem., 41,
267
81. Geary.W.J, (1971). Coord. Rev., I, 81
82. Mohamed.G.G, (2001), Spectrochimica Acta Part A 57, 411.
83. Silverstein.R.M, Bassler.G.C and Morrill.T.C., (1981). ''Spectroscopic
Identification of Organic Compound'', 6th Ed, John Wiley, New York
84. Sadek.E.G and Metwally.M.A., (1991),J. of Islamic Academy of sciences. 4:2,
105
85. Omar.M.M, Mohamed.G.G., (2005), Spectrochimica Acta Part A, 61, 929
86. Ramazan.G, Emrah.G and Bülent.K., (2005),Dyes and Pigments xx 1
87. Harris L.G., (1988); Analytical Chemistry; principles and Techniquues, pretice
Hall, Inc. Englewood Cliffs, New Jerses pp 67
88. Harvey A.E,and Manning D.L(1950); J.Amer.Chem. Soc. 72, 4488; Meyer.
A.S,Jr., and AYRES.G.H (1957); J. Amer. Chem.Soc. 79, 49
89. Mark.M.Jones., (1964); Elementary coordinate on chemistry; Library of congress.
U.S.A , pp281-289.
90. Skoog D.A,West D.M, and Holler F.J.,(1988);Fundamentals of Analytical
Chemistry. Saunders, New york, 5th
ed ., pp525-52
104
91. Boccio J.R, Zubillaga M.B, Gotelli M.J, and Weill R, (1998); Biol. Trace
.Elem.Res., 62, 65
92. Loeb K.E, Zalseki J.M, Hess C.D,Hecht.S.M ,and Solomon.E.I, (1998) . J. Am.
Chem. Soc., 120, 1249.
93. Boger D.L, Ramsey .T.M, Cai. H,Hochn S.T, Kozarich. J . W ,and Stubbe
J.(1998): J . Am. Chem . Soc., 120, 53.
94. Boger D.L, Ramsey .T.M, Cai. H,Hochn S.T, Kozarich. J . W ,and Stubbe
J.(1998): J . Am. Chem. Soc., 120, 9149.
95. Sucheck. S.J, Ellena J.F,Hecht S.M,(1998); J. Am. Chem.Soc. 120, 7450
96. Boger D.L, Ramsey .T.M, Cai. H,Hochn S.T, Kozarich. J . W ,and Stubbe
J.(1998): J . Am. Chem. Soc., 120, 9149
97. Petrenko Y.M, and Vladimirov.Y.A, (1998): Eksp. Klin. Farmokoli, 61, 44
98. Meller J.G,Burrows C.J , (1998), Inorg. Chim, Acta,; 276, 314 .
99. Hermeslima M, Nagy .E, Ponka .P, and Schulman. H.m, (1998), Free Radical
Biol. Med., 25, 875.
100. Zhany D, Busch D.H, Lennon. P.L,Weiss R.H, Neumann W.L, and Riley
D.P,(1998), Inorg. Chem ., 37, 956.
101. Kushchev skaya N.F., (1998), Powder Metall. Met. Ceram., 36, 668.
102. Brooks R.A, Vymazal J ,Goldfarb. R.B, Bulte. J.W.M, and Aisen . P,
(1998);Magn. Reson. Med; 40, 236.
103. Kresse.M, Wagner. S, Pfefferer. D, Lawaczeck.R,Elste.V and Semmler.W,
(1998); Magn. Reson. Med., 40, 236

105
104. Yanase.M, Shinkai.M,Honda.H., Wakabayashi. T, Yashida. J and
Kobayash. T, (1998), Jpn .J .Cancer Res., 89, 463.
105. Stevens .H, Vander-wiele.C, Santens.P, Jansen .H.M.L, De Reuck. J,
Dierckx R and Korf. J.,(1998); J. Nucl.Med; 39, 495.
106. Stevens.H, Knollema S, Piers . D . A, Vander-wiele.C, Santens.P Jansen
.H.M.L, De Reuck. J, Dierckx R and Korf. J.,(1998); Nucl.Med Commun., ; 19,
573
107. Korf . J, Veenma-vander Duin. L, Brinkman-Medema. R, Niemarkt.A, and
De leij. L.F.F.H, (1998), J. Nucl.Med., 39, 836.
108. Patai.S, (1975)., ''The Chemistry of Hydrazo, Azo and Azoxy Groups''.
Part1, Wiley,New York ,Zidan.A.S.A, El-Said.A.I, El-Meligy.M.S, Aly, and
Mohammed.O.F., (2000). J. Therm. Anal. 62, 665
109. Awad.I.M.A., (1996).Phosphorus Sulfur Silicon 114, 17 .
110. Awad.I.M.A., (1992), J. Chem. Technol. Biotechnol. 53, 227
111. Dimmler.M, Eilingsfeld.H, Hansen.G., (1979), Ger. Offen. 2,748,978;
C.A., 91, 75693r
112. Kaeser.A, Stingelin.W., (1994), Eur. Pat. Appl. EP 591,103; C.A., 121,
233064f
113. Ridyard.D.R.A, Renfrew.A.H.M., (1992),Eur. Pat. Appl. EP 471,456;
C.A., 116, 196228m
114. Usui.H, (1993), Jpn. Kokai Tokkto Koho JP 04,189,183 [92 189,183];
C.A., 118, 30112k
106
115. Patai.S, 1975, The Chemistry of Hydrazo, Azo and Azoxy Groups. Part 1,
Wiley, New York,
116. Zidan.A.S.A A.I. El-Said, M.S. El-Meligy, A.A.M. Aly, O.F. Mohammed,
(2000) , J. Therm. Anal. 62 ,665.
117. Awad.I.M.A , (1996),Phosphorus Sulfur Silicon 114 , 17.
118. Awad.I.M.A., (1992) , J. Chem. Technol. Biotechnol. 53, 227.
119. Krishnankutty.K, Babu.D.K, (1996), J. Ind. Chem. Soc. 73 , 379, and
references therein.
120. Tiwari.G.D and Mishra.M.N, (1982), J. Ind. Chem. Soc., 59 ,362.
121. Krishnankutty.K, Babu.D.K, (1996)., J. Ind. Chem. Soc. 73 ,379, and
references therein.
122. Mohamed.G.G., (2001),Spectrochim. Acta Part A 57 , 411.
123. Zaki.Z.M., (2000) , Spectrochim. Acta Part A 56 ,1917.
124. Hankare.P.P, Chavan.S.S., (2003) ,Indian J. Chem. Sect. A 42 ,540.
125. Ivanov.V.M, Kuznetsova.O.V, Grineva.O.V., (1999), J. Anal. Chem. 54
,233.
126. Rathaiah.G.V, Charyulu.J.K, Eshwar.M.C., (1986), J. Radioanal. Nucl.
Chem. 99 ,337.
127. Gandhi.M.H, Pathak.K.C, Parikh.D.J, Lahiri.S.A., (1986) ,Indian J. Chem.
Soc. Sect. A 25 ,499.
128. Zaporozhets.O, Petruniock.N, Bessarabova.O, Sukhan.V, (1999)., Talanta
49 ,899.

107
129. Visser.A.E., Swatloski.R.P, Griffin.S.T, Hartman.D.H, and Rogers.R.D;
(2001) ., Sep. Sci. Technol. 36 ,785.
130. Basova.E.M, Bolshova.T.A, Ivanov.V.M and Shpigun.O.A; (1993), Zh.
Anal. Khim. 48 284.
131. Peng.J, Deng.C, Liu.S., (1998) ; Fenxi Huaxue 26 ,303.
132. Lee.W, Lee.S.E, Lee.C.H, Kim.Y.S and Lee.Y.I, (2001);Microchem. J.
70, 195
133. Garnovskii, A. D.; Kharisov, B. I. Eds.; Synthetic Coordination and
Organometallic Chemistry; Marcel Dekker: New York, 2003. Heinosuke
Yasuda., (1967)., Infrared Analysis of 2-pyrazolin-5-one Derivatives., Applied
Spectroscopy, vol 23, 1969.
134. El.Saied F.A, Ayad.M.I, Issa R.M and Aly S.A. (2001): Synthesis and
charactersation of Iron(III),Cobalt (II),Nickel(II) and copper(II) Complexes of 4-
formylazoanilne Antipyrine, Polish. J .Chem., 75, 774
135. Job., (1936); Analytical Chem. Vol 61 NO 11 pp 97
136. Stevens .H, Vander-wiele.C, Santens.P, Jansen .H.M.L, De Reuck. J,
Dierckx R and Korf. J.,(1998); J. Nucl.Med; 39, 495.
137. Uzoukwu. B.A and Okafor E.C., (1991): Synthesis, Structural, UV-Visible
, IR, 1H and
13C NMR spectral studies , Synth. REACT, Inorg. Met. Het.-Org.
Chem. 21(9), 1375-1386.
138. Mohamed Gaye, Oumar Sarr,Abdou Salam Sall, Qusmane Diouf and
Seydou Hadabere (1997): Bull. Chem. Ethiop, 11(2), pp 114

108
139. Andrew S., Clayton H.H., and Edward, M.K. (1992). Introduction to
Organic Chemistry, 4th
ed. Macmillan Publishing Company USA, p. 399.
140. Dedley ,H.W., and Lan – F., (1980) . spectroscopic methods in organic
chemistry , 3rd
ed , Mc Graw – Hill Book company (UK) limited . pp 1-74 .
141. Cotton , S –A; and Hart , F .A (1975). The heavy Transition Elements ,
1st ed , the Macmildan press ltd London , pp 59 -76 , 134 -195 .
142. Lee J . D . , (1996) . Concise Inorganic chemistry 5th
ed .Repulika Press
pvt . l td India . Pp 938-971.


