Download - Swc public consultation_pres_170307_final
The City of Toronto is Considering a
Stormwater ChargePresented by
Lou Di Gironimo, General Manager, Toronto Waterand Kurtis Elton, Policy & Program Advisor, Toronto Water
March 7, 2017
toronto.ca/stormwatercharge 2
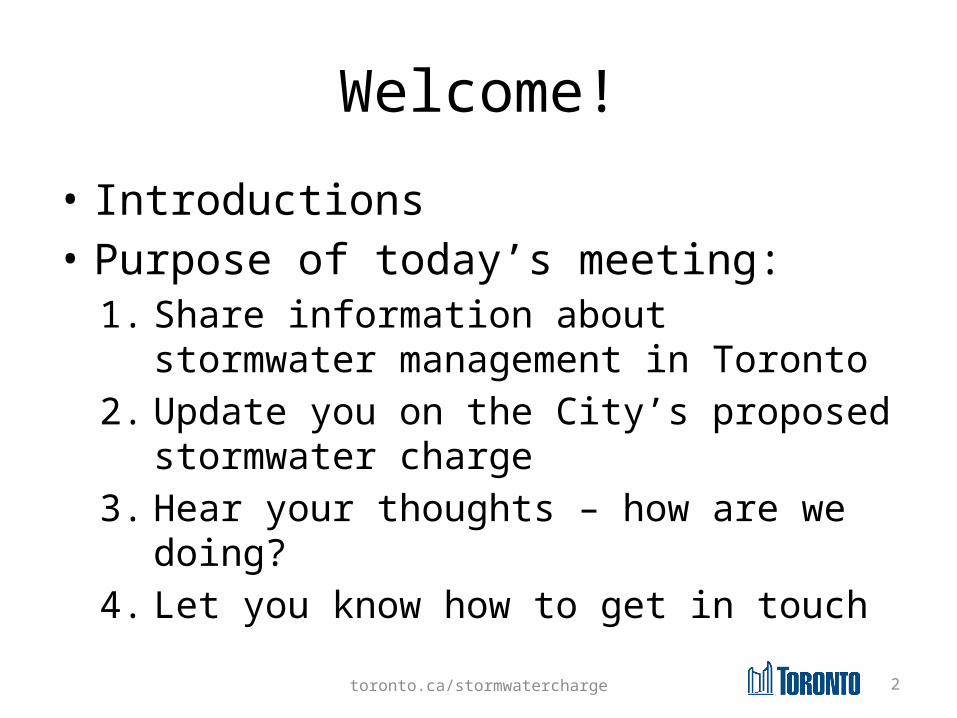
Welcome!• Introductions• Purpose of today’s meeting:
1. Share information about stormwater management in Toronto
2. Update you on the City’s proposed stormwater charge
3. Hear your thoughts – how are we doing?
4. Let you know how to get in touch
toronto.ca/stormwatercharge 3
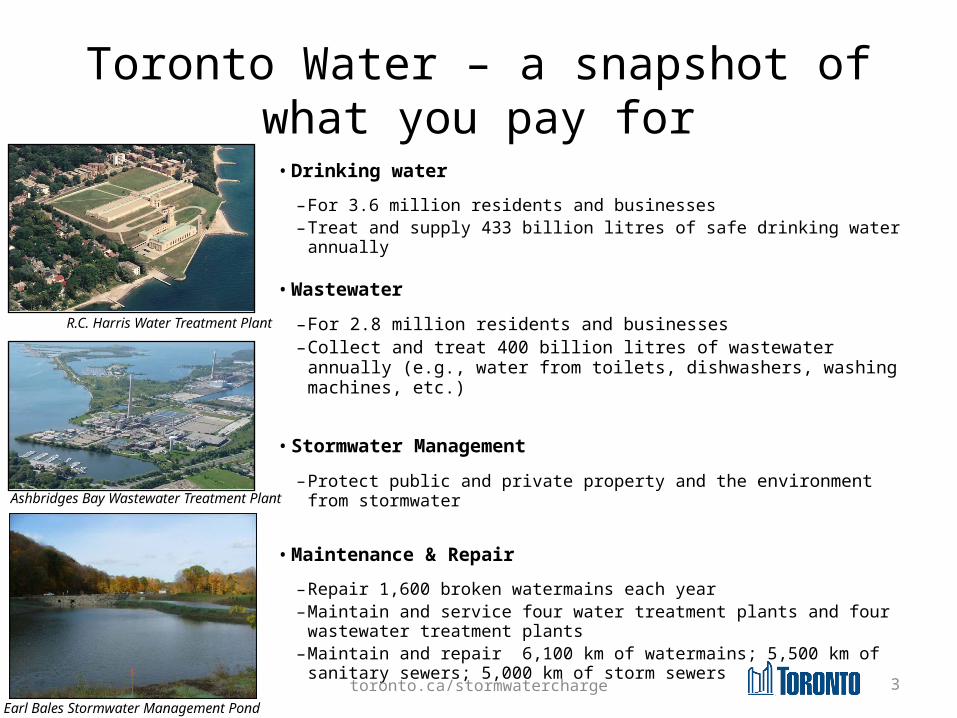
Toronto Water – a snapshot of what you pay for
• Drinking water – For 3.6 million residents and businesses– Treat and supply 433 billion litres of safe drinking water annually
• Wastewater – For 2.8 million residents and businesses– Collect and treat 400 billion litres of wastewater annually (e.g.,
water from toilets, dishwashers, washing machines, etc.)
• Stormwater Management– Protect public and private property and the environment from
stormwater
• Maintenance & Repair– Repair 1,600 broken watermains each year– Maintain and service four water treatment plants and four
wastewater treatment plants– Maintain and repair 6,100 km of watermains; 5,500 km of
sanitary sewers; 5,000 km of storm sewers
R.C. Harris Water Treatment Plant
Ashbridges Bay Wastewater Treatment Plant
Earl Bales Stormwater Management Pond
toronto.ca/stormwatercharge 4
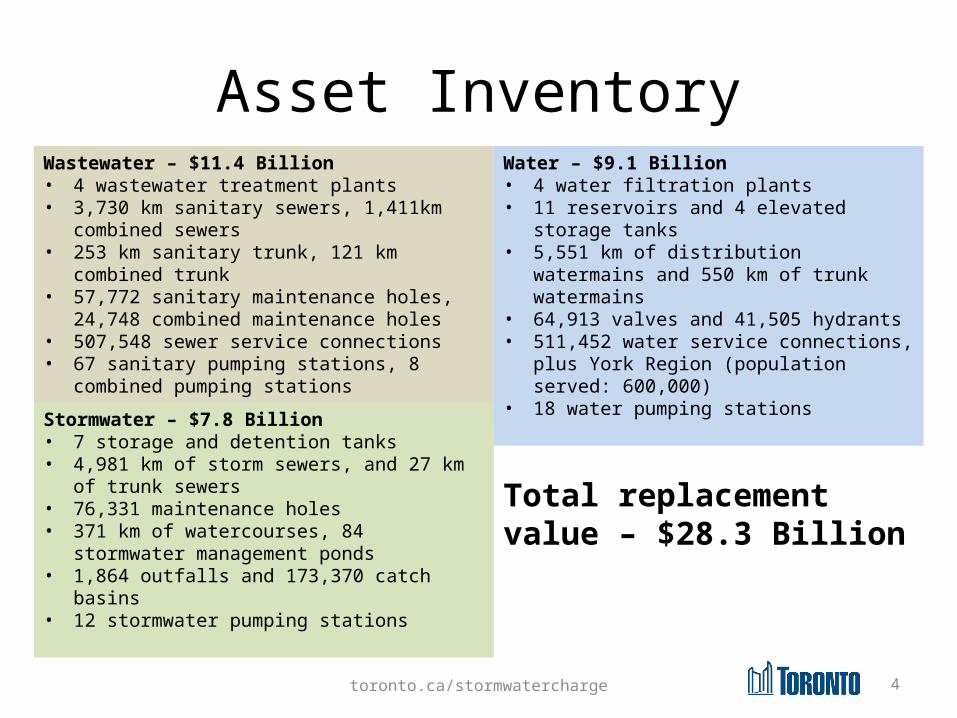
Asset InventoryWastewater – $11.4 Billion• 4 wastewater treatment plants• 3,730 km sanitary sewers, 1,411km
combined sewers• 253 km sanitary trunk, 121 km combined
trunk• 57,772 sanitary maintenance holes, 24,748
combined maintenance holes• 507,548 sewer service connections• 67 sanitary pumping stations, 8 combined
pumping stationsStormwater – $7.8 Billion• 7 storage and detention tanks• 4,981 km of storm sewers, and 27 km of
trunk sewers• 76,331 maintenance holes• 371 km of watercourses, 84 stormwater
management ponds• 1,864 outfalls and 173,370 catch basins• 12 stormwater pumping stations
Water – $9.1 Billion• 4 water filtration plants• 11 reservoirs and 4 elevated storage
tanks• 5,551 km of distribution watermains and
550 km of trunk watermains• 64,913 valves and 41,505 hydrants • 511,452 water service connections, plus
York Region (population served: 600,000)
• 18 water pumping stations
Total replacement value – $28.3 Billion
toronto.ca/stormwatercharge 5
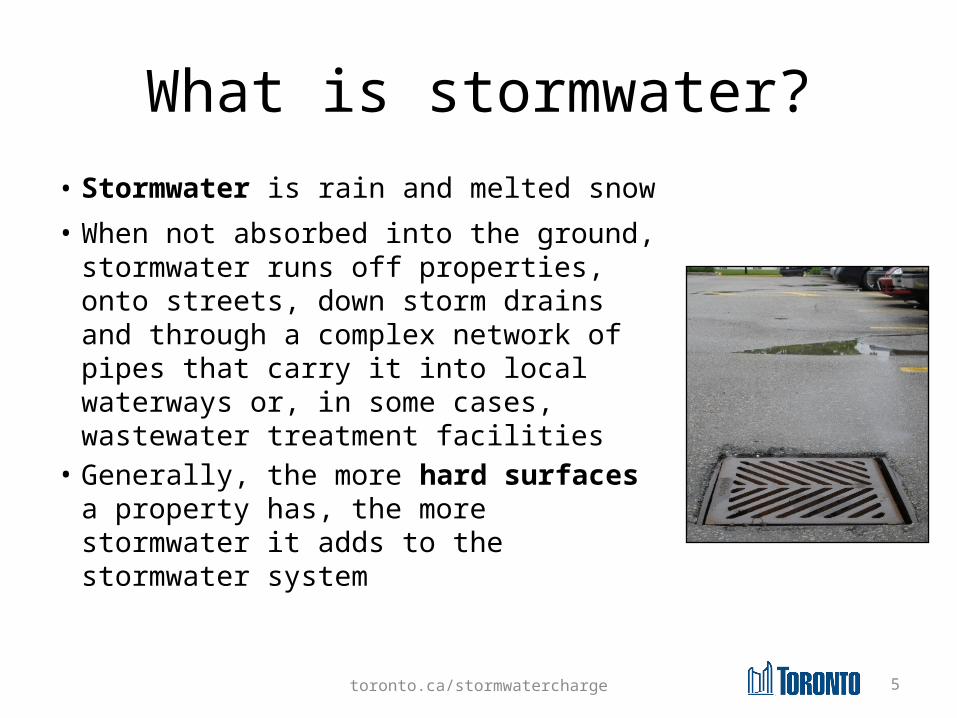
What is stormwater?• Stormwater is rain and melted
snow• When not absorbed into the ground,
stormwater runs off properties, onto streets, down storm drains and through a complex network of pipes that carry it into local waterways or, in some cases, wastewater treatment facilities
• Generally, the more hard surfaces a property has, the more stormwater it adds to the stormwater system
toronto.ca/stormwatercharge 6
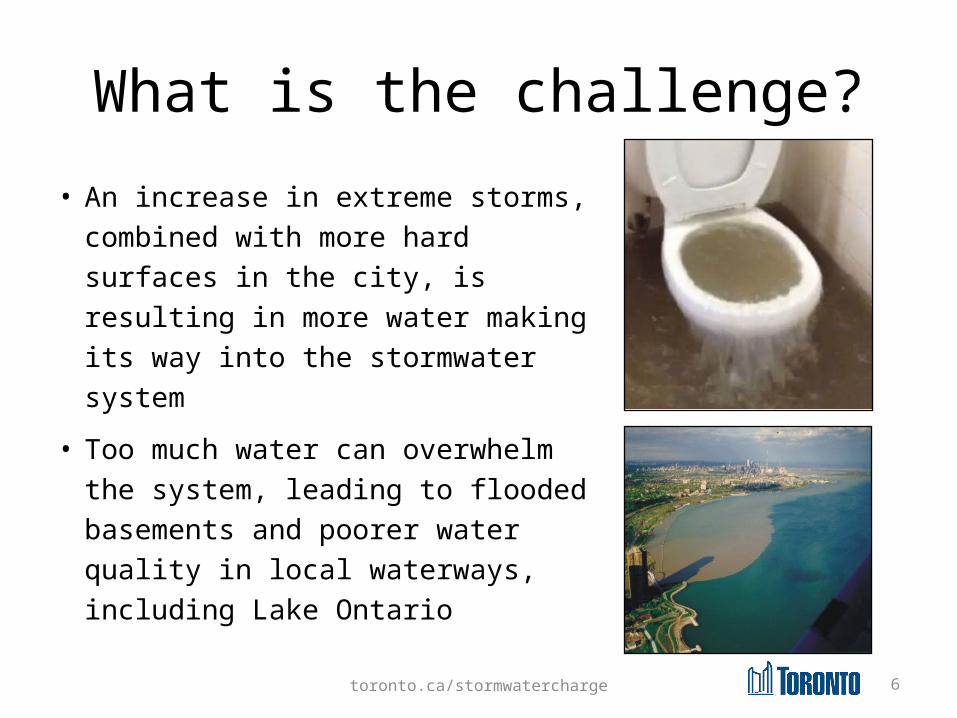
What is the challenge?• An increase in extreme storms,
combined with more hard surfaces in the city, is resulting in more water making its way into the stormwater system
• Too much water can overwhelm the system, leading to flooded basements and poorer water quality in local waterways, including Lake Ontario
toronto.ca/stormwatercharge 7
How is the City managing stormwater?
• The Wet Weather Flow Master Plan (WWFMP) is a 25-year plan to reduce stormwater and protect the environment for healthy streams, rivers and Lake Ontario – $4.7 billion over more than 25 years
• Significant large scale projects in the WWFMP:o Don River and Central Waterfront Project –
underground infrastructure and a treatment facility to capture and treat polluted stormwater and sewer overflows before they enter Toronto's waterways – $1.6 billion
o Projects to help reduce basement flooding – $2 billion• Other stormwater management projects include installing
tanks and tunnels to intercept stormwater flows, new storm sewers, stormwater ponds, etc.
toronto.ca/stormwatercharge 8
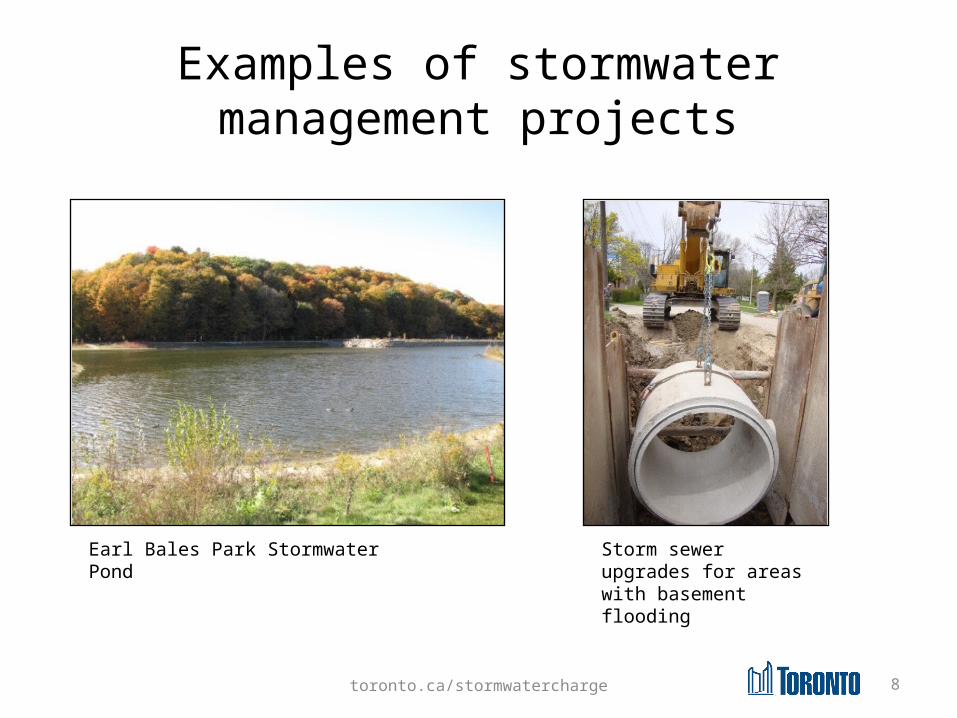
Examples of stormwater management projects
Earl Bales Park Stormwater Pond
Storm sewer upgrades for areas with basement flooding

toronto.ca/stormwatercharge 9
How are all of these services paid for?
• Pay-as-you-go: Toronto Water’s funding is a “pay-as-you-go” system (i.e., utility bills)
• Revenue: 93% of revenue comes from water bills – this is what pays for the services each year– The water rate is completely separate
from City of Toronto taxes
toronto.ca/stormwatercharge 10
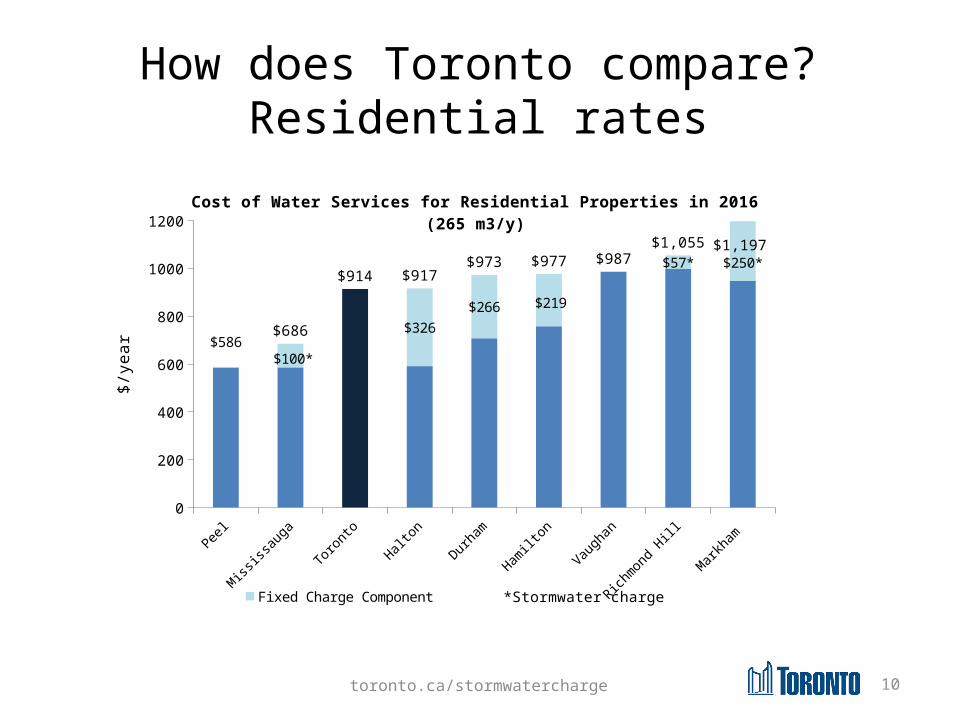
How does Toronto compare?Residential rates
Peel
Mississ
auga
Toronto
Halton
Durham
Hamilto
n
Vaugh
an
Richmon
d Hill
Markha
m 0
200
400
600
800
1000
1200
$586$100*
$326$266 $219
$57* $250*
$686
$914 $917$973 $977 $987
$1,055 $1,197
Cost of Water Services for Residential Properties in 2016 (265 m3/y)
Fixed Charge Component
$/ye
ar
*Stormwater charge
toronto.ca/stormwatercharge 11
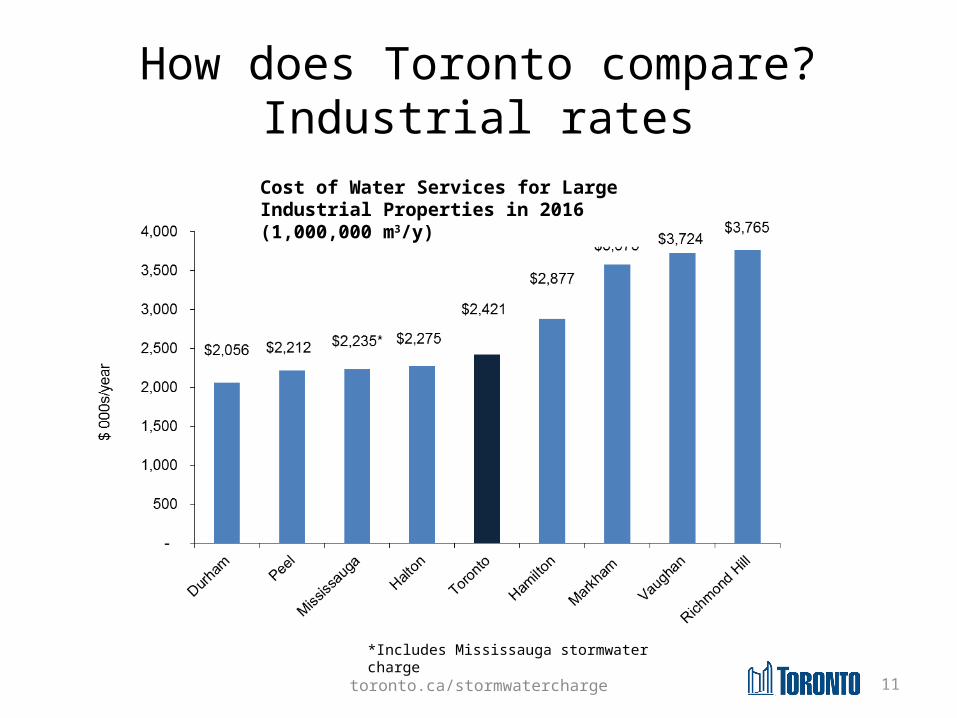
How does Toronto compare?Industrial rates
*Includes Mississauga stormwater charge
Cost of Water Services for Large Industrial Properties in 2016 (1,000,000 m3/y)
toronto.ca/stormwatercharge 12
What is a stormwater charge?• It is a charge:
– Based on impact to stormwater system– Dedicated to paying for stormwater management
• The model for the charge:– Divides properties into four categories
• (i) Residential; (ii) Apartment & Condo Buildings; (iii) Industrial, Commercial & Institutional; (iv) Large Properties
– Has various tiers based on property size within each category
• Exception: Large Properties will be examined individually– Calculates the average amount of hard surface
for each tier
toronto.ca/stormwatercharge 13
Why a stormwater charge?• Fair
– Based on surface stormwater runoff rather than water consumption
– Consumption water rates will decrease when SWC implemented
– Addresses economic development policy objectives for large water-using manufacturers and food processors
• Transparent– Transparency for cost of services provided and charges
paid• Dedicated
– Provides dedicated funding (the stormwater charge) for a dedicated service (stormwater management)
toronto.ca/stormwatercharge 14
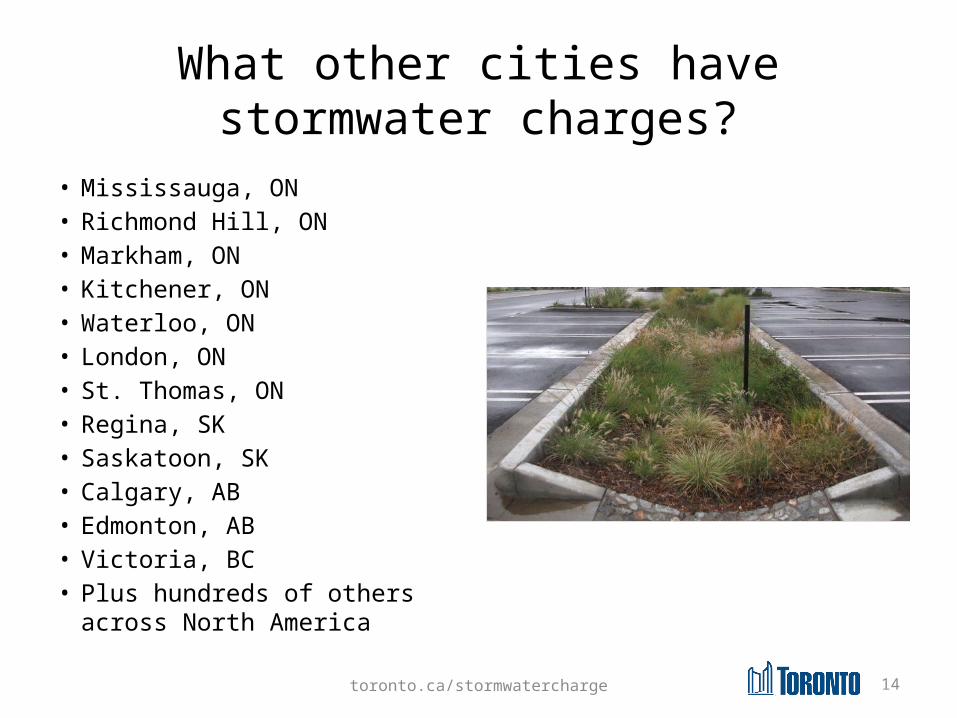
What other cities have stormwater charges?
• Mississauga, ON• Richmond Hill, ON• Markham, ON• Kitchener, ON• Waterloo, ON• London, ON• St. Thomas, ON• Regina, SK• Saskatoon, SK• Calgary, AB• Edmonton, AB• Victoria, BC• Plus hundreds of others
across North America
toronto.ca/stormwatercharge 15
City Council direction• December 2015: City Council
directed staff to develop an implementation plan for a stormwater charge and report back in the spring of 2017
• More info: http://app.toronto.ca/tmmis/viewAgendaItemHistory.do?item=2015.EX10.26
toronto.ca/stormwatercharge 16
Financing model• SWC implementation in 2019:
– Revenue neutral– Create a stormwater management reserve
using a portion of existing reserves– Allocate a portion of existing revenues for
stormwater management capital and operating costs
– Reduce water rate by 20%– Apply 3% annual increase to water rates
and SWC for 2020-2026
toronto.ca/stormwatercharge 17
Financing model (cont’d)
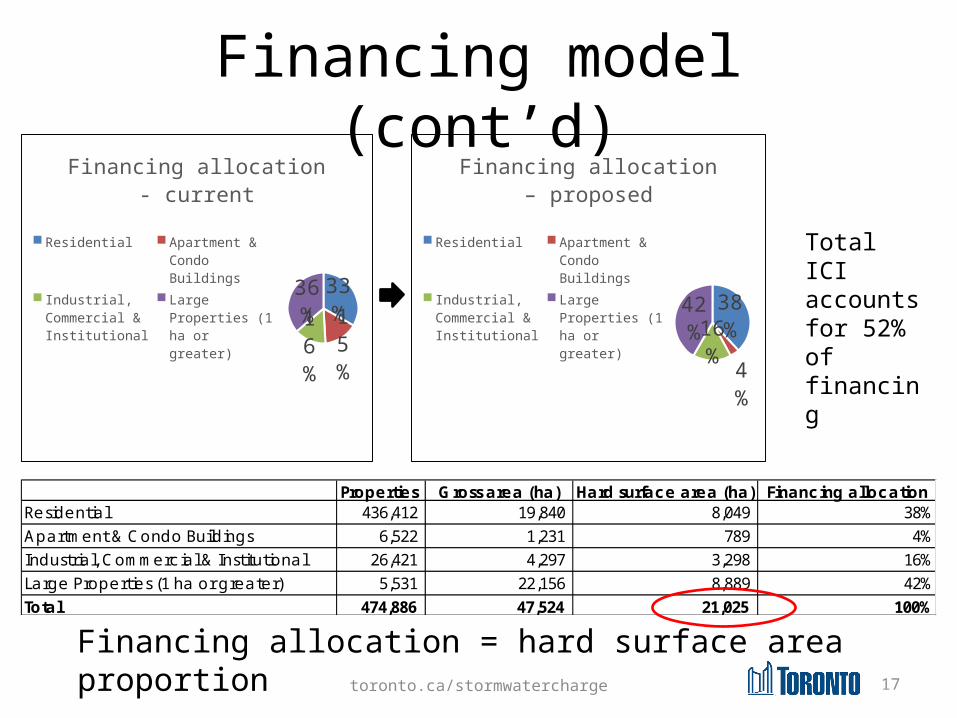
Financing allocation = hard surface area proportion
38%
4%
16%
42%
Financing allocation – proposed
ResidentialApartment & Condo BuildingsIndustrial, Commercial & InstitutionalLarge Properties (1 ha or greater)
Total ICI accounts for 52% of financing
Properties Gross area (ha) Hard surface area (ha) Financing allocationResidential 436,412 19,840 8,049 38%Apartment & Condo Buildings 6,522 1,231 789 4%Industrial, Commercial & Institutional 26,421 4,297 3,298 16%Large Properties (1 ha or greater) 5,531 22,156 8,889 42%Total 474,886 47,524 21,025 100%
33%
16%
15%
36%
Financing allocation - current
ResidentialApartment & Condo BuildingsIndustrial, Commercial & InstitutionalLarge Proper-ties (1 ha or greater)
toronto.ca/stormwatercharge 18
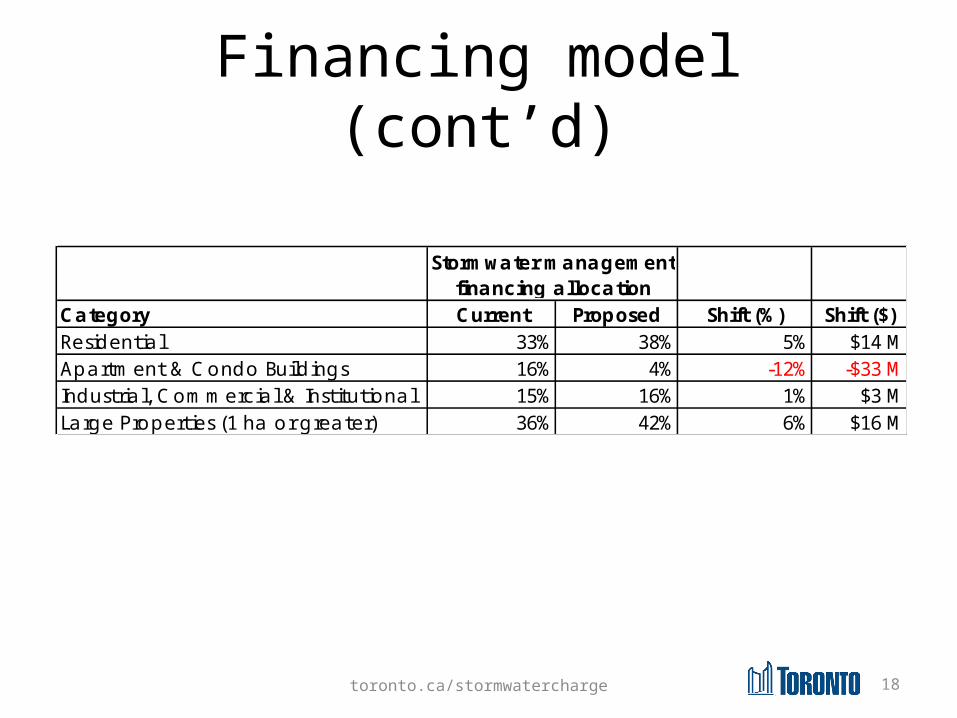
Financing model (cont’d)
Category Current Proposed Shift (%) Shift ($)Residential 33% 38% 5% $14 MApartment & Condo Buildings 16% 4% -12% -$33 MIndustrial, Commercial & Institutional 15% 16% 1% $3 MLarge Properties (1 ha or greater) 36% 42% 6% $16 M
Stormwater management financing allocation
toronto.ca/stormwatercharge 19
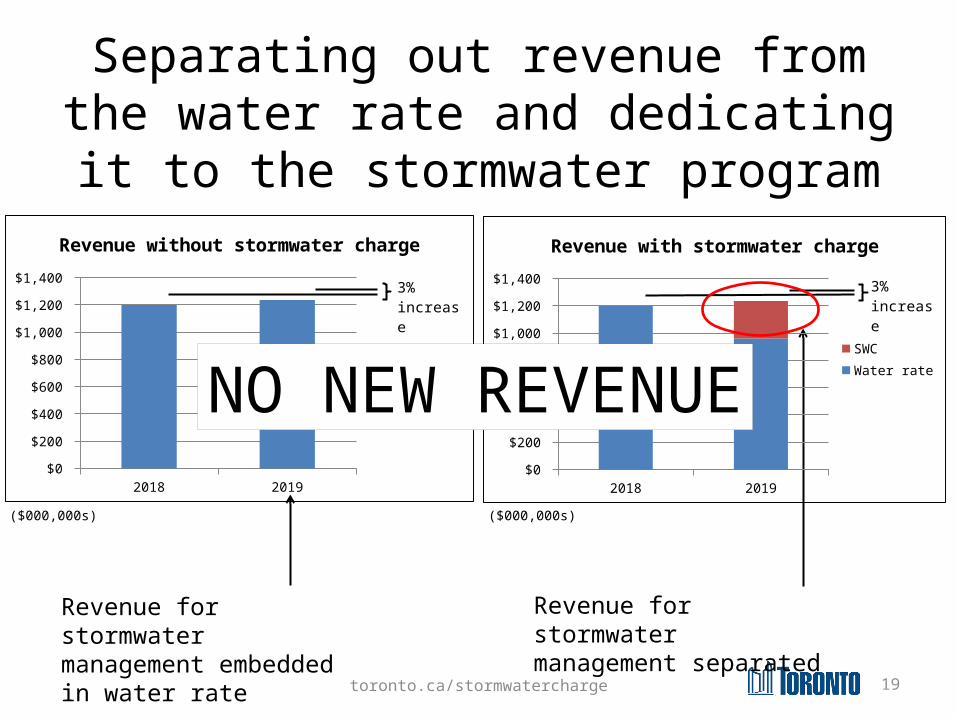
Separating out revenue from the water rate and dedicating it to the
stormwater program
Revenue for stormwater management embedded in water rate
Revenue for stormwater management separated
($000,000s) ($000,000s)2018 2019
$0 $200 $400 $600 $800
$1,000 $1,200 $1,400
Revenue without stormwater charge
Water rate
3% in-crease
2018 2019$0
$200
$400
$600
$800
$1,000
$1,200
$1,400 Revenue with stormwater charge
SWCWater rate
3% in-crease
NO NEW REVENUE
toronto.ca/stormwatercharge 20
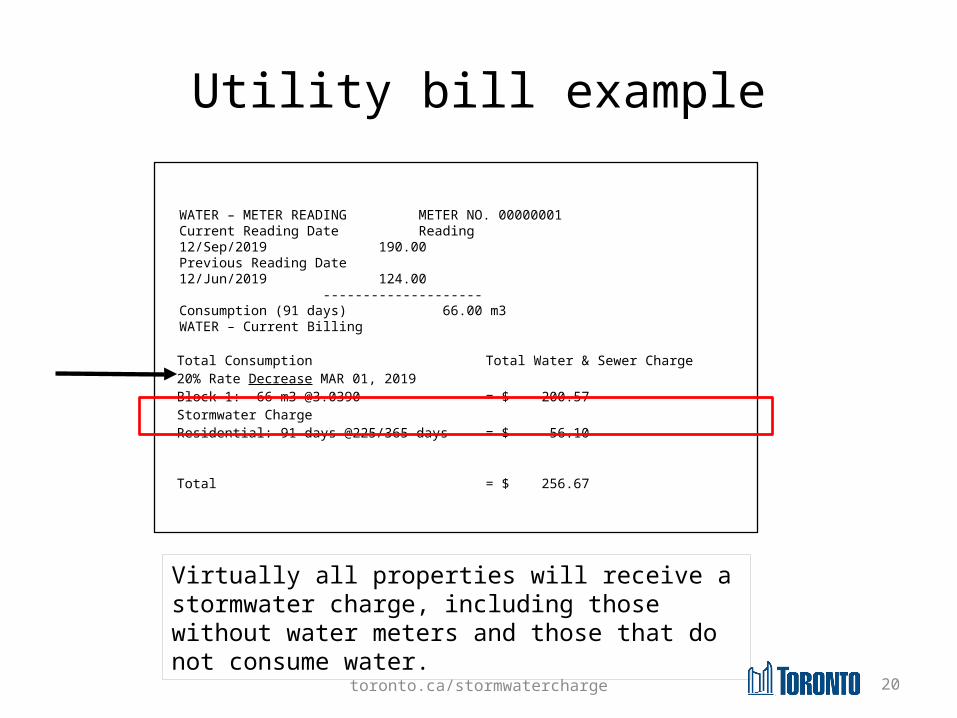
Utility bill example
Total Consumption Total Water & Sewer Charge20% Rate Decrease MAR 01, 2019Block 1: 66 m3 @3.0390 = $ 200.57Stormwater ChargeResidential: 91 days @225/365 days = $ 56.10
Total = $ 256.67
WATER – METER READING METER NO. 00000001Current Reading Date Reading12/Sep/2019 190.00Previous Reading Date12/Jun/2019 124.00
--------------------Consumption (91 days) 66.00 m3WATER – Current Billing
Virtually all properties will receive a stormwater charge, including those without water meters and those that do not consume water.
toronto.ca/stormwatercharge 21
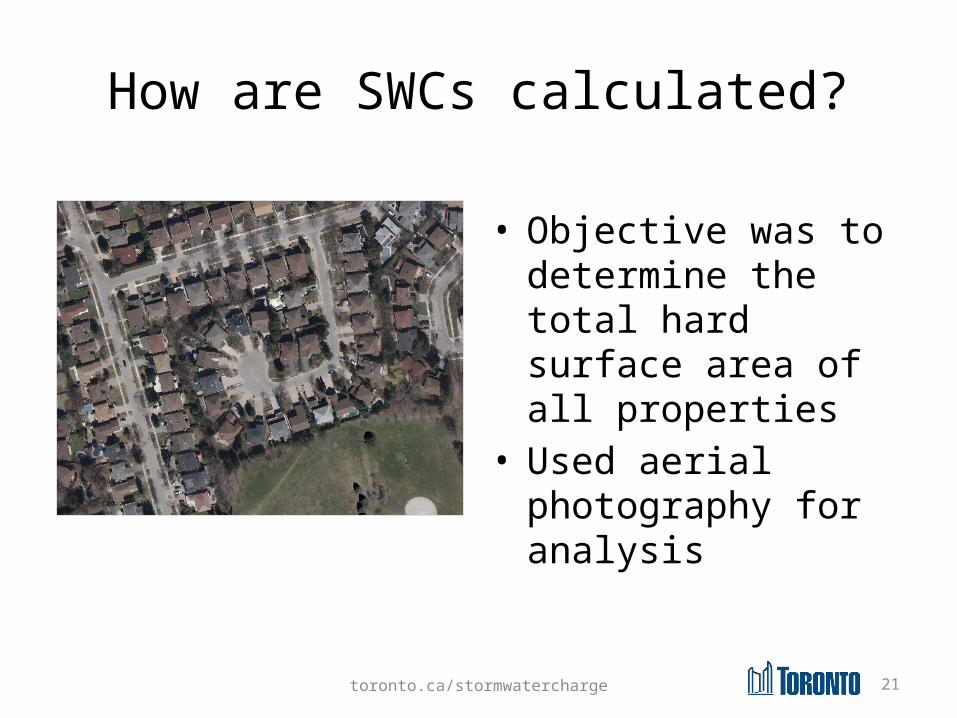
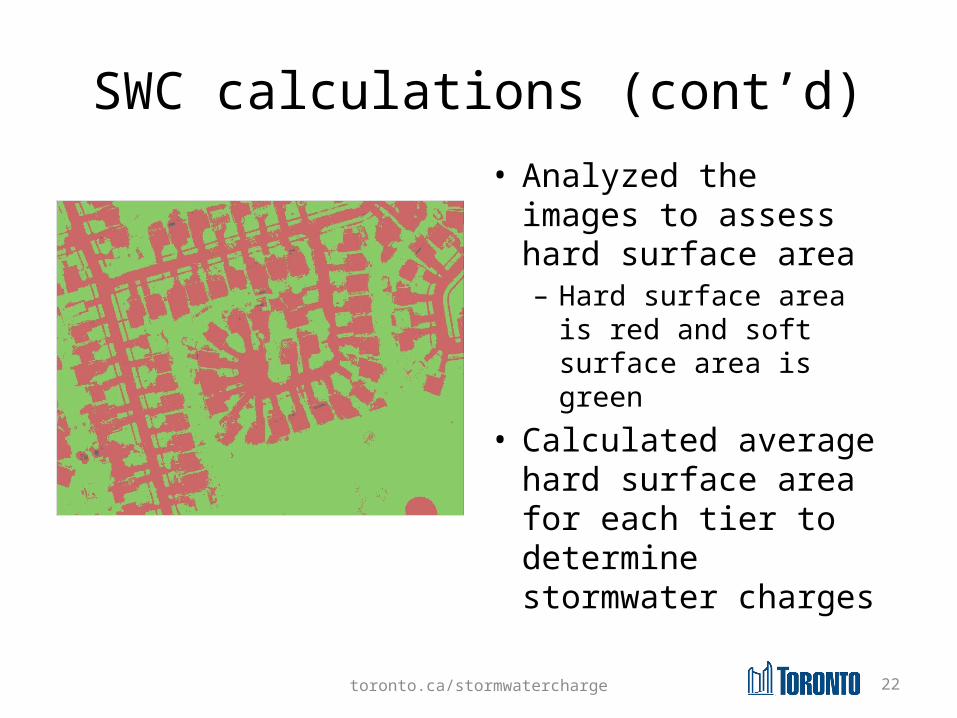
How are SWCs calculated?
• Objective was to determine the total hard surface area of all properties
• Used aerial photography for analysis
toronto.ca/stormwatercharge 22
SWC calculations (cont’d)• Analyzed the images
to assess hard surface area– Hard surface area is
red and soft surface area is green
• Calculated average hard surface area for each tier to determine stormwater charges
toronto.ca/stormwatercharge 23
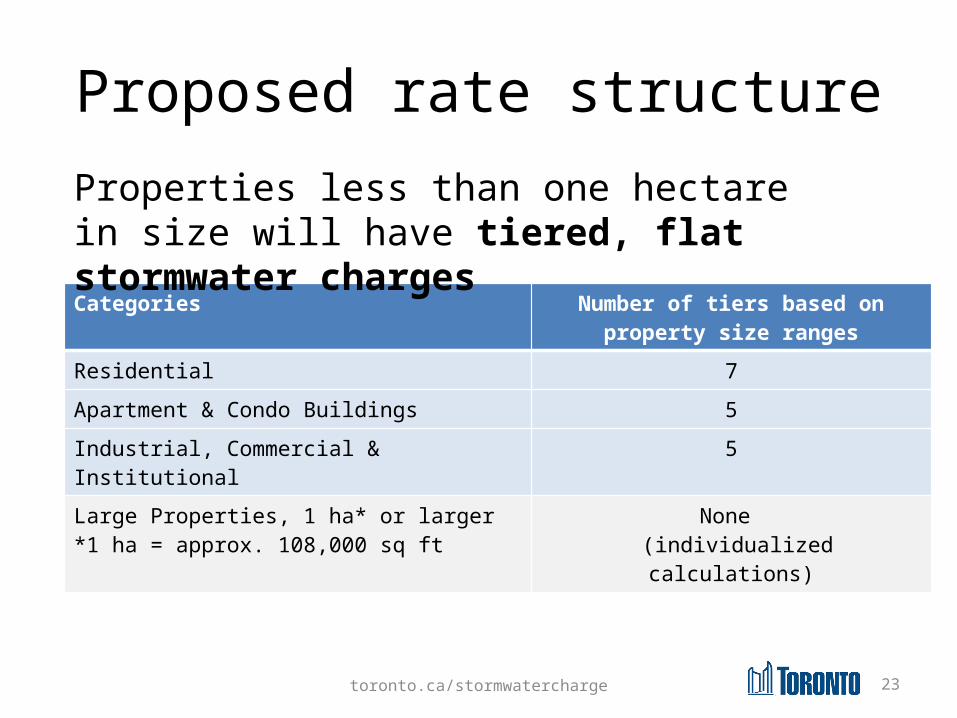
Proposed rate structure
Categories Number of tiers based on property size ranges
Residential 7Apartment & Condo Buildings 5Industrial, Commercial & Institutional 5Large Properties, 1 ha* or larger*1 ha = approx. 108,000 sq ft
None (individualized calculations)
Properties less than one hectare in size will have tiered, flat stormwater charges
toronto.ca/stormwatercharge 24
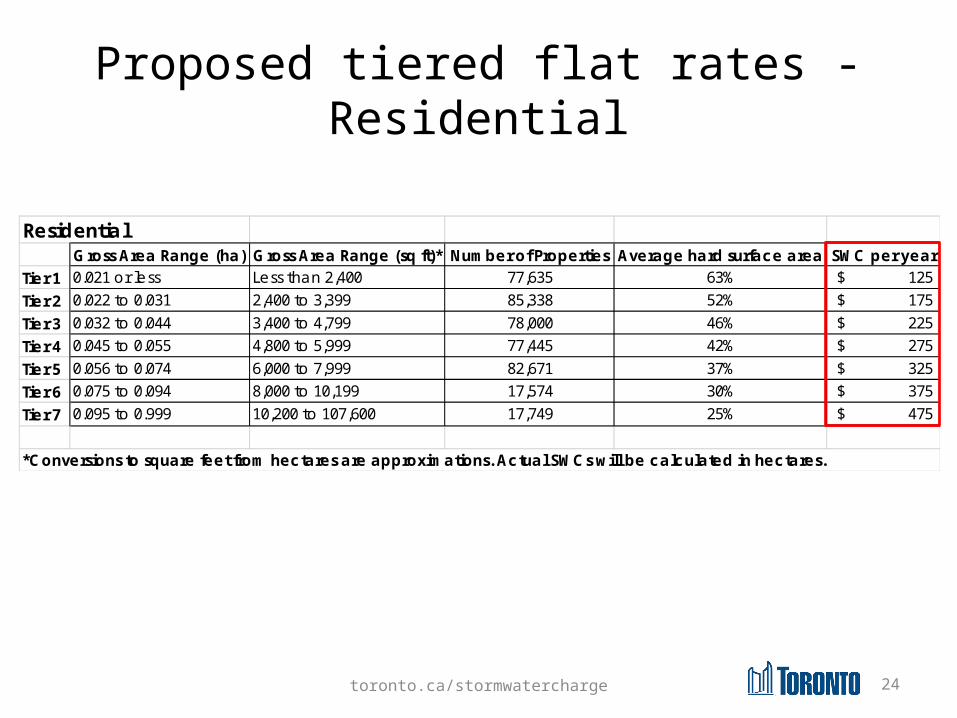
Proposed tiered flat rates - Residential
ResidentialGross Area Range (ha) Gross Area Range (sq ft)* Number of Properties Average hard surface area SWC per year
Tier 1 0.021 or less Less than 2,400 77,635 63% 125$ Tier 2 0.022 to 0.031 2,400 to 3,399 85,338 52% 175$ Tier 3 0.032 to 0.044 3,400 to 4,799 78,000 46% 225$ Tier 4 0.045 to 0.055 4,800 to 5,999 77,445 42% 275$ Tier 5 0.056 to 0.074 6,000 to 7,999 82,671 37% 325$ Tier 6 0.075 to 0.094 8,000 to 10,199 17,574 30% 375$ Tier 7 0.095 to 0.999 10,200 to 107,600 17,749 25% 475$
*Conversions to square feet from hectares are approximations. Actual SWCs will be calculated in hectares.
toronto.ca/stormwatercharge 25
Proposed tiered flat rates – Apartment & Condo Buildings
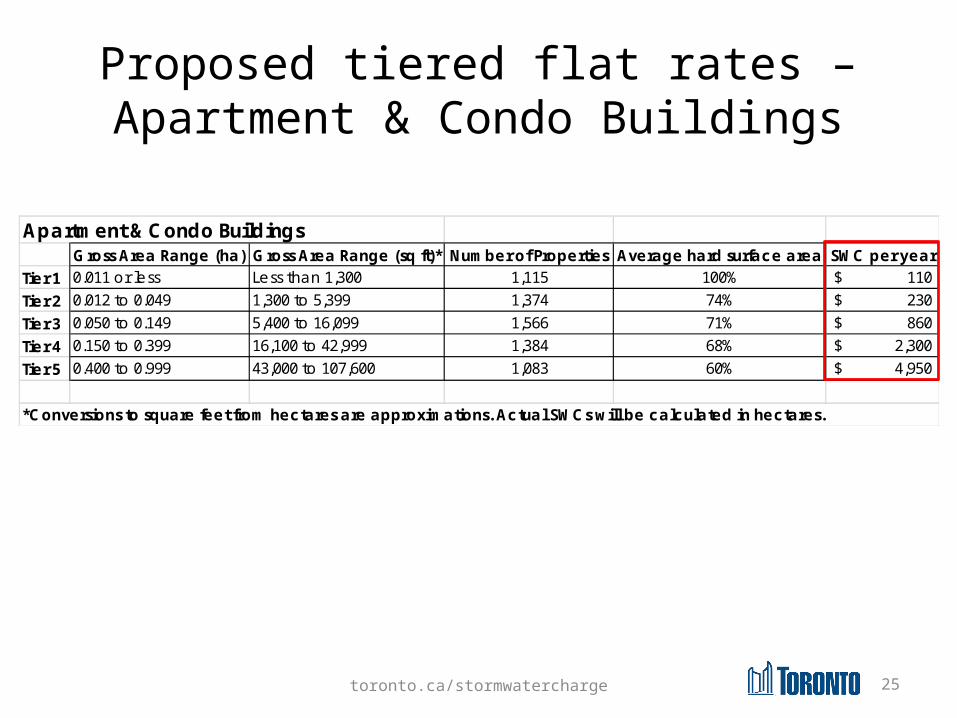
Apartment & Condo BuildingsGross Area Range (ha) Gross Area Range (sq ft)* Number of Properties Average hard surface area SWC per year
Tier 1 0.011 or less Less than 1,300 1,115 100% 110$ Tier 2 0.012 to 0.049 1,300 to 5,399 1,374 74% 230$ Tier 3 0.050 to 0.149 5,400 to 16,099 1,566 71% 860$ Tier 4 0.150 to 0.399 16,100 to 42,999 1,384 68% 2,300$ Tier 5 0.400 to 0.999 43,000 to 107,600 1,083 60% 4,950$
*Conversions to square feet from hectares are approximations. Actual SWCs will be calculated in hectares.
toronto.ca/stormwatercharge 26
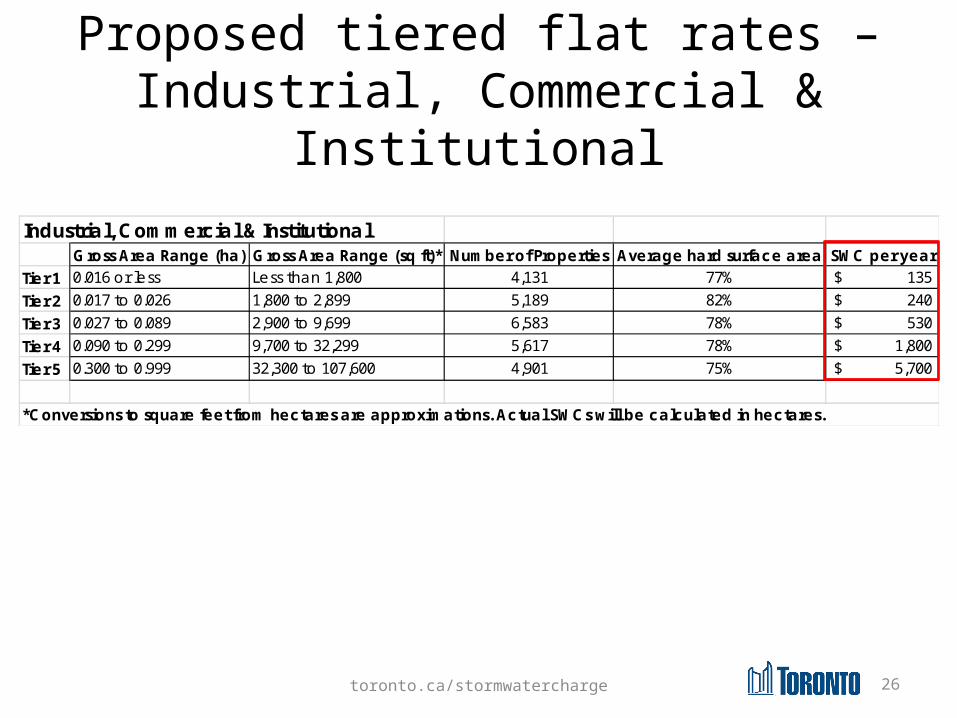
Proposed tiered flat rates – Industrial, Commercial &
InstitutionalIndustrial, Commercial & Institutional
Gross Area Range (ha) Gross Area Range (sq ft)* Number of Properties Average hard surface area SWC per yearTier 1 0.016 or less Less than 1,800 4,131 77% 135$ Tier 2 0.017 to 0.026 1,800 to 2,899 5,189 82% 240$ Tier 3 0.027 to 0.089 2,900 to 9,699 6,583 78% 530$ Tier 4 0.090 to 0.299 9,700 to 32,299 5,617 78% 1,800$ Tier 5 0.300 to 0.999 32,300 to 107,600 4,901 75% 5,700$
*Conversions to square feet from hectares are approximations. Actual SWCs will be calculated in hectares.
toronto.ca/stormwatercharge 27
Proposed rate structure Large Properties 1 ha* in size or greater:• 5,500 properties (1% of all properties)
account for 42% of total hard surface area• Stormwater charge will be based on
individualized assessments of hard surface area
*1 ha = approx. 108,000 sq ft
toronto.ca/stormwatercharge 28
Incentives• Incentives will be offered to Large
Properties (1 ha or larger)• Applicants will have to demonstrate
management of water quantity and quality
• The maximum available incentive will be 50% of the SWC– Due to fixed costs associated with
stormwater management program
toronto.ca/stormwatercharge 29
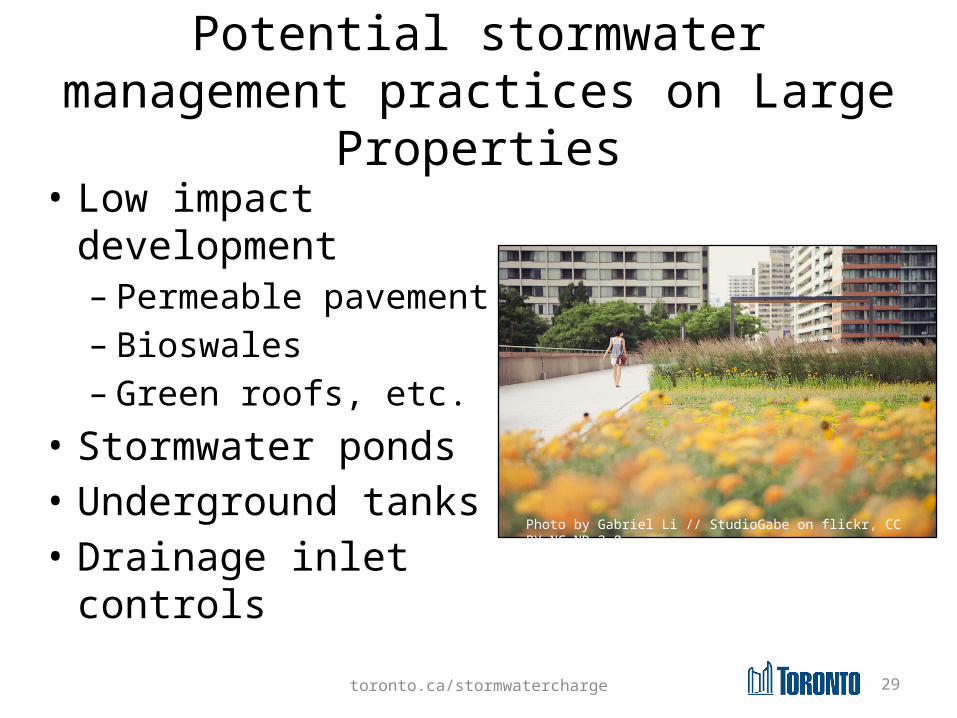
Potential stormwater management practices on Large Properties
• Low impact development– Permeable pavement– Bioswales– Green roofs, etc.
• Stormwater ponds• Underground tanks• Drainage inlet
controls
Photo by Gabriel Li // StudioGabe on flickr, CC BY-NC-ND 2.0
toronto.ca/stormwatercharge 30
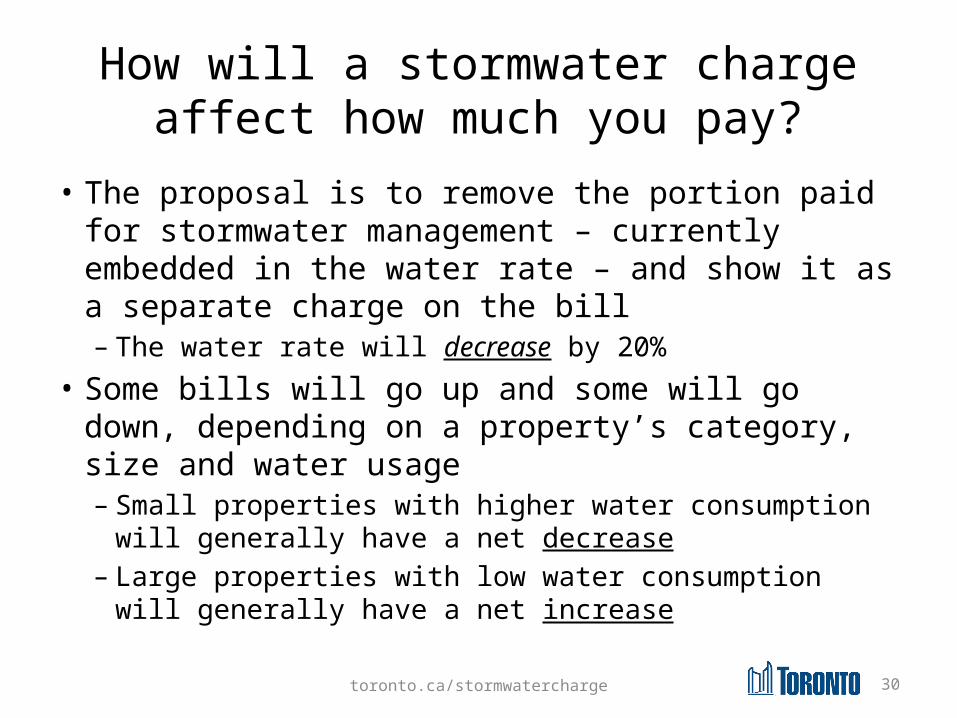
How will a stormwater charge affect how much you pay?
• The proposal is to remove the portion paid for stormwater management – currently embedded in the water rate – and show it as a separate charge on the bill– The water rate will decrease by 20%
• Some bills will go up and some will go down, depending on a property’s category, size and water usage– Small properties with higher water consumption will
generally have a net decrease– Large properties with low water consumption will
generally have a net increase
toronto.ca/stormwatercharge 31
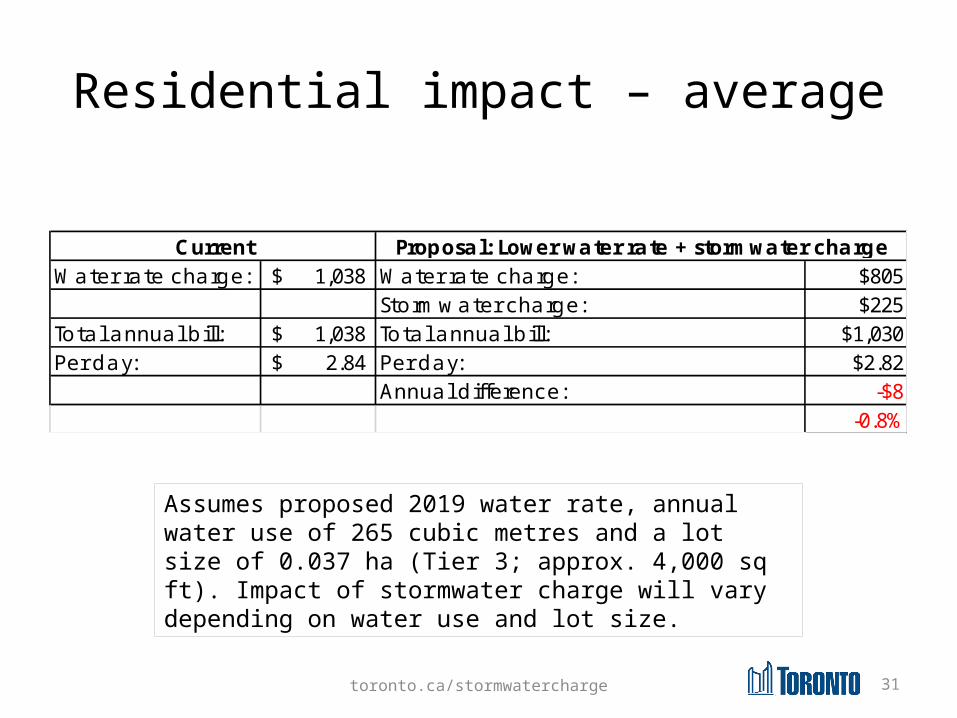
Residential impact – average
Water rate charge: 1,038$ Water rate charge: $805Stormwater charge: $225
Total annual bill: 1,038$ Total annual bill: $1,030Per day: 2.84$ Per day: $2.82
Annual difference: -$8-0.8%
Current Proposal: Lower water rate + stormwater charge
Assumes proposed 2019 water rate, annual water use of 265 cubic metres and a lot size of 0.037 ha (Tier 3; approx. 4,000 sq ft). Impact of stormwater charge will vary depending on water use and lot size.
toronto.ca/stormwatercharge 32
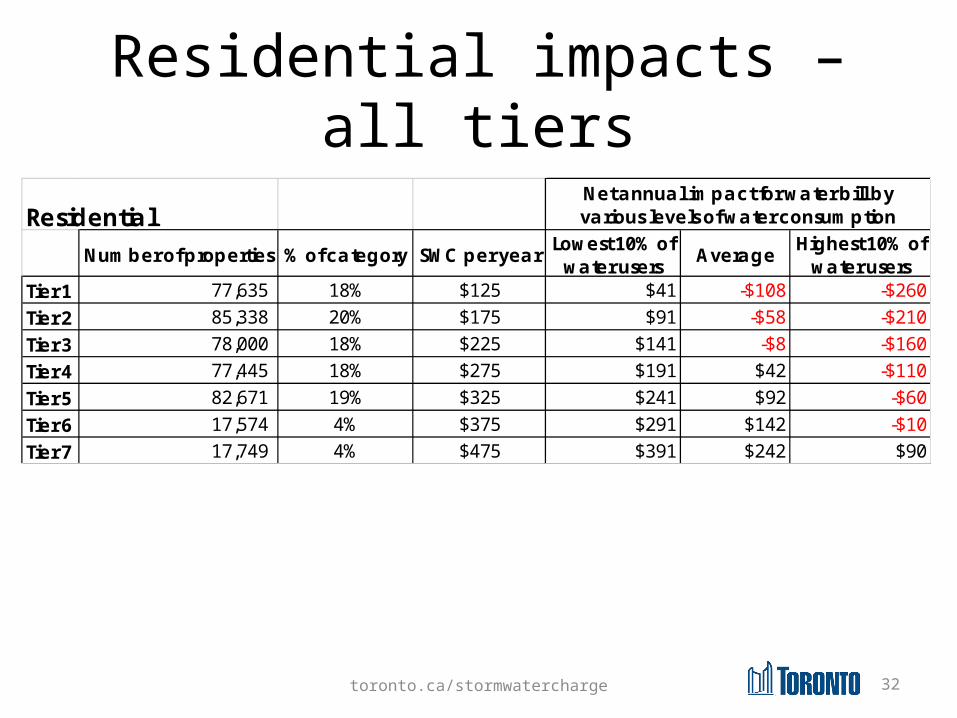
Residential impacts – all tiers
ResidentialNumber of properties % of category SWC per year Lowest 10% of
water users Average Highest 10% of water users
Tier 1 77,635 18% $125 $41 -$108 -$260Tier 2 85,338 20% $175 $91 -$58 -$210Tier 3 78,000 18% $225 $141 -$8 -$160Tier 4 77,445 18% $275 $191 $42 -$110Tier 5 82,671 19% $325 $241 $92 -$60Tier 6 17,574 4% $375 $291 $142 -$10Tier 7 17,749 4% $475 $391 $242 $90
Net annual impact for water bill by various levels of water consumption
toronto.ca/stormwatercharge 33
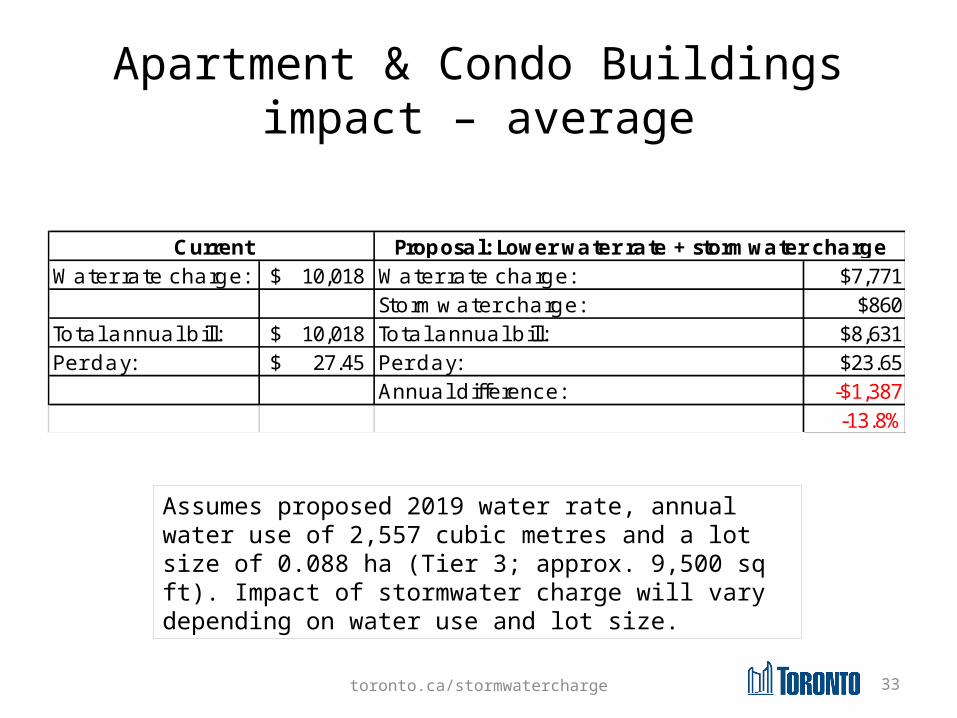
Apartment & Condo Buildings impact – average
Water rate charge: 10,018$ Water rate charge: $7,771Stormwater charge: $860
Total annual bill: 10,018$ Total annual bill: $8,631Per day: 27.45$ Per day: $23.65
Annual difference: -$1,387-13.8%
Current Proposal: Lower water rate + stormwater charge
Assumes proposed 2019 water rate, annual water use of 2,557 cubic metres and a lot size of 0.088 ha (Tier 3; approx. 9,500 sq ft). Impact of stormwater charge will vary depending on water use and lot size.
toronto.ca/stormwatercharge 34
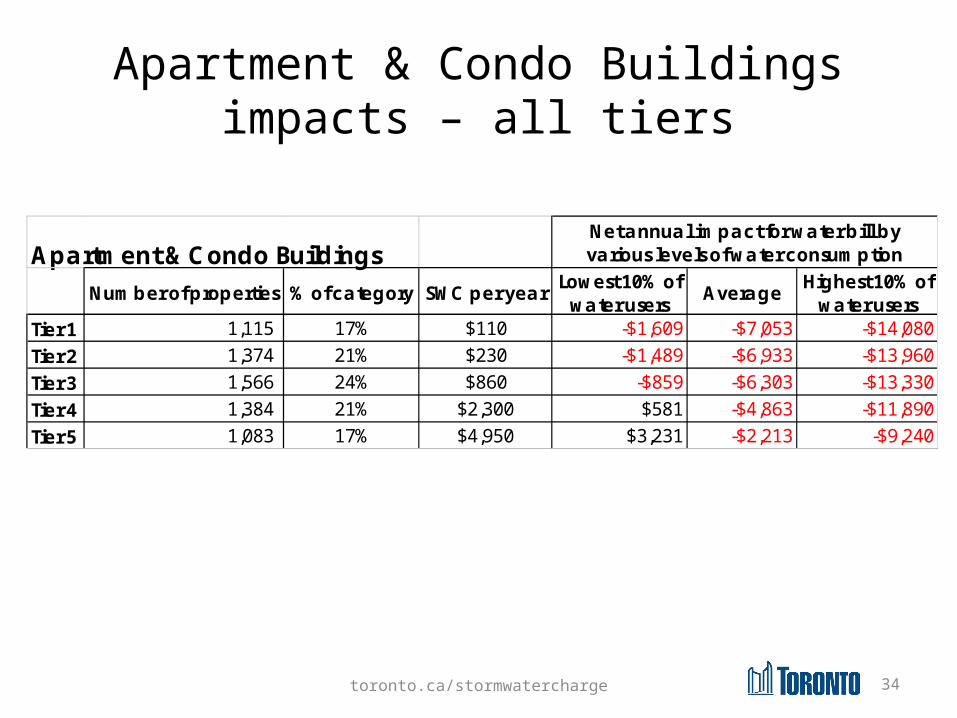
Apartment & Condo Buildings impacts – all tiers
Apartment & Condo BuildingsNumber of properties % of category SWC per year Lowest 10% of
water users Average Highest 10% of water users
Tier 1 1,115 17% $110 -$1,609 -$7,053 -$14,080Tier 2 1,374 21% $230 -$1,489 -$6,933 -$13,960Tier 3 1,566 24% $860 -$859 -$6,303 -$13,330Tier 4 1,384 21% $2,300 $581 -$4,863 -$11,890Tier 5 1,083 17% $4,950 $3,231 -$2,213 -$9,240
Net annual impact for water bill by various levels of water consumption
toronto.ca/stormwatercharge 35
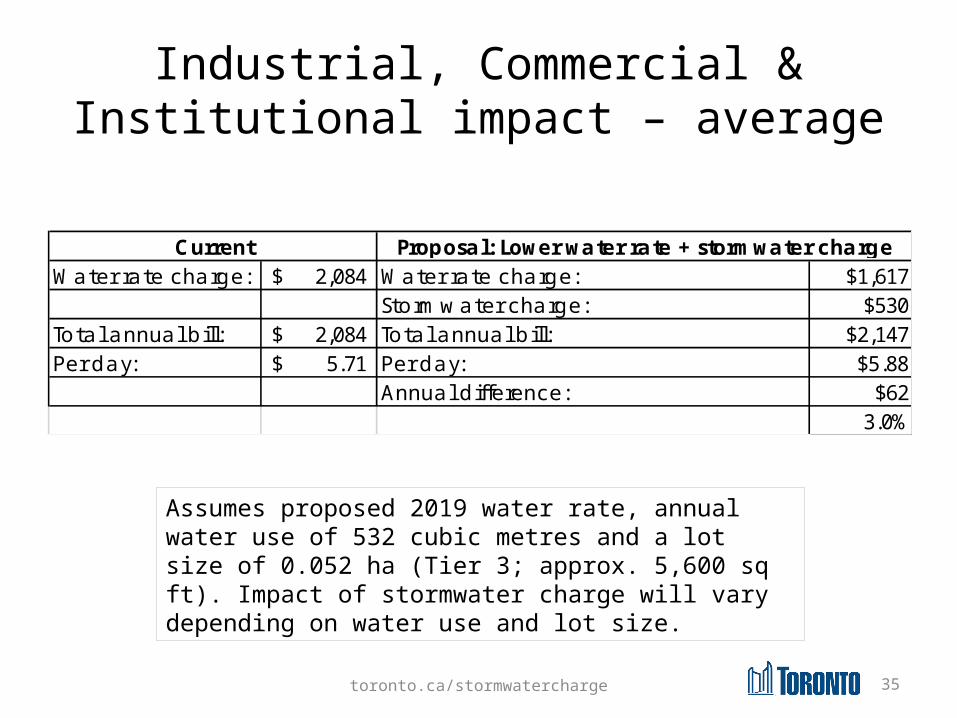
Industrial, Commercial & Institutional impact – average
Water rate charge: 2,084$ Water rate charge: $1,617Stormwater charge: $530
Total annual bill: 2,084$ Total annual bill: $2,147Per day: 5.71$ Per day: $5.88
Annual difference: $623.0%
Current Proposal: Lower water rate + stormwater charge
Assumes proposed 2019 water rate, annual water use of 532 cubic metres and a lot size of 0.052 ha (Tier 3; approx. 5,600 sq ft). Impact of stormwater charge will vary depending on water use and lot size.
toronto.ca/stormwatercharge 36
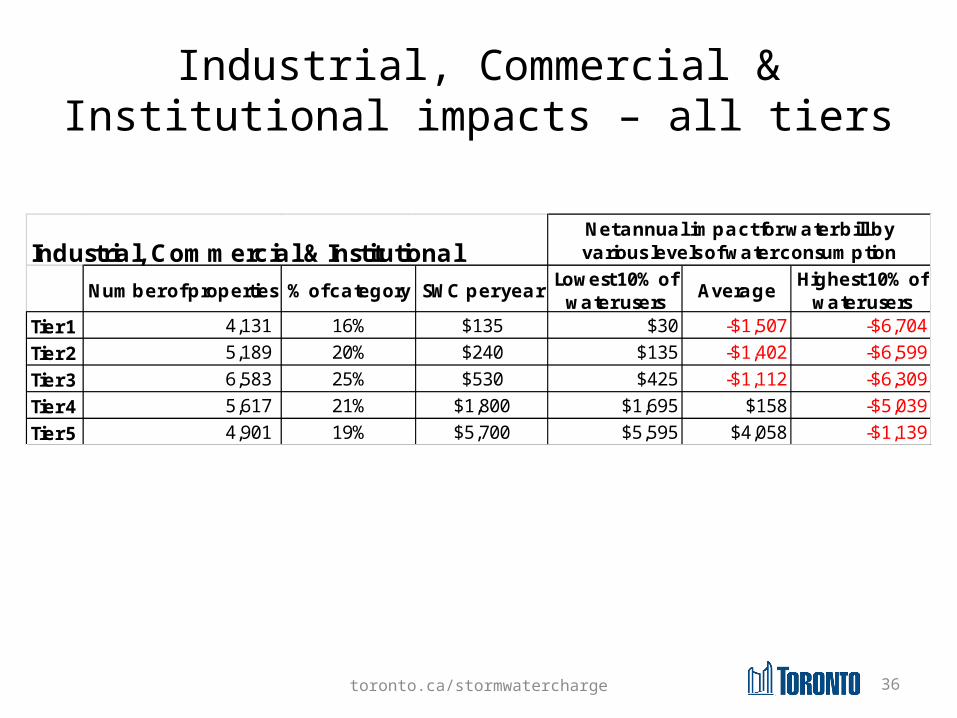
Industrial, Commercial & Institutional impacts – all tiers
Industrial, Commercial & InstitutionalNumber of properties % of category SWC per year Lowest 10% of
water users Average Highest 10% of water users
Tier 1 4,131 16% $135 $30 -$1,507 -$6,704Tier 2 5,189 20% $240 $135 -$1,402 -$6,599Tier 3 6,583 25% $530 $425 -$1,112 -$6,309Tier 4 5,617 21% $1,800 $1,695 $158 -$5,039Tier 5 4,901 19% $5,700 $5,595 $4,058 -$1,139
Net annual impact for water bill by various levels of water consumption
toronto.ca/stormwatercharge 37
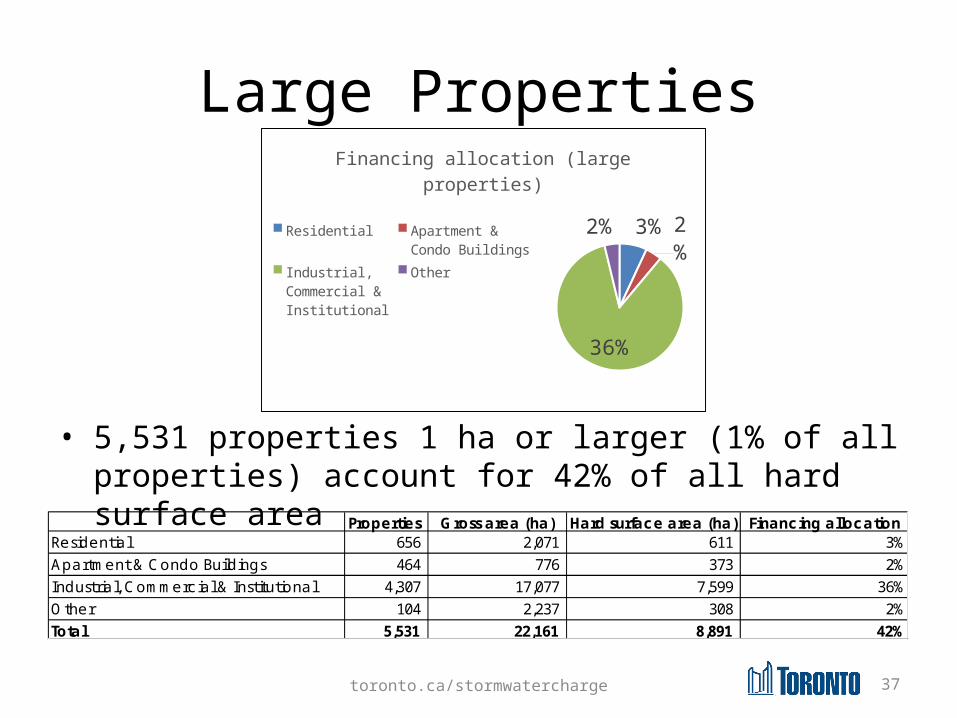
Large Properties
• 5,531 properties 1 ha or larger (1% of all properties) account for 42% of all hard surface area
3%2%
36%
2%
Financing allocation (large proper-ties)
ResidentialApartment & Condo BuildingsIndustrial, Com-mercial & Institu-tionalOther
Properties Gross area (ha) Hard surface area (ha) Financing allocationResidential 656 2,071 611 3%Apartment & Condo Buildings 464 776 373 2%Industrial, Commercial & Institutional 4,307 17,077 7,599 36%Other 104 2,237 308 2%Total 5,531 22,161 8,891 42%
toronto.ca/stormwatercharge 38
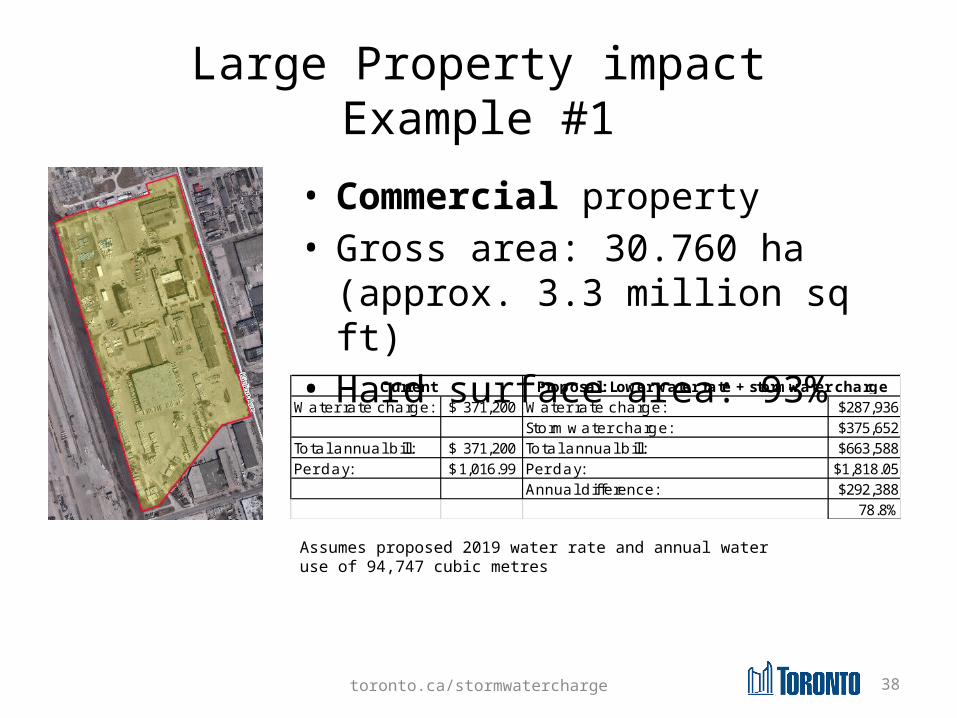
Large Property impactExample #1
• Commercial property• Gross area: 30.760 ha
(approx. 3.3 million sq ft)• Hard surface area: 93%
Water rate charge: 371,200$ Water rate charge: $287,936Stormwater charge: $375,652
Total annual bill: 371,200$ Total annual bill: $663,588Per day: 1,016.99$ Per day: $1,818.05
Annual difference: $292,38878.8%
Current Proposal: Lower water rate + stormwater charge
Assumes proposed 2019 water rate and annual water use of 94,747 cubic metres
toronto.ca/stormwatercharge 39
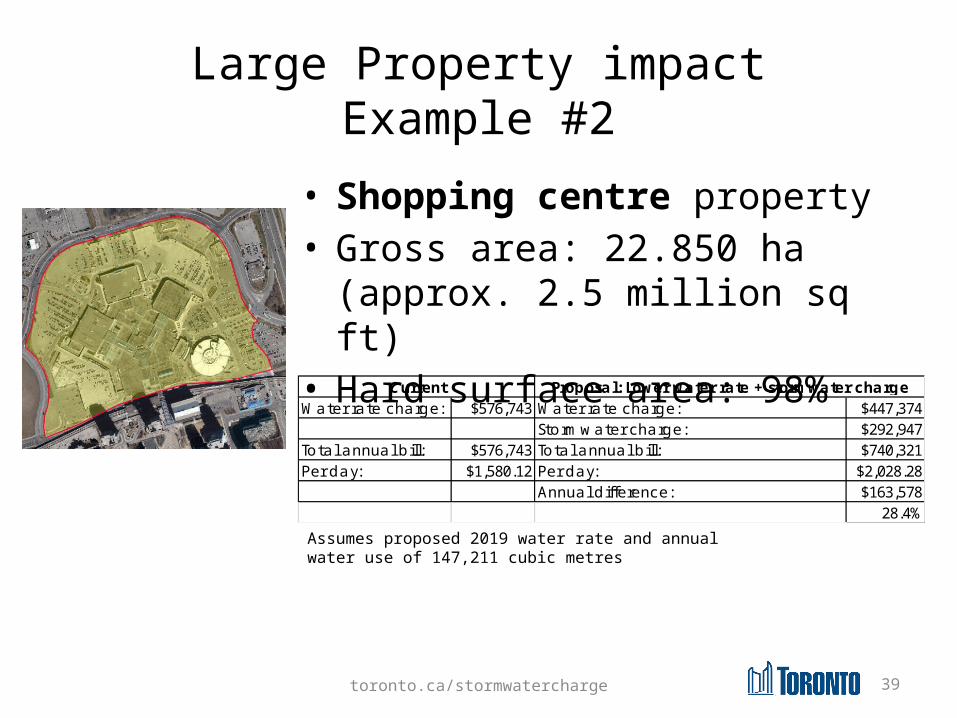
Large Property impactExample #2
• Shopping centre property• Gross area: 22.850 ha
(approx. 2.5 million sq ft)• Hard surface area: 98%
Assumes proposed 2019 water rate and annual water use of 147,211 cubic metres
Water rate charge: $576,743 Water rate charge: $447,374Stormwater charge: $292,947
Total annual bill: $576,743 Total annual bill: $740,321Per day: $1,580.12 Per day: $2,028.28
Annual difference: $163,57828.4%
Current Proposal: Lower water rate + stormwater charge
toronto.ca/stormwatercharge 40
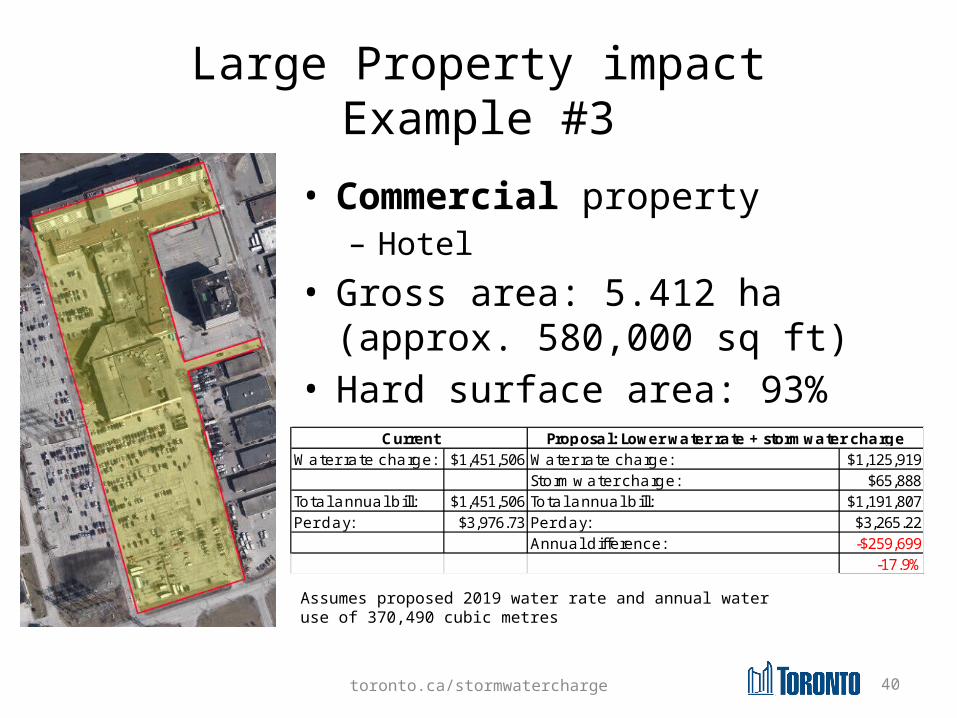
Large Property impactExample #3
• Commercial property– Hotel
• Gross area: 5.412 ha (approx. 580,000 sq ft)
• Hard surface area: 93%
Assumes proposed 2019 water rate and annual water use of 370,490 cubic metres
Water rate charge: $1,451,506 Water rate charge: $1,125,919Stormwater charge: $65,888
Total annual bill: $1,451,506 Total annual bill: $1,191,807Per day: $3,976.73 Per day: $3,265.22
Annual difference: -$259,699-17.9%
Current Proposal: Lower water rate + stormwater charge
toronto.ca/stormwatercharge 41
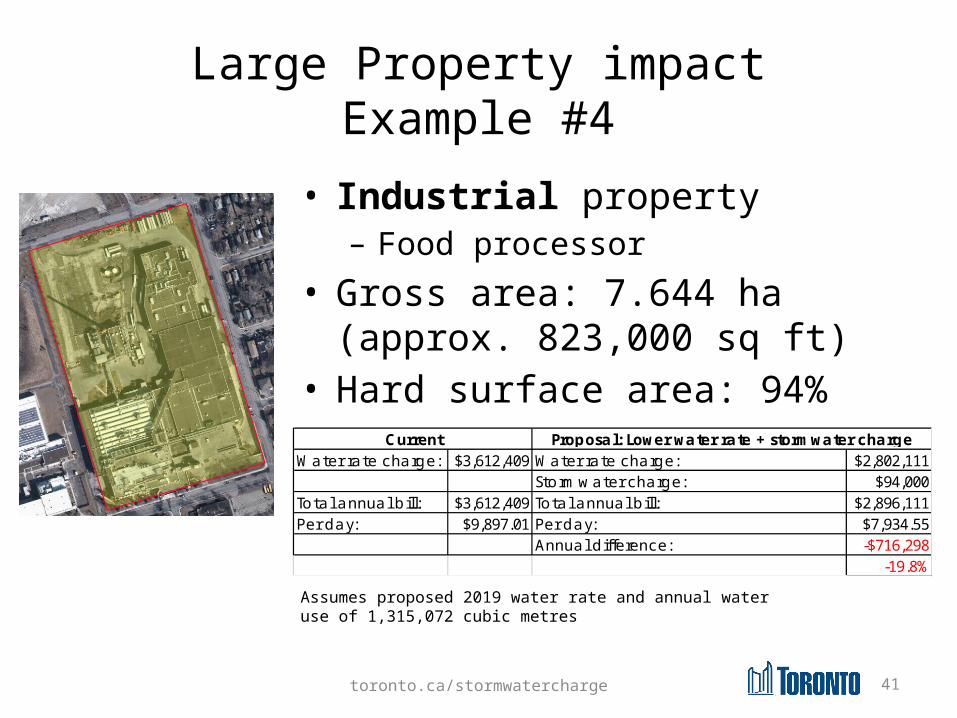
Large Property impactExample #4
• Industrial property– Food processor
• Gross area: 7.644 ha (approx. 823,000 sq ft)
• Hard surface area: 94%
Assumes proposed 2019 water rate and annual water use of 1,315,072 cubic metres
Water rate charge: $3,612,409 Water rate charge: $2,802,111Stormwater charge: $94,000
Total annual bill: $3,612,409 Total annual bill: $2,896,111Per day: $9,897.01 Per day: $7,934.55
Annual difference: -$716,298-19.8%
Current Proposal: Lower water rate + stormwater charge
toronto.ca/stormwatercharge 42
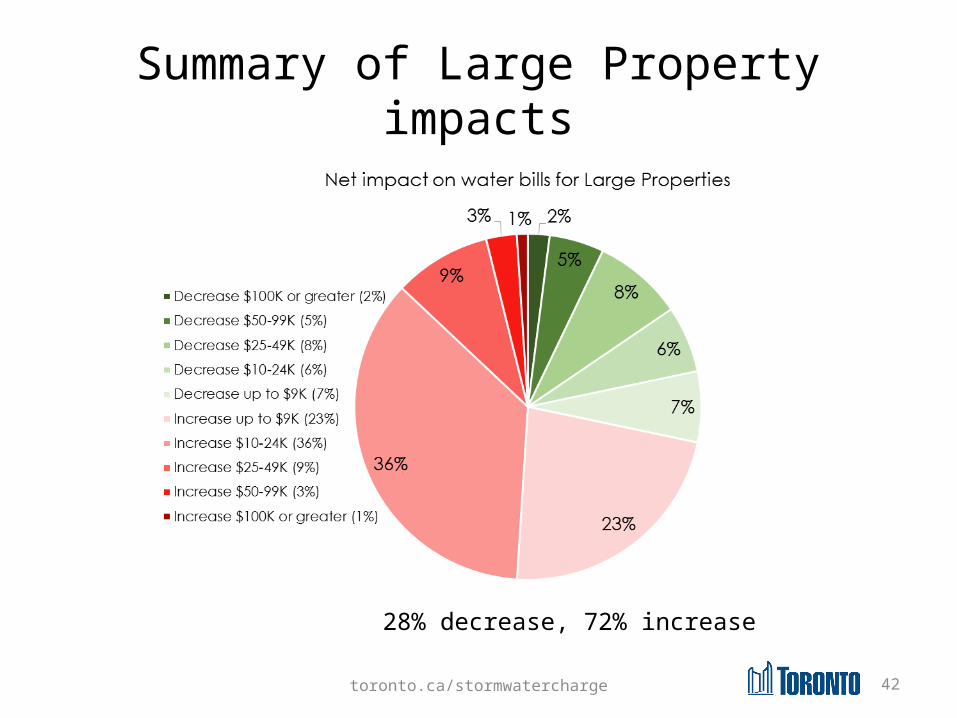
Summary of Large Property impacts
28% decrease, 72% increase
toronto.ca/stormwatercharge 43
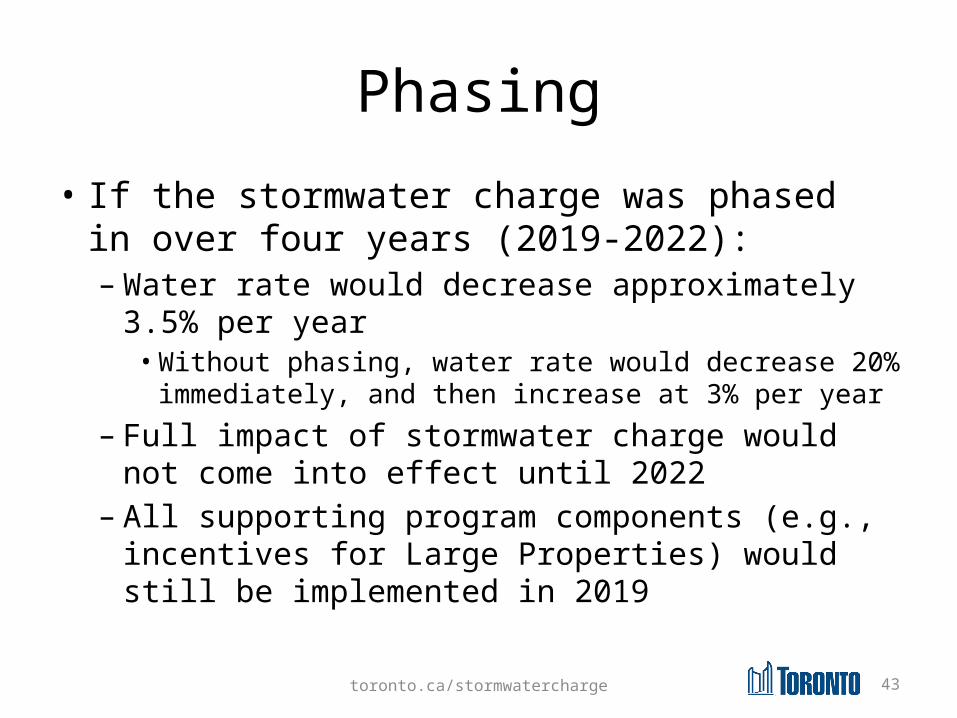
Phasing• If the stormwater charge was phased in
over four years (2019-2022):– Water rate would decrease approximately
3.5% per year• Without phasing, water rate would decrease 20%
immediately, and then increase at 3% per year– Full impact of stormwater charge would not
come into effect until 2022– All supporting program components (e.g.,
incentives for Large Properties) would still be implemented in 2019
toronto.ca/stormwatercharge 44
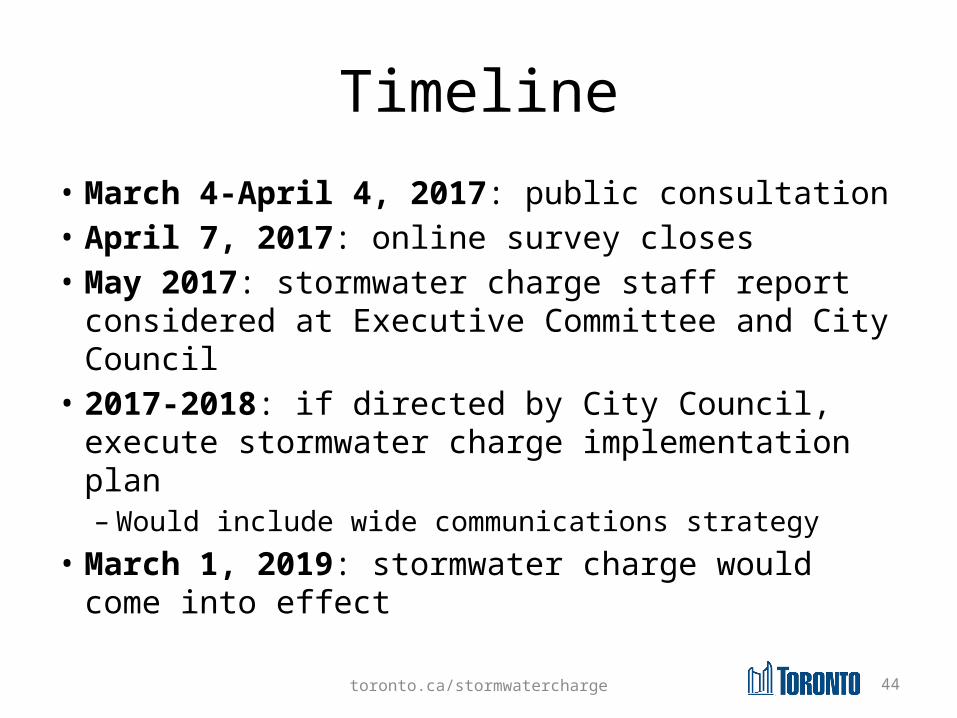
Timeline• March 4-April 4, 2017: public consultation• April 7, 2017: online survey closes• May 2017: stormwater charge staff report
considered at Executive Committee and City Council
• 2017-2018: if directed by City Council, execute stormwater charge implementation plan– Would include wide communications strategy
• March 1, 2019: stormwater charge would come into effect
toronto.ca/stormwatercharge 45
Feedback• What questions do you have? • Concerns?• Comments?• Ideas?
• Survey available at toronto.ca/stormwatercharge
toronto.ca/stormwatercharge 46
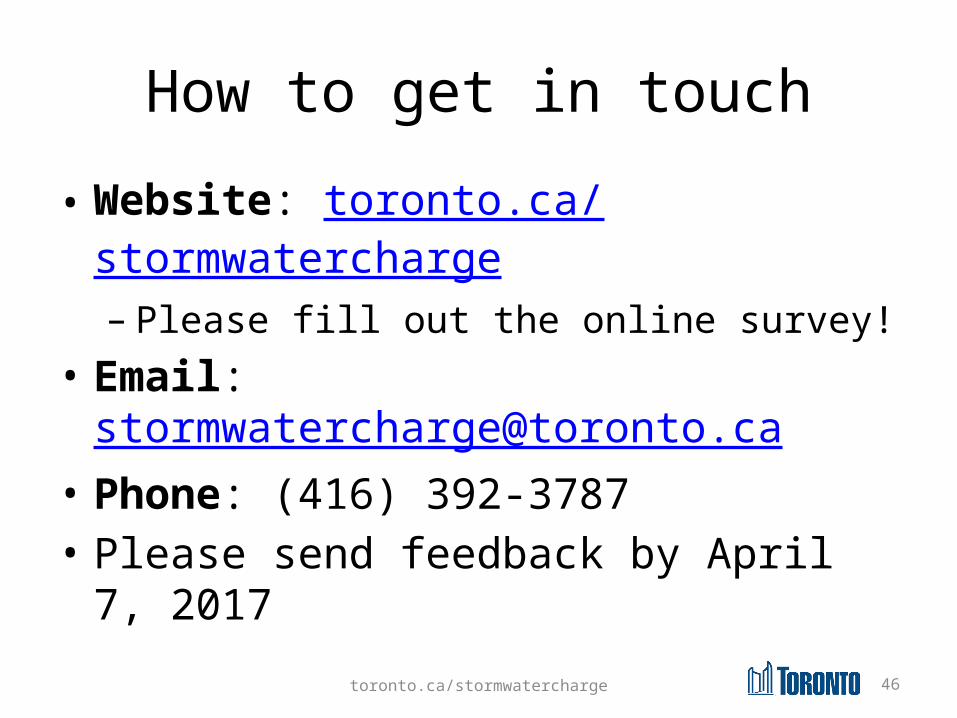
How to get in touch• Website: toronto.ca/
stormwatercharge– Please fill out the online survey!
• Email: [email protected]
• Phone: (416) 392-3787• Please send feedback by April 7,
2017


![[Swc] wrzesień 2014](https://cdn.vdocuments.site/doc/165x107/558c5737d8b42a7a0e8b45c0/swc-wrzesien-2014.jpg)
