
Will it Ever Really Count?
Prof Greg MarsdenInstitute for Transport Studies

Sustainable Development and Sustainable Transportation

Sustainable Development and Sustainable Transportation
National
Economic System
Global Market
Urban System
Telecommunications
System
Energy/Power
System
Water and Sewage
System
Transportation
SystemLand Use
Institutional
Structure
Infrastructure
System
System Users/
Stakeholders
Transportation
Modes
Intermodal
Connections
Transit Network Highway NetworkNon-motorized
NetworkAirway Network
Source: Adapted from Meyer
and Miller (2001, p. 91).Collectors LocalArterials

Sustainable Development and Sustainable Transportation
Physical
Systems
Production
Consumption
Waste
Raw
MaterialsSolar
Energy HeatRecycled
Materials
ECOSYSTEM
Other …
Energy
Transportation
Communication
Industrial
Source: Adapted from Daly
(1991)
Sustainable Development and Sustainable Transportation
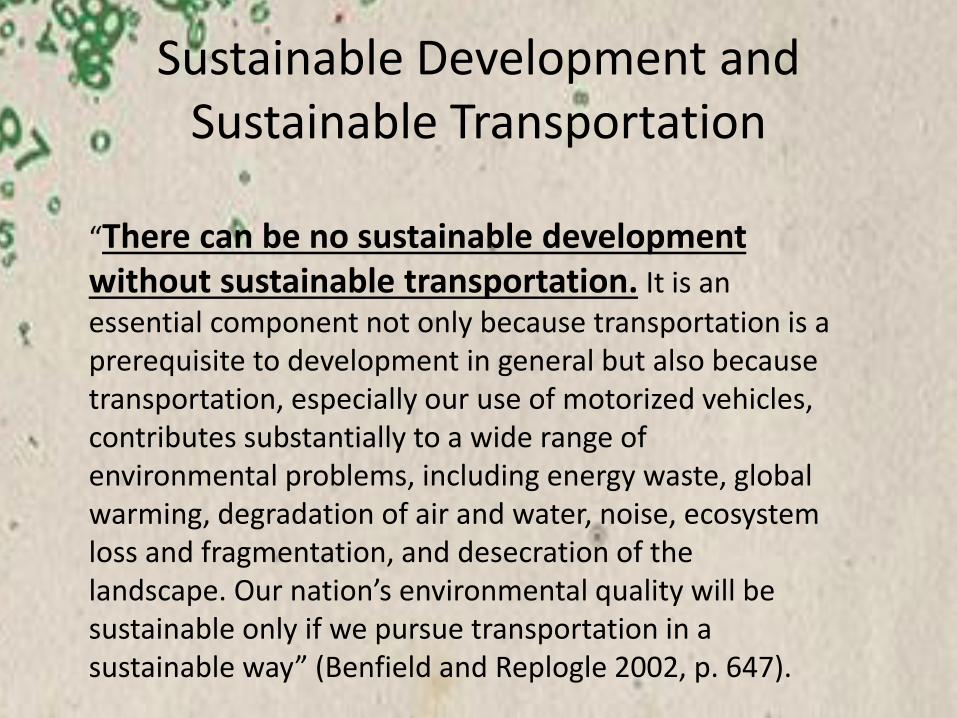
“There can be no sustainable development without sustainable transportation. It is an essential component not only because transportation is a prerequisite to development in general but also because transportation, especially our use of motorized vehicles, contributes substantially to a wide range of environmental problems, including energy waste, global warming, degradation of air and water, noise, ecosystem loss and fragmentation, and desecration of the landscape. Our nation’s environmental quality will be sustainable only if we pursue transportation in a sustainable way” (Benfield and Replogle 2002, p. 647).

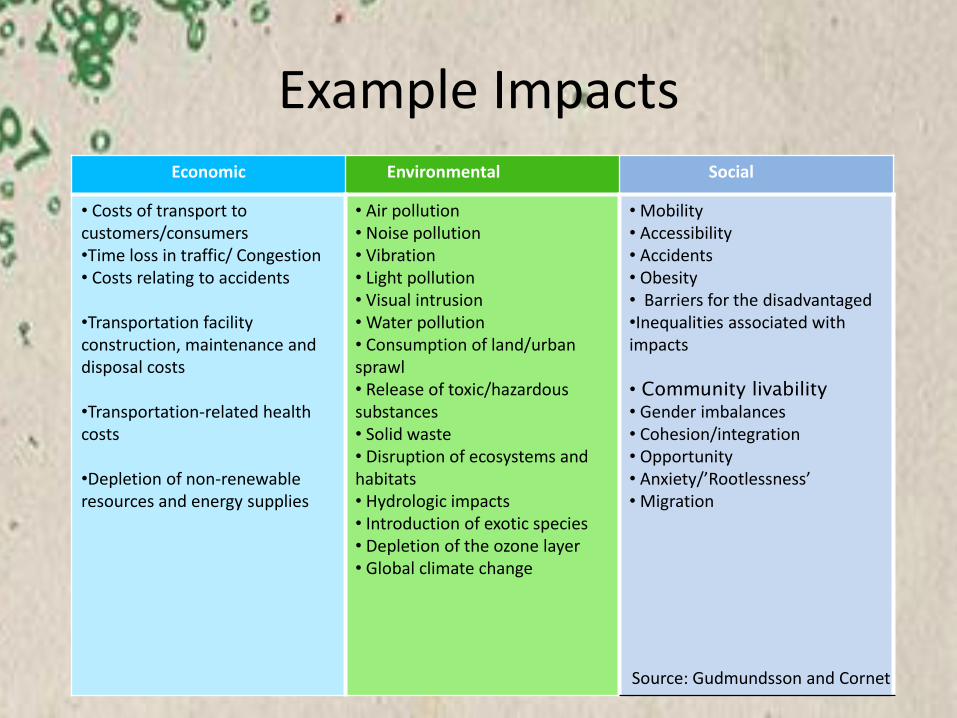
Example ImpactsEconomic Environmental Social
• Costs of transport to customers/consumers•Time loss in traffic/ Congestion• Costs relating to accidents
•Transportation facility construction, maintenance and disposal costs
•Transportation-related health costs
•Depletion of non-renewable resources and energy supplies
• Air pollution• Noise pollution• Vibration • Light pollution• Visual intrusion • Water pollution• Consumption of land/urban sprawl• Release of toxic/hazardous substances• Solid waste• Disruption of ecosystems and habitats • Hydrologic impacts• Introduction of exotic species• Depletion of the ozone layer • Global climate change
• Mobility• Accessibility• Accidents• Obesity• Barriers for the disadvantaged•Inequalities associated with impacts
• Community livability
• Gender imbalances• Cohesion/integration• Opportunity • Anxiety/’Rootlessness’ • Migration
Source: Gudmundsson and Cornet

Sustainable Development and Sustainable Transportation
• a critical component of a broader economic system which supports business and social development;
• an open system, which requires natural and man-made inputs and produces outputs which impact on the environment;
• part of a social system that shapes and is shaped by that social system, including other policy areas;
• comprised of a series of physical sub-systems with a range of physical and operational components and which are organized through formal and informal conventions; and
• fragmented series of partly connected yet partly competing sub-systems with complex and varying governance arrangements.

Sustainable TransportationWhere to make it count?
POLICY LEVEL
ORGANIZATIONALLEVEL
PROJECT LEVEL
Source: Gudmundsson and Cornet
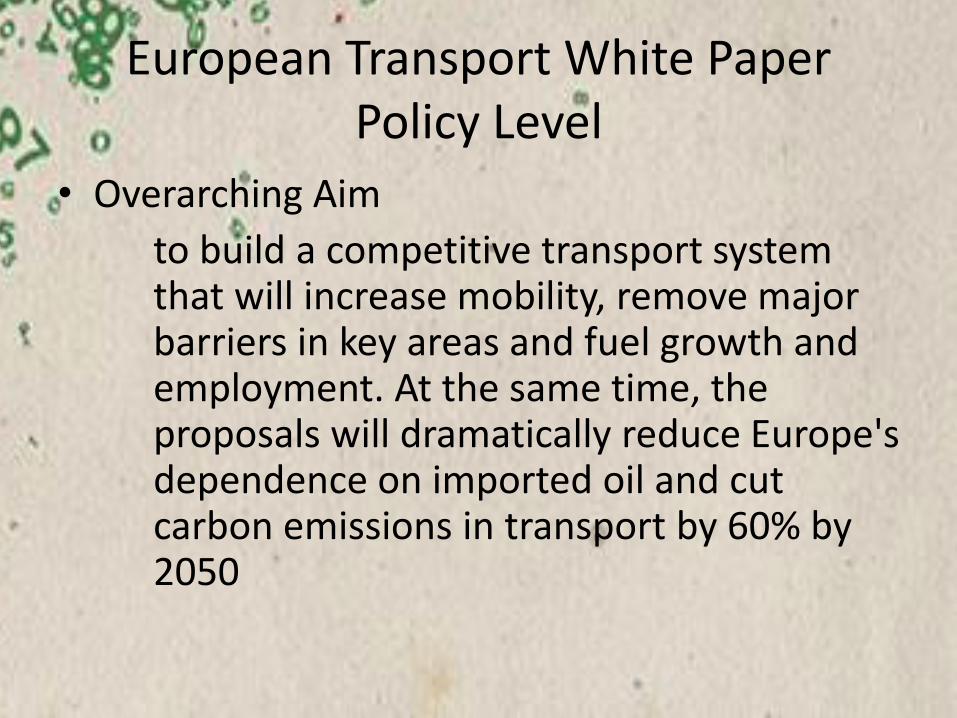
European Transport White PaperPolicy Level
• Overarching Aim
to build a competitive transport system that will increase mobility, remove major barriers in key areas and fuel growth and employment. At the same time, the proposals will dramatically reduce Europe's dependence on imported oil and cut carbon emissions in transport by 60% by 2050

Remembering Context
Remembering Context

Economic Impacts AssessedImpact Areas Indicators
Economic Impacts
Transport Activity Passenger kilometers and tonne kilometers by all modes.
Modal Shift Share of passenger or tonne kilometers by mode.
Transport costs to users Unit cost per passenger or tonne transported (including capital costs, fixed operation
costs and variable fuel and non-fuel costs).
Economic growth Qualitative inference of policy impacts on GDP only.
Efficiency of the transport
system
Not defined but incorporates notions of smart pricing, efficient networks, fuel efficiency
and vehicle purchase costs.
Congestion Average speed and use of available road capacity.
Household costs The share of passenger transport costs within the household income of the average EU
household.
Transport related sectors Not defined but qualitative inference of the potential of the strategies to support the
European vehicle manufacturing industry.
Innovation and research Not defined but qualitative inference about the impact of the strategy on research spend
on green innovation.
Reduction of administrative
burden
Not defined but qualitative inference about overall levels of administration.
EU budget Not defined as will be assessed on a case by case basis.
International relations Not defined but qualitative inference about the potential synergies and conflicts with
international organizations.

Social Impacts AssessedImpact Areas Indicators
Social Impacts
Degree of mobility Refers to the % change in total transport activity for passengers with an
overall reduction being negative.
Choice Not defined but qualitative inferences about rail investments improving
choice.
Accessibility Potential accessibility is a generalized cost based measure. Larger areas are
more attractive and cost, time and distance are negative separation factors.
Distributional Impacts Not clearly defined although the analysis refers in part to the distribution of
household costs by income band.
Employment level and
conditions
Number of jobs in the transport sector. Skills and working conditions are not
defined clearly.
Safety External costs of accidents and total number of accidents.

Environmental Impacts Assessed
Impact Areas Indicators
Environmental Impacts
Climate Change Total CO2 emissions from transport. Both transport and well to wheel analyses are
presented.
Air pollution Emissions of NOx and PM10 and external costs of these pollutants.
Noise pollution External costs of noise pollution.
Energy use/energy
efficiency
Total energy demand from transport Millions of Tonnes of Oil Equivalent (reviewed in
detail below). Energy intensity is an efficiency indicator that uses total energy demand
and transport activity to create a ratio for passenger and freight.
Renewable energy
use
Total energy demand split by fossil fuels, biofuels and electricity.
Biodiversity Not defined but qualitatively refers to fragmentation, land-take, loss of biodiversity and
damage to eco-system services.

European Transport White Paper
-200
-150
-100
-50
0
50
100
150
200
CO2 intensity Energy intensity Activity level Total
Urban Interurban Intercontinental
-44%
-40%
-74%
Passenger transport
33%
31%
120%
-22%
-19%
51%
Mto
n C
O2
0%-11%-10%
Review of Do-Minimum Case
Factors Influencing CO2 emissions

European Transport White PaperPolicy Option 2 Policy Option 3 Policy Option 4
Economic Impacts
Transport Activity -- = -
Modal Shift ++ = +
Transport costs to users --- = --
Economic growth ++ + +++
Efficiency of the transport system ++ + +++
Congestion ++ = +
Household costs -- - --
Transport related sectors + +++ +++
Innovation and research + +++ ++
Reduction of administrative burden + = +
EU budget = = =
International relations -- - -
Social Impacts
Degree of mobility --- = -
Choice ++ = ++
Accessibility ++ = ++
Distributional Impacts = - +
Employment level and conditions ++ ++ +++
Safety ++ = +
Environmental Impacts
Climate Change +++ +++ +++
Air pollution +++ ++ ++
Noise pollution +++ ++ +

European Transport White Paper
• Largest Scale attempt for Sustainable Transport Assessment
• Significant improvement in transparency
• Informs policy package choice (coherence with longer-term goals)
• Positive role as a signal

European Transport White Paper
• Modelling systems not robust• Indicators are so aggregate as to lose meaning• Social context is flattened• Does not really reach out beyond transport• Implementation is largely national
– Is this joined up?
• Only limited signs that constraints are to play a part
• “Curbing Mobility is not an option” – Weak sustainability

High Speed Rail
• Decision taken in same way as other infrastructure projects
• Bespoke Sustainability Appraisal also commissioned
Phase 1 Phase 2 Rolling Stock Total Target Cost 17.16 n/a Estimated Cost 15.65 12.5 5.8 33.95 Contingency 5.75 8.7 1.7 16.15
Total 21.4 21.2 7.5 50.1
Source: Environmental Audit Committee
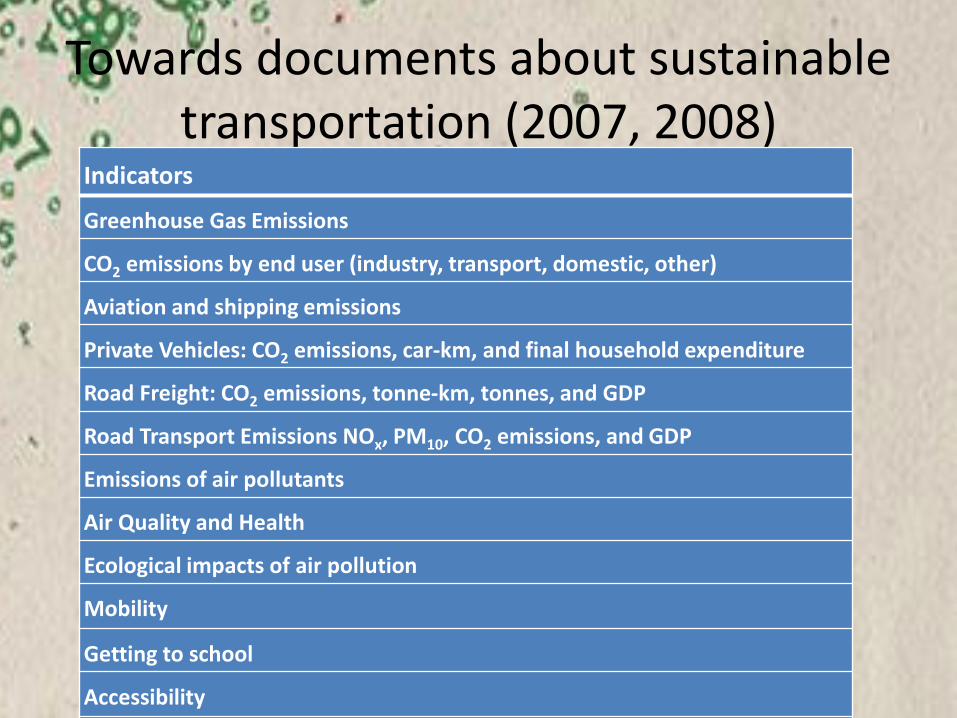
Towards documents about sustainable transportation (2007, 2008)
Indicators
Greenhouse Gas Emissions
CO2 emissions by end user (industry, transport, domestic, other)
Aviation and shipping emissions
Private Vehicles: CO2 emissions, car-km, and final household expenditure
Road Freight: CO2 emissions, tonne-km, tonnes, and GDP
Road Transport Emissions NOx, PM10, CO2 emissions, and GDP
Emissions of air pollutants
Air Quality and Health
Ecological impacts of air pollution
Mobility
Getting to school
Accessibility

What is HS2 for?
• Never been articulated as part of a sustainable transport strategy
• 2009 SoS Transport Geoff Hoon announced creation of HS2 Limited in a statement to Parliament about expansion of Heathrow
• 2 years previously, the Rail White Paper had said:• “Higher speed is not the only or best way of cutting journey times.
Nor is it without cost. Increasing the maximum speed of a train from 200 km/h to 350 km/h means a 90 per cent increase in energy consumption. In exchange, it cuts station-to-station journey time by less than 25 per cent and door-to-door journey-time by even less. … The argument that high-speed rail travel is a ‘green option’ does not stand up to close inspection on the basis of the present electricity generation mix.” (DfT, 2007b, p. 62).

What is HS2 for?
• The remit of HS2 Limited was subsequently clarified to focus, in order of priority on:
• Passenger capacity: “this is the driving consideration, including capacity released on classic lines”;
• Speed;• Land use and development objectives and the support
of new housing development; and• Developing the line to be capable of handling freight
for greater network resilience.• Modal shift from air to rail was “not expected to be a
key objective for HS2” (Rowlands, 2009).

Sustainability Appraisal
Source: Geisler et al. (2011)

Sustainability Appraisal
Key Sustainability Issue ObjectiveReducing greenhouse gas emissions and combating climate changeClimatic factors and adaptability
Improve resilience of the rail network against extreme weather events
Greenhouse Gases Contribute to the reduction of greenhouse gas emissions by facilitating modal shift from road and air to rail
Reduce relative contribution made by rail to greenhouse gas emissions by promoting energy efficient technologies
Natural and cultural resource protection and environmental enhancement Landscape and townscape Maintain and enhance existing landscape character
Maintain and enhance existing townscape character
• 18 sustainability issues
• 33 objectives as shown in Table
• 33 objectives => 66 evaluation criteria

Sustainability AppraisalHS2 Objectives and Option identification process
Option Generation
Scheme Components London
Terminus
Line of
RouteEtc.
Sift 190+ long list options
Review of Operations, Cost
Demand and Engineering HS2 Board
Decision Point 1
Sift 250+ intermediate list options
Appraisal including simplified
Appraisal of Sustainability HS2 Board
Decision Point 2
Sift 3Shortlist of stations and whole routes
Appraisal including full
Appraisal of Sustainability HS2 Board
Decision Point 3
Finalising preferred scheme and main alternatives

Likely Impact of Proposed
HS2
Likely change between the
current baseline and
future baseline
Cumulative Impacts
Reducing greenhouse gas emissions and combating climate change
resilience of the rail network + 0 +
greenhouse gas emissions +/- + +
Natural and cultural resource protection and environmental enhancement
landscape character -- - --
townscape character 0 0 0
archeological assets - 0 -
historic buildings - - -
historic landscapes - - -
biodiversity - - -
surface water resources - 0 -
groundwater resources - - -
capacity of flood plains - - --
Creating sustainable communities
local air quality U + +
local noise environment -- - --
local vibration environment - 0 0
community integrity 0 - 0
pedestrian access 0 + +
access to public transport + + ++
public transport interchange + + ++
mental well-being 0 0 0
physical health 0 + +
health inequalities 0 0 0
road traffic accidents 0 0 0
crime and fear of crime 0 0 0
economic competitiveness ++ U ++
wider economic growth and
employment ++ U ++
employment ++ U ++
Support planned
development - ++ ++
Regeneration + ++ ++
Sustainable consumption and production
land resources - - -
brownfield sites + + +
waste protection - + +
primary material resources - - -
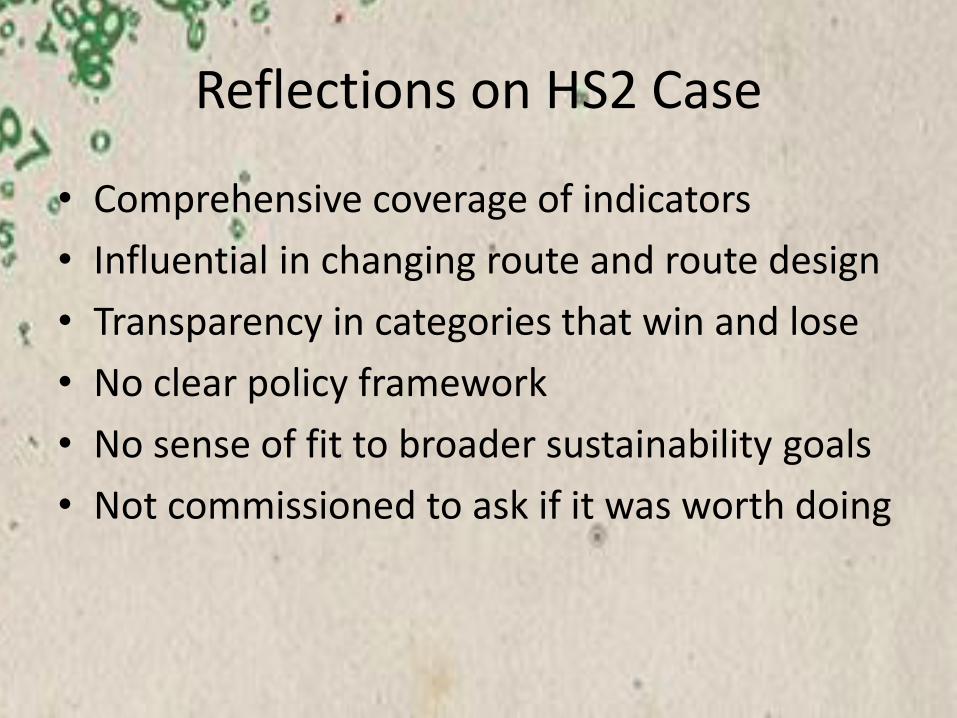
Reflections on HS2 Case
• Comprehensive coverage of indicators
• Influential in changing route and route design
• Transparency in categories that win and lose
• No clear policy framework
• No sense of fit to broader sustainability goals
• Not commissioned to ask if it was worth doing
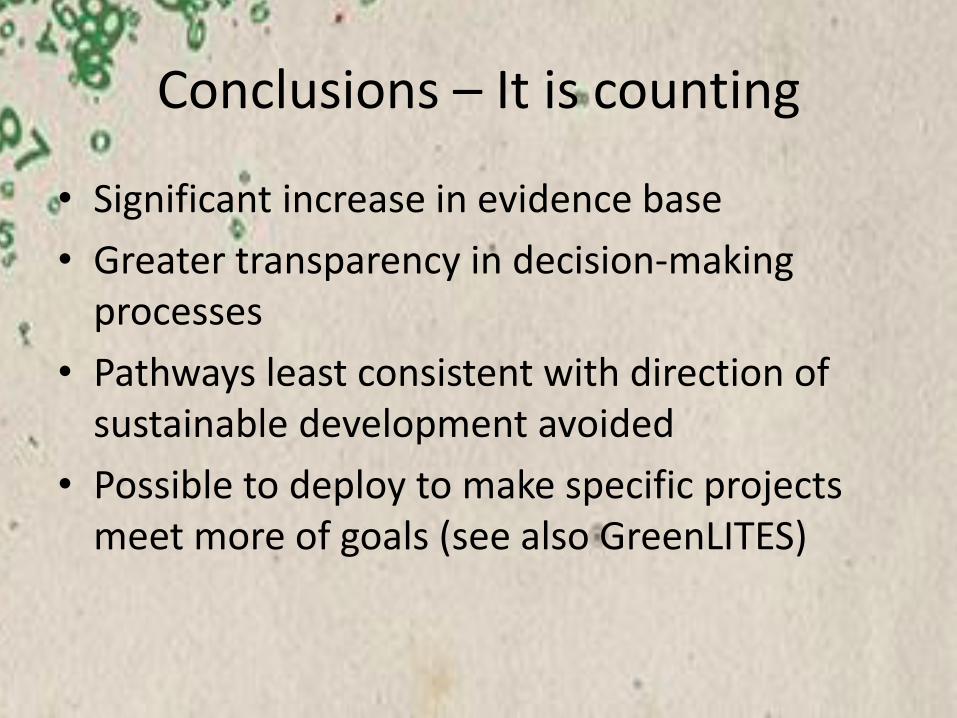
Conclusions – It is counting
• Significant increase in evidence base
• Greater transparency in decision-making processes
• Pathways least consistent with direction of sustainable development avoided
• Possible to deploy to make specific projects meet more of goals (see also GreenLITES)
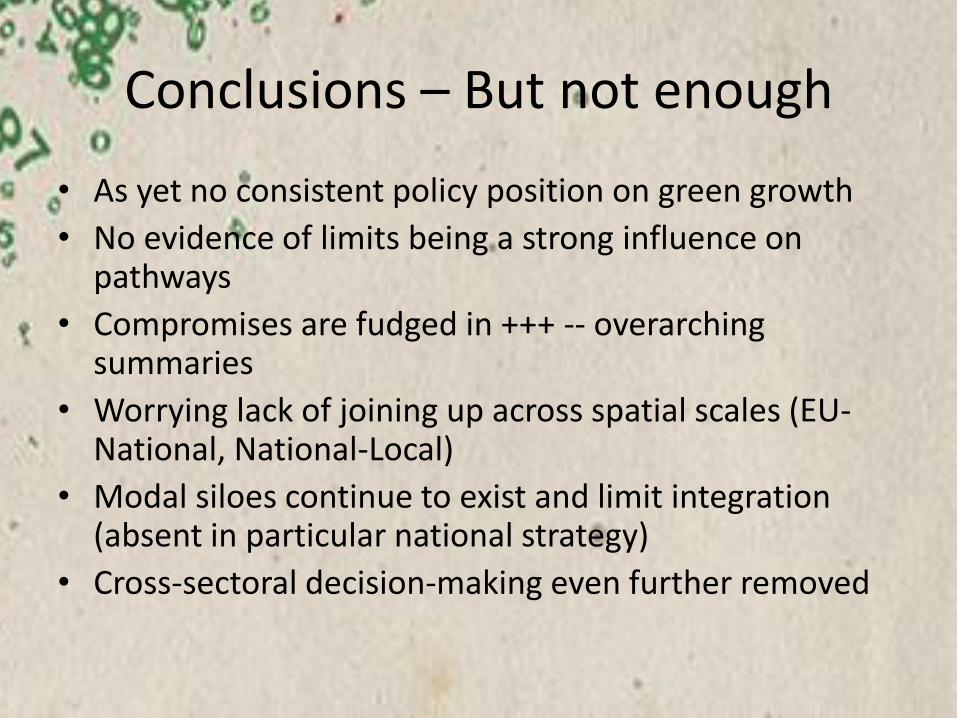
Conclusions – But not enough
• As yet no consistent policy position on green growth
• No evidence of limits being a strong influence on pathways
• Compromises are fudged in +++ -- overarching summaries
• Worrying lack of joining up across spatial scales (EU-National, National-Local)
• Modal siloes continue to exist and limit integration (absent in particular national strategy)
• Cross-sectoral decision-making even further removed


