Summary Report of the EPRI Standard Radiation Monitoring Program
Dennis Hussey, EPRIAsian Technical Center ALARA SymposiumYuzawa, JapanOctober 11-13, 2006

2© 2006 Electric Power Research Institute, Inc. All rights reserved.
Overview
• History of Standard Radiation Monitoring Program (SRMP)
• Standard Radiation Monitoring Program Goals
• Plant Types and Survey Points
• Current Results
– US Responses
– Summary statistics of • loop piping
• channel head surveys
– Difference of cold leg and hot leg measurements
• Conclusions and Recommendations

3© 2006 Electric Power Research Institute, Inc. All rights reserved.
History of Standard Radiation Monitoring Program (SRMP)
• Started in 1978 to study radiation fields in Westinghouse-designed plants
– Program expanded to include Combustion Engineering (CE) designs
– In 1996, program was suspended because of a lack of industry interest and funding
• In 2003, NEI/INPO/EPRI developed the RP2020 Dose Reduction initiative
– Take Radiation Off the Table
– EPRI was charged to take the technical lead for source term reduction
– First goal was to benchmark PWR performance

4© 2006 Electric Power Research Institute, Inc. All rights reserved.
Standard Radiation Monitoring Program Goals
• Maintain the history of the program
– Much data have been acquired already
– Locations should not be change
• Make the procedure simple, focused, practical, and routine
– North American Technical Center recommendation
– Help HP staff so that HP staff can help us
• Organize the data to allow correlation to chemistry events and plant design
– PWR Monitoring and Assessment Database
• Encourage consistent sampling techniques
5© 2006 Electric Power Research Institute, Inc. All rights reserved.
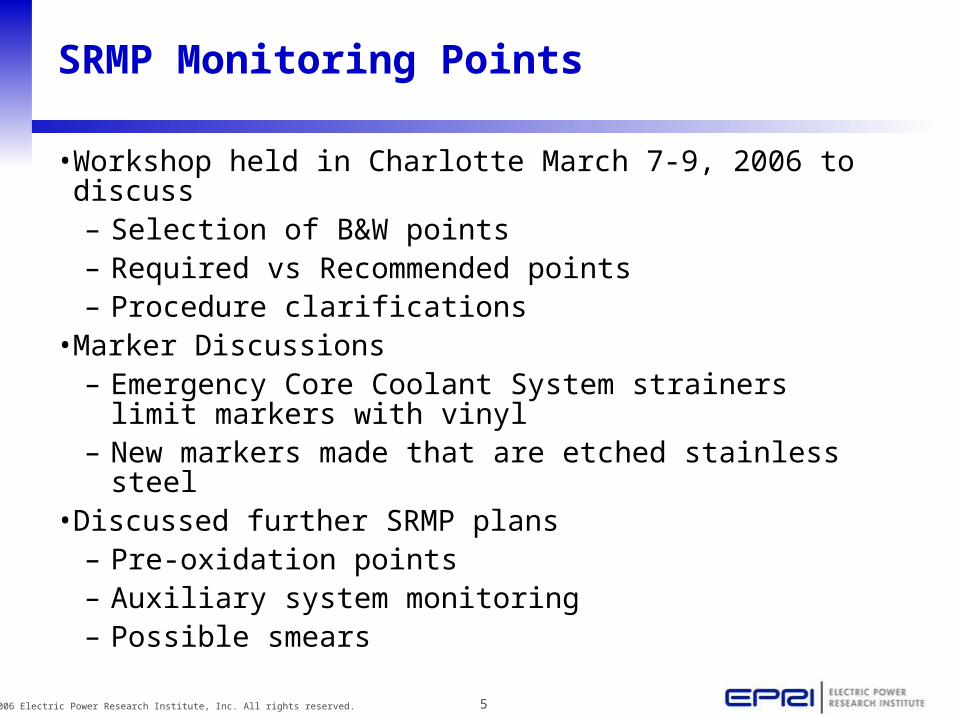
SRMP Monitoring Points
• Workshop held in Charlotte March 7-9, 2006 to discuss– Selection of B&W points– Required vs Recommended points– Procedure clarifications
• Marker Discussions– Emergency Core Coolant System strainers limit
markers with vinyl– New markers made that are etched stainless steel
• Discussed further SRMP plans– Pre-oxidation points– Auxiliary system monitoring– Possible smears
6© 2006 Electric Power Research Institute, Inc. All rights reserved.
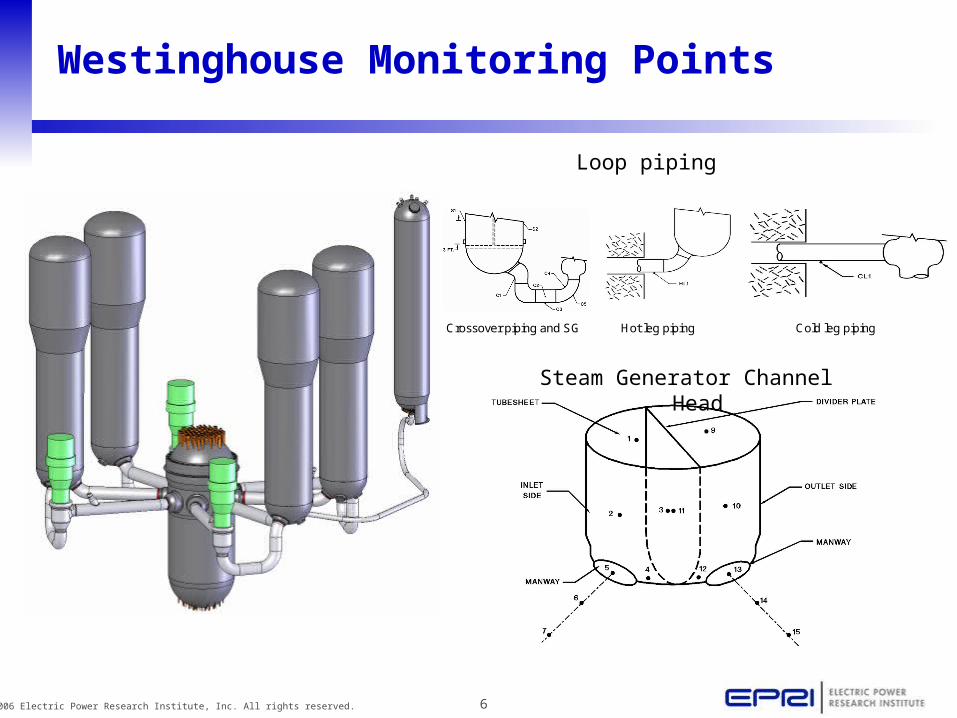
Westinghouse Monitoring Points
Crossover piping and SG Hot leg piping Cold leg piping
Steam Generator Channel Head
Loop piping

7© 2006 Electric Power Research Institute, Inc. All rights reserved.
Combustion Engineering Monitoring Points
Loop piping
Steam Generator Channel Head
8© 2006 Electric Power Research Institute, Inc. All rights reserved.
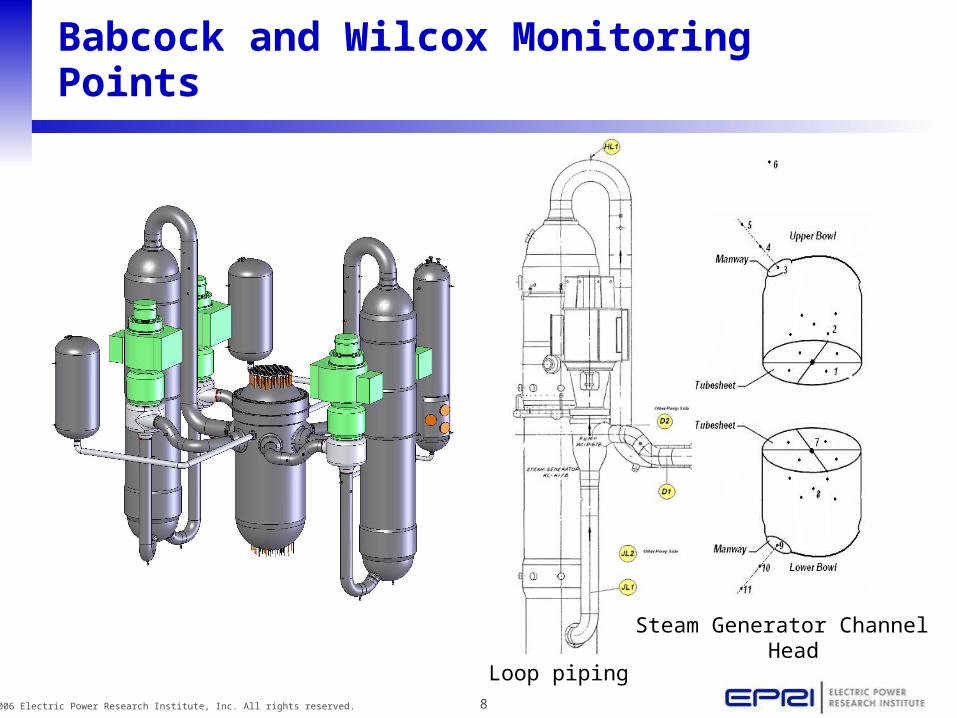
Babcock and Wilcox Monitoring Points
Loop piping
Steam Generator Channel Head
9© 2006 Electric Power Research Institute, Inc. All rights reserved.
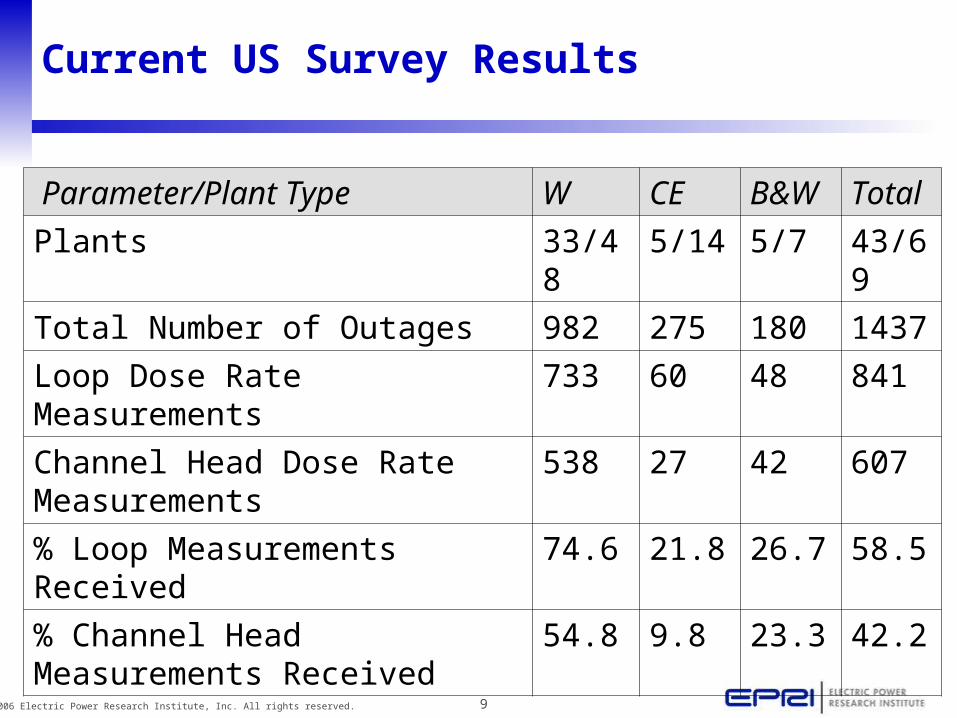
Current US Survey Results
Parameter/Plant Type W CE B&W Total
Plants 33/48 5/14 5/7 43/69
Total Number of Outages 982 275 180 1437
Loop Dose Rate Measurements 733 60 48 841
Channel Head Dose Rate Measurements
538 27 42 607
% Loop Measurements Received 74.6 21.8 26.7 58.5
% Channel Head Measurements Received
54.8 9.8 23.3 42.2
10© 2006 Electric Power Research Institute, Inc. All rights reserved.
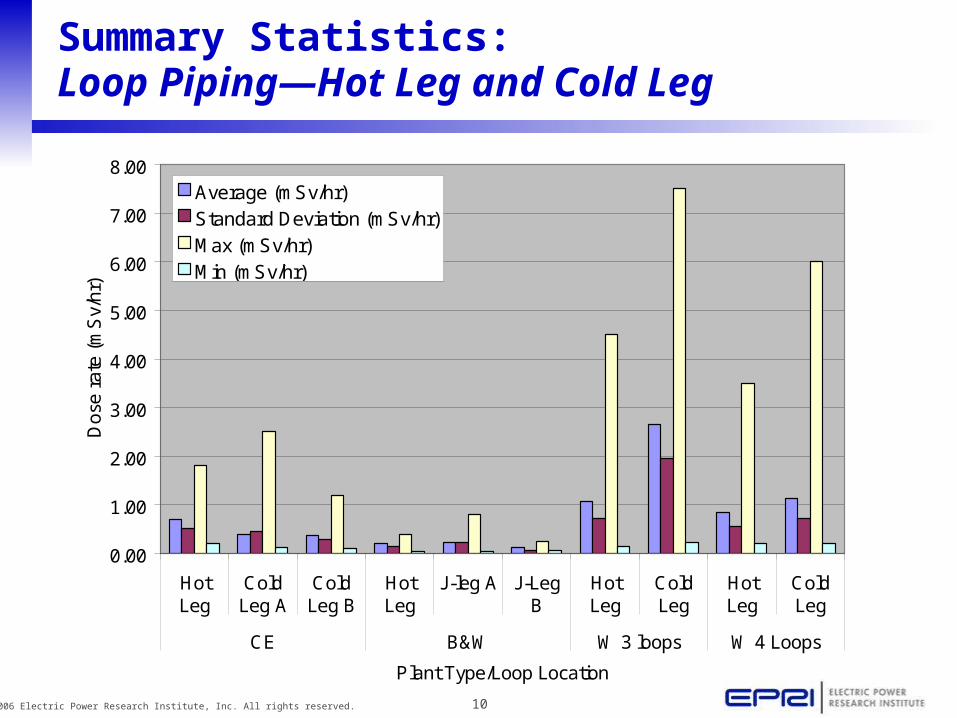
Summary Statistics: Loop Piping—Hot Leg and Cold Leg
0.00
1.00
2.00
3.00
4.00
5.00
6.00
7.00
8.00
HotLeg
ColdLeg A
ColdLeg B
HotLeg
J-leg A J-LegB
HotLeg
ColdLeg
HotLeg
ColdLeg
CE B&W W 3 loops W 4 Loops
Plant Type/Loop Location
Do
se r
ate
(m
Sv/
hr)
Average (mSv/hr)Standard Deviation (mSv/hr)Max (mSv/hr)Min (mSv/hr)
11© 2006 Electric Power Research Institute, Inc. All rights reserved.
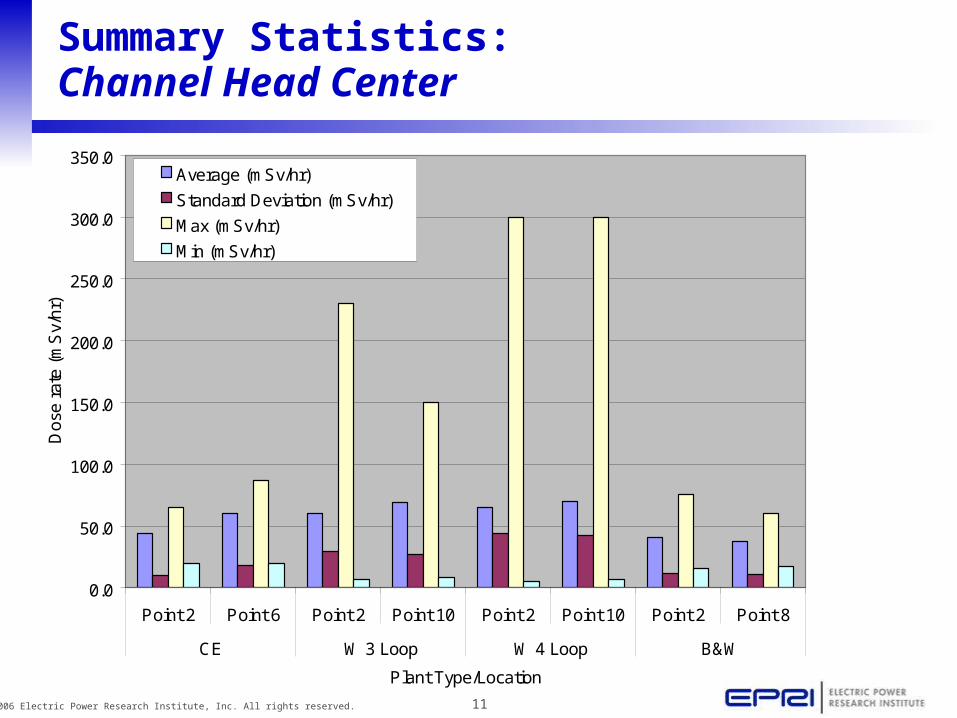
Summary Statistics: Channel Head Center
0.0
50.0
100.0
150.0
200.0
250.0
300.0
350.0
Point 2 Point 6 Point 2 Point 10 Point 2 Point 10 Point 2 Point 8
CE W 3 Loop W 4 Loop B&W
Plant Type/Location
Dos
e ra
te (
mS
v/hr
)
Average (mSv/hr)
Standard Deviation (mSv/hr)
Max (mSv/hr)
Min (mSv/hr)
12© 2006 Electric Power Research Institute, Inc. All rights reserved.
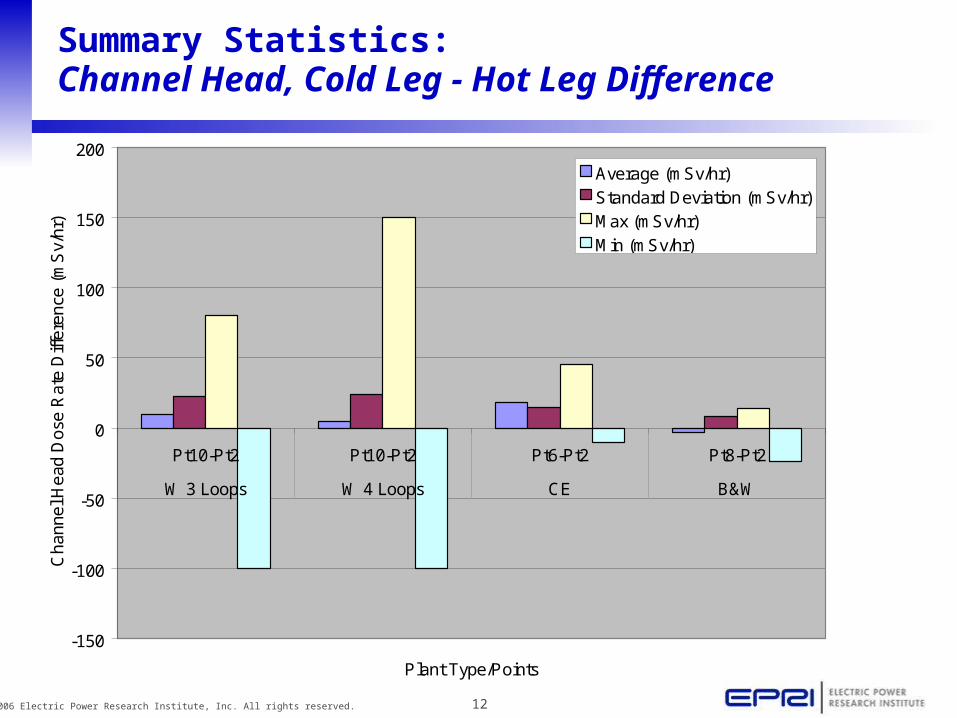
Summary Statistics: Channel Head, Cold Leg - Hot Leg Difference
-150
-100
-50
0
50
100
150
200
Pt10-Pt2 Pt10-Pt2 Pt6-Pt2 Pt8-Pt2
W 3 Loops W 4 Loops CE B&W
Plant Type/Points
Cha
nnel
Hea
d D
ose
Rat
e D
iffer
ence
(m
Sv/
hr)
Average (mSv/hr)Standard Deviation (mSv/hr)Max (mSv/hr)Min (mSv/hr)
13© 2006 Electric Power Research Institute, Inc. All rights reserved.
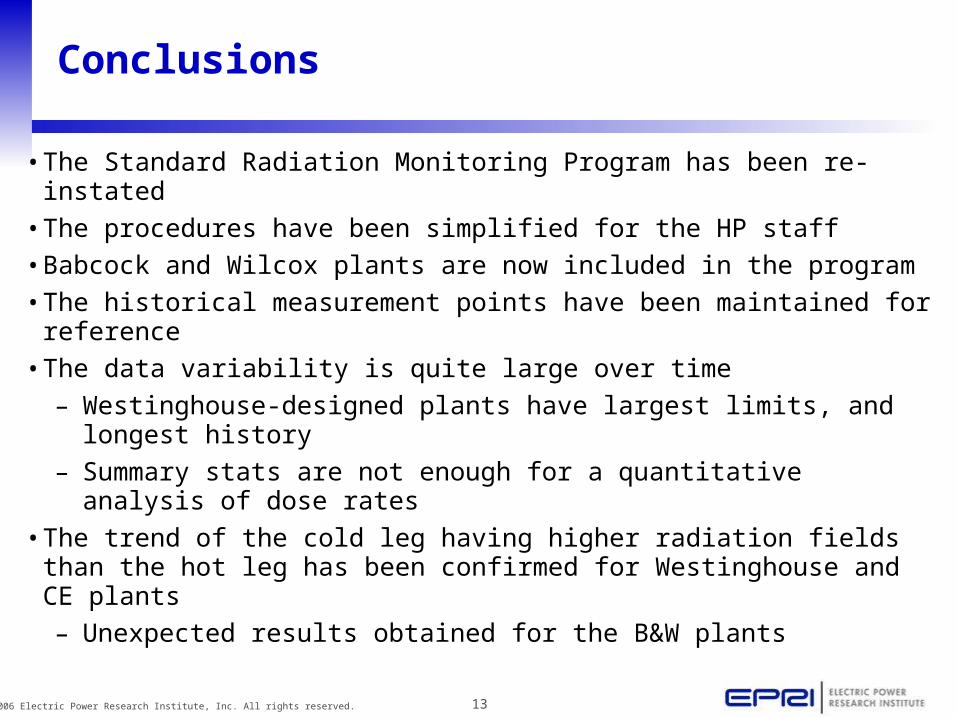
Conclusions
• The Standard Radiation Monitoring Program has been re-instated
• The procedures have been simplified for the HP staff
• Babcock and Wilcox plants are now included in the program
• The historical measurement points have been maintained for reference
• The data variability is quite large over time
– Westinghouse-designed plants have largest limits, and longest history
– Summary stats are not enough for a quantitative analysis of dose rates
• The trend of the cold leg having higher radiation fields than the hot leg has been confirmed for Westinghouse and CE plants
– Unexpected results obtained for the B&W plants
14© 2006 Electric Power Research Institute, Inc. All rights reserved.
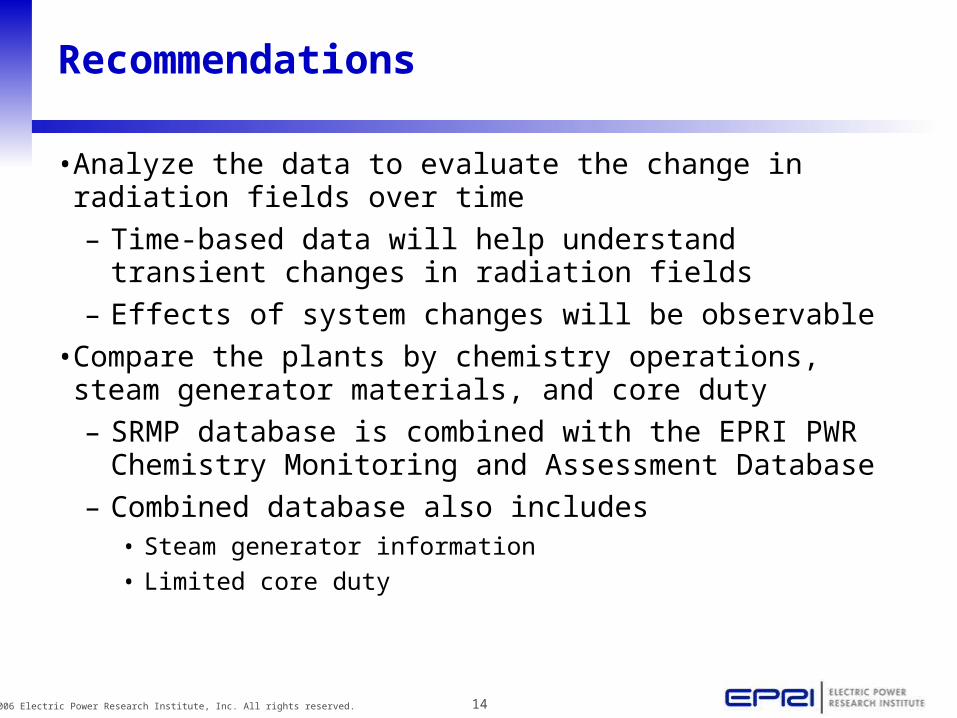
Recommendations
• Analyze the data to evaluate the change in radiation fields over time
– Time-based data will help understand transient changes in radiation fields
– Effects of system changes will be observable
• Compare the plants by chemistry operations, steam generator materials, and core duty
– SRMP database is combined with the EPRI PWR Chemistry Monitoring and Assessment Database
– Combined database also includes• Steam generator information
• Limited core duty
15© 2006 Electric Power Research Institute, Inc. All rights reserved.
Acknowledgements
• EPRI Solutions
– Sam Choi, Cara Libby
• PWR ALARA Group
– Leonard Rollins, Dan Stoltz
• North American Technical Center
– David Miller, Scott Schofield
• Romain Bouchacourt


