Study of ammonia electro-oxidation on
Pt-based nano-catalysts using
polarization modulation IRRAS
Niloofar Aligholizadeh Kahriz
Thesis submitted to the
Faculty of Graduate and Postdoctoral Studies
In partial fulfillment of the requirements
For the degree of
Master of Applied Science
Department of Chemical and Biological Engineering
Faculty of Engineering
University of Ottawa
© Niloofar Aligholizadeh Kahriz, Ottawa, Canada, 2020

ii
Abstract
Ammonia electrochemical oxidation is a viable technology for power generation in fuel cells since
ammonia is a versatile hydrogen carrier that possesses high energy density and hydrogen content
with lower energy consumption compared to the other candidates. Pt is the most active catalyst
toward ammonia oxidation reaction as shows in high activity and stability. In the present study, Pt
nanoparticles (NPs) were synthesized in 4 different sizes (1.3 - 4.3 nm) dispersed on carbon
support using the polyol method. The effect of particle size on the catalytic activity and reaction
product distribution was evaluated. The correlation between nano-catalyst size and catalytic
activity has been demonstrated in the research. Pt particle size of 1.3 nm yielded comparatively
better activity although Pt 2.2 nm was more stable in addition to acceptable activity. Polarization
modulation infrared reflection absorption spectroscopy (PM-IRRAS) was employed to analyze the
formation of reaction species in real-time when the electrooxidation was occurring. Unlike regular
infrared spectroscopy, PM-IRRAS enabled us to observe oxidation species on both catalyst-
electrolyte interface and bulk of the solution. N-H containing species as well as nitro compounds
and azide ions were identified at individual potentials on the surface of catalysts and in the bulk of
electrolyte.
Furthermore, Pt and Pt-based bimetallic NPs, including PtIr and PtRu, were prepared on
engineered carbon support (ECS) provided for Pt group metals (PGM) in order to improve the
catalyst dispersion. In the first evaluation step, the catalytic activity was tested by electrochemical
measurements which indicated that incorporation of Ir enhanced the stability of the catalyst
comparing to pure Pt. Besides the stability, the addition of second metal lowered the oxidation
onset potential to more negative overpotential that was verified by PM-IRRAS. The resulting
current density of catalysts in various concentrations of ammonia was assessed in alkaline solution.
The overall upward trend in catalytic activity for PtIr and PtRu in contrast to Pt might be due to
enhanced tolerance regarding N adsorbate atoms poisoning effect that occurred by the addition of
Ir and Ru. The effect of carbon supports was evaluated by making a comparison between Pt/C
ECS and Pt/C (commercial Vulcan XC-72) at approximately the same size around 4.5 nm and the
same metal loading. Compared to untreated carbon, the substantially higher current density
associated with Pt/C ECS demonstrates the effect of the support structure on the catalytic activity

iii
of Pt NPs towards ammonia electrooxidation. Improved dispersion and enhancement of the
interaction between catalyst and electrolyte can be considered for a significant difference in
corresponding current densities.
iv
Résumé L’oxydation électrochimique de l’ammoniac est une technologie viable pour la production
d’énergie dans les piles à combustible, car l’ammoniac est un porteur d’hydrogène polyvalent
possédant une densité énergétique et une teneur en hydrogène élevées par rapport aux autres
candidats à faible consommation d’énergie. Le Pt est le catalyseur le plus actif pour la réaction
d’oxydation de l’ammoniac et présente une activité et une stabilité élevées. Dans la présente étude,
des nanoparticules de platine (NP) ont été synthétisées dans 4 tailles différentes (1.3 – 4.3 nm) en
utilisant une méthode au polyol dispersée sur un support en carbone. L'effet de la taille des
particules sur l'activité catalytique et la distribution des produits de réaction a été évalué. La
corrélation entre la taille des nano-catalyseurs et l'activité catalytique a été démontrée dans la
recherche. Les particules de platine ayant une taille de 1.3 nm ont entrainé une activité catalytique
comparativement meilleure, bien que les particules de 2.2 nm étaient plus stables en plus d'avoir
une activité acceptable. La spectroscopie d'absorption réflexion infrarouge à modulation de
polarisation (PM-IRRAS) a été utilisée pour analyser la formation des espèces de réaction en temps
réel lorsque l’électro-oxydation se déroulait. Contrairement à la spectroscopie infrarouge
classique, le PM-IRRAS nous a permis d'observer des espèces d'oxydation à la fois sur l'interface
catalyseur-électrolyte et dans le volume de la solution. Des composés contenant des liens N-H
ainsi que des composés nitro et des ions azoture ont été identifiés à certains potentiels à la surface
des catalyseurs et dans la masse de l'électrolyte. De plus, des NP de Pt pur et des NP bimétalliques
à base de platine tel que PtIr et PtRu ont été préparés sur un support en carbone modifié (ECS)
fourni pour les métaux du groupe du platine (MGP) afin d'améliorer la dispersion du catalyseur.
Lors de la première étape d’évaluation, l’activité catalytique a été testée par des mesures
électrochimiques, qui ont montré que l’incorporation d’Ir améliorait la stabilité du catalyseur par
rapport au Pt pur. Outre la stabilité, l’ajout d’un second métal a abaissé le potentiel de
déclenchement de l’oxydation en un potentiel de sur-potentiel plus négatif, vérifié par PM-IRRAS.
La densité de courant résultante des catalyseurs dans diverses concentrations d'ammoniac a été
évaluée dans une solution alcaline. La tendance générale à la hausse de l'activité catalytique de
PtIr et PtRu comparé au Pt pur pourrait être cela pourrait être dû à la tolérance accrue vis-à-vis de
l'effet d'empoisonnement par les atomes d'adsorbat d'azote résultant de l'addition d'Ir et de Ru.
L'effet des supports de carbone utilisés dans les deux sections a été évalué en comparant PST / C
ECS et Pt / C (commercial Vulcan XC-72) approximativement de la même taille d’environ 4,5 nm

v
et à la même charge métallique. Comparée au carbone non traité, la densité de courant
considérablement plus élevée associée au Pt / C ECS démontre l'effet de la structure du support
sur l'activité catalytique des NP en Pt vis-à-vis l'électro-oxydation de l'ammoniac. Une dispersion
améliorée et un renforcement de l'interaction entre le catalyseur et l'électrolyte peuvent être pris
en compte afin d’expliquer la différence significative des densités de courant correspondantes.

vi
Statement of Contributions
I hereby declare that I am the sole author of this thesis. I performed the synthesis of nano-structured
platinum, electrochemical measurements for Pt monometallic and bimetallic and in-situ infrared
spectroscopy. In-situ infrared spectroscopy was done with the help of Dr. Evans Monyancho.
Ammonia electrooxidation using Pt bimetallic and its associated runs were done by collaboration
with Dr. Natalia Alzate Carvajal, and TEM imaging was done with the help of Ms. Yun Liu. The
second section related to Pt-based bimetallic catalysts was done as collaborative research with Dr.
Alexey Serov and Barr Zulevi from Pajarito Powder.
The scientific guidance throughout the project and editorial comments of the written work were
provided by my thesis supervisor Prof. Elena Baranova of the Department of Chemical and
Biological Engineering at the University of Ottawa.
Niloofar Aligholizadeh Kahriz Date: 14/1/2020

vii
Acknowledgement
I would like to state my sincere gratitude to my supervisor, Professor Elena Baranova, for her
help and support.
I would like to appreciate the precious feedback and suggestion of our research group and my
friends all through my study.
I would like to thank my family for their support and love.
Special thanks to my beloved husband, Majid, for his continuous encouragement and support and
my little son, Ilya.
viii
Table of Contents
Abstract ......................................................................................................................................................... ii
Résumé ......................................................................................................................................................... iv
Statement of Contributions .......................................................................................................................... vi
Acknowledgement ...................................................................................................................................... vii
List of Figures ............................................................................................................................................... x
List of Tables .............................................................................................................................................. xii
Abbreviations ..............................................................................................................................................xiii
Symbols ...................................................................................................................................................... xiv
Chapter 1: Introduction ................................................................................................................................. 1
1.1 Project motivation ......................................................................................................................... 1
1.2 Objective of this study .................................................................................................................. 3
1.3 References ..................................................................................................................................... 4
Chapter 2: Literature review ......................................................................................................................... 6
2.1 Ammonia: a versatile Hydrogen carrier chemical ........................................................................ 6
2.2 Ammonia fuel cells ....................................................................................................................... 8
2.3 The reaction mechanism of ammonia electrochemical oxidation ................................................. 9
2.4 Electrocatalysts for ammonia electrooxidation ........................................................................... 11
2.4.1 Pure monometallic catalysts ................................................................................................ 11
2.4.2 Pt-based bimetallic catalysts ............................................................................................... 12
2.4.3 Non-Pt-based bimetallic electrocatalysts ............................................................................ 14
2.5 Electrolyte ................................................................................................................................... 15
2.6 Electrochemical measurements ................................................................................................... 15
2.6.1 Cyclic voltammetry and chronoamperometry ..................................................................... 15
2.6.2 Evaluation of electrochemical active surface area (ECSA) ................................................ 17
2.7 Identification of oxidation species using in-situ techniques ....................................................... 18
2.8 Scope of project .......................................................................................................................... 24
2.9 References ................................................................................................................................... 24
Chapter 3: Investigation of electrochemical oxidation of ammonia on carbon-supported Pt nanoparticles
using Infrared spectroscopy: particle size effect ........................................................................................... 6

ix
3.1 Abstract ....................................................................................................................................... 33
3.2 Introduction ................................................................................................................................. 33
3.3 Material and Methods ................................................................................................................. 36
3.3.1 Synthesis of carbon-supported Pt ........................................................................................ 36
3.3.2 Characterization and Spectroelectrochemical measurements ............................................. 37
3.4 Results and discussion ................................................................................................................ 38
3.4.1 Physicochemical characterization ....................................................................................... 38
3.4.2 Electrochemical oxidation of ammonia .............................................................................. 40
3.4.3 In-situ PM-IRRAS measurements ...................................................................................... 43
3.5 Conclusions ................................................................................................................................. 48
3.6 References ................................................................................................................................... 49
Chapter 4: Ammonia Electrooxidation on PtIr and PtRu Catalysts Prepared on Engineered Catalyst
Supports ...................................................................................................................................................... 54
4.1 Abstract ....................................................................................................................................... 54
4.2 Introduction ................................................................................................................................. 55
4.3 Experimental ............................................................................................................................... 57
4.3.1 Preparation of carbon-supported PtRu and PtIr .................................................................. 57
4.3.2 Characterization and electrochemical measurements ......................................................... 58
4.3.3 In-situ infrared spectroscopy ............................................................................................... 59
4.4 Results and discussion ................................................................................................................ 60
4.4.1 Physicochemical characterization ....................................................................................... 60
4.4.2 Electrochemical evaluation ................................................................................................. 62
4.4.3 Determination of oxidation species on PtRu and PtIr using PM-IRRAS ........................... 69
4.5 Conclusions ................................................................................................................................. 72
4.6 References ................................................................................................................................... 72
Chapter 5: General Conclusions and future works ..................................................................................... 77
Appendix A .................................................................................................................................................. 80
Appendix B .................................................................................................................................................. 81

x
List of Figures
Figure 1-1: An upward trend of carbon dioxide emission based on global carbon project [1] .................... 1
Figure 2-1: An energy cost evaluation in C$ per GJ for transportation fuel sources (recreated from a
report in Green Transportation Fuel: Ammonia, University of Ontario Institute of Technology and
Hydrofuel Inc., 2017)[4] ................................................................................................................................ 6
Figure 2-2: Schematic diagram of direct ammonia fuel cell and anodic-cathodic reactions (adapted by
permission)[50] ............................................................................................................................................. 9
Figure 2-3: Cyclic voltammetry of Pt monolayer deposited electrochemically on Au, Ir, Rd, Ru and Pd for
ammonia electrooxidation (adapted by permission)[20] ........................................................................... 14
Figure 2-4: Cyclic voltammetry graph in 1M KOH on Pt/C 40wt% at scan rate of 20 mVs-1 ....................... 16
Figure 2-5: CO stripping, first cycle (black line) and second cycle (red line) (adapted by permission) [110]
.................................................................................................................................................................... 18
Figure 2-6: IR spectra for ammonia electrooxidation on Pt at diferent potentials (adapted by
permission)[111] ......................................................................................................................................... 19
Figure 2-7: Schematic diagram of designed Teflon cell for spectroelectrochemical measurements
(adapted by permission)[126] ..................................................................................................................... 21
Figure 2-8: PM-IRRAS spectra for ethanol electrooxidation on Pd/C for identification of oxidation species
on the surface (left) and in the bulk of electrolyte (right) at different potentials (Adapted by
permission)[126] ......................................................................................................................................... 22
Figure 2-9: PM-IRRAS spectra for glycerol electrooxidation on NiPd for identification of oxidation species
on the surface (right) and in the bulk of electrolyte (left) at different potentials (Adapted by
permission)[124] ......................................................................................................................................... 23
Figure 3-1: (left) TEM images and (right) size distribution of carbon-supported Pt, prepared by various
NaOH concentrations: (a) 0.25M; (b) 0.15 M; (c) 0.1M; (d) 0.08M ............................................................ 39
Figure 3-2: Cyclic voltammetry of Pt/C catalyst in 1 M KOH in the presence ( red line) and absence (blue
line) of 0.5 M NH4OH at a scan rate of 20 mV s-1 for a) 1.3 nm, b) 2.2 nm, c) 2.9 nm, d) 4.3 nm .............. 41
Figure 3-3: Left) Cyclic voltammetry for Pt 1.3 nm, Pt 2.2 nm, Pt 2.9 nm and Pt 4.3 nm in 1 M KOH + 0.5
M NH4OH at Scan rate of 20 mV s-1 and right) onset potential region for Pt with different sizes ............. 42
Figure 3-4: Chronoamperometry measurements for Pt 1.3 nm, Pt 2.2 nm, Pt 2.9 nm and Pt 4.3 nm in 1 M
KOH+ 0.5M NH4OH at -0.3 V vs Hg/HgO ..................................................................................................... 43
Figure 3-5: PM-IRRAS spectra (considering ammonia at -0.5 V as reference in processing the spectra) on
Pt/C 20 wt% synthesized with a) 0.25M (1.3 nm) and b) 0.15M (2.2 nm) NaOH for ammonia electro
oxidation in 1M KOH+ 0.5M NH4OH in the bulk of electrolyte(left) and on the surface (right) ................. 45
Figure 3-6: PM-IRRAS spectra (considering KOH at -0.4 V as reference for processing the spectra) on Pt/C
20 wt% synthesized with 1.3 nm particle size a) references in 1 M KOH b) in 1MKOH+0.5M NH4OH in the
bulk of electrolyte(left) and on the surface (right) ..................................................................................... 46
Figure 3-7: PM-IRRAS spectra (considering KOH at -0.4 V as reference for processing the spectra) on Pt/C
20 wt% synthesized with 2.2 nm particle size a) references in 1 M KOH b) in 1MKOH+0.5M NH4OH in the
bulk of electrolyte(left) and on the surface (right) ..................................................................................... 47
Figure 3-8: PM-IRRAS spectra (considering ammonia at -0.5 V as reference) on Pt/C 20 wt% with a) 1.3
b)2.2 nm particle size for ammonia electro oxidation in 1M KOH+ 0.5M NH4OH in the bulk of
electrolyte(left) and on the surface (right) collected after 30 min at each potential ................................ 48
xi
Figure 4-1: The TEM micrographs (left) and corresponding histograms (right) of Pt (a) and Pt75Ir25 (b) ... 61
Figure 4-2: X-Ray diffraction patterns of the Pt, Pt75Ir25, Pt67Ru33 1, 2 and 3 electrocatalysts ................... 62
Figure 4-3: Cyclic voltammograms for a) Pt and Pt75Ir25, and b) Pt67Ru33 1, 2 and 3 electrocatalysts in 1 M
KOH at 20 mVs-1 .......................................................................................................................................... 63
Figure 4-4: a) Cyclic voltammograms Pt, Pt75Ir25, Pt67Ru33 1, 2 and 3 electrocatalysts in 1 M KOH + 0.5 M
NH4OH. Scan rate of 20 mV s-1 and b) onset potential for ammonia electrooxidation of Pt, Pt75Ir25,
Pt67Ru33 1, 2 and 3 electrocatalysts. ............................................................................................................ 65
Figure 4-5: Maximum peak current density of ammonia oxidation vs. ammonia concentration for Pt,
Pt75Ir25, and Pt67Ru33 3 ................................................................................................................................. 66
Figure 4-6: Linear sweep voltammetry of Pt, Pt75Ir25, Pt67Ru33 1, Pt67Ru33 2 and Pt67Ru33 3 electrocatalysts
recorded at 1mVs-1 in 1M KOH + 0.5 M NH4OH .......................................................................................... 67
Figure 4-7: Chronoamperometric measurements at -0.25 V vs Hg/HgO for Pt, Pt75Ir25, Pt67Ru33 1, Pt67Ru33
2 and Pt67Ru33 3 electrocatalysts in 1 M KOH+ 0.5M NH4OH...................................................................... 68
Figure 4-8: Cyclic voltammetry for (black) Pt/C and (red) Pt/C Engineered Carbon Support (ECS) in 0.5M
NH4OH + 1M KOH at 20 mVs-1 ..................................................................................................................... 69
Figure 4-9:PM-IRRAS spectra in the bulk of electrolyte (left) and on the surface of catalyst (right) on a)
Pt, b) Pt75Ir25, c)Pt67Ru33 1, d) Pt67Ru33 2 and e) Pt67Ru33 3 electrocatalysts in 1 M KOH + 0.5 M NH4OH for
ammonia electrooxidation .......................................................................................................................... 70
Figure A-1: Cyclic voltammetry comparison in 1 M KOH for Pt 1.3, 2.2, 2.9 and 4.3 nm at 20 mVs-1 ....... 80
Figure A-2: Purging the chamber by time for CO2 sensitive reactions ....................................................... 80
Figure B-1: a) XRD patterns of Engineered Carbon Supports and b) Raman spectra of Engineered Carbon
Supports ...................................................................................................................................................... 81
Figure B-2: CO stripping voltammograms in 1M KOH saturated with CO at a sweep of 20 mV/s for Pt,
Pt75Ir25 and Pt67Ru33 1, 2 and 3 electrocatalysts .......................................................................................... 81
Figure B-3: PM-IRRAS spectra (considering KOH at -0.4 V as reference) on Pt a) references in 1 M KOH b)
in 1MKOH+0.5M NH4OH in the bulk of electrolyte(left) and on the surface (right) ................................... 82
Figure B-4:PM-IRRAS spectra (considering KOH at -0.4 V as reference) on Pt75Ir25 a) references in 1 M
KOH b) in 1MKOH+0.5M NH4OH in the bulk of electrolyte(left) and on the surface (right) ...................... 83
Figure B-5: PM-IRRAS spectra (considering KOH at -0.4 V as reference) on Pt67Ru33 1 a) references in 1 M
KOH b) in 1MKOH+0.5M NH4OH in the bulk of electrolyte(left) and on the surface (right) ...................... 84
Figure B-6: PM-IRRAS spectra (considering KOH at -0.4 V as reference) on Pt67Ru33 2 a) references in 1 M
KOH b) in 1MKOH+0.5M NH4OH in the bulk of electrolyte(left) and on the surface (right)...................... 85
Figure B-7: PM-IRRAS spectra (considering KOH at -0.4 V as reference) on Pt67Ru33 3 a) references in 1 M
KOH b) in 1MKOH+0.5M NH4OH in the bulk of electrolyte(left) and on the surface (right) ...................... 86

xii
List of Tables Table 3-1: Effect of different concentration of NaOH in the synthesis of carbon-supported Pt on particle
mean size .................................................................................................................................................... 40
Table 3-2: Band Assignment for PM-IRRAS peaks in 1 M KOH + 0.5 MNH4OH ........................................... 45
Table 4-1: Metal loading and label of synthesized nanoparticles .............................................................. 58
Table 4-2: Characteristics of bare Pt, and bimetallic Pt catalysts ............................................................... 64

xiii
Abbreviations AmER Ammonia electrooxidation reaction
ATR Attenuated total Reflection
BET Branaur-Emmett-Teller
BoE Beginning of experiment
CA Chronoamperometry
CNG Compressed natural gas
CV Cyclic Voltammetry
DAmFC Direct ammonia fuel cell
DEMS Differential electrochemical mass spectroscopy
ECSs Engineered catalyst supports
ECSA Electrochemical surface area
fcc Face centred cubic structure
FCs Fuel cells
GC Glassy carbon
IRRAS Infrared reflection absorption spectroscopy
LPG Liquified petroleum gas
MSEFS Mean squared electric field strength
Nads Atomic nitrogen adsorbate
NPs Nanoparticles
PEM Proton exchange membrane
PGMs Platinum group metals
PM-IRRAS Polarization modulation infrared reflection absorption spectroscopy
PSD Particle size distribution
R.F. Reflectivity factor
SOFC Solid oxide fuel cells
TEM Transmission electron microscopy
XRD X-ray diffraction

xiv
Symbols
E Potential
Ea Activation energy
ΔE Binding energy
I Current
i Current density
T Temperature
t Time
ɵ Degree
1
Chapter 1: Introduction
1.1 Project motivation
Since the source of conventional fuels, including oil and gas, would run out finally, the world is
being directed to the use of alternative renewable and clean power sources. Fossil fuels are
generally not renewable; as a result, it is expected to cause a significant global crisis because of
unequal supply and demand. Also, the use of non-renewable and traditional fuels significantly
increases damaging emissions of industrial and transportation exhausts known as greenhouse
gases. It has been triggered temperatures to rise in the earth based on a widely recognized
hypothesis called global warming. The overall trend of Carbon dioxide emission which known as
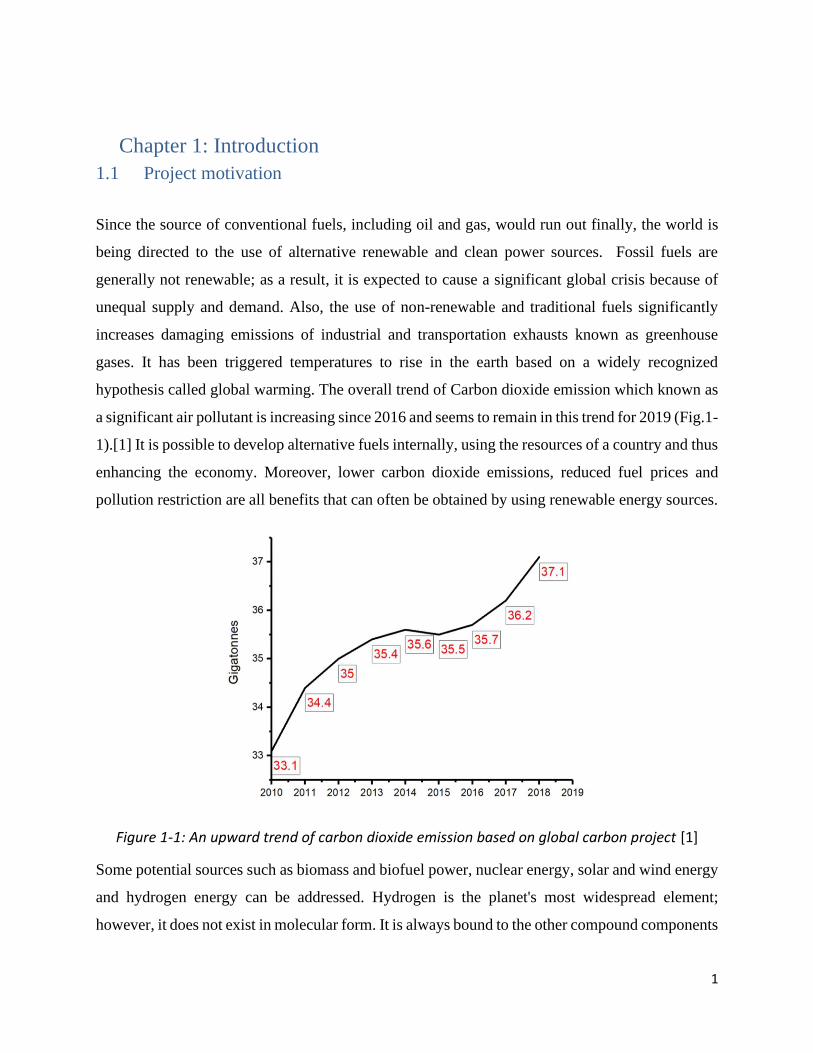
a significant air pollutant is increasing since 2016 and seems to remain in this trend for 2019 (Fig.1-
1).[1] It is possible to develop alternative fuels internally, using the resources of a country and thus
enhancing the economy. Moreover, lower carbon dioxide emissions, reduced fuel prices and
pollution restriction are all benefits that can often be obtained by using renewable energy sources.
Figure 1-1: An upward trend of carbon dioxide emission based on global carbon project [1]
Some potential sources such as biomass and biofuel power, nuclear energy, solar and wind energy
and hydrogen energy can be addressed. Hydrogen is the planet's most widespread element;
however, it does not exist in molecular form. It is always bound to the other compound components
2
such as water, ethanol and hydrocarbons. It can be utilized in the transportation sector in fuel cells
combined with electric motors in cars.
The fuel cell is a device that converts chemical reactions to electrical energy with high efficiency
and low or even zero emissions for electricity generation. The value of considering hydrogen as a
renewable fuel source arises from its possibility to operate zero-emission fuel cells. The hydrogen-
powered fuel cell in these electric cars only generates water vapour and hot air as an outlet.[2]
Naphtha steam reforming, which is reliant on fossil fuels, commonly has been utilized in order to
produce hydrogen, which is not a clean process.[3]
Hydrogen also can be obtained by biochemical, thermochemical and electrochemical methods.
Some of these paths may need to be considered in order to make hydrogen production clean and
economically viable. Currently, due to flammability and the formation of explosive mixtures with
air, the major problems with using hydrogen as on-board fuel are its storage and transport.
Consequently, only a few hydrogens fueling stations have been established up to this point, mostly
in Europe and some in the USA.[4] In order to overcome the barriers regarding its expensive
transportation and also storage, hydrogen in various hydrogen carriers such as ammonia, methanol
or ethanol can be conserved. Among the prospective hydrogen carrier chemicals, ammonia is
easily accessible in agricultural fertilizers and industrial waste, which can be regarded as the best
candidate as it is a carbon-free chemical and only forms N2 by its oxidation.[5] Besides, comparing
to other potential hydrogen carriers, ammonia demonstrates significant hydrogen content density
approximately 130 kg H2/m3 compared with methanol 95 kg H2/m
3, ethanol 105 kg H2/m3 and even
greater than liquid hydrogen around 70 kg H2/m3.[5][6]
Ammonia is a versatile form of energy since ammonia can be manufactured for use in fuel cells
directly. There has been a comprehensive study of fuel cells (FC) using ammonia for mobile
electricity generation and as transportation energy sources.[7][8][9] Ammonia has roughly
equivalent energy density compared to compressed natural gas (CNG) and methanol about 10.5
GJ/m3 without CO2 emission during the power generation pathway.[4][10][11] Additionally,
ammonia can be categorized within non-flammable chemicals, which make it suitable to employ
in the transportation sector.
The development of direct ammonia anion-exchange fuel cells in alkaline solution with possible
use in transport and other applications has already been revealed.[12][13] In order to generate
3
power, electrochemical oxidation of ammonia provides the ability to utilize ammonia from the
human, animal, agricultural and industrial waste considering its benefits, including relatively low
intermediate waste formation and ease of use. Ammonia can be broken down into nitrogen gas by
an electrochemical technique, which is environmentally harmless species.[14] Additionally, using
ammonia as such a power source has a range of benefits such as minimal cost and easy
retention.[15] Several articles on the catalytic oxidation of ammonia have been reported [16][17];
however, researches in order to develop efficient catalysts to increase reaction kinetics and make
this technology more achievable, are still going on.[18][19][20]
1.2 The objective of this study
In order to boost clean power generation by clean resources like ammonia and for reducing
emissions of greenhouse gases, the steps should be taken to make this replacement of traditional
fuels with renewables more efficient and economically viable. Development and optimization of
active electrocatalysts for ammonia electrooxidation would improve the reaction kinetics to take a
step towards achieving this critical goal. The objective of this study is to investigate Pt-based
nanostructured catalysts for electrochemical oxidation of ammonia in alkaline media in order to
develop efficient and stable catalytic systems for ammonia electrooxidation in direct ammonia fuel
cells. The specific goals of the work are:
i. To investigate the size effect of Pt nanoparticles on ammonia electrooxidation kinetics and
product distribution.
ii. To carry out polarization modulation infrared reflection absorption spectroscopy (PM-
IRRAS) studies.
iii. To study the bimetallic electrocatalysts, PtRu and PtIr, for ammonia electrooxidation.
It is expected that understanding of the process will guide the design and implementation of
efficient electro-catalysts, resulting in the development of direct ammonia fuel cells with higher
efficiency and longer lifetime.
4
1.3 References
[1] Https://www.globalcarbonproject.org/, “The Global Carbon Project (GCP),” 2018.
[2] D. K. Ross, “Hydrogen storage: The major technological barrier to the development of
hydrogen fuel cell cars,” Vacuum, vol. 80, no. 10, pp. 1084–1089, Aug. 2006.
[3] B. Viswanathan and B. Viswanathan, “Introduction,” Energy Sources, 1-28, Jan. 2017.
[4] G. L. Soloveichik, “Liquid fuel cells,” Beilstein J Nanotechnol. ; 5, 1399–1418, 2014.
[5] T. V. Asbjørn Klerke , Claus Hviid Christensen, Jens K. Nørskov, “Ammonia for
hydrogen storage: challenges and opportunities,” J. Mater. Chem., 18, 2304-2310, 2008.
[6] Z. Andreas, R. Arndt, B. Andreas, and F. Oliver, “Hydrogen: the future energy carrier,”
Philos. Trans. R. Soc. A Math. Phys. Eng. Sci. 368, 1923, 3329-3342, 2010.
[7] F. R. Dr. Ibrahim Dincer, Yusuf Bicer, Greg Vezina, “Green Transportation Fuel:
Ammonia,” 2017.
[8] O. Siddiqui and I. Dincer, “A review and comparative assessment of direct ammonia fuel
cells,” Therm. Sci. Eng. Prog., vol. 5, pp. 568–578, Mar. 2018.
[9] O. Siddiqui and I. Dincer, “Development and performance evaluation of a direct ammonia
fuel cell stack,” Chem. Eng. Sci., vol. 200, pp. 285–293, Jun. 2019.
[10] D. Cheddie, “Ammonia as a Hydrogen Source for Fuel Cells: A Review,” 2011.
[11] C. Zamfirescu and I. Dincer, “Using ammonia as a sustainable fuel,” J. Power Sources,
vol. 185, no. 1, pp. 459–465, Oct. 2008.
[12] R. L. and S. Tao, “Direct Ammonia Alkaline Anion-Exchange Membrane Fuel Cells,”
Electrochem. Solid-State Lett. , 13, B83-B86, 2010.
[13] A. Valera-Medina, H. Xiao, M. Owen-Jones, W. I. F. David, and P. J. Bowen, “Ammonia
for power,” Prog. Energy Combust. Sci., vol. 69, pp. 63–102, Nov. 2018.
[14] K.-W. Kim, Y.-J. Kim, I.-T. Kim, G.-I. Park, and E.-H. Lee, “Electrochemical conversion
characteristics of ammonia to nitrogen,” Water Res. 40, 7, 1431-1441, Apr. 2006.

5
[15] P. J. Feibelman, “Thoughts on Starting the Hydrogen Economy,” Phys. Today, 58, 6, 13-
14, Jun. 2005.
[16] C. Plana, S. Armenise, A. Monzón, and E. García-Bordejé, “Ni on alumina-coated
cordierite monoliths for in situ generations of CO-free H2 from ammonia,” J. Catal. 275,
2, 228-235, Oct. 2010.
[17] T. Choudhary and D. Goodman, “CO-free fuel processing for fuel cell applications,”
Catal. Today, 77, 2,65-78, Dec. 2002.
[18] Z. Wang, Y. Qu, X. Shen, and Z. Cai, “Ruthenium catalyst supported on Ba modified
ZrO2 for ammonia decomposition to COx-free hydrogen,” Int. J. Hydrog. Energy, 44,
14,7300-7307, Mar. 2019.
[19] A. B. and R. T. O. A. M. Pourrahimi, R. L. Andersson, K. Tjus, V. Ström, “Making an
ultralow platinum content bimetallic catalyst on carbon fibres for electro-oxidation of
ammonia in wastewater,” Sustain. Energy Fuels, 3, 2111-2124, 2019.
[20] J. Liu et al., “Pt Monolayers on Electrodeposited Nanoparticles of Different Compositions
for Ammonia Electro-Oxidation,” Catal. 9, 4, Dec. 2018.

6
Chapter 2: Literature review
2.1 Ammonia: a versatile Hydrogen carrier chemical
Ammonia has been recognized as a potential energy carrier for power generation and fuel cell
applications. Besides, it is playing a crucial role in agriculture as a fertilizer used in the agricultural
industries.[1] Since it is extensively utilized in fertilizers, there is already a highly industrialized
ammonia production platform to deliver it in high quantities per year.[2] It means ammonia storage
and transportation, unlike liquid hydrogen, is a promising technology that does not necessitate
further advancement.[2][3] In a comparison that was made among various fuel sources ( Fig. 2-1)
to utilize in the transportation sector, including gasoline, methanol, hydrogen and ammonia,
ammonia is the most cost-effective source of energy, approximately 3 US$ per 100 km.[4]
Figure 2-1: An energy cost evaluation in C$ per GJ for transportation fuel sources (recreated from a report in Green Transportation Fuel: Ammonia, University of Ontario Institute of
Technology and Hydrofuel Inc., 2017)[4]
Thereupon, making strategic decisions by governments in order to utilize ammonia as a renewable
source of energy would lead to the sustainment of this technology for the manufacturing and use
of ammonia at reduced expenses than other sources of energy.
The Haber-Bosch method, which synthesizes ammonia from its main components, hydrogen and
nitrogen, is the most prevalent method for ammonia production.[5] This operation is usually
conducted in a reactor at 300 to 500 ᵒC with a 15% conversion in which N2 obtained from air and
7
hydrogen can be provided from various supplies.[6] Currently, hydrogen is produced from natural
gas reforming, roughly 48%, and extensively utilized in ammonia production, approximately
50%.[7] Some manufacturers employ pure carbon dioxide to form pure ammonia or urea
fertilizers.
The adverse impact on the environment of the present NH3 manufacturing sector can be
considerably reduced by using renewable resources to operate the ammonia synthesis. For
instance, nuclear hydrogen would be another possibility to form a carbon-free hydrogen production
pathway using obtained electricity from nuclear reactors.[8] Ammonia synthesis was also reported
from a direct reaction between N2 and H2O using solid electrolyte at a temperature around 300 ᵒC
eliminating the H2 manufacturing process.[9][10][11][12] Recently, electrochemical reduction of
N2 has gained massive consideration owing to the use of electricity generated from existing
renewables like wind and solar energy.[13][14][15][16][17][18] The typical reduction reaction
should contain a suitable electrocatalyst with high activation energy (Ea) and low binding energy
(ΔE). Emerging technology is aimed at manufacturing ammonia more effectively than the
techniques commonly used, therefore producing less energy-intensive ammonia.[19] Unlike to
abovementioned approach in which water was used instead of H2 in ammonia synthesis, hydrogen
sulphide was applied. The benefit of this method is H2S as an environmental contaminant, and the
hazardous waste material can be transformed into ammonia.[19]
On the other hand, extensive studies related to the electro-oxidation of ammonia have been
conducted due to spreading energy and environmental concerns in order to cover not only
sustainable energy storage but contaminant elimination.[20][21][22][23] The electrooxidation of
ammonia has gained significant attention for different applications from energy production,
economic and environmental perspectives such as direct ammonia fuel cells, wastewater treatment,
pure hydrogen production to feed proton exchange membrane (PEM) fuel cells and
sensors.[24][25][26][27]
As a result, the research of the ammonia electro-oxidation is indeed a significant environmental
subject for utilization of ammonia in fuel cells as an alternative source of clean energy
[28][29][30][31][32] Recently, ammonia utilization for power generation has been highly
promoted by the International Energy Agency (IEA) [33] and introduced as renewable source of
energy like solar and wind. According to a report, it is less expensive to store ammonia for a longer
8
period, about 0.5 $ per kg H2 relative to 15 $ per kg H2 in roughly less than a year.[34]
Governments and global organizations have thus begun to present the capability of ammonia as a
versatile hydrogen carrier as a principle that has continued to increase explorations on its
applications as a promising source of power. In Japan, numerous ammonia power systems for
transport applications have been evaluated by estimating energy efficiency as well as the expense
of storage and CO2 production.[35][36] It was found that when long-term supply was desired,
ammonia is a competitive fuel source compared to electrical power and hydrogen. Different
approaches to ammonia production that can be used in urban transport and energy production have
been evaluated.[37][38] The findings indicated that in comparison to cars utilizing conventional
types of energy, carbon dioxide emissions were significantly lowered in this evaluation.
2.2 Ammonia fuel cells
As mentioned earlier, due to several privileges such as cheaper and easier storage and
transportation, high hydrogen and energy content and moderate liquefaction point in comparison
to other potential fuel sources, it has been proposed by researchers to utilize ammonia directly in
fuel cells for stationary and on-board power generation.[39][40][41] Subsequently, the significant
developments of fuel cell design indicate that further advances are extremely probable; as a result,
fuel cells can be considered a realistic option for using ammonia for energy generation.[42] Solid
oxide fuel cells (SOFC) have been investigated recently in order to use ammonia as a fuel source
for vehicles.[42][41] The most recent research showed that direct ammonia SOFC generated
electricity at the same rate as that of hydrogen fuel.[43][44] Ammonia has also been introduced as
a viable substitute for hydrogen for proton exchange membrane fuel cells (PEMFC) since it does
not contain CO like produced hydrogen from steam reforming to poison the anode.[45] However,
it was shown that ionic residues remained from ammonia can affect the membrane and decrease
the efficiency by blocking the membrane charge sites resulting in declined relative proton
conductivity.[46][47] In direct ammonia fuel cells, the anion exchange membranes could also be
used as alkaline electrolytes.[48][49] Different catalysts were examined in direct ammonia anion
exchange membrane FCs.[49] The efficiency for the Pt/C electrode was found to be greater than
that of for PtRu/C. Figure 2-2 shows an anion exchange membrane fuel cell using ammonia as

9
feed and corresponding anodic and cathodic reactions. The anodic and cathodic reaction of alkaline
electrolytes in ammonia oxidation reaction uses up ammonia as feed directly and hydroxide ions
to produce N2, water and electrons. Then, the hydrogen content of water would be reduced
following by OH− ions deoxidation.[50]
Figure 2-2: Schematic diagram of direct ammonia fuel cell and anodic-cathodic reactions (adapted by permission)[50]
2.3 The reaction mechanism of ammonia electrochemical oxidation
Considering the ammonia electrooxidation reaction kinetics, various mechanisms have been
suggested with distinctive interpretations mostly about the species that are responsible for the
creation of N2.[51][52][53][54] Meanwhile, in 1969, Gerischer and Mauerer offered the most
commonly accepted mechanism for ammonia electro-oxidation in alkaline media on platinum
surfaces. [54] Considering this mechanism, NH3, aq after being adsorbed on the surface of Pt,
would be dehydrogenated and form NH2, ads and NHads. With subsequent dehydrogenation and

10
dimerization of partly dehydrogenated ammonia species, N2Hy (y=2-4) species would be
generated, which were hypothesized to be the active intermediates in selective oxidation reaction
to N2.[55] By further dehydrogenation, N adsorbate atoms would form, which acts as a poison
since it is forcefully attached to the surface of the electrode until it is discharged as NOx at higher
anodic potentials.[31][56] The strong affinity of catalysts toward nitrogen adsorbate atoms may
lead to a sluggish process since the formation of N-N bonds can be considered as a rate-limiting
step and the poisoning of the surface of a catalyst may happen quickly.[57][58][59] The
production of azide anion has also been discussed in the same mechanism as a feasible route for
N2 formation.[60]
NH3 + N2H4 + 7OH- N3- + 7H2O + 6e-
Pt + N3- PtN3
-
PtN3- + 2H2O + e- PtNH2 + 2OH- + N2
The general mechanism follows these steps:
NH3(aq) NH3,ads
NH3,ads + OH- NH2, ads + H2O + e-
NH2,ads + OH- NH, ads + H2O + e-
NHx,ads + NHy,ads N2Hx+y,ads
N2Hx+y,ads + (x+y) OH- N2 + (x+y) H2O + (x+y) e-
NHads + OH- N ads + H2O + e-

11
Numerous academic researches have proved the value of the Gerischer and Mauerer mechanism,
and also several mathematical studies have indicated that this is the most likely path
electrochemically.[60][61][31][62][63][64][65]
2.4 Electrocatalysts for ammonia electrooxidation
Analysis and decomposition of materials seem to be the essence of the modern chemical industry
since nano-structured catalysts are currently used by approximately all technologies. It has
experienced breakthrough modifications in the control of size, shape and structure of the metallic
and non-metallic catalysts over the past couple of decades. Many attempts have been made so far
by investigators in order to improve surface features by applying an essential knowledge of
nanocatalysts, contributing to the development of efficient and cost-effective nano-
catalysis.[66][67][68][69] Some catalyst structure-dependent reactions using nano-catalysts in
different shapes such as spherical, cubic, nanowire and nanotube as well as various sizes including
support or as unsupported catalyst, have been investigated to find the highest efficiency with the
modified surface area.[70][71][17][72][73] The main difficulties regarding ammonia
electrooxidation are related to the sluggish kinetic rates of the electro-oxidation reaction. It is
essential to address these issues by the development of high-performance electrocatalysts for
ammonia electro-oxidation. An appropriate catalyst should meet a couple of prerequisites,
including high activity and stability as well as proper cost. In ammonia electrooxidation, the
efficiency and cost-effectiveness of electrocatalysts play a vital role in supporting large-scale and
industrial applications. Generally, electrocatalysts for this purpose can be categorized according
to the active portion in three main groups, namely pure monometallic catalysts, Pt-based bimetallic
catalysts and non-Pt-based catalysts.
2.4.1 Pure monometallic catalysts
In terms of activity, Pt is the most active monometallic electrocatalyst toward ammonia
electrooxidation.[65] Affinity to nitrogen adsorption on different metals including Ru, Rh, Pd, Pt
and coinage metals like Au, Ag and Cu would be according to this order: Ru > Rh > Pd > Ir > Pt
12
>> Au, Ag, Cu which makes it possible for Ru, Rh and Pd to oxidize ammonia at lower potential
than Pt, however, the resulting nitrogen adsorption on the surface would lead to catalyst
deactivation occurs much faster than Pt.[65] Besides, Pt has already been demonstrated to be the
one recognized metal in which the impact of the poisoning of the surface by N atoms is noticeably
reversible.[74] By another study, these findings have been proved that further ammonia oxidation
to nitrogen would impregnate the electrodes irreversibly.[75] Carbon-supported Ir and Rh seemed
to have lower activity in comparison to Pt due to deactivation as a result of nitrogen atoms
production and adsorption on the electrode surface.[74] However, the onset potential for ammonia
electrooxidation shifted toward the lower potential for carbon-supported Ir and Rh, which
explicitly states a reduction in hydrogen binding energy. It has been hypothesized that oxidation
occurs when the Pt surface has desorbed hydrogen atoms.[74] For mentioned coinage metals, Cu,
Ag and Au, during the electrooxidation reaction, the active intermediates are not founded due to
their low affinity to nitrogen atoms and, therefore low dehydrogenation capacity which makes
them inactive in selective oxidation to nitrogen.[65] Although ammonia would be dehydrogenated
by metals including Ru, Rh, and Pd with elevated nitrogen adsorption binding energy at
considerably lower potential than on Pt and Ir, this would lead to the production of surface nitrogen
atoms at lower potential than Pt and Ir since strong adsorption affinity does not allow two nitrogen
adatoms to be recombined to form N2.[76] [54]Consequently, the majority of studies on ammonia
electrooxidation catalysis remains focused on pure Pt and Pt-based bimetallic.[74] For instance,
recently, an investigation was done on Platinum electrodes which were roughened by wave
voltammetry in order to modify the structure of surface active sites.[77] In comparison to
polycrystalline Pt, trigonal nano-pyramids showed the highest modification by showing improved
activity.
2.4.2 Pt-based bimetallic catalysts
Significant attempts have been made to improve Pt-based electrocatalysts with elevated ammonia
electro-oxidation activity and low Pt loading concurrently in order to lower the cost. Several
findings have demonstrated that alloying Pt with Ir has enhanced catalytic activity relative to Pt

13
monometallic.[78][79][80][35][81] Ir has been widely coupled with Pt since it has a lower
oxidation potential, preparing greater selectivity of nitrogen production and also reduced poisoning
rate than Pt.[35] Pt70Ir30 was showed higher productivity of N2 formation that also showed a
decrease in surface poisoning with enhancing ammonia concentration in comparison to pure
Pt.[78] Incorporating Pd and Pt was resulted in lowering the onset potential of ammonia oxidation
while the stability also significantly decreased. Catalytic activity was comparable to Pt for PtSnOx,
although its stability was enhanced toward deactivation comparing Pt. In this study,
electrochemical measurements on Carbon-supported PtIr nanoparticles not only demonstrated
enhanced activity but improved stability toward ammonia electro-oxidation, which could be due
to developed electronic effects as a result of interaction between metals leading weakness of the
adsorption intensity of poisonous intermediates.[80] In a similar study different atomic ratios of
PtIr revealed a slightly reduced oxidation potential than Pt as well as marginally greater peak
current density due to synergistic interaction between Pt and Ir. Various atomic ratios of PtCu
bimetallic displayed catalytic activity lower than Pt with the same identical oxidation potential.[35]
Carbon-supported Pt50Au50 and Pt70Au30 were also investigated in ammonia electrooxidation,
where Pt70Au30 showed higher current density, approximately 20% greater than carbon-supported
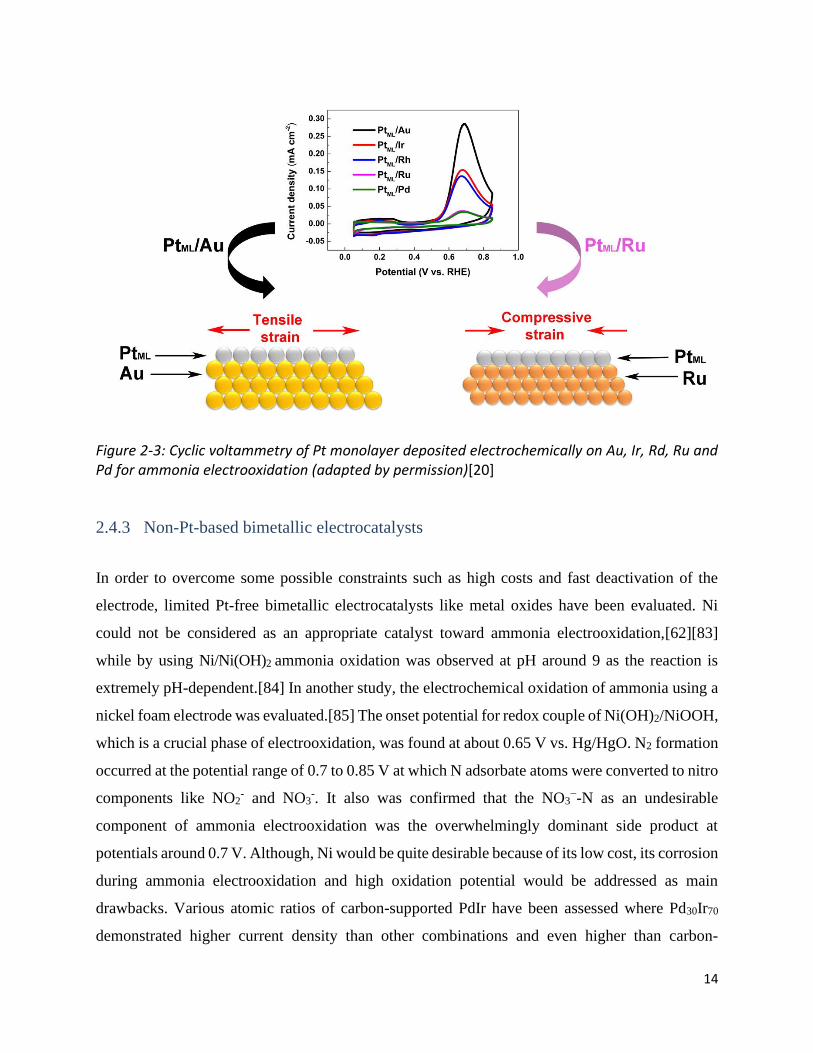
Pt using electrochemical measurements.[82] In a recent study, a monolayer of Pt was prepared by
electrodeposition on different nanoparticles including Ir, Ru, Pd and Au.[20] Results were revealed
that the activity and performance of the catalyst are really linked to the applied support (Fig. 2-3).
The best function was obtained from Pt monolayer deposited on Au which was around eight times
higher than Ru and Pd due to lattice changes shown in figure 2-3. In another investigation, it was
reported that the activity of the synthesized NiPt using 1 mg cm−2 of Pt loading is equivalent to the
Pt monometallic electrode following continuous increase by increasing the Pt content of electro-
catalyst which would be due to consistent dispersal of Pt on the surface of Ni followed by Pt size
reduction leading to a substantial gain of the active sites.[83] Further studies on binary
electrocatalysts illustrated that Ru was also found to lower the oxidation potential compared to
pure Pt when it has been partnered with Pt.[35]
14
Figure 2-3: Cyclic voltammetry of Pt monolayer deposited electrochemically on Au, Ir, Rd, Ru and Pd for ammonia electrooxidation (adapted by permission)[20]
2.4.3 Non-Pt-based bimetallic electrocatalysts
In order to overcome some possible constraints such as high costs and fast deactivation of the
electrode, limited Pt-free bimetallic electrocatalysts like metal oxides have been evaluated. Ni
could not be considered as an appropriate catalyst toward ammonia electrooxidation,[62][83]
while by using Ni/Ni(OH)2 ammonia oxidation was observed at pH around 9 as the reaction is
extremely pH-dependent.[84] In another study, the electrochemical oxidation of ammonia using a
nickel foam electrode was evaluated.[85] The onset potential for redox couple of Ni(OH)2/NiOOH,
which is a crucial phase of electrooxidation, was found at about 0.65 V vs. Hg/HgO. N2 formation
occurred at the potential range of 0.7 to 0.85 V at which N adsorbate atoms were converted to nitro
components like NO2- and NO3
-. It also was confirmed that the NO3−-N as an undesirable
component of ammonia electrooxidation was the overwhelmingly dominant side product at
potentials around 0.7 V. Although, Ni would be quite desirable because of its low cost, its corrosion
during ammonia electrooxidation and high oxidation potential would be addressed as main
drawbacks. Various atomic ratios of carbon-supported PdIr have been assessed where Pd30Ir70
demonstrated higher current density than other combinations and even higher than carbon-
15
supported Pd and Ir, approximately 25 mA mg-1.[86] This result could be due to adequate
distribution of Pd active sites leading ammonia dehydrogenation at lower potential with lower Ir
surface blockage by nitrogen adsorbate atoms. Indeed, this category of catalysts has some
challenges mostly regarding high oxidation overpotential as well as lack of knowledge related to
their reaction pathway and mechanism.[87]
2.5 Electrolyte
The electro-oxidation of ammonia in alkaline solutions attracted attention due to successful
operation reports.[88][89] Potassium hydroxide solution (KOH) is mainly the additional
electrolyte used mostly for ammonia electrochemical oxidation.[90] Since pH is a crucial factor,
the enhancement of pH improves the rate of reaction. The rate of electro-oxidation of ammonia is
highest at 5 M KOH concentration, where the pH exceeds 14, which results in quicker reaction
than neutral and acidic mediums.[91][92]
The alkaline electrolyte can be considered highly desirable since it has also illustrated acceptable
performance in direct ammonia fuel cells.[88] The various ratios of NH4OH and KOH were tested
as a fuel source and the best performance was obtained by a mixture containing 3 M KOH+ 3 M
NH4OH in which 3 M was the highest concentration of KOH. It would be due to the enhancement
of conductivity, leading to better ammonia electrooxidation.
2.6 Electrochemical measurements
2.6.1 Cyclic voltammetry and chronoamperometry
The identification of electrochemical reaction mechanisms on nanocatalysts and their active
surface area would be possible by using cyclic voltammetry measurements.[93] Cyclic
voltammetry (CV) is a method used to study mechanisms of a reaction containing electrons
transfer includes a linear variation of an electrode potential at a special rate in a potential range
when recording the current in an electrochemical cell.[94] Oxidation and reduction states and the
reversibility of the reaction can also be obtained by sweeping the potential of a working electrode
from the lower potential in the range to the upper one using a determined scan rate (Fig. 2-4).

16
Considering Pt nanoparticles, an investigation was done in order to evaluate the hydrogen
adsorption by different Pt faces using CV features.[95] It was noticed that several hydrogen
adsorptions and desorption peaks were obtained, which was explained that the more intensive
hydrogen adsorption peaks in the hydrogen region were mostly about adsorption on the Pt (100)
and (110) facets and the less intense peak is related to Pt (111). The potential reason would be due
to differences in energy levels of Pt facets because of electric fields causing different interactions
between Pt and hydrogen atoms.[96] The area appeared without oxidation and reduction peaks is
ascribed to the double-layer region corresponding to solid and liquid interfaces leading to positive
and negative charge isolation.[97] Any observed peak in this area could be assigned to heavy metal
contaminations.[96] well-defined peaks after -0.2 V, showed in figure 2-4, in the oxygen region
are attributed to Pt-O as a result of oxygen adsorption and desorption on the surface of the Pt
electrode.[96] By increasing the potential to higher than 0.1 V, the oxygen evolution would
occur.[98]
Figure 2-4: Cyclic voltammetry graph in 1M KOH on Pt/C 40wt% at scan rate of 20 mVs-1
Chronoamperometry is an electrochemical method in which the electrode current is evaluated as a
function of time and varies from the bulk of the solution to the surface according to the diffusion

17
behaviour of an analyte.[94] This technique is to examine both catalytic activity and stability at the
same time, which can be performed by recording the current while the potential has been kept
constant.[99] In an electrochemical oxidation reaction on the surface of the electrode by the
progression of the reaction, the reactant is consumed with time leading to the formation of a thick
diffusion layer between the electrolyte and the surface of the catalyst.[100] This depletion would
cause a drop in current during the time and as a result the faster drop, the lower durability.
2.6.2 Evaluation of electrochemical active surface area (ECSA)
The main criterion for considering an electrocatalyst as the most active catalyst among the others
is by comparing their catalytic activity (current) normalized by electrochemical active surface area
(ECSA). As a result, it is crucial to find ECSA in order to recognize the connection between
activity toward electrooxidation reactions and the structure of electrocatalyst. Mostly in literature,
for some noble metals including Pt,[101] Ir, Rh[102] and Pt-based nanocatalysts[103] integration
of the area under the hydrogen desorption/adsorption region in cyclic voltammetry measurements
(CV) were frequently applied to obtain active surface area.[104][105][106] The integration of the
area gives the required charge for the generation of hydrogen monolayer that should be divided by
theoretically required charge at 210 µCcm-2 [101] to form a monolayer to result in active surface
area.[96] CO stripping is another accepted method for the determination of ECSA which is based
on CO adsorption on the surface of the catalyst and subsequent oxidation by applying a potential.
In this method, ECSA would be yielded by considering the ratio between integrated surface area
under the oxidation peak between first and second cycle in the corresponding CV and theoretical
charge required for oxidation of a CO monolayer (Fig. 2-5).[100] The first cycle displays CO
adsorption peak which would be oxidized in the second cycle. It can be considered as a useful
technique for Ru and Ru-based catalysts since hydrogen adsorption would be intervened by oxygen
adsorption on the surface of Ru led to inaccurate ECSA.[107][108] High tendency of Ru toward
oxygen species would lead to formation of water on the surface that triggers a high pseudo-
capacitance of Ru-based catalysts. In addition to these above-mentioned methods, some techniques
like Atomic force microscopy (AFM) and Brunauer–Emmett–Teller (BET) method have been
extensively studied which are mostly for metal oxides.[109]

18
Figure 2-5: CO stripping, first cycle (black line) and second cycle (red line) (adapted by permission) [110]
2.7 Identification of oxidation species using in-situ techniques
Infrared spectroscopy includes a delicate indicator for functional groups generated during a
reaction. In-situ surface-sensitive approaches have already evaluated the exploration of the formed
species on the surface of the catalyst and also in the electrolyte during electrochemical
reactions.[110] In the study of the reaction mechanisms of various electrochemical reactions,
spectroscopic approaches including in-situ Infrared Spectroscopy (IR) [111][112], Surface
Enhanced Raman Spectroscopy (SERS)[60] and in-situ Differential Electrochemical Mass
Spectroscopy (DEMS)[31] were widely applied. The primary objective and the focus of in-situ
techniques here would be on monitoring the ammonia oxidation products in the oxidation region
in the possible area under evaluation. In-situ Fourier transform infrared reflection absorption
spectroscopy (FT-IRRAS) was utilized in research to distinguish ammonia oxidation products on
Pt electrocatalyst. However, no indications of adsorbed N-H species could be observed since the
wavenumber areas of water and nitrogen were strongly overlapped.[112] In a similar study using
19
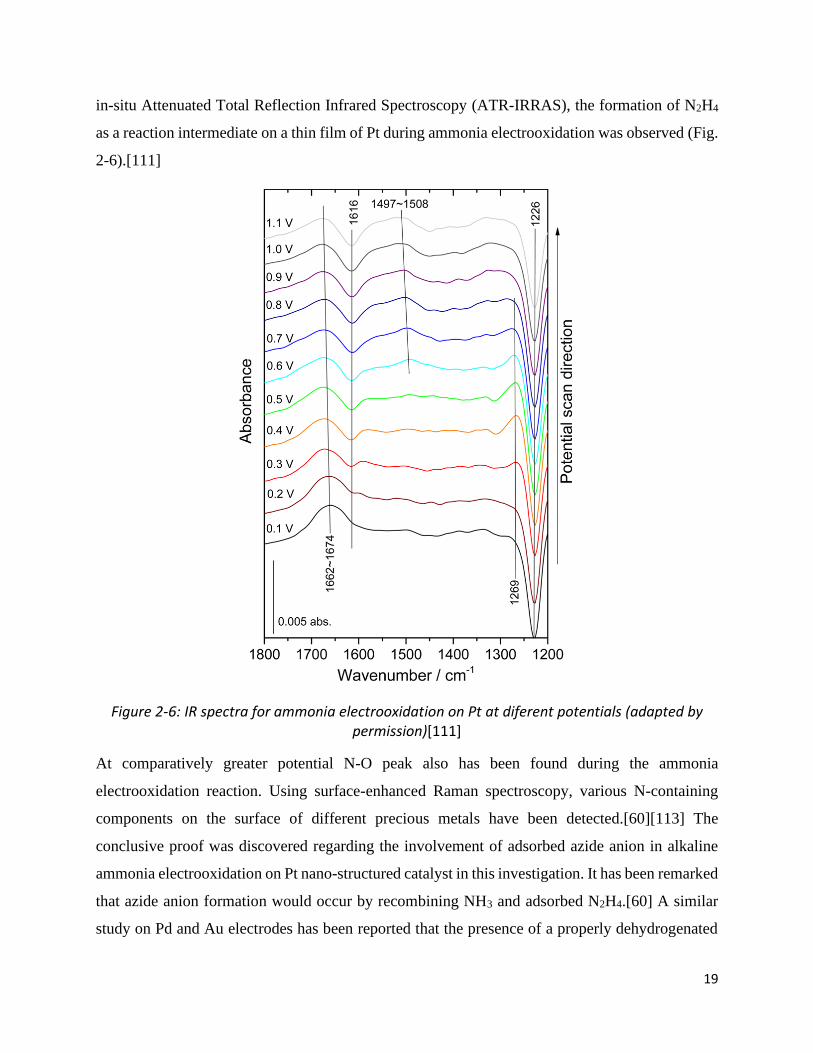
in-situ Attenuated Total Reflection Infrared Spectroscopy (ATR-IRRAS), the formation of N2H4
as a reaction intermediate on a thin film of Pt during ammonia electrooxidation was observed (Fig.
2-6).[111]
Figure 2-6: IR spectra for ammonia electrooxidation on Pt at diferent potentials (adapted by permission)[111]
At comparatively greater potential N-O peak also has been found during the ammonia
electrooxidation reaction. Using surface-enhanced Raman spectroscopy, various N-containing
components on the surface of different precious metals have been detected.[60][113] The
conclusive proof was discovered regarding the involvement of adsorbed azide anion in alkaline
ammonia electrooxidation on Pt nano-structured catalyst in this investigation. It has been remarked
that azide anion formation would occur by recombining NH3 and adsorbed N2H4.[60] A similar
study on Pd and Au electrodes has been reported that the presence of a properly dehydrogenated

20
nitrogen adsorbed species on the surface of Pd was observed. However, it was revealed that unlike
Pd, Au is not active toward ammonia dehydrogenation to form a nitrogen molecule.[61] By
differential electrochemical mass spectroscopy (DEMS), which is the incorporation of
electrochemical measurements with mass spectroscopy, the relevance between the species posses
oxygen with spectroscopic products on the Pt surface was developed.[114] At lower potential and
in the absence of oxygen-containing species, the productivity of nitrogen molecule formation was
higher. In contrast, at higher potential with the organization of N-O species, product formation
selectivity thereby would be reduced which is compatible with the other spectroscopic
outcomes.[114][115][116][117][31] As a result, there have been found that inappropriate
intermediates of ammonia electrochemical oxidation reactions such as NO, NO2 and adsorbed N
atoms would restrict N2 production.
Generally, for investigation of solid-liquid interfaces in molecular scale, Infrared reflection
absorption spectroscopy (IRRAS) is an effective approach[118]. Nevertheless, some
complications, like the electrolyte's powerful IR absorption, may emerge led to hiding the surface
specious. Besides, the challenge in obtaining the reference spectrum under precisely the same
environment for any samples, make it much more intricate. To overcome these barriers, a
modulation method of polarized light between the horizontal and vertical amplitudes was
introduced and used in an approach described as polarization modulation infrared reflection
absorption spectroscopy (PM-IRRAS) to attain greater amplified signals from the surface species
on the electrode and electrolyte interfaces.[119][120] These observations in molecular scale have
always been crucial for recognition of the association between interfaces and the adsorbed
molecules.[121] Considering PM-IRRAS as a practical approach, the reference spectrum can be
collected once for the same electrolyte through polarization modulation.[122] Polarization
modulation technique, according to the infrared study on metal catalyst surfaces [123][124],
illustrates that surface and bulk phase species absorb p-polarized exposures while s-polarized light
radiation would be mostly absorbed by species in the bulk of electrolyte which can be introduced
as a reference spectrum.[125]
In a recent study, PM-IRRAS was employed for the identification of oxidation species formed
during ethanol electrochemical oxidation on Pd in alkaline media (Fig. 2-8).[126] The spectra were
recorded while the potentials were kept constant by using chronoamperometry. A Teflon cell was

21
designed and adjusted, as shown in the schematic diagram (Fig. 2-7) for experimenting. Figure 2-
8 displays the surface results at different potentials in the left side and the oxidation products in
the bulk of electrolyte in the right. As can be seen in the graph a and b, at 0.21 V/RHE, oxidation
products were not observed, which agrees with the corresponding CV at this particular potential.
Their findings demonstrated that although the C−C bond on supported Pd can be broken to form
CO2 at lower potential (Fig. 2-8 c,d), the selectivity would also be weak due to potential
competition between the formation of various products. The differences in the intensity of CO2
peaks on the surface and in bulk would be due to immediate desorption from the surface to the
bulk of solution after formation.
Figure 2-7: Schematic diagram of designed Teflon cell for spectroelectrochemical measurements (adapted by permission)[126]

22
Figure 2-8: PM-IRRAS spectra for ethanol electrooxidation on Pd/C for identification of oxidation species on the surface (left) and in the bulk of electrolyte (right) at different potentials (Adapted
by permission)[126]
In a similar study of PM-IRRAS for glycerol electrooxidation on NiPd with different atomic ratios,
the predominant products of the reaction were investigated.[124] The main products on all
synthesized catalysts were distinguished separately on the surface and in the solution leading to a
better understanding of reaction mechanism (Fig. 2-9 a-h). The intensity of peaks increases by
increasing the potential by moving toward the oxidation region. To the best of our knowledge, any
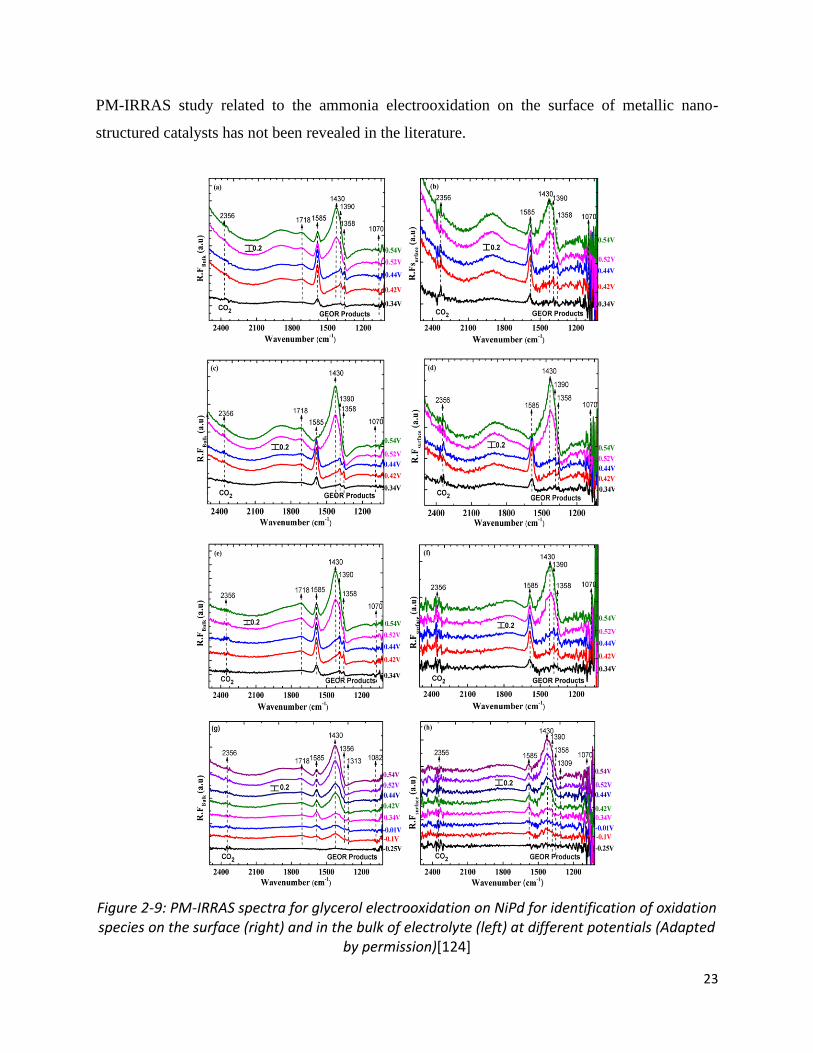
23
PM-IRRAS study related to the ammonia electrooxidation on the surface of metallic nano-
structured catalysts has not been revealed in the literature.
Figure 2-9: PM-IRRAS spectra for glycerol electrooxidation on NiPd for identification of oxidation species on the surface (right) and in the bulk of electrolyte (left) at different potentials (Adapted
by permission)[124]

24
2.8 Scope of the project
Modification of electrocatalysts in electrochemical oxidation processes is a fundamental
requirement that should be met in order to obtain a sustainable source of energy. Given the recent
developments and investigations in this sector, the purpose of this study is to provide information
related to critical factors that can play an essential role in the catalytic performance of both Pt and
Pt-based catalysts using in-situ polarization modulation infrared reflection absorption
spectroscopy in order to investigate catalyst-electrolyte interfaces.
2.9 References
[1] R. S. and D. S. S. F. Schüth , R. Palkovits, “Ammonia as a possible element in an energy infrastructure: catalysts for ammonia decomposition,” Energy Environ. Sci., 2012, 5, 6278-6289, 2012.
[2] L. Green, “An ammonia energy vector for the hydrogen economy,” Int. J. Hydrogen Energy, vol. 7, no. 4, pp. 355–359, Jan. 1982.
[3] C. Zamfirescu and I. Dincer, “Ammonia as a green fuel and hydrogen source for vehicular applications,” Fuel Process. Technol. 90(5)729-737, 2009.
[4] F. R. Dr. Ibrahim Dincer, Yusuf Bicer , Greg Vezina, “Green Transportation Fuel: Ammonia,” 2017.
[5] Z. K. & W. W. Jan Willem Erisman, Mark A. Sutton, James Galloway, “How a century of ammonia synthesis changed the world,” Nat. Geosci. Vol. 1, pages 636–639, 2008.
[6] T. V. Asbjørn Klerke , Claus Hviid Christensen , Jens K. Nørskov, “Ammonia for hydrogen storage: challenges and opportunities,” J. Mater. Chem., 18, 2304-2310, 2008.
[7] “http://www.eoearth.org/article/The_Hydrogen_Economy? topic¼60603.” .
[8] H. C. M. Stoots, J. E., O’Brien M. G., McKellar E. A., “High-Temperature Electrolysis for LargeScale Hydrogen and Syngas Production from Nuclear Energy – System Simulation and Economics,” in International Conference on Hydrogen Production, 2009.
[9] M. J. L. and S. L. Baochen Cui , Jianhua Zhang , Shuzhi Liu, Xianjun Liu, Wei Xiang, Longfei Liu, Hongyu Xin, “Electrochemical synthesis of ammonia directly from N2 and water over iron-based catalysts supported on activated carbon,” Green Chem.,19, 298-304, 2017.
[10] A. Tsuyoshi Murakami, Toshiyuki Nohira, z Yasuhiro Araki, Takuya Goto and R. H. and Y. H. Ogata, “Electrolytic Synthesis of Ammonia from Water and Nitrogen under Atmospheric Pressure Using a Boron-Doped Diamond Electrode as a Nonconsumable Anode,” Electrochem. Solid-State Lett. 10 _4_ E4-E6, 2007.
[11] T. Murakami, T. Nohira, T. Goto, Y. H. Ogata, and Y. Ito, “Electrolytic ammonia synthesis from

25
water and nitrogen gas in molten salt under atmospheric pressure,” Electrochim. Acta, vol. 50, no. 27, pp. 5423–5426, Sep. 2005.
[12] T. Murakami, T. Nishikiori, T. Nohira, and Y. Ito, “Electrolytic Synthesis of Ammonia in Molten Salts under Atmospheric Pressure,” J. Am. Chem. Soc., vol. 125, no. 2, pp. 334–335, Dec. 2002.
[13] J. K. N. & I. C. Suzanne Z. Andersen, Viktor Čolić, Sungeun Yang, Jay A. Schwalbe, Adam C. Nielander, Joshua M. McEnaney, Kasper Enemark-Rasmussen, Jon G. Baker, Aayush R. Singh, Brian A. Rohr, Michael J. Statt, Sarah J. Blair, Stefano Mezzavilla, Jakob Kibsgaard, Peter C, “A rigorous electrochemical ammonia synthesis protocol with quantitative isotope measurements,” Nat. Vol. 570, pages 504–508, 2019.
[14] K. C. M. and P. L. Holland, “Recent Developments in Homogeneous Dinitrogen Reduction by Molybdenum and Iron,” Nat Chem. ; 5(7), 2013.
[15] H. B. P. D. F. Tuczek, “Catalytic Ammonia Synthesis in Homogeneous Solution—Biomimetic at Last?,” A J. Ger. Chem. Soc. Issue3, Pages 632-634, 2014.
[16] T. F. J. Zhi Wei Seh, Jakob Kibsgaard, Colin F. Dickens, Ib Chorkendorff, Jens K. Nørskov, “Combining theoryand experiment in electrocatalysis:Insights into materials design,” Sci. 355, 146, 2017.
[17] X. G. and W. D. Jiangang Lv , Yi Shen , Luming Peng, “Exclusively selective oxidation of toluene to benzaldehyde on ceria nanocubes by molecular oxygen,” Chem. Commun., 46, 5909-5911, 2010.
[18] D. R. M. F. Zhou, L. M. Azofra, M. Ali, M. Kar, A. N. Simonov, C. McDonnell‐Worth, C. Sun, X. Zhang, “Electro-synthesis of ammonia from nitrogen at ambient temperature and pressure in ionic liquids,” ENERGY Environ. Sci. Vol. 10 , Issue 12, Pages 2516-2520, 2017.
[19] B. F. Bachman, “Synthesis of ammonia from hydrogen sulfide,” 2019.
[20] C. Z. Jie Liu , Bin Liu , Yating Wu , Xu Chen , Jinfeng Zhang , Yida Deng , Wenbin Hu, “Pt Monolayers on Electrodeposited Nanoparticles of Different Compositions for Ammonia Electro-Oxidation,” Catal. , 9(1), 4, 2019.
[21] M. K. and T. T. Gang Li, “Catalytic Ammonia Decomposition over High-Performance Ru/Graphene Nanocomposites for Efficient COx-Free Hydrogen Production,” Catal. , 7, 23, 2017.
[22] W. H. and C. Z. Jie Liu, Bin Chen, Yue Kou, Zhi Liu, Xu Chen, Yingbo Li, Yida Deng, Xiaopeng Han, “Pt-decorated highly porous flower-like Ni particles with high mass activity for ammonia electro-oxidation,” J. Mater. Chem. A , 4, 11060–11068, 2016.
[23] J. D. and J. K. Rafal Sala, “Ammonia Concentration Distribution Measurements on Selective Catalytic Reduction Catalysts,” Catal. , 8, 231, 2018.
[24] J. Liu et al., “Synthesis of Cubic-Shaped Pt Particles with (100) Preferential Orientation by a Quick, One-Step and Clean Electrochemical Method,” ACS Appl. Mater. & Interfaces, vol. 9, no. 22, pp. 18856–18864, May 2017.
[25] D. Miura and T. Tezuka, “A comparative study of ammonia energy systems as a future energy carrier, with particular reference to vehicle use in Japan,” Energy, Elsevier, vol. 68(C), pages 428-436., 2014.
[26] R. R. S. Jingguang G. Chen,* Richard M. Crooks,* Lance C. Seefeldt,* Kara L. Bren, R. Morris

26
Bullock, Marcetta Y. Darensbourg, Patrick L. Holland, Brian Hoffman, Michael J. Janik, Anne K. Jones, Mercouri G. Kanatzidis, Paul King, Kyle M. Lancaster, Sergei V. Lymar, “Beyond fossil fuel–driven nitrogen transformations,” Inorg. Chem., 2018.
[27] A. B. and R. T. O. A. M. Pourrahimi , R. L. Andersson , K. Tjus , V. Ström, “Making an ultralow platinum content bimetallic catalyst on carbon fibres for electro-oxidation of ammonia in wastewater,” Sustain. Energy Fuels, 3, 2111-2124, 2019.
[28] P. W. and Q. Z. Dong Jiang , Shule Zhang , Yiqing Zeng, “Active Site of O2 and Its Improvement Mechanism over Ce-Ti Catalyst for NH3-SCR Reaction,” Catal. , 8, 336, 2018.
[29] X. L. and Y. Du Ruonan Wang , Xu Wu , Chunlei Zou, “NOx Removal by Selective Catalytic Reduction with Ammonia over a Hydrotalcite-Derived NiFe Mixed Oxide,” Catal. , 8(9), 384.
[30] E. P. Bonnin, E. J. Biddinger, and G. G. Botte, “Effect of catalyst on electrolysis of ammonia effluents,” J. Power Sources, vol. 182, no. 1, pp. 284–290, Jul. 2008.
[31] F. J. Vidal-Iglesias, J. Solla-Gullón, J. M. Feliu, H. Baltruschat, and A. Aldaz, “DEMS study of ammonia oxidation on platinum basal planes,” J. Electroanal. Chem., vol. 588, no. 2, pp. 331–338, Mar. 2006.
[32] M. J. R. and I. O. A. Cabeza, A. Urtiaga, “Ammonium removal from landfill leachate by anodic oxidation.,” J. Hazard. Mater. , 144(3)715-719, 2007.
[33] R. E. D. Cédric Philibert, “Producing ammonia and fertilizers: new opportunities from renewables,” Renew. Energy Div. Int. energy agency, 2017.
[34] J. R. Bartels, “A feasibility study of implementing an Ammonia Economy,” 2008.
[35] K. Endo, K. Nakamura, Y. Katayama, and T. Miura, “Pt-Me (Me = Ir, Ru, Ni) binary alloys as an ammonia oxidation anode,” Electrochim. Acta, 49, 2503-2509, Jun. 2004.
[36] M. Xue, Q. Wang, B.-L. Lin, and K. Tsunemi, “Assessment of Ammonia as an Energy Carrier from the Perspective of Carbon and Nitrogen Footprints,” ACS Sustain. Chem. & Eng., vol. 7, no. 14, pp. 12494–12500, Jun. 2019.
[37] I. Bicer, Yusuf, Dincer, “Life cycle assessment of ammonia utilization in city transportation and power generation,” J. Clean. Prod. v.170 pp. 1594-1601, 2018.
[38] F. Bicer, Y.; Dincer, I.; Vezina, G.; Raso, “mpact Assessment and Environmental Evaluation of Various Ammonia Production Processes.,” Environ. Manag. , 59, 842−855, 2017.
[39] O. Siddiqui and I. Dincer, “A review and comparative assessment of direct ammonia fuel cells,” Therm. Sci. Eng. Prog., vol. 5, pp. 568–578, Mar. 2018.
[40] T. Brown, “The new generation of fuel cells: fast, furious, and flexible,” in Ammonia Energy, 2017.
[41] S. Farhad and F. Hamdullahpur, “Conceptual design of a novel ammonia-fuelled portable solid oxide fuel cell system,” J. Power Sources, vol. 195, no. 10, pp. 3084–3090, May 2010.
[42] A. Afif, N. Radenahmad, Q. Cheok, S. Shams, J. H. Kim, and A. K. Azad, “Ammonia-fed fuel cells: a comprehensive review,” Renew. Sustain. Energy Rev., vol. 60, pp. 822–835, Jul. 2016.
[43] S. Crolius, “Ammonia-Fueled Solid Oxide Fuel Cell Advance at Kyoto University,” in Ammonia Energy Conference, 2017.

27
[44] A. F. S. Molouk, J. Yang, T. Okanishi, H. Muroyama, T. Matsui, and K. Eguchi, “Comparative study on ammonia oxidation over Ni-based cermet anodes for solid oxide fuel cells,” J. Power Sources, vol. 305, pp. 72–79, Feb. 2016.
[45] A. . Chellappa, C. . Fischer, and W. . Thomson, “Ammonia decomposition kinetics over Ni-Pt/Al2O3 for PEM fuel cell applications,” Appl. Catal. A Gen., vol. 227, no. 1–2, pp. 231–240, Mar. 2002.
[46] S. G. and T. A. Z. J. Francisco A. Uribe, z, “Effect of Ammonia as Potential Fuel Impurity on Proton Exchange Membrane Fuel Cell Performance,” J. Electrochem. Soc. 149, A293-A296, 2002.
[47] X. Zhang, U. Pasaogullari, and T. Molter, “Influence of ammonia on membrane-electrode assemblies in polymer electrolyte fuel cells,” Int. J. Hydrogen Energy, vol. 34, no. 22, pp. 9188–9194, Nov. 2009.
[48] S. B. P. and J. H. Ki Rak Lee, Dongsu Song, “A direct ammonium carbonate fuel cell with an anion exchange membrane,” RSC Adv.,4, 5638-5641, 2014.
[49] S. Suzuki, H. Muroyama, T. Matsui, and K. Eguchi, “Fundamental studies on direct ammonia fuel cell employing anion exchange membrane,” J. Power Sources, vol. 208, pp. 257–262, Jun. 2012.
[50] G. W. Nadia Mohd Adli, Hao Zhang, Shreya Mukherjee, “Review—Ammonia Oxidation Electrocatalysis for Hydrogen Generation and Fuel Cells,” J. Electrochem. Soc. 165, 3130-3147, 2017.
[51] M. S. M. OSWIN, “The Anodic Oxidation of Ammonia at Platinum Black Electrodes in Aqueous KOH Electrolyte,” Can. J. Chem. Vol. 41, 1963.
[52] F. B. L. L. MARINIC, “Electro-oxidation of ammonia in waste water,” J. Appl. Electrochem. 8, 333-345, 1978.
[53] A. R. Despić, D. M. Drazˇić, and P. M. Rakin, “Kinetics of electrochemical oxidation of ammonia in alkaline solution,” Electrochim. Acta, vol. 11, no. 8, pp. 997–1005, Aug. 1966.
[54] H. Gerischer and A. Mauerer, “Untersuchungen Zur anodischen Oxidation von Ammoniak an Platin-Elektroden,” J. Electroanal. Chem. Interfacial Electrochem., vol. 25, no. 3, pp. 421–433, May 1970.
[55] L. D. Burke and K. J. O’Dwyer, “Oxidation of some reactive small molecules on copper and platinum in solutions of high pH,” Electrochim. Acta, vol. 36, no. 13, pp. 1937–1945, Jan. 1991.
[56] S. Wasmus, E. J. Vasini, M. Krausa, H. T. Mishima, and W. Vielstich, “DEMS-cyclic voltammetry investigation of the electrochemistry of nitrogen compounds in 0.5 M potassium hydroxide,” Electrochim. Acta, vol. 39, no. 1, pp. 23–31, Jan. 1994.
[57] A. Estejab and G. G. Botte, “Ammonia oxidation kinetics on bimetallic clusters of platinum and iridium: A theoretical approach,” Mol. Catal. 445, 279-292, Feb. 2018.
[58] J. A. R. Vooys, de, A. C. A., Koper, M. T. M., Santen, van, R. A., & Veen, van, “The role of adsorbates in the electrochemical oxidation of ammonia on noble and transition metal electrodes,” J. Electroanal. Chem. 506, 127-137., 2001.
[59] Y. Z. X. C. all 5 authorsJingjing Wang, “NH3/Ir(100): Electronic structure and dehydrogenation,” Int. J. Hydrog. Energy 38(7)2965–2972, 2013.
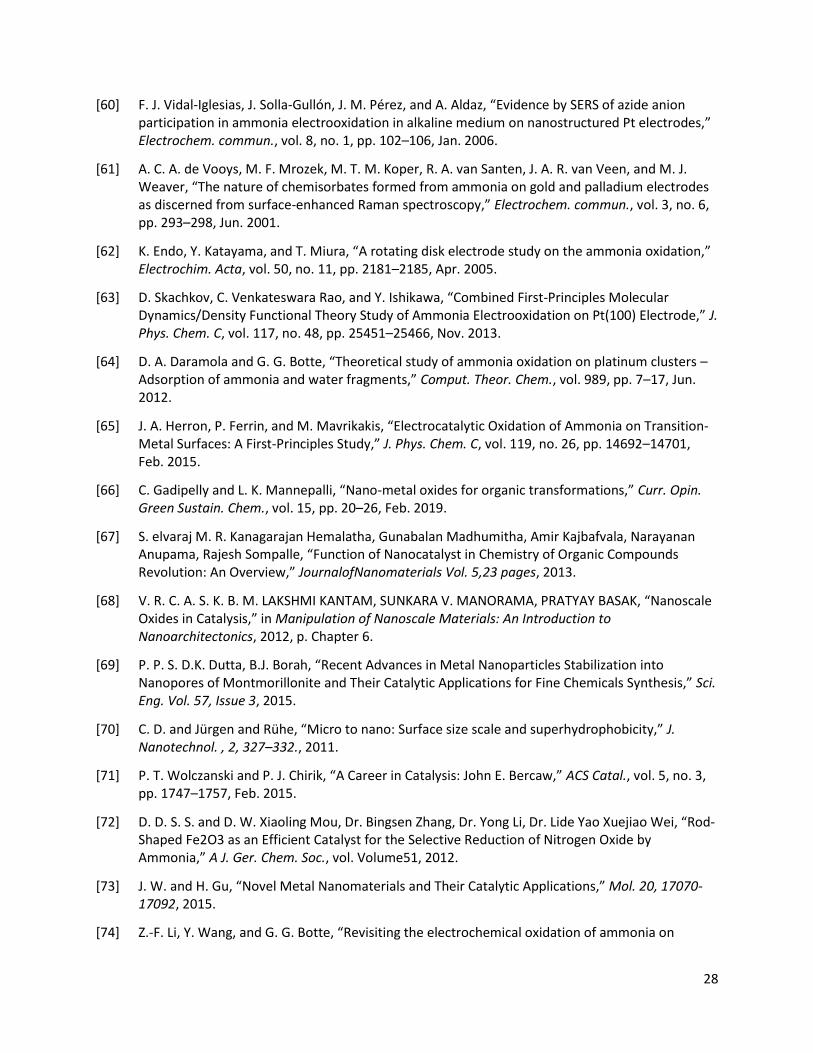
28
[60] F. J. Vidal-Iglesias, J. Solla-Gullón, J. M. Pérez, and A. Aldaz, “Evidence by SERS of azide anion participation in ammonia electrooxidation in alkaline medium on nanostructured Pt electrodes,” Electrochem. commun., vol. 8, no. 1, pp. 102–106, Jan. 2006.
[61] A. C. A. de Vooys, M. F. Mrozek, M. T. M. Koper, R. A. van Santen, J. A. R. van Veen, and M. J. Weaver, “The nature of chemisorbates formed from ammonia on gold and palladium electrodes as discerned from surface-enhanced Raman spectroscopy,” Electrochem. commun., vol. 3, no. 6, pp. 293–298, Jun. 2001.
[62] K. Endo, Y. Katayama, and T. Miura, “A rotating disk electrode study on the ammonia oxidation,” Electrochim. Acta, vol. 50, no. 11, pp. 2181–2185, Apr. 2005.
[63] D. Skachkov, C. Venkateswara Rao, and Y. Ishikawa, “Combined First-Principles Molecular Dynamics/Density Functional Theory Study of Ammonia Electrooxidation on Pt(100) Electrode,” J. Phys. Chem. C, vol. 117, no. 48, pp. 25451–25466, Nov. 2013.
[64] D. A. Daramola and G. G. Botte, “Theoretical study of ammonia oxidation on platinum clusters – Adsorption of ammonia and water fragments,” Comput. Theor. Chem., vol. 989, pp. 7–17, Jun. 2012.
[65] J. A. Herron, P. Ferrin, and M. Mavrikakis, “Electrocatalytic Oxidation of Ammonia on Transition-Metal Surfaces: A First-Principles Study,” J. Phys. Chem. C, vol. 119, no. 26, pp. 14692–14701, Feb. 2015.
[66] C. Gadipelly and L. K. Mannepalli, “Nano-metal oxides for organic transformations,” Curr. Opin. Green Sustain. Chem., vol. 15, pp. 20–26, Feb. 2019.
[67] S. elvaraj M. R. Kanagarajan Hemalatha, Gunabalan Madhumitha, Amir Kajbafvala, Narayanan Anupama, Rajesh Sompalle, “Function of Nanocatalyst in Chemistry of Organic Compounds Revolution: An Overview,” JournalofNanomaterials Vol. 5,23 pages, 2013.
[68] V. R. C. A. S. K. B. M. LAKSHMI KANTAM, SUNKARA V. MANORAMA, PRATYAY BASAK, “Nanoscale Oxides in Catalysis,” in Manipulation of Nanoscale Materials: An Introduction to Nanoarchitectonics, 2012, p. Chapter 6.
[69] P. P. S. D.K. Dutta, B.J. Borah, “Recent Advances in Metal Nanoparticles Stabilization into Nanopores of Montmorillonite and Their Catalytic Applications for Fine Chemicals Synthesis,” Sci. Eng. Vol. 57, Issue 3, 2015.
[70] C. D. and Jürgen and Rühe, “Micro to nano: Surface size scale and superhydrophobicity,” J. Nanotechnol. , 2, 327–332., 2011.
[71] P. T. Wolczanski and P. J. Chirik, “A Career in Catalysis: John E. Bercaw,” ACS Catal., vol. 5, no. 3, pp. 1747–1757, Feb. 2015.
[72] D. D. S. S. and D. W. Xiaoling Mou, Dr. Bingsen Zhang, Dr. Yong Li, Dr. Lide Yao Xuejiao Wei, “Rod‐Shaped Fe2O3 as an Efficient Catalyst for the Selective Reduction of Nitrogen Oxide by Ammonia,” A J. Ger. Chem. Soc., vol. Volume51, 2012.
[73] J. W. and H. Gu, “Novel Metal Nanomaterials and Their Catalytic Applications,” Mol. 20, 17070-17092, 2015.
[74] Z.-F. Li, Y. Wang, and G. G. Botte, “Revisiting the electrochemical oxidation of ammonia on

29
carbon-supported metal nanoparticle catalysts,” Electrochim. Acta, 228, 351-360, Feb. 2017.
[75] B. A. L. de Mishima, D. Lescano, T. M. Holgado, and H. T. Mishima, “Electrochemical oxidation of ammonia in alkaline solutions: its application to an amperometric sensor,” Electrochim. Acta, vol. 43, no. 3–4, pp. 395–404, Jan. 1998.
[76] H. (J. )W. van Santen, R.A., Niemantsverdriet, Chemical Kinetics and Catalysis. New York, 1995.
[77] S. Johnston, B. H. R. Suryanto, and D. R. MacFarlane, “Electro-oxidation of ammonia on electrochemically roughened platinum electrodes,” Electrochim. Acta, vol. 297, pp. 778–783, Feb. 2019.
[78] E. Moran, E.; Cattaneo, C.; Mishima, H.; López de Mishima, B. A.; Silvetti, S. P.; Rodriguez, J. L.; Pastor, “Ammonia oxidation on electrodeposited Pt–Ir alloys,” J. SOLID STATE Electrochem. Vol. 12, Number 5, 2008.
[79] B. K. Boggs and G. G. Botte, “Optimization of Pt–Ir on carbon fiber paper for the electro-oxidation of ammonia in alkaline media,” Electrochim. Acta, 55, 5287-5293, Jul. 2010.
[80] T. L. Lomocso and E. A. Baranova, “Electrochimica Acta Electrochemical oxidation of ammonia on carbon-supported bi-metallic PtM ( M = Ir , Pd , SnO x ) nanoparticles,” Electrochim. Acta, 56, 8551-8558, 2011.
[81] A. Allagui, M. Oudah, X. Tuaev, S. Ntais, F. Almomani, and E. A. Baranova, “Ammonia electro-oxidation on alloyed PtIr nanoparticles of well-defined size,” Int. J. Hydrogen Energy, vol. 38, no. 5, pp. 2455–2463, Feb. 2013.
[82] J. C. M. Silva et al., “PtAu/C electrocatalysts as anodes for direct ammonia fuel cell,” Appl. Catal. A Gen. 490, 133-138, Jan. 2015.
[83] K. Yao and Y. F. Cheng, “Electrodeposited Ni–Pt binary alloys as electrocatalysts for oxidation of ammonia,” J. Power Sources, vol. 173, no. 1, pp. 96–101, Nov. 2007.
[84] A. Neodo, S, Kapałka, A., Cally, “Electrochemical behavior of ammonia at Ni/Ni(OH)2 electrode,” Electrochem. Commun. Vol. 12, Issue 1, Pages 18-21, 2010.
[85] Y.-J. Shih, Y.-H. Huang, and C. P. Huang, “In-situ electrochemical formation of nickel oxyhydroxide (NiOOH) on metallic nickel foam electrode for the direct oxidation of ammonia in aqueous solution,” Electrochim. Acta, vol. 281, pp. 410–419, Aug. 2018.
[86] M. H. M. T. Assumpção et al., “Investigation of PdIr/C electrocatalysts as anode on the performance of direct ammonia fuel cell,” J. Power Sources, 268, 129-136, Dec. 2014.
[87] W. B. H. and Y. F. C. C. Zhong, “Recent advances in electrocatalysts for electro-oxidation of ammonia,” J. Mater. Chem. A,1, 3216-3238, 2013.
[88] M. H. M. T. Assumpção et al., “Oxidation of ammonia using PtRh/C electrocatalysts: Fuel cell and electrochemical evaluation,” Appl. Catal. B Environ. 174, 136-144, Sep. 2015.
[89] B. X. Feng Jiao, “Electrochemical Ammonia Synthesis and Ammonia Fuel Cells,” Adv. Mater. 31, 31, 1805173, 2018.
[90] Y. Katayama, T. Okanishi, H. Muroyama, T. Matsui, and K. Eguchi, “Electrochemical Oxidation of Ammonia over Rare Earth Oxide Modified Platinum Catalysts,” J. Phys. Chem. C, vol. 119, no. 17,

30
pp. 9134–9141, Apr. 2015.
[91] K.-W. Kim, Y.-J. Kim, I.-T. Kim, G.-I. Park, and E.-H. Lee, “Electrochemical conversion characteristics of ammonia to nitrogen,” Water Res. 40, 7, 1431-1441, Apr. 2006.
[92] K.-W. Kim, Y.-J. Kim, I.-T. Kim, G.-I. Park, and E.-H. Lee, “The electrolytic decomposition mechanism of ammonia to nitrogen at an IrO2 anode,” Electrochim. Acta, vol. 50, no. 22, pp. 4356–4364, Aug. 2005.
[93] R. S. NICHOLSON, “Theory and Application of Cyclic Voltammetry for Measurement of Electrode Reaction Kinetics,” Anal. Chem. 37,11, 1965.
[94] P. T. Heineman W. R., Kissinger, Monographs in Electroanalytical Chemistry and Electrochemistry. New York, 1984.
[95] F. G. Will, “Hydrogen Adsorption on Platinum Single Crystal Electrodes: I . Isotherms and Heats of Adsorption,” J. Electrochem. Soc. 112,4, 451-455, 1965.
[96] C. V. Juan Feliu., “Thirty years of platinum single crystal electrochemistry,” J. Solid State Electrochem. ,15,8, 1297-1315, 2011.
[97] J. Pletcher, D., Greff, R., Peat, R., Peter, L.M. & Robinson, Instrumental Methods in Electrochemistry. First ed. Cambridge: Woodhead Publishing Limited. 2001.
[98] G. Xing, L., Hossain, M.A., Tian, M., Beauchemin, D., Adjemian, K. & Jerkiewicz, “Platinum Electro dissolution in Acidic Media upon Potential Cycling,” Electrocatal. 5, 1, 96-112, 2014.
[99] W. Santos, E. & Schmickler, Catalysis in Electrochemistry: From Fundamental Aspects to Strategies for Fuel Cell Development, wiley. 2011.
[100] J. W. Zhang, H., Wang, X., Zhang, J.L. & Zhang, Electrocatalysts and Catalyst Layers Fundamentals and Applications. London: Springer. 2008.
[101] J. G. C. and Y. Y. Wenchao Sheng, MyatNoeZin Myint, “Correlating the hydrogen evolution reaction activity in alkaline electrolytes with the hydrogen binding energy on monometallic surfaces,” Energy Environ. Sci., 5, 6, 1509-1512, 2013.
[102] Y. Y. Zheng J, Sheng W, Zhuang Z, Xu B, “Universal dependence of hydrogen oxidation and evolution reaction activity of platinum-group metals on pH and hydrogen binding energy,” Sci Adv., 18, 2, 1501602, 2016.
[103] J. R. and I. C. Ifan E. L. Stephens, Alexander S. Bondarenko, Ulrik Grønbjerg, “Understanding the electrocatalysis of oxygen reduction on platinum and its alloys,” Energy Environ. Sci.,5, 5, 6744-6762, 2012.
[104] K. J. J. Mayrhofer, D. Strmcnik, B. B. Blizanac, V. Stamenkovic, M. Arenz, and N. M. Markovic, “Measurement of oxygen reduction activities via the rotating disc electrode method: From Pt model surfaces to carbon-supported high surface area catalysts,” Electrochim. Acta, vol. 53, no. 7, pp. 3181–3188, Feb. 2008.
[105] Q.-S. Chen, J. Solla-Gullón, S.-G. Sun, and J. M. Feliu, “The potential of zero total charge of Pt nanoparticles and polycrystalline electrodes with different surface structure: The role of anion adsorption in fundamental electrocatalysis,” Electrochim. Acta, vol. 55, no. 27, pp. 7982–7994, Nov. 2010.

31
[106] T. R. R. and F. C. W. M J Watt-Smith, J M Friedrich, S P Rigby, “Determination of the electrochemically active surface area of Pt/C PEM fuel cell electrodes using different adsorbates,” J. Phys. D Appl. Physics, 41, 17, 2008.
[107] H. Han, K., Lee, J. & Kim, “Preparation and characterization of high metal content Pt–Ru alloy catalysts on various carbon blacks for DMFCs,” Electrochim. Acta. 52, 4, 1697-1702, 2006.
[108] Q. Zhang, Z. Yang, Y. Ling, X. Yu, Y. Zhang, and H. Cheng, “Improvement in stability of PtRu electrocatalyst by carbonization of in-situ polymerized polyaniline,” Int. J. Hydrogen Energy, vol. 43, no. 28, pp. 12730–12738, Jul. 2018.
[109] S. Z. Q. and Z. J. X. Chao Wei , Shengnan Sun , Daniel Mandler , Xun Wang, “Approaches for measuring the surface areas of metal oxide electrocatalysts for determining their intrinsic electrocatalytic activity,” Chem. Soc. Rev., 48, 2518-2534, 2019.
[110] K. A. and S. Pons, “Infrared Spectroelectrochemistry,” Chem. Rev 88, 673–695., 1988.
[111] T. Matsui et al., “In Situ Attenuated Total Re fl ection Infrared Spectroscopy on Electrochemical Ammonia Oxidation over Pt Electrode in Alkaline Aqueous Solutions,” 2015.
[112] V. R. and M. T. M. Koper, “Electrocatalytic oxidation of ammonia on Pt(111) and Pt(100) surfaces,” Phys. Chem. Chem. Phys.,8, 2513-2524, 2006.
[113] C. L. Haynes, A. D. McFarland, and R. P. Van Duyne, “Surface-Enhanced Raman Spectroscopy,” Anal. Chem., vol. 77, no. 17, pp. 338 A-346 A, Sep. 2005.
[114] J. F. E. Gootzen, A. H. Wonders, W. Visscher, R. A. van Santen, and J. A. R. van Veen, “A DEMS and cyclic voltammetry study of NH3 oxidation on platinized platinum,” Electrochim. Acta, vol. 43, no. 12–13, pp. 1851–1861, May 1998.
[115] D. A. Finkelstein, E. Bertin, S. Garbarino, and D. Guay, “Mechanistic Similarity in Catalytic N2 Production from NH3 and NO2– at Pt(100) Thin Films: Toward a Universal Catalytic Pathway for Simple N-Containing Species, and Its Application to in Situ Removal of NH3 Poisons,” J. Phys. Chem. C, vol. 119, no. 18, pp. 9860–9878, Apr. 2015.
[116] M. Duca, M. C. Figueiredo, V. Climent, P. Rodriguez, J. M. Feliu, and M. T. M. Koper, “Selective Catalytic Reduction at Quasi-Perfect Pt(100) Domains: A Universal Low-Temperature Pathway from Nitrite to N2,” J. Am. Chem. Soc., vol. 133, no. 28, pp. 10928–10939, Jun. 2011.
[117] M. C. Figueiredo, J. Solla-Gullón, F. J. Vidal-Iglesias, V. Climent, and J. M. Feliu, “Nitrate reduction at Pt(1 0 0) single crystals and preferentially oriented nanoparticles in neutral media,” Catal. Today, vol. 202, pp. 2–11, Mar. 2013.
[118] S. J. B. and K. A. V. Stephen P. Best, “Infrared Spectroelectrochemistry,” in Spectroelectrochemistry, Royal Society of Chemistry, 2008, pp. 1–30.
[119] W. G. Golden, D. S. Dunn, and J. Overend, “A method for measuring infrared reflection—Absorption spectra of molecules adsorbed on low-area surfaces at monolayer and submonolayer concentrations,” J. Catal., vol. 71, no. 2, pp. 395–404, Oct. 1981.
[120] K. K. and H. S. W. G. Golden, “Application of Polarization-Modulated Fourier Transform Infrared Reflection-Absorption Spectroscopy to the Study of Carbon Monoxide Adsorption and Oxidation on a Smooth Platinum Electrode,” J. ofPhysical Chem. Vol. 88, No. 7, 1984.
32
[121] R. G. Greenler, “Reflection Method for Obtaining the Infrared Spectrum of a Thin Layer on a Metal Surface,” J. Chem. Phys. 50, 1963–1968, 1969.
[122] V. Z. and J. Lipkowski, Advances in Electrochemical Science and Engineering, in Diffraction and Spectroscopic Methods in Electrochemistry,. Wiley-VCH, 2008.
[123] R. G. Greenler, “Infrared Study of Adsorbed Molecules on Metal Surfaces by Reflection Techniques,” J. Chem. Phys. 44, 310, 1966.
[124] M. E. Houache et al., “Electrochemical Valorization of Glycerol on Ni-Rich Bimetallic NiPd Nanoparticles: Insight into Product Selectivity Using in Situ Polarization Modulation Infrared-Reflection Absorption Spectroscopy,” ACS Sustain. Chem. & Eng. 7, 17, 14425-14434, Jun. 2019.
[125] W. T. T. Robert Schennach, Carol Hirschmugl, Eduard Gilli, “A New Method for Performing Polarization Modulation Infrared Reflection-Adsorption Spectroscopy of Surfaces,” Appl. Spectrosc. , 63, 369–372, 2009.
[126] E. A. Monyoncho et al., “Ethanol Electro-oxidation on Palladium Revisited Using Polarization Modulation Infrared Re fl ection Absorption Spectroscopy ( PM-IRRAS ) and Density Functional Theory ( DFT ): Why Is It Di ffi cult To Break the C − C Bond ?,” vol. 4906, no. 2, 2016.
33
Chapter 3: Investigation of electrochemical oxidation of ammonia on
carbon-supported Pt nanoparticles using Infrared spectroscopy: particle
size effect
Niloofar Aligholizadeh K., Evans A. Monyoncho, Elena A. Baranova
Department of Chemical and Biological Engineering, Centre for Catalysis Research and Innovation,
University of Ottawa, 161 Louis-Pasteur, Ottawa, Ontario, Canada K1N 6N5
(To be submitted to Electrochimia Acta)
3.1 Abstract
The effect of Pt particle size using polarization modulation infrared reflection absorption
spectroscopy (PM-IRRAS) combined with electrochemical measurements for electrochemical
oxidation of ammonia was investigated. Carbon-supported Pt nanoparticles with 20wt% metal
loading were synthesized by polyol method varying the pH of the synthesis solution to obtain
different average particle sizes between 1.3 to 4.3 nm. The size and dispersion of Pt nanoparticles
were examined by TEM. In-situ PM-IRRAS showed a correlation between nano-catalyst size and
catalytic performance of carbon-supported Pt. The onset oxidation potential was observed to be
more negative in the electrochemical oxidation reaction for the smallest mean particle size (1.3
nm) compared to the larger one. Pt/C with a mean particle size of 2.2 nm showed better stability
and comparable activity to 1.3 nm. N-H species were noted along with azide ions and nitro-
compounds at specific applied potentials as oxidation products. The intensity of peaks
corresponding to products was different on the surface of Pt compared to the bulk of the solution.
NO-2 was only observed on the surface; in contrast, NO-3 was mostly identified in bulk.
3.2 Introduction
Limited natural energy resources such as oil, gas and coal on one side and serious implications as
a result of fossil fuel consumption, particularly in the transport sector on the other side, show an
obvious need to create global solidarity for utilization of eco-friendly and alternative clean fuel
sources. Recent studies have suggested the incorporation of fossil fuels and renewables into
34
hydrogen production as a suitable candidate for clean power supply.[1][2][3][4] Hydrogen
possesses the capability to provide efficient, stable and effective alternatives to global energy
consumption problems, along with global climate change.[5] To achieve advanced hydrogen-
based technologies, modified facilities and manufacturing techniques which include hydrogen
storage and transportation, would conduct the world to stabilized energy systems.[6] In addition
to completely removing carbon dioxide emissions from the energy cycle, hydrogen could also
eliminate harmful pollutants to the environment like nitrogen oxides.[7][8] Meanwhile, storage
and transportation of hydrogen is a complex and difficult subject since hydrogen is highly
flammable. Although hydrogen liquefaction could be considered as a potential solution to make
its transportation easier, massive energy and highly expensive tanks require to make it feasible.[9]
Chemicals with high energy and hydrogen content could be remarked as a desirable alternative for
comparing to other types of fuels. To generate power from hydrogen carriers such as methanol,
ethanol, glycerol, water and ammonia in order to utilize in different sectors, these molecules should
be broken down. Production of electricity by electrooxidation of alcohols and hydrocarbons has
attracted great attention.[10][11][12] Ammonia can be considered as an outstanding candidate not
only due to its high hydrogen content about 130 kg H2/m3 but because it is the most cost-effective
source of energy compared to other fuel sources like methanol and gasoline, approximately 3 US$
per 100 km[13] which removes CO2 as one of the environmentally damaging elements of power
generation.[14][15] In addition, ammonia can indeed be liquified under moderate pressures and
temperature around 6 bar and 20 ᵒC and store in fluid phase for a longer time. Considering the
above-mentioned privileges, ammonia can be utilized as a suitable fuel source to employ its high
hydrogen content for direct ammonia fuel cells. To make it feasible with a reasonable reaction rate
at ambient temperature, ammonia should be oxidized using an efficient electrocatalyst. Gerischer
and Mauerer suggested a well-accepted mechanism for ammonia electrooxidation reaction on the
surface of Pt in alkaline solution.[16] Based on this mechanism, ammonia molecules after being
adsorbed on the surface of catalyst are dehydrogenated to various N-H species which by
continuous dehydrogenation form N2. Further dehydrogenation of NH would lead to the generation
of Nads atoms known as an intermediate binding strongly with surface active sites and block
them.[17][18][19][20] Being a sluggish reaction, electrochemical oxidation of ammonia on some
mono- and bi-metallic electro-catalysts has been widely studied to improve the reaction kinetics.
Platinum was reported to be the most active catalyst that shows reversibility against an active

35
surface block in the ammonia electrooxidation reaction.[21][22][23][24][25][26][17][27][28][29]
However, the amount of Pt needed for a satisfactory catalytic activity and durability has limited
its use in massive projects as it should be cost-effective and economically viable.[30] As a result,
the main barrier in front of scaling up the process would be the development of efficient
electrocatalysts at a proper cost, with long-term stability as well as providing optimal
electrocatalytic activity. A potential solution for this issue would be considering supports with
high surface area to lower the metal content while using all catalytic capacity of the
catalyst.[31][32] Besides, the ammonia electrochemical oxidation reaction is strongly sensitive to
the size and structure of nano-catalyst.[33][34]An attractive variable that can regulate the catalytic
activity is the size of Pt nanoparticles. Several studies in different electrooxidation reactions have
demonstrated that various sizes of Pt could result in distinct dispersion and
activity.[35][36][37][38] In most of these investigations an optimum size of Pt among a size range
was found which reveals that the smallest or the largest particle size may not necessarily possess
the best performance. Monometallic Pt cubic NPs were synthesized by water-in-oil technique and
the size was manipulated by varying HCl concentration of water phase.[38] 25% HCl in the range
of 0-37% was led to 12-14 nm Pt nanoparticle size displayed the highest catalytic activity in the
range of 3-14 nm particle size. These findings emphasized on this fact that the ammonia oxidation
reaction is highly dependent to the surface structure of Pt and mostly occurs on Pt (100) sites.[39]
Generally, the variation of particle size would result in variation of catalytic activity and in some
cases the selectivity as well as stability. Since the percentage of (100) sites decreased by increasing
HCl concentration from 25% to 37%, the catalytic activity dropped accordingly. Therefore, the
potential impact of size on catalytic activity of catalyst for ammonia electro-oxidation remains to
be elucidated.
In the literature review of the reaction mechanisms of numerous electrochemical reactions,
spectroscopic approaches such as infrared and Raman spectroscopies have been widely
applied.[20][40][41] Before, for ammonia electrooxidation reaction, an infrared reflection
absorption spectroscopy (IRRAS) technique was used in order to detect ammonia oxidation
products on Pt electrocatalyst.[40] Adsorbed N-H species are major intermediates of this reaction;
however, they could not be observed due to the huge peak overlaps in water and nitrogen
wavenumber regions. Although this approach is an efficient method for analyzing solid-liquid
interfaces,[42] several obstacles, like the strong IR absorption by aqueous electrolytes, may

36
contribute concealing the species. In comparable research using attenuated total reflection infrared
reflection absorption spectroscopy (ATR-IRRAS), N2H4 was noted during ammonia
electrooxidation as an intermediate on a thin layer of Pt.[20] N-O peak was also discovered at a
relatively higher potential. Respective N-containing products on the surface of distinct precious
metals were recognized using surface-enhanced Raman spectroscopy (SERS).[41][43] Adsorbed
azide anion on Pt catalyst was noticed developed by an interaction between adsorbed ammonia
molecules and generated N2H4. [41] Polarization modulation infrared reflection absorption
spectroscopy (PM-IRRAS), another efficient approach for the solid-liquid environment, represents
the species on the surface and in the bulk of electrolyte and allows to suppress the signals from
water.[44] This technique has been applied for ethanol electrooxidation on Pd-based NPs to gain
better insight on the reaction mechanism[45][46] and also glycerol electrooxidation on Ni[47] and
NiPd[48]. To the best of our knowledge, the reports have not demonstrated any PM-IRRAS
findings related to the electrooxidation of ammonia on the surface of metallic nano-structured
catalysts.
In the present study, PM-IRRAS has been employed in order to observe the effect of the size of
carbon-supported Pt nanoparticles with 20wt% loading on catalytic performance and product
distribution of ammonia electrooxidation. Catalytic activity and stability of synthesized Pt with
different size distributions were also studied to investigate the Pt particle size effect.
3.3 Material and Methods
3.3.1 Synthesis of carbon-supported Pt
Carbon-supported Pt catalysts were obtained using a polyol synthesis reported earlier.[49][50] In
order to form nanoparticles, 104 mg of PtCl4 (Alfa Aesar, 99.9% metals basis) was dissolved in
12 mL of ethylene glycol (Fisher Scientific), and the pH was amended by adding 0.25, 0.15, 0.1,
0.08 M NaOH solution (ACP Chemicals Inc) in ethylene glycol. The solution was then refluxed
at 160 ° C for 30 minutes. The corresponding quantity of carbon as support (Vulcan XC-72, Cabot)
was added to the resulting colloids. The mixture was stirred for 24 h to reach high dispersion of
nano-catalysts with 20 wt% metal loading. In order to remove ethylene glycol and charged
particles, the supported catalysts were centrifuged and thoroughly washed with ultrapure water (18
Ω cm) and dried in a freeze dryer (LABCONCO, 4.5 L cascade, benchtop freeze dry). Catalyst ink

37
was prepared by mixing 3 mg catalyst dried powder, 500 µl deionized water, 50 µL of 5wt%
Nafion® and 50 µL of isopropanol.
3.3.2 Characterization and Spectroelectrochemical measurements
Nano-Catalyst morphology was defined by a JEM-2100F FETEM (JEOL) transmission electron
microscopy (TEM), and the distribution of particle size for synthesized catalysts was achieved
using ImageJ software to measure the size of nanoparticles in TEM illustrations. Electrochemical
and spectroelectrochemical measurements were undertaken in an adapted Teflon cell that can then
be supported with O-rings and supplemented with a Calcium Fluoride hemicylinder window (RJ
Spectroscopy Co.). The working electrode consisted of a glassy carbon disk integrated into a rod
used to properly handle the distance between the electrode and the window via a micrometre lever.
A wire made of Pt twisted around the working electrode was used as a counter electrode and
Hg/HgO was applied as a reference electrode (Koslow Scientific). The electrolytes that have been
used including 1 M KOH and 1 M KOH + 0.5M NH4OH aqueous solutions, were prepared by
using KOH (85% KOH basis, Sigma-Aldrich) and ammonium hydroxide, NH4OH 14.8 N (Fisher
Scientific). Polarization modulation infrared spectroscopy and electrochemical tests were
investigated by integrating Fourier transform infrared spectrometer (Bruker Tensor 37) equipped
with additional Polarization Modulation Appliance (PMA 50 XL) located in a chamber and
spectroelectrochemical cell. For electrochemical measurements, the potential ranging from -0.9 to
0 V vs Hg/HgO and at a scan rate of 20 mV/s was set up by a PARSTAT 2263 (Princeton Applied
Research) potentiostat in order to perform cyclic voltammetry and was fixed at -0.3 V for 30
minutes for chronoamperometry measurements. Followed by catalyst ink and electrode
preparation, the electrolyte was degassed using nitrogen gas (99.999%, Linde). Before the in-situ
spectroscopy analysis, the mercury cadmium telluride light detector (LN-MCT Narrow PMA50,
Infrared Associates, Inc., Stuart, FL) was cooled down with liquid nitrogen in order to avoid
potential damages due to the increase in temperature by infrared beams. Pushing the working
electrode toward the Calcium Fluoride window, an estimated average thickness of 10 μm of
electrolyte was achieved.[51] All spectra were collected at a spectral resolution of 8 cm-1 utilizing
256 scans. The collected spectra have been acquired by using chronoamperometry (CA), while the
potential was kept constant at different ammonia oxidation states for 5 minutes. The infrared beam
38
was adapted to hit the GC surface at 68ᵒ, which is an optimum angle.[52] The surface and bulk
reflectivity factor (R.F.) were obtained through the use of equation(1) and (2) linked to a lately
introduced methodology.[52]
Surface reflectivity factor (R.F. Surface) = (𝑠𝑎𝑚𝑝𝑙𝑒 (Rdif)
𝑟𝑒𝑓𝑒𝑟𝑒𝑛𝑐𝑒 (Rdif)) − 1 (1)
Bulk reflectivity factor (R.F. bulk) = (𝑠𝑎𝑚𝑝𝑙𝑒 (Rave)
𝑟𝑒𝑓𝑒𝑟𝑒𝑛𝑐𝑒 (Rave)) − 1 (2)
3.4 Results and discussion
3.4.1 Physicochemical characterization
The TEM images and corresponding size distribution histograms of Pt/C NPs prepared with
various concentrations of NaOH have been displayed in figure 3-1. The corresponding particles
are shown to be spherical and displayed a small distribution of size with good dispersion and no
agglomeration. The TEM clearly shows that it is feasible to manipulate the size of Pt nanoparticle
catalysts by gradually increasing the levels of NaOH content from 0.08 to 0.25 M leading to the
enhancement of final resulting pH from 5 to 8.2. The unique benefit of the mentioned synthesis
method is that polymer stabilizer can be omitted from the process, which has been replaced with
ethylene glycol as a reducing and stabilizing agent. It is noted that in the synthesis process, the
partial oxidation of ethylene glycol in alkaline solution would yield to the formation of glycolate
anions which function as a strong stabilizer for Pt colloids and to the glycolic acid in neutral to
acidic solution as a weak stabilizer.[50] As a result, it is anticipated that the pH of the solution
during the synthesis of nanoparticles would have a significant impact on the size of the formed
colloids by varying the concentration of glycolates. Considering these findings, at a higher
concentration of NaOH, the catalyst size of Pt is supposed to become the smallest, and with a
decrease in pH, the nanoparticle size is anticipated to rise continually. The NaOH concentrations,
as well as initial and final pH and particle, mean size, have been demonstrated in table 3-1.

39
Figure 3-1: (left) TEM images and (right) size distribution of carbon-supported Pt, prepared by various NaOH concentrations: (a) 0.25M; (b) 0.15 M; (c) 0.1M; (d) 0.08M
a
b
c
d

40
Table 3-1: Effect of different concentration of NaOH in the synthesis of carbon-supported Pt on particle mean size
3.4.2 Electrochemical oxidation of ammonia
Cyclic voltammetry was applied for assessment of ammonia electrooxidation using synthesized
Pt/C nanoparticles in 1M KOH in the presence and absence of NH4OH shown in figure 3-2, which
has been done for 10 cycles in the potential range of 0 to -0.9 V vs Hg/HgO at 20 mVs-1 to reach
to the steady-state cycle. The current was normalized by electrochemical surface area obtained
from the integration of surface under the CV in adsorption/desorption region in 1 M KOH divided
by 210 µC cm-2, which is a theoretical charge required for removal of a monolayer of H atoms
from platinum surface (Cyclic voltammetry comparisons in 1 M KOH for Pt 1.3, 2.2, 2.9 and 4.3
nm are shown in appendix A, figure A-1).[53] The CVs are in line with the other published
investigations for ammonia electro-oxidation using carbon-supported Pt.[54][55][56][57] The
figure 3-2 (a)-(d) shows CVs in 1 M KOH and in 1 M KOH+ 0.5 M NH4OH. The large oxidation
peak (red line) at ~ -0.2 V is related to ammonia electrooxidation on Pt NPs. The current decrease
past -0.2 V corresponds to PtOx formation and the surface poisoning by reaction intermediates,
e.g., Nads. Hydrogen evolution occurs at around -0.85 V in 1 M KOH solution while it happens
faster at around -0.8 V in the solution containing 1 M KOH+ 0.5 M NH4OH. H2 adsorption and
desorption peaks have been detected in -0.4 V to -0.83 V region in the absence of ammonia which
has shifted toward lower overpotential around -0.35 V for the solution with ammonia. This shift
indicates the fact that the existence of ammonium cations may affect the binding energy of the
hydrogen leading to the change in the corresponding potential. A well-defined peak approximately
NaOH
concentration
Initial pH Final pH Particle mean
size/nm
(from TEM)
ECSA/cm2
0.25 11.6 8.2 1.3 0.17
0.15 11.4 8 2.2 0.21
0.1 11 7 2.9 0.17
0.08 10 5 4.3 0.09
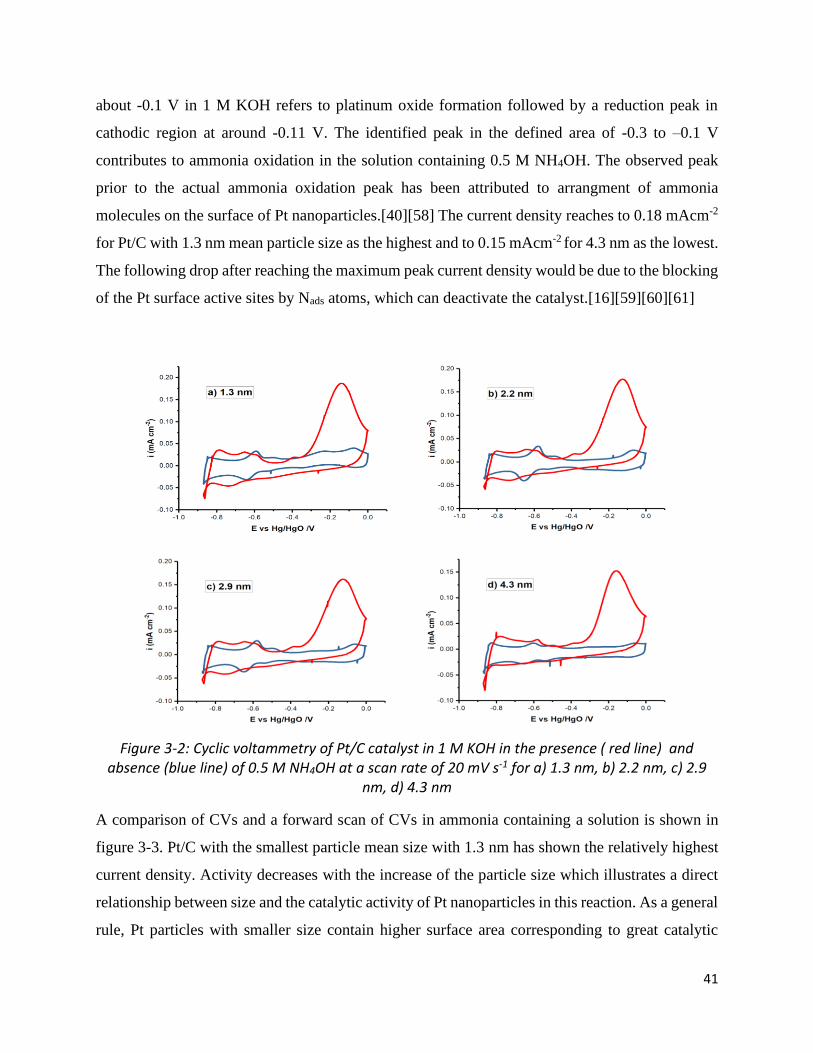
41
about -0.1 V in 1 M KOH refers to platinum oxide formation followed by a reduction peak in
cathodic region at around -0.11 V. The identified peak in the defined area of -0.3 to –0.1 V
contributes to ammonia oxidation in the solution containing 0.5 M NH4OH. The observed peak
prior to the actual ammonia oxidation peak has been attributed to arrangment of ammonia
molecules on the surface of Pt nanoparticles.[40][58] The current density reaches to 0.18 mAcm-2
for Pt/C with 1.3 nm mean particle size as the highest and to 0.15 mAcm-2 for 4.3 nm as the lowest.
The following drop after reaching the maximum peak current density would be due to the blocking
of the Pt surface active sites by Nads atoms, which can deactivate the catalyst.[16][59][60][61]
Figure 3-2: Cyclic voltammetry of Pt/C catalyst in 1 M KOH in the presence ( red line) and absence (blue line) of 0.5 M NH4OH at a scan rate of 20 mV s-1 for a) 1.3 nm, b) 2.2 nm, c) 2.9
nm, d) 4.3 nm
A comparison of CVs and a forward scan of CVs in ammonia containing a solution is shown in
figure 3-3. Pt/C with the smallest particle mean size with 1.3 nm has shown the relatively highest
current density. Activity decreases with the increase of the particle size which illustrates a direct
relationship between size and the catalytic activity of Pt nanoparticles in this reaction. As a general
rule, Pt particles with smaller size contain higher surface area corresponding to great catalytic

42
output.[62] It is also important, moreover, to be investigated if there is a critical size linked to the
catalytic activity. However, some debates related to finding a similar point of view on the particle
size effect of Pt in electrochemical reactions remain which may be attributed to the variability in
chosen techniques and materials of synthesis. For instance, it has been reported that there is a
reduction in the catalytic activity of Pt by declining in catalyst particle size less than 3 nm or
growing of specific surface area.[63] Meanwhile, the widely accepted theory would be this fact
that by reducing the particle size to lower than 5 nm, a dramatic increase would happen in the
variety of surface atomic facets, which directly influence the catalytic activity of nanocatalyst.[64]
It can be seen that between -0.35 to -0.48 V as the onset potential region, highlighted (dashed)
parts of CVs, the current density is lower for Pt 4.3 nm compared to the smaller nanoparticles.
This may be due to potential structure differences as a result of size diversity that is also notable
in the hydrogen region peaks. The onset potential seems to be more negative for the smallest Pt
nanoparticles and almost the same for two middle sizes.
Figure 3-3: Left) Cyclic voltammetry for Pt 1.3 nm, Pt 2.2 nm, Pt 2.9 nm and Pt 4.3 nm in 1 M KOH + 0.5 M NH4OH at Scan rate of 20 mV s-1 and right) onset potential region for Pt with
different sizes
Considering the critical particle size of nanostructured Pt, a reasonable relation between catalytic
activity and stability of the catalyst should be addressed to make it feasible and cost-effective.
According to the CV measurements, Pt 1.3 nm has shown relatively higher activity than others
while considering chronoamperometry measurements showed in figure 3-4, a well-balanced

43
relation between activity and short-term stability has been noticed for Pt 2.2 nm. As can be seen,
the two largest particles, 2.9 and 4.3 nm have been swiftly deactivated at -0.3 V before the 1300s
of the experiment. The drastic drop could be attributed to the passive atomic N intermediates
covering the Pt surface and block the active sites.[54][56]
Figure 3-4: Chronoamperometry measurements for Pt 1.3 nm, Pt 2.2 nm, Pt 2.9 nm and Pt 4.3 nm in 1 M KOH+ 0.5M NH4OH at -0.3 V vs Hg/HgO
3.4.3 In-situ PM-IRRAS measurements
After cyclic voltammetry measurements, the Pt/C electrode was subsequently adjusted in order to
obtain the spectra using polarization modulation infrared reflection absorption spectroscopy (PM-
IRRAS). This technique enables us to distinguish between the oxidation species stuck on the
catalyst surface and released to the bulk of the electrolyte. Chronoamperometry was coupled with
infrared spectroscopy in 1 M KOH for collecting the reference spectra, which then the electrolyte
was switched to 1 M KOH + 0.5 M NH4OH.
The collected spectra during ammonia electrooxidation have been shown in figure 3-5 for two Pt
catalysts with the highest activity and better short-term stability. At various potentials in the
oxidation state ranging from double-layer region at -0.5 V to oxidation potential at -0.25 V vs
Hg/HgO, different peaks with diverse intensity were observed, which the band assignments have

44
been listed in table 3-2. At 1290-1360, 1475-1550, 2000-2120 and 2700-3000 cm-1, four distinct
bands have been emerged after applying individual potentials.
An apparent peak both on the surface and in bulk was recorded at 3000-2700 cm-1, related to the
N-H species started at around -0.35 V for Pt 1.3 nm and later at about -0.3 v for 2.2 nm which is
in agreement with onset potential according to the ammonia electrooxidation CVs following by a
continuous increase in the intensity at higher potentials. The peak growth demonstrates the
development of an oxidation reaction on the surface of the Pt electrode that achieved the maximum
significance at approximately -0.25 V.
The differences in the intensity of the peaks in bulk and on the surface would be due to this fact
that developed compounds on the surface have been diffused quickly into the bulk of the solution.
The positive peak at about 2010 Cm-1, which was identified during the ammonia electrooxidation
on the surface and in the electrolyte, is well aligned with a surface-enhanced Raman spectroscopic
research that says it corresponds to azide ions N3-.[41][65][66] An azide ion is generated by the
interaction of hydrazine (N2H4) and ammonia molecule.
The consistent asymmetric and symmetric N-O bonds in bulk obtained during the nitro compounds
transformation correspond to the peaks at 1550-1475 cm−1 and 1360-1290 cm-1,
respectively.[67][68][69] As can be seen, the symmetric nitro components are not recognizable on
the surface of Pt 1.3 and 2.2 nm, which could be due to immediate detachment from the surface
after formation.
In figure 3-5 b, for Pt 2.2 nm, at potential before -0.3 V, those negative peaks displayed at ~2900
cm−1 have been formed owing to the N−H bond break and molecule reorganization. It is worth to
mention that by observing which components are formed and following the peak intensity, it is
possible to see where the reaction begins and the onset potential, which is a critical factor in finding
an efficient catalyst that can be found precisely. According to the results, Pt with smaller mean
size possesses lower onset potential in comparison to Pt 2.2 nm.

45
Figure 3-5: PM-IRRAS spectra (considering ammonia at -0.5 V as reference in processing the spectra) on Pt/C 20 wt% synthesized with a) 0.25M (1.3 nm) and b) 0.15M (2.2 nm) NaOH for ammonia electro oxidation in 1M KOH+ 0.5M NH4OH in the bulk of electrolyte(left) and on the surface (right)
Table 3-2: Band Assignment for PM-IRRAS peaks in 1 M KOH + 0.5 MNH4OH
Wavenumber [ cm-1] Bond Assignment
3000-2700 N-H N2H4, N2H2, N2H, …
2120-2000 N=N=N Azide ion
1550-1475 N-O NO-3
1360-1290 N-O NO-2
a
b
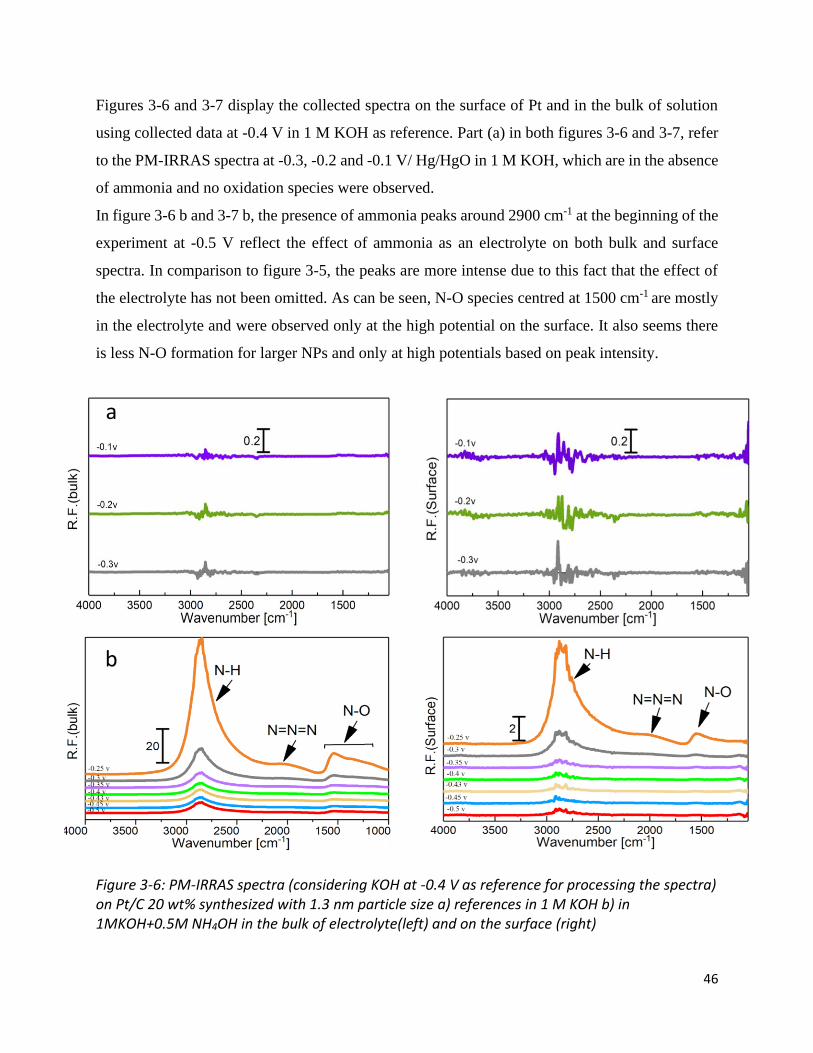
46
Figures 3-6 and 3-7 display the collected spectra on the surface of Pt and in the bulk of solution
using collected data at -0.4 V in 1 M KOH as reference. Part (a) in both figures 3-6 and 3-7, refer
to the PM-IRRAS spectra at -0.3, -0.2 and -0.1 V/ Hg/HgO in 1 M KOH, which are in the absence
of ammonia and no oxidation species were observed.
In figure 3-6 b and 3-7 b, the presence of ammonia peaks around 2900 cm-1 at the beginning of the
experiment at -0.5 V reflect the effect of ammonia as an electrolyte on both bulk and surface
spectra. In comparison to figure 3-5, the peaks are more intense due to this fact that the effect of
the electrolyte has not been omitted. As can be seen, N-O species centred at 1500 cm-1 are mostly
in the electrolyte and were observed only at the high potential on the surface. It also seems there
is less N-O formation for larger NPs and only at high potentials based on peak intensity.
Figure 3-6: PM-IRRAS spectra (considering KOH at -0.4 V as reference for processing the spectra) on Pt/C 20 wt% synthesized with 1.3 nm particle size a) references in 1 M KOH b) in 1MKOH+0.5M NH4OH in the bulk of electrolyte(left) and on the surface (right)
a
b

47
Figure 3-7: PM-IRRAS spectra (considering KOH at -0.4 V as reference for processing the spectra) on Pt/C 20 wt% synthesized with 2.2 nm particle size a) references in 1 M KOH b) in 1MKOH+0.5M NH4OH in the bulk of electrolyte(left) and on the surface (right)
Figure 3-8 a display that at 3600 cm-1, by keeping the onset and oxidation potentials constant for
a longer time, around 30 min, OH- started to appear on the surface of Pt 1.3 nm which could not
be observed in the bulk spectra. The same test was done for Pt 2.2 nm (Fig. 3-8 b) and any
significant peak at mentioned wavenumber was not observed. The test showed that the coverage
of the surface by OH- might be a potential reason for the differences between the short-term
stability of 1.3 and 2.2 nm nanoparticles, which occurred after 30 min. It was reported that OH-
ions can be attached strongly on the surface of Pt catalyst and covered the active sites competing
with ammonia molecules.[70][71] It is therefore presumed that the oxygenated ions may also play
a restrictive role in addition to the Nads atoms.
a
b

48
Figure 3-8: PM-IRRAS spectra (considering ammonia at -0.5 V as reference) on Pt/C 20 wt% with a) 1.3 b)2.2 nm particle size for ammonia electro oxidation in 1M KOH+ 0.5M NH4OH in the bulk of electrolyte(left) and on the surface (right) collected after 30 min at each potential
3.5 Conclusions In this work, Pt was synthesized by a modified polyol method using different pH to obtain different
particle sizes in order to study the effect of particle size on catalytic activity. TEM technique was
employed to examine the dispersion and size distribution of the carbon-supported catalysts.
Polarization modulation infrared reflection absorption spectroscopy (PM-IRRAS) was combined
with electrochemical measurements for the investigation of ammonia electrooxidation using
carbon-supported Pt in alkaline media. The study was illustrated in a noticeable relation between
the size of nano-catalyst and catalytic activity. The smallest particle size of Pt at 1.3 nm showed
relatively better activity while the Pt 2.2 nm was demonstrated better durability besides cognitive
activity. The oxidation species were detected using in-situ PM-IRRAS by applying various
a
b

49
oxidation potentials. N-H species, as well as azide ions and nitro-compounds, were observed. The
onset potential was found to be lower for the smallest particle mean size as a desirable factor for
an electrocatalyst in an electrochemical reaction. There was also found that N-O was generated
and observed mostly in the bulk of the solution as a product of electrooxidation reaction at higher
potentials (-0.3 V, -0.25 V) where Pt oxide was formed. OH- appeared on the surface of Pt 1.3 nm
after a longer time at around oxidation potentials, which could not be observed in the bulk spectra.
It was reported that OH- can be attached firmly on the surface of Pt catalyst and covered the active
sites. This could be a potential reason for the lower stability of Pt 1.3 compared to Pt 2.2 nm.
3.6 References
[1] J. Nowotny et al., “Towards global sustainability: Education on environmentally clean energy technologies,” Renew. Sustain. Energy Rev., vol. 81, pp. 2541–2551, Jan. 2018.
[2] M. Z. Y. Nurazni Amat Bahari, Wan Nor Roslam , Wan Isahak Mohd Shahbudin, “Clean hydrogen generation and storage strategies via CO2 utilization into chemicals and fuels: A review,” Int. J. energy Res. Vol. Issue10 Pages 5128-5150, 2019.
[3] A. G. Stern, “A new sustainable hydrogen clean energy paradigm,” Int. J. Hydrogen Energy, vol. 43, no. 9, pp. 4244–4255, Mar. 2018.
[4] C. Acar and I. Dincer, “Review and evaluation of hydrogen production options for better environment,” J. Clean. Prod., vol. 218, pp. 835–849, May 2019.
[5] S. Dutta, “A review on production, storage of hydrogen and its utilization as an energy resource,” J. Ind. Eng. Chem., vol. 20, no. 4, pp. 1148–1156, Jul. 2014.
[6] I. D. and C. Acar, “A review on clean energy solutions for better sustainability,” Int. J. Energy Res. ; 39585–606, 2015.
[7] R. Sarrias-Mena, L. M. Fernández-Ramírez, C. A. García-Vázquez, and F. Jurado, “Electrolyzer models for hydrogen production from wind energy systems,” Int. J. Hydrogen Energy, vol. 40, no. 7, pp. 2927–2938, Feb. 2015.
[8] M. M. Dariusz Owierkowicz*, “The future of the fuel in the marine industry,” World Sci. News 76, 136-148, 2017.
[9] J. Andersson and S. Grönkvist, “Large-scale storage of hydrogen,” Int. J. Hydrogen Energy, vol. 44, no. 23, pp. 11901–11919, May 2019.
[10] J. D. Holladay, J. Hu, D. L. King, and Y. Wang, “An overview of hydrogen production technologies,” Catal. Today, vol. 139, no. 4, pp. 244–260, Jan. 2009.
[11] I. S. Pieta et al., “Electrocatalytic methanol oxidation over Cu, Ni and bimetallic Cu-Ni nanoparticles supported on graphitic carbon nitride,” Appl. Catal. B Environ., vol. 244, pp. 272–283, May 2019.
50
[12] M. B. C. de Souza et al., “Bi-modified Pt Electrodes toward Glycerol Electrooxidation in Alkaline Solution: Effects on Activity and Selectivity,” ACS Catal., vol. 9, no. 6, pp. 5104–5110, Mar. 2019.
[13] F. R. Dr. Ibrahim Dincer, Yusuf Bicer , Greg Vezina, “Green Transportation Fuel: Ammonia,” 2017.
[14] T. V. Asbjørn Klerke , Claus Hviid Christensen , Jens K. Nørskov, “Ammonia for hydrogen storage: challenges and opportunities,” J. Mater. Chem., 18, 2304-2310, 2008.
[15] Z. Andreas, R. Arndt, B. Andreas, and F. Oliver, “Hydrogen: the future energy carrier,” Philos. Trans. R. Soc. A Math. Phys. Eng. Sci. 368, 1923, 3329-3342, 2010.
[16] H. Gerischer and A. Mauerer, “Untersuchungen Zur anodischen Oxidation von Ammoniak an Platin-Elektroden,” J. Electroanal. Chem. Interfacial Electrochem., vol. 25, no. 3, pp. 421–433, May 1970.
[17] F. J. Vidal-Iglesias, J. Solla-Gullón, V. Montiel, J. M. Feliu, and A. Aldaz, “Ammonia Selective Oxidation on Pt(100) Sites in an Alkaline Medium,” J. Phys. Chem. B, vol. 109, no. 26, pp. 12914–12919, Jun. 2005.
[18] D. Skachkov, C. Venkateswara Rao, and Y. Ishikawa, “Combined First-Principles Molecular Dynamics/Density Functional Theory Study of Ammonia Electrooxidation on Pt(100) Electrode,” J. Phys. Chem. C, vol. 117, no. 48, pp. 25451–25466, Nov. 2013.
[19] E. Sälli, S. Martiskainen, and L. Halonen, “Computational Study of the Vibrational Structure of the Ammonia Molecule Adsorbed on the fcc (111) Transition Metal Surfaces,” J. Phys. Chem. C, 116, 28, 14960-14969, Jul. 2012.
[20] T. Matsui et al., “In Situ Attenuated Total Re fl ection Infrared Spectroscopy on Electrochemical Ammonia Oxidation over Pt Electrode in Alkaline Aqueous Solutions,” 2015.
[21] B. G. Boggs BK, “Optimization of Pt-Ir on carbon fiber paper for the electro-oxidation of ammonia in alkaline media,” Electrochim. Acta, Vol.55, No.19, 5287-5293, 2010.
[22] W. H. and C. Z. Jie Liu, Bin Chen, Yue Kou, Zhi Liu, Xu Chen, Yingbo Li, Yida Deng, Xiaopeng Han, “Pt-decorated highly porous flower-like Ni particles with high mass activity for ammonia electro-oxidation,” J. Mater. Chem. A , 4, 11060–11068, 2016.
[23] C. J. Weststrate, J. W. Bakker, A. C. Gluhoi, W. Ludwig, and B. E. Nieuwenhuys, “Ammonia oxidation on Ir(1 1 1): Why Ir is more selective to N2 than Pt,” Catal. Today, vol. 154, no. 1–2, pp. 46–52, Sep. 2010.
[24] W. C. J.Q. Zhong, X. Zhou, K. Yuan, C.A. Wright, A. Tadich, D.C. Qi, H.X. Li, K. Wu, G.Q. Xu, “Probing the effect of the Pt–Ni–Pt(111) bimetallic surface electronic structures on the ammonia decomposition reaction,” Nano, 9 (2), pp. 666-672, 2017.
[25] H. Kim, D. Won, K. S. Nahm, and P. Kim, “Facile preparation of hollow PT-and PtIr-nanostructures with spiky surface for the electro-oxidation of ammonia,” Catal. Letters, vol. 144, no. 3, pp. 469–477, 2014.
[26] Z. Ni et al., “Fabrication of platinum submonolayer electrodes and their high electrocatalytic activities for ammonia oxidation,” Electrochim. Acta, 177, 30-35, Sep. 2015.
[27] S. Le Vot, L. Roué, and D. Bélanger, “Study of the electrochemical oxidation of ammonia on platinum in alkaline solution: Effect of electrodeposition potential on the activity of platinum,” J.

51
Electroanal. Chem., vol. 691, pp. 18–27, Feb. 2013.
[28] J. A. Herron, P. Ferrin, and M. Mavrikakis, “Electrocatalytic Oxidation of Ammonia on Transition-Metal Surfaces: A First-Principles Study,” J. Phys. Chem. C, vol. 119, no. 26, pp. 14692–14701, Feb. 2015.
[29] Z.-F. Li, Y. Wang, and G. G. Botte, “Revisiting the electrochemical oxidation of ammonia on carbon-supported metal nanoparticle catalysts,” Electrochim. Acta, 228, 351-360, Feb. 2017.
[30] W. B. H. and Y. F. C. C. Zhong, “Recent advances in electrocatalysts for electro-oxidation of ammonia,” J. Mater. Chem. A,1, 3216-3238, 2013.
[31] E. P. Bonnin, E. J. Biddinger, and G. G. Botte, “Effect of catalyst on electrolysis of ammonia effluents,” J. Power Sources, vol. 182, no. 1, pp. 284–290, Jul. 2008.
[32] B. K. Boggs and G. G. Botte, “Optimization of Pt–Ir on carbon fiber paper for the electro-oxidation of ammonia in alkaline media,” Electrochim. Acta, 55, 5287-5293, Jul. 2010.
[33] F. J. V.-I. and J. M. F. J. Solla-Gullón, “Shape dependent electrocatalysis,” Annu. Rep. Prog. Chem., Sect. C Phys. Chem.,107, 263-297, 2011.
[34] M. Duca, M. C. Figueiredo, V. Climent, P. Rodriguez, J. M. Feliu, and M. T. M. Koper, “Selective Catalytic Reduction at Quasi-Perfect Pt(100) Domains: A Universal Low-Temperature Pathway from Nitrite to N2,” J. Am. Chem. Soc., vol. 133, no. 28, pp. 10928–10939, Jun. 2011.
[35] K. Kon, S. M. A. Hakim Siddiki, and K. Shimizu, “Size- and support-dependent Pt nanocluster catalysis for oxidant-free dehydrogenation of alcohols,” J. Catal., vol. 304, pp. 63–71, Aug. 2013.
[36] Y. Li and F. Zaera, “Sensitivity of the glycerol oxidation reaction to the size and shape of the platinum nanoparticles in Pt/SiO2 catalysts,” J. Catal., vol. 326, pp. 116–126, Jun. 2015.
[37] R. Peng et al., “Size effect of Pt nanoparticles on the catalytic oxidation of toluene over Pt/CeO2 catalysts,” Appl. Catal. B Environ., vol. 220, pp. 462–470, Jan. 2018.
[38] R. Martínez-rodríguez, F. J. Vidal-iglesias, J. Sollá-gullón, and M. Juan, “Synthesis of Pt nanoparticles in water-in-oil microemulsion : on the effect of HCl on their surface structure,” J. Am. Chem. Soc. , 136, 1280−1283, 2014.
[39] C. Z. Zhi Liu, Yao Yang, Baipo Shu, Jie Liu, Xu Chen, Yingbo Li, Yida Deng, Xiaopeng Han, Wenbin Hu, “A Facile Electrochemical Method to Prepare Pt Disk Electrode with (100) Preferential Orientation for Investigating Structure-Sensitive Electro-Oxidation Reactions,” Int. J. Electrochem. Sci, 11, 4675-4687, 2016.
[40] V. R. and M. T. M. Koper, “Electrocatalytic oxidation of ammonia on Pt(111) and Pt(100) surfaces,” Phys. Chem. Chem. Phys.,8, 2513-2524, 2006.
[41] F. J. Vidal-Iglesias, J. Solla-Gullón, J. M. Pérez, and A. Aldaz, “Evidence by SERS of azide anion participation in ammonia electrooxidation in alkaline medium on nanostructured Pt electrodes,” Electrochem. commun., vol. 8, no. 1, pp. 102–106, Jan. 2006.
[42] S. J. B. and K. A. V. Stephen P. Best, “Infrared Spectroelectrochemistry,” in Spectroelectrochemistry, Royal Society of Chemistry, 2008, pp. 1–30.
[43] C. L. Haynes, A. D. McFarland, and R. P. Van Duyne, “Surface-Enhanced Raman Spectroscopy,”
52
Anal. Chem., vol. 77, no. 17, pp. 338 A-346 A, Sep. 2005.
[44] R. G. Greenler, “Infrared Study of Adsorbed Molecules on Metal Surfaces by Reflection Techniques,” J. Chem. Phys. 44, 310, 1966.
[45] E. A. Monyoncho et al., “Ethanol Electro-oxidation on Palladium Revisited Using Polarization Modulation Infrared Re fl ection Absorption Spectroscopy ( PM-IRRAS ) and Density Functional Theory ( DFT ): Why Is It Di ffi cult To Break the C − C Bond ?,” vol. 4906, no. 2, 2016.
[46] E. A. Monyoncho, S. N. Steinmann, P. Sautet, E. A. Baranova, and C. Michel, “Computational screening for selective catalysts: Cleaving the CC bond during ethanol electro-oxidation reaction,” Electrochim. Acta, vol. 274, pp. 274–278, Jun. 2018.
[47] M. S. E. Houache, E. Cossar, S. Ntais, and E. A. Baranova, “Electrochemical modification of nickel surfaces for efficient glycerol electrooxidation,” J. Power Sources, vol. 375, pp. 310–319, Jan. 2018.
[48] M. E. Houache et al., “Electrochemical Valorization of Glycerol on Ni-Rich Bimetallic NiPd Nanoparticles: Insight into Product Selectivity Using in Situ Polarization Modulation Infrared-Reflection Absorption Spectroscopy,” ACS Sustain. Chem. & Eng. 7, 17, 14425-14434, Jun. 2019.
[49] E. A. Baranova, C. Bock, D. Ilin, D. Wang, and B. MacDougall, “Infrared spectroscopy on size-controlled synthesized Pt-based nano-catalysts,” Surf. Sci., vol. 600, no. 17, pp. 3502–3511, Sep. 2006.
[50] C. Bock, C. Paquet, M. Couillard, G. A. Botton, and B. R. MacDougall, “Size-Selected Synthesis of PtRu Nano-Catalysts: Reaction and Size Control Mechanism,” J. Am. Chem. Soc., vol. 126, no. 25, pp. 8028–8037, Jun. 2004.
[51] J. Zamlynny, V.; Lipkowski, “In Advances in Electrochemical Science and Engineering: Diffraction and Spectroscopic Methods in Electrochemistry,” 2006, p. 315−376.
[52] E. A. Monyoncho, V. Zamlynny, T. K. Woo, and E. A. Baranova, “The utility of polarization modulation infrared reflection absorption spectroscopy (PM-IRRAS) in surface and in situ studies: new data processing and presentation approach,” pp. 2563–2573, 2018.
[53] B. E. Conway, “Electrochemical oxide film formation at noble metals as a surface-chemical process,” Prog. Surf. Sci., vol. 49, no. 4, pp. 331–452, Aug. 1995.
[54] T. L. Lomocso and E. A. Baranova, “Electrochimica Acta Electrochemical oxidation of ammonia on carbon-supported bi-metallic PtM ( M = Ir , Pd , SnO x ) nanoparticles,” Electrochim. Acta, 56, 8551-8558, 2011.
[55] F. J. Vidal-Iglesias, J. Solla-Gullón, V. Montiel, J. M. Feliu, and A. Aldaz, “Screening of electrocatalysts for direct ammonia fuel cell: Ammonia oxidation on PtMe (Me: Ir, Rh, Pd, Ru) and preferentially oriented Pt(1 0 0) nanoparticles,” J. Power Sources, 171, 448-456, Sep. 2007.
[56] M. H. M. T. Assumpção et al., “Oxidation of ammonia using PtRh/C electrocatalysts: Fuel cell and electrochemical evaluation,” Appl. Catal. B Environ. 174, 136-144, Sep. 2015.
[57] J. C. M. Silva et al., “PtAu/C electrocatalysts as anodes for direct ammonia fuel cell,” Appl. Catal. A Gen. 490, 133-138, Jan. 2015.
53
[58] I. Katsounaros, T. Chen, A. A. Gewirth, N. M. Markovic, and M. T. M. Koper, “Evidence for Decoupled Electron and Proton Transfer in the Electrochemical Oxidation of Ammonia on Pt(100),” J. Phys. Chem. Lett., vol. 7, no. 3, pp. 387–392, Jan. 2016.
[59] S. Suzuki, H. Muroyama, T. Matsui, and K. Eguchi, “Fundamental studies on direct ammonia fuel cell employing anion exchange membrane,” J. Power Sources, vol. 208, pp. 257–262, Jun. 2012.
[60] J. A. R. Vooys, de, A. C. A., Koper, M. T. M., Santen, van, R. A., & Veen, van, “The role of adsorbates in the electrochemical oxidation of ammonia on noble and transition metal electrodes,” J. Electroanal. Chem. 506, 127-137., 2001.
[61] H. Zöllig, E. Morgenroth, and K. M. Udert, “Inhibition of Direct Electrolytic Ammonia Oxidation Due to a Change in Local pH,” Electrochim. Acta, vol. 165, pp. 348–355, May 2015.
[62] T. L. and W. X. Xiao Zhao , Min Yin , Liang Ma , Liang Liang , Changpeng Liu , Jianhui Liao, “Recent advances in catalysts for direct methanol fuel cells,” Energy Environ. Sci., vol. 4, 2736–27, 2011.
[63] K. Kinoshita, “Particle Size Effects for Oxygen Reduction on Highly Dispersed Platinum in Acid Electrolytes,” J. Electrochem. Soc. 137(3) 845-848, 1990.
[64] X. X. and Y. X. Shuifen Xie, Sang-Il Choi, “Catalysis on faceted noble-metal nanocrystals: both shape and size matter,” Curr. Opin. Chem. Eng. , 2142–150, 2013.
[65] R. E. Kunz, J. G. Gordon, M. R. Philpott, and A. Girlando, “Surface enhanced Raman spectra from silver electrodes in azide solution,” J. Electroanal. Chem. Interfacial Electrochem., vol. 112, no. 2, pp. 391–395, Sep. 1980.
[66] T. M. Klapötke, H. Nöth, T. Schütt, and M. Suter, “Mixed chloride/azide complexes of arsenic and antimony,” Eur. J. Inorg. Chem., no. 9, pp. 2511–2517, 2002.
[67] K. N. K. S. Y. Y. Osawa, “Surface-Enhanced Infrared Absorption Spectroscopic Studies of Adsorbed Nitrate, Nitric Oxide, and Related Compounds 2: Nitrate Ion Adsorption at a Platinum Electrode,” Langmuir,248,4358-4363, 2008.
[68] S. Wasmus, E. J. Vasini, M. Krausa, H. T. Mishima, and W. Vielstich, “DEMS-cyclic voltammetry investigation of the electrochemistry of nitrogen compounds in 0.5 M potassium hydroxide,” Electrochim. Acta, vol. 39, no. 1, pp. 23–31, Jan. 1994.
[69] F. Rahman Rima, K. Nakata, K. Shimazu, and M. Osawa, “Surface-Enhanced Infrared Absorption Spectroscopic Studies of Adsorbed Nitrate, Nitric Oxide, and Related Compounds. 3. Formation and Reduction of Adsorbed Nitrite at a Platinum Electrode,” J. Phys. Chem. C, vol. 114, no. 13, pp. 6011–6018, Mar. 2010.
[70] M. C. and G. G. Botte, “Hydrogen Production from the Electro-oxidation of Ammonia Catalyzed by Platinum and Rhodium on Raney Nickel Substrate,” J. Electrochem. Soc.,153, A1894-A1901, 2006.
[71] W. Peng, L. Xiao, B. Huang, L. Zhuang, and J. Lu, “Inhibition Effect of Surface Oxygenated Species on Ammonia Oxidation Reaction,” J. Phys. Chem. C, vol. 115, no. 46, pp. 23050–23056, Nov. 2011.
54
Chapter 4: Ammonia Electrooxidation on PtIr and PtRu Catalysts
Prepared on Engineered Catalyst Supports
Niloofar Aligholizadeh K.1, Natalia Alzate-Carvajal1, Barr Zulevi2, Alexey Serov2, Evans A.
Monyoncho1, Elena A. Baranova1
1. Department of Chemical and Biological Engineering, Centre for Catalysis Research and
Innovation, University of Ottawa, 161 Louis-Pasteur, Ottawa, Ontario, Canada K1N 6N5
2. Pajarito Powder Limited Liability Company (LLC), 3600 Osuna Rd NE, Suite 309, Albuquerque,
NM 87102, USA
(To be submitted to International Journal of Hydrogen Energy)
4.1 Abstract
Monometallic platinum and bimetallic PtIr and PtRu nanoparticles supported on two engineered
catalyst supports (ECSs) were prepared and comprehensively studied. X-ray diffraction (XRD)
patterns of the Pt and PtM nanoparticles showed the typical face-centred cubic structure of Pt.
Crystalline sizes of Pt nanoparticles were found to be bigger than bimetallic PtM nanoparticles.
The activity/stability of the electrocatalysts for ammonia electrooxidation reaction (AmER) in
alkaline media was evaluated by cyclic voltammetry and chronoamperometry experiments. Pt
shows the highest AmER peak current density, however alloying Pt with Ir and Ru shifted AmER
peak to lower onset potentials in comparison with monometallic Pt, which was also observed by
polarization modulation infrared reflection absorption spectroscopy (PM-IRRAS). Bimetallic PtIr
and PtRu catalysts demonstrated a higher tolerance towards higher concentrated ammonia
solutions in comparison with monometallic Pt. Although the initial current density for PtIr
electrocatalyst was lower in comparison with Pt, the decrease over time was found to be less
pronounced, giving a higher current density after 1000s, indicating the higher catalyst durability.
The high intrinsic activity of the PtIr electrocatalyst is attributed to a co-catalytic promotion effect
of Ir, which was undoubtedly demonstrated by lower overpotential of PtIr in AmER. Collected
spectra using PM-IRRAS were illustrated N-H species as well as azide anions and N-O
compounds. PtRu with 80wt% metal loading in PM-IRRAS spectra showed a new peak around
3600 cm-1 on the surface corresponding to OH-. It would be due to the high tendency of Ru-based
catalysts toward oxygenated species, which leads to the formation of water on the surface.

55
4.2 Introduction
The studies dedicated to energy conversion and storage have been increasing over the world due
to the limited resources of non-renewable fossil fuels and climate change concerns. One of the
alternatives is the use of hydrogen-fed fuel cells as a clean and efficient energy source. The
disadvantage of H2 is its production, transportation and storage which reduces the possibility of
expanding the use of hydrogen energy to the vast number of applications. Ammonia has been
attracted attention as a potential hydrogen carrier due to its carbon-free nature high hydrogen
capacity of about 17.6 wt%.[1], [2] Besides, ammonia condenses at ambient temperature and
slightly elevated pressure, and thus, its transportation and storage can be integrated into exciting
Liquified Petroleum Gas (LPG) infrastructure. Furthermore, ammonia could be directly used in
ammonia fuel cells proposed in the 60th of the last century for space application.[3], [4] In a direct
ammonia fuel cell (DAmFC), ammonia is used as a fuel and it is directly oxidized at the anode
with concomitant oxygen reduction at the cathode. However, ammonia electrooxidation in a fuel
cell system is a slow process at low temperatures, and an efficient electrocatalyst is required to
increase the efficiency and performance of direct ammonia fuel cells. [5]–[8]
Among different electrocatalytically active metals, platinum has been demonstrated to be the most
efficient electrocatalyst for ammonia electrooxidation.[9]–[12] Nevertheless, the catalytic
performance of Pt is affected by the strong adsorption of reaction intermediate, atomic nitrogen
(Nads) formed during the ammonia electrooxidation reaction (AmER) in the active surface sites of
the Pt electrode, as a consequence the rate of ammonia oxidation is reduced due to continuous
deactivation of the Pt catalyst.[13]–[15] In order to address this problem, considerable effort has
been directed towards the reduction of catalyst poisoning and increasing the current density of
AmER. For example, the synthesis of nanostructured Pt-based catalysts alloyed with different
elements such as Ir, Ru, Rh, Pd, Ni has been widely studied.[16]–[20] It has been proved that
alloying Pt with a second metal improves the catalytic performance of the electrocatalyst, mainly
due to the synergistic effect between the metals and the possibility of enhancing the number of
active sites controlling the shape, morphology and orientation of the catalyst. It should be
mentioned that different factors such as nanoparticle synthesis method, particle size distribution,
catalyst support, surface and bulk structure among others, have a significant influence on the

56
electrocatalytic activity and stability of the catalysts. For DAmFc to be a viable, active and stable
catalyst that could be produced at large quantities needs to be developed.
Most of the studies reported that bimetallic PtIr had demonstrated a higher activity toward
ammonia electrooxidation and improved tolerance to the poisoning effect by adsorbed
intermediate species on the surface of the metal. [11], [21], [22]
Many spectroscopic surface-sensitive methods have been set up to help for untangling the formed
oxidation species during the electrooxidation reactions adsorbed on the surface of the catalyst.[23]
In these methods, infrared spectroscopy is especially helpful as it can keep providing data about
the adsorbed molecules and their structure and orientation.[24]–[26] Comparing various sampling
methods, Infrared reflection absorption spectroscopy (IRRAS) is an effective approach for
questioning solid-liquid interfaces. However, high IR absorption from the aqueous electrolyte was
the primary challenge for IRRAS utility. In order to attain greater sensitivity for surface
intermediates, a polarized radiation modulation method was evolved that is used in a method
recognized as polarization modulation infrared reflection absorption spectroscopy (PM-
IRRAS).[27], [28] In PM-IRRAS, a high power photoelastic modulator (PEM) is used to modulate
polarized IR radiation between the vertical (p-) and horizontal (s-) states concerning the incident-
reflection plane.[29], [30]
In the present work, we evaluated five commercial catalysts supported on two different engineered
carbon supports prepared by Pajarito Powder, towards electro-oxidation of ammonia in alkaline
media. The major goal of these studies is to evaluate the activity and stability of the obtained
nanoparticles and observe the possible effects on catalytic activity and surface poisoning of adding
a second metal to Pt electrocatalyst developed by this method and also to provide perspectives to
define oxidation intermediates on the catalyst surface and also in the solution during electro-
oxidation of ammonia and to compare the surface and bulk species, which can be implemented to
understand experimental findings.
57
4.3 Experimental
4.3.1 Preparation of carbon-supported PtRu and PtIr
The studied electrocatalysts were synthesized in a two-step process. Initially, carbon support with
tailored for decoration of Platinum Group Metals (PGMs) nanoparticles was prepared by Pajarito
Powders’s developed VariPore™ method.[31] In a particular case, Engineered Catalyst Supports
(ECSs) was synthesized by using a hard-templating method, where a porous 3D matrix of carbon-
based material was created during the high-temperature pyrolysis. The mixture of the nitrogen-
contained organic precursor with an atomic ratio of C:N atoms equal to 14:5 (ECS-1) and 19:6
(ECS-2) with SiO2 particles was heat-treated in an inert atmosphere (N2) at T=945°Cfor 1.5 hours.
The silicon dioxide was dissolved by concentrated (25wt%) HF for 24 hours and obtained carbon
support was washed with DI water until neutral pH. The wet powder was dried on air at T=85°C
for 12 hours and used for the deposition of PGM catalysts.
The second step of electrocatalysts preparation included soft chemical reduction of PGM salts in
the presence of ECS materials obtained in step 1. All electrocatalytic materials were synthesized
similarly as follows. Platinum and iridium (or ruthenium) precursors (hexachloroplatinic acid,
iridium chloride or ruthenium chloride, Sigma Aldrich, used as obtained) were dissolved in DI
water under stirring conditions at room temperature. The ratio between Pt:Ir was 75:25 and in the
case of Pt:Ru = 67:33. The loading of PGM materials on ECS support was 60wt% for Pt75Ir25/ECS-
1 (Pt75Ir25), 75wt% for Pt67Ru33/ECS-1, 75wt% and 80wt% for Pt67Ru33/ECS-2. The soft chemical
reduction was done by the addition of an excess amount of NaBH4 in 1M KOH to the salts of
PGM. The reduction step was performed for 4 hours and obtained PtM/ECS-X (M=Ir, Ru and
X=1, 2) electrocatalysts were washed with DI water and dried for 8 hours at T=85°C at the air. All
materials were activated in 7at% of H2 (nitrogen balance) at T=200°C for 1 hour. In order to make
a comparison with AmER on pure platinum, a similar soft chemical reduction method was used
with hexachloroplatinic acid only when Pt loading was 40wt% on ECS-1. The obtained samples
were labelled as it follows in the table:
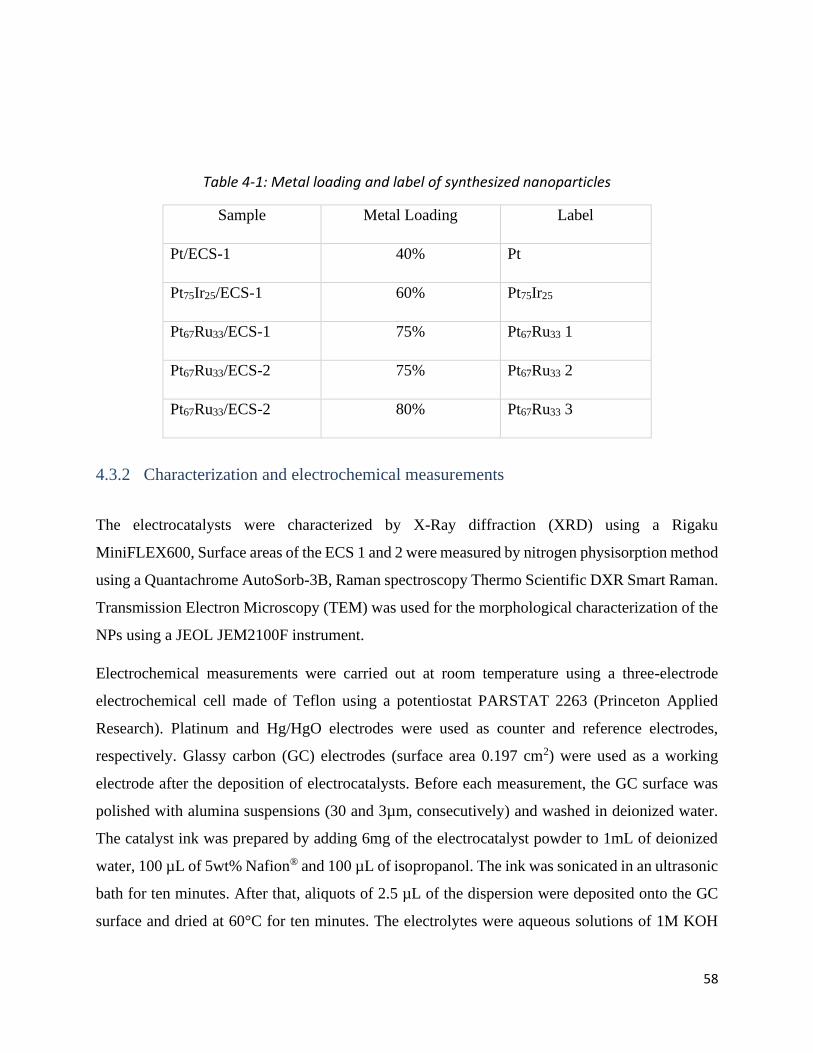
58
Table 4-1: Metal loading and label of synthesized nanoparticles
Sample Metal Loading Label
Pt/ECS-1 40% Pt
Pt75Ir25/ECS-1 60% Pt75Ir25
Pt67Ru33/ECS-1 75% Pt67Ru33 1
Pt67Ru33/ECS-2 75% Pt67Ru33 2
Pt67Ru33/ECS-2 80% Pt67Ru33 3
4.3.2 Characterization and electrochemical measurements
The electrocatalysts were characterized by X-Ray diffraction (XRD) using a Rigaku
MiniFLEX600, Surface areas of the ECS 1 and 2 were measured by nitrogen physisorption method
using a Quantachrome AutoSorb-3B, Raman spectroscopy Thermo Scientific DXR Smart Raman.
Transmission Electron Microscopy (TEM) was used for the morphological characterization of the
NPs using a JEOL JEM2100F instrument.
Electrochemical measurements were carried out at room temperature using a three-electrode
electrochemical cell made of Teflon using a potentiostat PARSTAT 2263 (Princeton Applied
Research). Platinum and Hg/HgO electrodes were used as counter and reference electrodes,
respectively. Glassy carbon (GC) electrodes (surface area 0.197 cm2) were used as a working
electrode after the deposition of electrocatalysts. Before each measurement, the GC surface was
polished with alumina suspensions (30 and 3µm, consecutively) and washed in deionized water.
The catalyst ink was prepared by adding 6mg of the electrocatalyst powder to 1mL of deionized
water, 100 µL of 5wt% Nafion® and 100 µL of isopropanol. The ink was sonicated in an ultrasonic
bath for ten minutes. After that, aliquots of 2.5 µL of the dispersion were deposited onto the GC
surface and dried at 60°C for ten minutes. The electrolytes were aqueous solutions of 1M KOH

59
and 1M KOH + xM NH4OH (x= 0.1, 0.2, 0.5 and 1.0M). The presented oxidation current was
normalized per platinum mass activity.
Cyclic voltammograms were carried out at a scan rate of 20mV/s between -0.9 and 0 V vs Hg/HgO
in solutions of 1M KOH and the following ammonia concentrations: 0.1, 0.2, 0.5 and 1 M NH4OH.
The electrocatalysts were cycled for 10 consecutive cycles until obtaining the stable and
reproducible shape of the voltammogram for ammonia-free solutions and 15 consecutive cycles in
an ammonia containing solutions. The tenth scan for the ammonia-free solution and fifteenth scan
for the ammonia-contained solution is presented unless otherwise specified.
Chronoamperometric experiments were performed for thirty minutes at -0.3 V vs Hg/HgO. The
catalyst electrochemical surface area (ECSA) was calculated by stripping experiments of CO
monolayers, integrating the COad stripping charges, assuming the factor of 420 µC/cm2.[32] For
this method the mixture of CO (1at% in He, Linde) was bubbled through 1M KOH solutions for
20 minutes while the potential was held at -0.7V, subsequently pure N2 (99.99at%, Linde) was
bubbled for 15 minutes to remove the dissolved CO from the solution. The CO stripping
voltammograms were recorded at a scan rate of 20mV/s. (Appendix B, Fig. B-2).
4.3.3 In-situ infrared spectroscopy
All spectroelectrochemical measurements were performed in a modified in-situ cell made of
Teflon, which can be secured with O-rings and coupled with a hemicylinder Calcium Fluoride
window (RJ Spectroscopy Co.). The working electrode formed of a glassy carbon disc embedded
into a rod used through a micrometre screw to correctly regulate the distance between the electrode
and the window. Pt wire was used as counter electrode and potentials were recorded in regard to
mercury−mercury oxide as a reference electrode (Koslow Scientific). The electrodes were linked
to the potentiostat utilizing cables and an internal input jack. The prepared catalyst ink was loaded
on the surface of the glassy carbon electrode and dried for 15 min at 60 ᵒC considered as the
working electrode.
Electrochemical and in-situ infrared studies were conducted by combining the
spectroelectrochemical cell to a Bruker Tensor 37 Fourier transform infrared spectrometer fitted
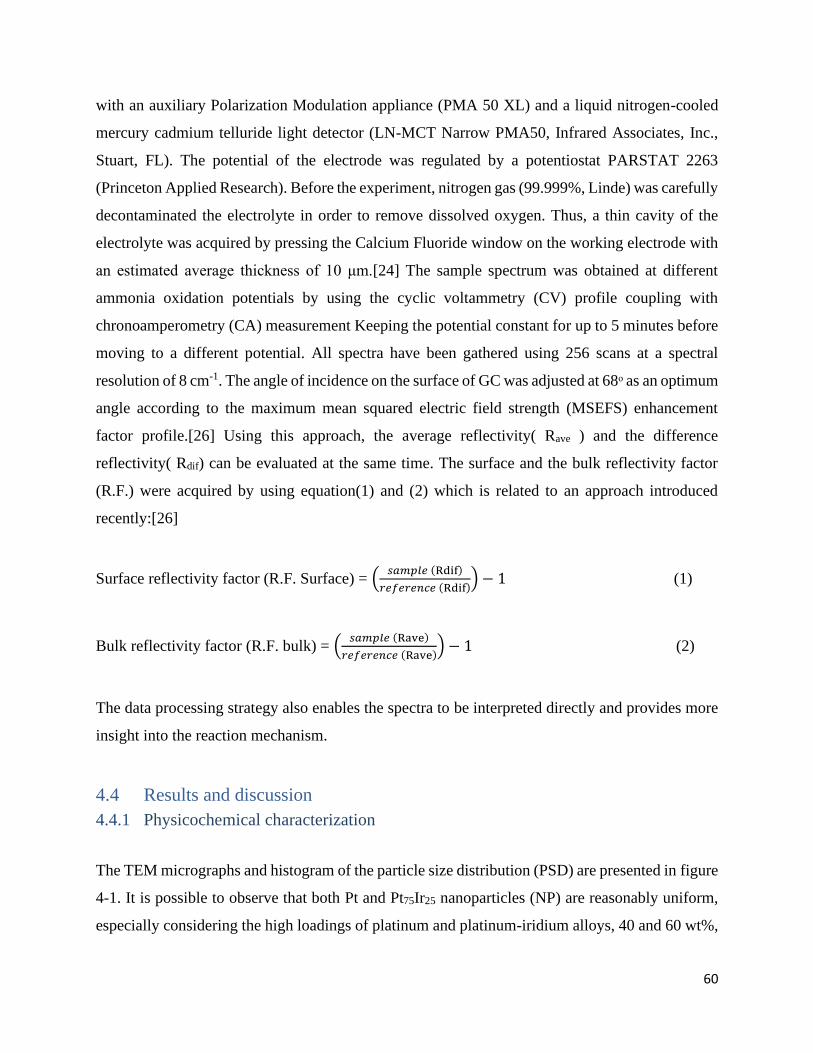
60
with an auxiliary Polarization Modulation appliance (PMA 50 XL) and a liquid nitrogen-cooled
mercury cadmium telluride light detector (LN-MCT Narrow PMA50, Infrared Associates, Inc.,
Stuart, FL). The potential of the electrode was regulated by a potentiostat PARSTAT 2263
(Princeton Applied Research). Before the experiment, nitrogen gas (99.999%, Linde) was carefully
decontaminated the electrolyte in order to remove dissolved oxygen. Thus, a thin cavity of the
electrolyte was acquired by pressing the Calcium Fluoride window on the working electrode with
an estimated average thickness of 10 μm.[24] The sample spectrum was obtained at different
ammonia oxidation potentials by using the cyclic voltammetry (CV) profile coupling with
chronoamperometry (CA) measurement Keeping the potential constant for up to 5 minutes before
moving to a different potential. All spectra have been gathered using 256 scans at a spectral
resolution of 8 cm-1. The angle of incidence on the surface of GC was adjusted at 68ᵒ as an optimum
angle according to the maximum mean squared electric field strength (MSEFS) enhancement
factor profile.[26] Using this approach, the average reflectivity( Rave ) and the difference
reflectivity( Rdif) can be evaluated at the same time. The surface and the bulk reflectivity factor
(R.F.) were acquired by using equation(1) and (2) which is related to an approach introduced
recently:[26]
Surface reflectivity factor (R.F. Surface) = (𝑠𝑎𝑚𝑝𝑙𝑒 (Rdif)
𝑟𝑒𝑓𝑒𝑟𝑒𝑛𝑐𝑒 (Rdif)) − 1 (1)
Bulk reflectivity factor (R.F. bulk) = (𝑠𝑎𝑚𝑝𝑙𝑒 (Rave)
𝑟𝑒𝑓𝑒𝑟𝑒𝑛𝑐𝑒 (Rave)) − 1 (2)
The data processing strategy also enables the spectra to be interpreted directly and provides more
insight into the reaction mechanism.
4.4 Results and discussion
4.4.1 Physicochemical characterization
The TEM micrographs and histogram of the particle size distribution (PSD) are presented in figure
4-1. It is possible to observe that both Pt and Pt75Ir25 nanoparticles (NP) are reasonably uniform,
especially considering the high loadings of platinum and platinum-iridium alloys, 40 and 60 wt%,

61
respectively. The size distribution observed in the histogram for Pt NP shows that most of the
nanoparticles have a size between 3 to 5 nm while for Pt75Ir25 the size of the nanoparticles is located
between 2 to 5 nm, which is an excellent narrow distribution with no significant agglomeration
observed despite the high loading and additional reduction step. The average nanoparticle size is
summarized in Table 4-2.
Figure 4-1: The TEM micrographs (left) and corresponding histograms (right) of Pt (a) and Pt75Ir25 (b)
X‐ray diffraction (XRD) pattern of the carbon supports ECS 1, and 2 (Appendix B, Fig. B-1a)
shows two major peaks at around 25° and 43°, which can be assigned, respectively, to the (002)
and (100) planes of graphite. To continue analyzing the ECS, we calculated the specific surface
area by the Branaur-Emmett-Teller (BET) model (Fig. B-2), the specific surface area of ECS 1
and ECS 2 are 870±25m2/g and 637±44m2/g respectively with an average pore size of 6.5 nm for
ECS-1 and 5.6 nm for ECS-2.
Figure 4-2 shows the X-Ray diffraction patterns of the Pt, Pt75Ir25 and Pt67Ru33 1,2 and 3 catalysts.
All the synthesized nanoparticles present the characteristic peaks of the nanostructured platinum,
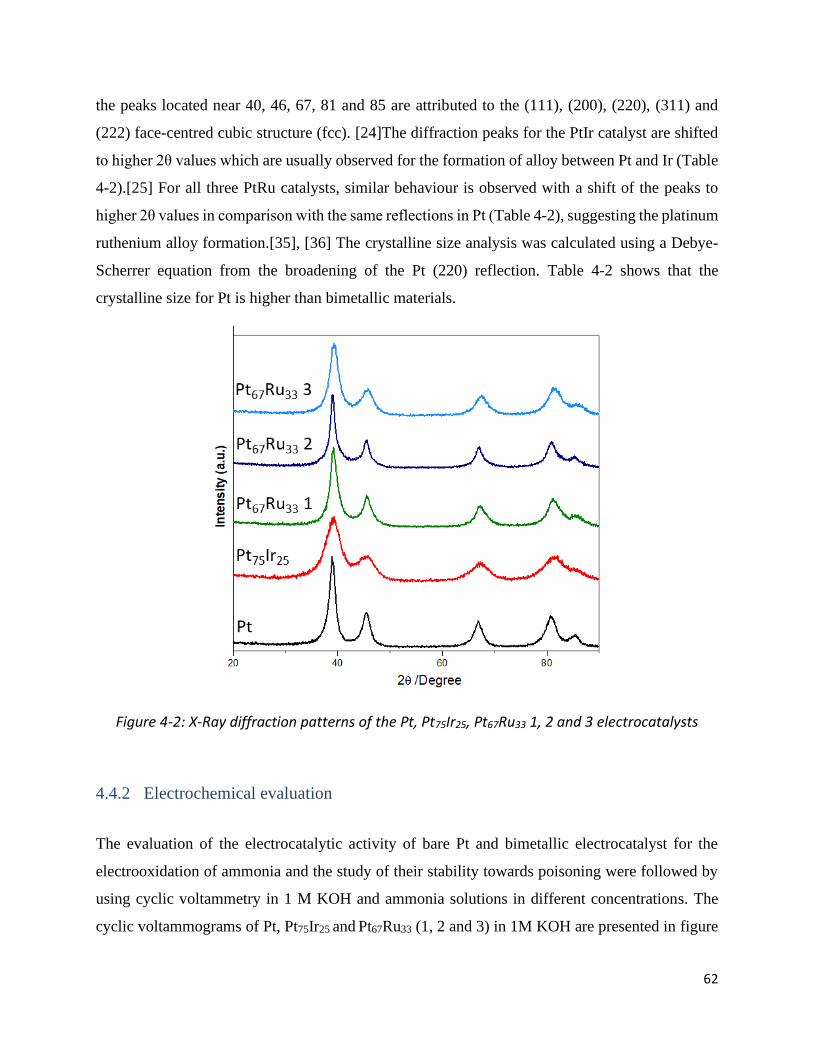
62
the peaks located near 40, 46, 67, 81 and 85 are attributed to the (111), (200), (220), (311) and
(222) face-centred cubic structure (fcc). [24]The diffraction peaks for the PtIr catalyst are shifted
to higher 2θ values which are usually observed for the formation of alloy between Pt and Ir (Table
4-2).[25] For all three PtRu catalysts, similar behaviour is observed with a shift of the peaks to
higher 2θ values in comparison with the same reflections in Pt (Table 4-2), suggesting the platinum
ruthenium alloy formation.[35], [36] The crystalline size analysis was calculated using a Debye-
Scherrer equation from the broadening of the Pt (220) reflection. Table 4-2 shows that the
crystalline size for Pt is higher than bimetallic materials.
Figure 4-2: X-Ray diffraction patterns of the Pt, Pt75Ir25, Pt67Ru33 1, 2 and 3 electrocatalysts
4.4.2 Electrochemical evaluation
The evaluation of the electrocatalytic activity of bare Pt and bimetallic electrocatalyst for the
electrooxidation of ammonia and the study of their stability towards poisoning were followed by
using cyclic voltammetry in 1 M KOH and ammonia solutions in different concentrations. The
cyclic voltammograms of Pt, Pt75Ir25 and Pt67Ru33 (1, 2 and 3) in 1M KOH are presented in figure

63
4-3. The electrochemical experiments were carried out in the potential range of -0.89 to 0 V at
20mV/s. The current density was normalized by the mass activity of platinum. It can be seen that
for Pt, well-defined peaks associated with hydrogen adsorption/desorption are observed in the
region from -0.45 to -0.7V. Peaks located between -0.2 and 0V in the anodic scan correspond to
platinum oxide formation (PtOx).[37] However, it is possible to observe a peak around -0.1V in
the cathodic scan for Pt caused by the reduction of PtOx.[38] In the case of Pt75Ir25, the hydrogen
adsorption/desorption peaks are shifted into the negative potential in comparison with Pt.
Furthermore, the peaks located at -0.1V and -0.25 are shifted into negative potentials and can be
attributed to the formation of Ir(OH)3 or IrOOH.[39] Additionally, for Pt67Ru33 (1, 2 and 3)
electrocatalysts the hydrogen adsorption/desorption peaks are observed about -0.7V, hydrogen
region appears structureless due to the high amount of Ru content, this kind of behaviour was
described before by Wang et al. where they reported that for PtRu catalysts, the Ru weakened.
the Pt–hydrogen adsorption interaction, as an effect of the suppressed surface reactivity of Pt.[40]
It also was observed that the hydrogen evolution reaction (HER) takes place at about -0.89V for
all catalysts. The electrochemical surface area (ECSA) in the present study was calculated from
the CO stripping experiments (figure B-2). The estimated ECSA values for the electrocatalysts are
presented in Table 4-2. The ECSA for the bimetallic catalysts is similar to monometallic Pt (except
a b
Figure 4-3: Cyclic voltammograms for a) Pt and Pt75Ir25, and b) Pt67Ru33 1, 2 and 3 electrocatalysts in 1 M KOH at 20 mVs-1
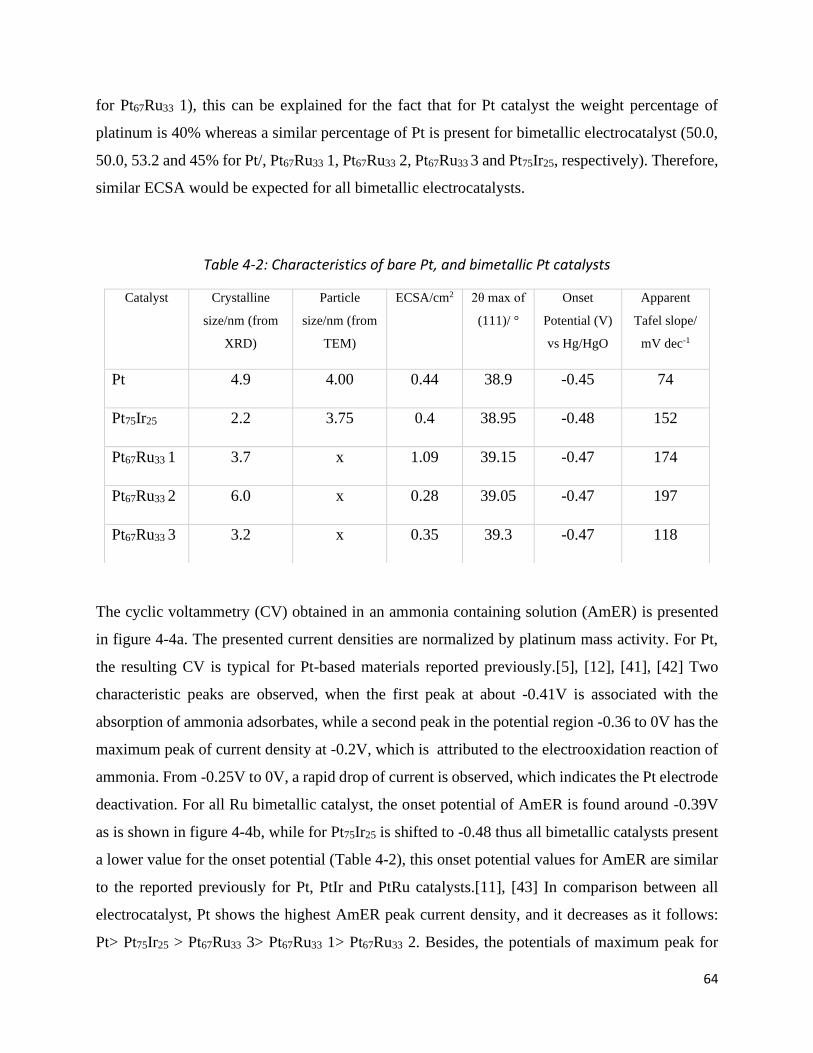
64
for Pt67Ru33 1), this can be explained for the fact that for Pt catalyst the weight percentage of
platinum is 40% whereas a similar percentage of Pt is present for bimetallic electrocatalyst (50.0,
50.0, 53.2 and 45% for Pt/, Pt67Ru33 1, Pt67Ru33 2, Pt67Ru33 3 and Pt75Ir25, respectively). Therefore,
similar ECSA would be expected for all bimetallic electrocatalysts.
Table 4-2: Characteristics of bare Pt, and bimetallic Pt catalysts
The cyclic voltammetry (CV) obtained in an ammonia containing solution (AmER) is presented
in figure 4-4a. The presented current densities are normalized by platinum mass activity. For Pt,
the resulting CV is typical for Pt-based materials reported previously.[5], [12], [41], [42] Two
characteristic peaks are observed, when the first peak at about -0.41V is associated with the
absorption of ammonia adsorbates, while a second peak in the potential region -0.36 to 0V has the
maximum peak of current density at -0.2V, which is attributed to the electrooxidation reaction of
ammonia. From -0.25V to 0V, a rapid drop of current is observed, which indicates the Pt electrode
deactivation. For all Ru bimetallic catalyst, the onset potential of AmER is found around -0.39V
as is shown in figure 4-4b, while for Pt75Ir25 is shifted to -0.48 thus all bimetallic catalysts present
a lower value for the onset potential (Table 4-2), this onset potential values for AmER are similar
to the reported previously for Pt, PtIr and PtRu catalysts.[11], [43] In comparison between all
electrocatalyst, Pt shows the highest AmER peak current density, and it decreases as it follows:
Pt> Pt75Ir25 > Pt67Ru33 3> Pt67Ru33 1> Pt67Ru33 2. Besides, the potentials of maximum peak for
Catalyst Crystalline
size/nm (from
XRD)
Particle
size/nm (from
TEM)
ECSA/cm2 2θ max of
(111)/ °
Onset
Potential (V)
vs Hg/HgO
Apparent
Tafel slope/
mV dec-1
Pt 4.9 4.00 0.44 38.9 -0.45 74
Pt75Ir25 2.2 3.75 0.4 38.95 -0.48 152
Pt67Ru33 1 3.7 x 1.09 39.15 -0.47 174
Pt67Ru33 2 6.0 x 0.28 39.05 -0.47 197
Pt67Ru33 3 3.2 x 0.35 39.3 -0.47 118

65
ammonia oxidation are -0.19, -0.20, -0.22, -0.22 and -0.19V for Pt, Pt75Ir25, Pt67Ru33 1, Pt67Ru33 2
and Pt67Ru33 3 respectively indicating that bimetallic electrocatalysts are more active at lower
overpotentials. For Pt75Ir25, although oxidation current density is not as high as one observed for
platinum at higher overpotentials, the onset potential for ammonia oxidation is located at much
lower potentials (Fig. 4-4b) in comparison to monometallic Pt, as well as having a higher current
at lower potentials, which may be explained by the fact that Ir needs less positive potentials to
dehydrogenate ammonia.[44] This catalytic behaviour is in agreement with previous reports for
PtIr electrocatalyst, where the addition of Ir reduced the overpotential for AmER in comparison
with a monometallic platinum catalyst.[11], [21], [39] The lower activity for ammonia
electrooxidation reaction for Pt67Ru33 (1 and 2) electrocatalysts is in good agreement with previous
reports in the literature where the atomic composition of Ru higher than 20% for PtRu
electrocatalyst can decrease the activity for the peak current density for ammonia electro-oxidation
reaction.
Figure 4-4: a) Cyclic voltammograms Pt, Pt75Ir25, Pt67Ru33 1, 2 and 3 electrocatalysts in 1 M KOH + 0.5 M NH4OH. Scan rate of 20 mV s-1 and b) onset potential for ammonia electrooxidation of
Pt, Pt75Ir25, Pt67Ru33 1, 2 and 3 electrocatalysts.
We also studied the catalytic behaviour of Pt, Pt75Ir25, Pt67Ru33 3 in different ammonia
concentrations (0.1M, 0.2M, 0.5M and 1M) by cyclic voltammetry, as is shown in figure 4-5. For
a b

66
Pt, the oxidation peak increases with the increase of ammonia concentration up to [NH4OH] =
0.5M, and then a decrease towards AmER was observed at the highest ammonia concentration of
1M, indicating saturation of catalysts surface by ammonia and possibly caused for the most
common nitrogen-derived adsorbate -Nads. A different behaviour was observed for Pt75Ir25 and
Pt67Ru33 3; the higher oxidation current density peak was found at higher concentrations of
ammonia; however, this behaviour is more pronounced for Pt75Ir25 electrocatalyst (Fig. 4-5). The
following result indicates an increase of the surface tolerance towards the poisoning by Nads for
Pt75Ir25 in comparison with pure Pt electrocatalyst. As it has been reported previously, the addition
of Ir can promote the reduction of surface poisoning as a result of Ir helps Pt to desorb poisonous
Nads of its surface when they alloyed. This considerable improvement in the behaviour of Pt75Ir25
electrocatalysts at higher concentrations, the stability and the obtained higher current at lower
overpotentials is important for fuel cell performance.
Figure 4-5: Maximum peak current density of ammonia oxidation vs. ammonia concentration for Pt, Pt75Ir25, and Pt67Ru33 3
Figure 4-6 shows the linear sweep voltammetry for all Pt electrocatalysts. The potential region
from -0.38 to -0.3 V, where the electrooxidation of ammonia takes place previously to the
deactivation by Nads, was used to calculate the apparent Tafel slope. The obtained results are listed
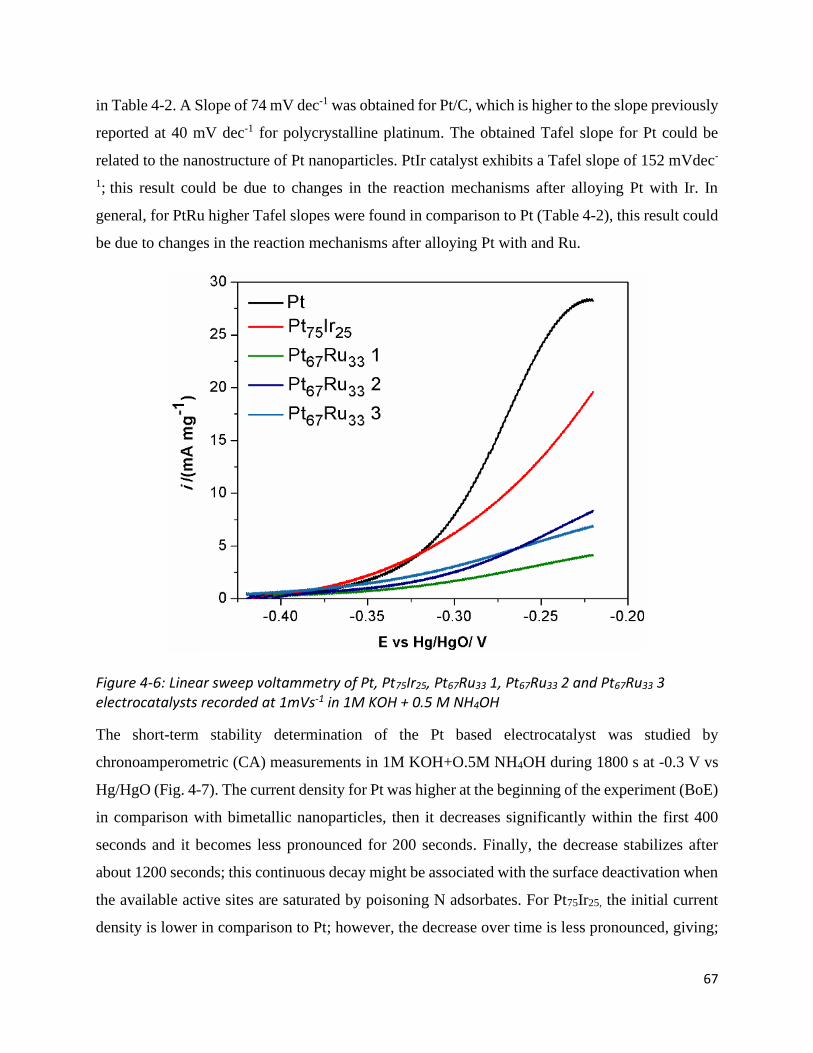
67
in Table 4-2. A Slope of 74 mV dec-1 was obtained for Pt/C, which is higher to the slope previously
reported at 40 mV dec-1 for polycrystalline platinum. The obtained Tafel slope for Pt could be
related to the nanostructure of Pt nanoparticles. PtIr catalyst exhibits a Tafel slope of 152 mVdec-
1; this result could be due to changes in the reaction mechanisms after alloying Pt with Ir. In
general, for PtRu higher Tafel slopes were found in comparison to Pt (Table 4-2), this result could
be due to changes in the reaction mechanisms after alloying Pt with and Ru.
Figure 4-6: Linear sweep voltammetry of Pt, Pt75Ir25, Pt67Ru33 1, Pt67Ru33 2 and Pt67Ru33 3 electrocatalysts recorded at 1mVs-1 in 1M KOH + 0.5 M NH4OH
The short-term stability determination of the Pt based electrocatalyst was studied by
chronoamperometric (CA) measurements in 1M KOH+O.5M NH4OH during 1800 s at -0.3 V vs
Hg/HgO (Fig. 4-7). The current density for Pt was higher at the beginning of the experiment (BoE)
in comparison with bimetallic nanoparticles, then it decreases significantly within the first 400
seconds and it becomes less pronounced for 200 seconds. Finally, the decrease stabilizes after
about 1200 seconds; this continuous decay might be associated with the surface deactivation when
the available active sites are saturated by poisoning N adsorbates. For Pt75Ir25, the initial current
density is lower in comparison to Pt; however, the decrease over time is less pronounced, giving;

68
as a result, a higher current density when it stabilizes after 1000 seconds. After 1000s of CA
measurements, the current density of Pt75Ir25 decays to 1.7 mA/mg followed by 1.25 mA/mg for
Pt, 0.85 mA/mg for Pt67Ru33 2, 0.77 mA/mg for Pt67Ru33 3 and 0.25 mA/mg for Pt67Ru33 1. This
result is in accordance with the obtained CVs in ammonia solution and for Pt75Ir25 electrocatalysts,
proving that the addition of 25% of Ir improved the Pt electrocatalytic activity and enhanced
stability due to the synergetic interaction between two metals.[5], [17] The electrocatalytic
evaluation of the synthesized PtM nanoparticles indicates that the most active and stable catalyst
for AmER is Pt75Ir25, followed by Pt and then Pt67Ru33 3. For Pt67Ru33 1 and 2, the activity and
stability towards AmER was found to be similar and lower in comparison with Pt67Ru33 3, and the
latest could be explained by the fact that the addition of higher amounts of Ru (higher than 20%
in weight) can decrease the activity of the catalyst for the ammonia electro-oxidation reaction.
Figure 4-7: Chronoamperometric measurements at -0.25 V vs Hg/HgO for Pt, Pt75Ir25, Pt67Ru33 1, Pt67Ru33 2 and Pt67Ru33 3 electrocatalysts in 1 M KOH+ 0.5M NH4OH.
It is worth to mention that the structure and the porosity of carbon support have been noted to
affect the performance and catalytic activity of the nano-structured catalysts by the improvement
of their dispersion and contact modification between catalyst and electrolyte.[45]–[47] Figure 4-8
demonstrates a comparison between Pt/C ECS and Pt/C with relatively the same size. The
significantly higher current density related to Pt on ECS in comparison to untreated carbon proves

69
the importance of support structure on the catalytic activity of Pt toward ammonia
electrooxidation.
Figure 4-8: Cyclic voltammetry for (black) Pt/C and (red) Pt/C Engineered Carbon Support (ECS) in 0.5M NH4OH + 1M KOH at 20 mVs-1
4.4.3 Determination of oxidation species on PtRu and PtIr using PM-IRRAS
PM-IRRAS spectra for ammonia electrooxidation on the surface of synthesized catalysts
submerged in 1 M KOH and 1 M KOH+ 0.5 M NH4OH electrolytes have been collected. In order
to distinguish oxidation products by varying potential for ammonia electrooxidation,
Chronoamperometry measurements were combined with in-situ infrared spectroscopy. In the
oxidation region based on cyclic voltammetry measurements, at -0.45V, -0.43V, -0.4V, -0.35V, -
0.3V, -0.25V concerning Hg/HgO reference electrode, the spectra were collected after 5 minutes
of applying each potential. Reference spectrum at -0.5V, while no oxidation and reduction
reactions would occur according to the CV, in 1 M KOH+ 0.5M NH4OH was recorded. This
approach enables us to differentiate between the oxidation species on the surface of the catalyst
and in the bulk of the electrolyte Since noticeable changes can be found in the PM-IRRAS surface
spectrum compared with the bulk for all five catalysts (Fig. 4-9). The other processed data by using

70
the reference spectrum at -0.4 V in 1 M KOH are available in figure B-3 to B-7 in appendix B for
further consideration
Figure 4-9:PM-IRRAS spectra in the bulk of electrolyte (left) and on the surface of catalyst (right) on a) Pt, b) Pt75Ir25, c)Pt67Ru33 1, d) Pt67Ru33 2 and e) Pt67Ru33 3 electrocatalysts in 1 M KOH + 0.5 M NH4OH for ammonia electrooxidation
e
d
c
b
a
71
In figure 4-9 a for Pt, A well-defined peak was noted at 3000-2700 cm-1, corresponding to the N-
H species and its strength continually rises with an enhancement in potential. The almost similar
behaviour has been observed for the other catalysts. At around 2008 cm-1, the positive peak for
bulk and also surface spectra corresponds to azide anion, which links well with surface-enhanced
Raman spectroscopic research in the literature where azide anion has been detected during
ammonia electro-oxidation.[48]–[50] According to the reaction mechanism, the interaction
between hydrazine (N2H4) and ammonia molecule causes an azide ion to form. Positive peaks at
1560 cm−1 and 1300 cm-1conform to the asymmetric and symmetric N-O bonds generated during
the reaction from the nitro compounds, respectively.[51]–[53] The strength of the peak at 1560
cm−1 improved gradually from -0.4 V, indicating the onset potential for ammonia oxidation on the
Pt surface (Fig.4-9 a). It has been reported that N2 and NO were formed at potential around -0.15
V vs Hg/HgO on the surface of Pt-black obtained by a differential electrochemical mass
spectroscopy method(DEMS). [52] Then Vidal-Iglesias et al. verified the formation of these
compounds on the platinum crystalline plane which the absorbed NO is the source of nitrogen
oxides’ formation.[54] It has also been noted that NO2, which created electrochemically, will
interact quickly to generate nitrite and nitrate ions in an alkaline electrolyte.[52], [54] There can
be seen that the N-H species, as well as the azide and nitro compounds generated on the surface,
rapidly dissipated into the bulk of the solution, as shown in figure 4-9 a, can be recognized by the
strength of their respective peaks for Pt. Considering Pt and PtIr as shown in figure 4-9 a and b,
in-situ infrared spectroscopy similar to the CV findings showed that the onset potential for the
oxidation reaction occurred at lower potential for bimetallic. We were able to see that at which
potential the reaction starts occurring by following which products are being produced. For
example, the peak related to the N-H bond starts being produced at -0.45 V for PtIr which was
clearly started at around -0.35V for pt.
In figure 4-9 b for PtIr, the lowest onset potential was observed compared to the other catalysts
since there is positive interaction between electronic fields of Pt-Ir [16], [55], [56], however, due
to high tendency of Ir to adsorb the Nads, it would be deactivated by increasing the potential toward
oxidation region which is observable by decreasing the intensity of PM-IRRAS peaks.[57]

72
For PtRu with higher metal loading, 80% (Fig 4-9 e), an extra feature was identified on the surface
at 3600 cm-1corresponding to OH- ions. Those peaks are only noticeable on the surface spectra,
and the strength of the peaks rises with the increase in the potentials. It seems it was occurred due
to the high tendency of Ru toward oxygenated species leading to the formation of water on the
surface, which triggers a high pseudo-capacitance behaviour.[58], [59]
4.5 Conclusions
In the present work, the electrocatalytic activity of Pt, PtIr and PtRu was investigated. The catalysts
were characterized by using XRD and TEM. We demonstrated that the addition of Ir and Ru to Pt
electrocatalyst improved the stability of the nanoparticles in high concentration of ammonia
solution and the catalytic activity of the nanoparticles towards the ammonia electrooxidation
observing an excellent tolerance for Pt75Ir25 to the nitrogen-adsorbates poisoning as it was shown
in chronoamperometric experiments and cyclic voltammetry in different concentrations of
ammonia. It should be emphasized that the Ir addition allows for shifting the onset potential for
ammonia electrooxidation to more negative potential, which was also confirmed by in-situ infrared
spectroscopy. This point is a crucial factor for designing the new generation of highly active and
stable Direct Ammonia Fuel Cells. The Pt catalyst dispersed on engineered carbon support in
comparison to the non-modified carbon showed much better activity.
4.6 References
[1] J. Jiang, “Promotion of PtIr and Pt catalytic activity towards ammonia electrooxidation through the modification of Zn,” Electrochem. Commun. 75, 52-55, Feb. 2017.
[2] G. G. Vitse, F., Cooper, M., Botte, “On the use of ammonia electrolysis for hydrogen production,” J. Power Sources, 142, 18-26, 2005.
[3] E. J. C. and D. J. S. E. L Simons, “The Performance of Direct Ammonia Fuel Cells,” J. Electrochem. Soc. 556-561, 1969.
[4] A. D. Cairns, E. J.; Simons, E. L.; Tevebaugh, “Ammonia-Oxygen Fuel Cell,” nature, 217, 780-781, 1968.
[5] T. L. Lomocso and E. A. Baranova, “Electrochimica Acta Electrochemical oxidation of ammonia on carbon-supported bi-metallic PtM ( M = Ir, Pd, SnO x ) nanoparticles,” Electrochim. Acta, 56,

73
8551-8558, 2011.
[6] V. A. Ribeiro, I. C. de Freitas, A. O. Neto, E. V. Spinacé, and J. C. M. Silva, “Platinum nanoparticles supported on nitrogen-doped carbon for ammonia electro-oxidation,” Mater. Chem. Physics, 200, 354-360, Oct. 2017.
[7] N. M. Adli, H. Zhang, S. Mukherjee, and G. Wu, “Review—Ammonia Oxidation Electrocatalysis for Hydrogen Generation and Fuel Cells,” J. Electrochem. Soc. 165, 3130-3147, 2018.
[8] M. H. M. T. Assumpção et al., “Investigation of PdIr/C electrocatalysts as an anode on the performance of direct ammonia fuel cell,” J. Power Sources, 268, 129-136, Dec. 2014.
[9] J. Gwak, M. Choun, and J. Lee, “Alkaline Ammonia Electrolysis on Electrodeposited Platinum for Controllable Hydrogen Production,” ChemSusChem, 9, 403-408, Feb. 2016.
[10] R. Martínez-rodríguez, F. J. Vidal-Iglesias, J. Sollá-gullón, and M. Juan, “Synthesis of Pt nanoparticles in water-in-oil microemulsion : on the effect of HCl on their surface structure,” J. Am. Chem. Soc., 136, 1280−1283, 2014.
[11] S. Le Vot, L. Roué, and D. Bélanger, “Synthesis of Pt–Ir catalysts by electrodeposition: Application to ammonia electrooxidation in alkaline media,” J. Power Sources, 223, 221-231, Feb. 2013.
[12] W. B. H. and Y. F. C. C. Zhong, “Recent advances in electrocatalysts for electro-oxidation of ammonia,” J. Mater. Chem. A,1, 3216-3238, 2013.
[13] J. A. R. Vooys, de, A. C. A., Koper, M. T. M., Santen, van, R. A., & Veen, van, “The role of adsorbates in the electrochemical oxidation of ammonia on noble and transition metal electrodes,” J. Electroanal. Chem. 506, 127-137., 2001.
[14] S. Ntais et al., “Promotion of Ammonia Electrooxidation on cePt nanoparticles by Nickel Oxide Support,” Electrochim. Acta, 222, 1455-1463, 2016.
[15] Z.-F. Li, Y. Wang, and G. G. Botte, “Revisiting the electrochemical oxidation of ammonia on carbon-supported metal nanoparticle catalysts,” Electrochim. Acta, 228, 351-360, Feb. 2017.
[16] F. J. Vidal-Iglesias, J. Solla-Gullón, V. Montiel, J. M. Feliu, and A. Aldaz, “Screening of electrocatalysts for direct ammonia fuel cell: Ammonia oxidation on PtMe (Me: Ir, Rh, Pd, Ru) and preferentially oriented Pt(1 0 0) nanoparticles,” J. Power Sources, 171, 448-456, Sep. 2007.
[17] K. Endo, K. Nakamura, Y. Katayama, and T. Miura, “Pt-Me (Me = Ir, Ru, Ni) binary alloys as an ammonia oxidation anode,” Electrochim. Acta, 49, 2503-2509, Jun. 2004.
[18] J.-Y. Ye et al., “Ammonia electrooxidation on dendritic Pt nanostructures in alkaline solutions investigated by in-situ FTIR spectroscopy and online electrochemical mass spectroscopy,” J. Electroanal. Chem. 819, 495-501, Jun. 2018.
[19] J. C. M. Silva et al., “PtAu/C electrocatalysts as anodes for direct ammonia fuel cell,” Appl. Catal. A Gen. 490, 133-138, Jan. 2015.
[20] M. H. M. T. Assumpção et al., “Oxidation of ammonia using PtRh/C electrocatalysts: Fuel cell and electrochemical evaluation,” Appl. Catal. B Environ. 174, 136-144, Sep. 2015.
[21] Y. Zhou et al., “High Mass and Specific Activity for Ammonia Electro-oxidation through Optimization of Dispersion Degree and Particle Size of Pt-Ir Nanoparticles over N-Doped
74
Reductive Graphene Oxide,” Chem. 3, 3433-3443, Mar. 2018.
[22] B. K. Boggs and G. G. Botte, “Optimization of Pt–Ir on carbon fibre paper for the electro-oxidation of ammonia in alkaline media,” Electrochim. Acta, 55, 5287-5293, Jul. 2010.
[23] K. A. and S. Pons, “Infrared Spectroelectrochemistry,” Chem. Rev 88, 673–695., 1988.
[24] J. Zamlynny, V.; Lipkowski, “In Advances in Electrochemical Science and Engineering: Diffraction and Spectroscopic Methods in Electrochemistry,” 2006, p. 315−376.
[25] E. A. Monyoncho, S. Ntais, N. Brazeau, and J. Wu, “Role of the Metal-Oxide Support in the Catalytic Activity of Pd Nanoparticles for Ethanol Electrooxidation in Alkaline Media,” vol. 333, pp. 218–227, 2016.
[26] E. A. Monyoncho, V. Zamlynny, T. K. Woo, and E. A. Baranova, “The utility of polarization modulation infrared reflection absorption spectroscopy (PM-IRRAS) in surface and in situ studies: new data processing and presentation approach,” pp. 2563–2573, 2018.
[27] W. G. Golden, D. S. Dunn, and J. Overend, “A method for measuring infrared reflection—Absorption spectra of molecules adsorbed on low-area surfaces at monolayer and submonolayer concentrations,” J. Catal., vol. 71, no. 2, pp. 395–404, Oct. 1981.
[28] K. K. and H. S. W. G. Golden, “Application of Polarization-Modulated Fourier Transform Infrared Reflection-Absorption Spectroscopy to the Study of Carbon Monoxide Adsorption and Oxidation on a Smooth Platinum Electrode,” J. of Physical Chem. Vol. 88, No. 7, 1984.
[29] and J. M. T. T. BUFFETEAU, B. DESBAT, “Polarization Modulation FT-IR Spectroscopy of Surfaces and Ultra-thin Films: Experimental Procedure and Quantitative Analysis,” Appl. Spectrosc. Vol. 45, Number 3, 1991.
[30] K. W. H. and G. A. Crosby, “Applications of the Photoelastic Modulator to Polarization Spectroscopy,” J. Phys. Chem., 1979.
[31] A. Serov et al., “Highly stable precious metal-free cathode catalyst for a fuel cell application,” J. Power Sources, vol. 327, pp. 557–564, Sep. 2016.
[32] F. Maillard, M. Eikerling, O. V Cherstiouk, S. Schreier, E. Savinova, and U. Stimming, “Size effects on reactivity of Pt nanoparticles in CO monolayer oxidation: The role of surface mobility,” Faraday Discuss., vol. 125, no. 0, pp. 357–377, 2004.
[33] M. Sevim Yılmaz, B. Y. Kaplan, Ö. Metin, and S. A. Gürsel, “A facile synthesis and assembly of ultrasmall Pt nanoparticles on reduced graphene oxide‑carbon black hybrid for enhanced performance in PEMFC,” Mater. Des., vol. 151, pp. 29–36, Aug. 2018.
[34] E. Moran, E.; Cattaneo, C.; Mishima, H.; López de Mishima, B. A.; Silvetti, S. P.; Rodriguez, J. L.; Pastor, “Ammonia oxidation on electrodeposited Pt–Ir alloys,” J. SOLID STATE Electrochem. Vol. 12, Number 5, 2008.
[35] J. C. M. Silva et al., “Evaluation of carbon-supported platinum–ruthenium nanoparticles for ammonia electro-oxidation: Combined fuel cell and electrochemical approach,” Int. J. Hydrogen Energy, vol. 42, no. 1, pp. 193–201, Jan. 2017.
[36] E. A. Baranova, Y. Le Page, D. Ilin, C. Bock, B. MacDougall, and P. H. J. Mercier, “Size and composition for 1–5 nm Ø PtRu alloy nano-particles from Cu Kα X-ray patterns,” J. Alloys Compd.,
75
vol. 471, no. 1–2, pp. 387–394, Mar. 2009.
[37] L. Jiang, A. Hsu, D. Chu, and R. Chen, “Ethanol electro-oxidation on Pt/C and PtSn/C catalysts in alkaline and acid solutions,” Int. J. Hydrog. Energy, 35, 1, 365-372, Jan. 2010.
[38] L. Ma, D. Chu, and R. Chen, “Comparison of ethanol electro-oxidation on Pt/C and Pd/C catalysts in alkaline media,” Int. J. Hydrogen Energy, vol. 37, no. 15, pp. 11185–11194, Aug. 2012.
[39] A. Allagui, M. Oudah, X. Tuaev, S. Ntais, F. Almomani, and E. A. Baranova, “Ammonia electro-oxidation on alloyed PtIr nanoparticles of well-defined size,” Int. J. Hydrogen Energy, vol. 38, no. 5, pp. 2455–2463, Feb. 2013.
[40] J. L. and L. Z. Ying Wang, Gongwei Wang, Guangwei Li, Bing Huang, Jing Pan *, Qiong Liu, Juanjuan Han, Li Xiao, “Pt–Ru catalyzed hydrogen oxidation in alkaline media: oxophilic effect or electronic effect?,” Energy Environ. Sci., 2015.
[41] Daniel G. Nicolas SacréMatteo DucaSébastien GarbarinoRégis ImbeaultAndrew WangAzza Hadj YoussefJules GalipaudGregor HufnagelAndreas RuedigerLionel Roué, “Tuning Pt–Ir Interactions for NH3 Electrocatalysis,” Am. Chem. Soc., 2018.
[42] H. K. W. S. N. Kim, “Facile Preparation of Hollow Pt- and PtIr-Nanostructures with Spiky Surface for the Electro-Oxidation of Ammonia,” Catal. Letters, 2014.
[43] L. C. V. R. V. I. R. Cabrera, “Graphene-Supported Pt, Ir, and Pt-Ir Nanoparticles as Electrocatalysts for the Oxidation of Ammonia,” electrocatalysis, 2013.
[44] S. Morita et al., “Electrochemical oxidation of ammonia by multi-wall-carbon-nanotube-supported Pt shell–Ir core nanoparticles synthesized by an improved Cu short circuit deposition method,” J. Electroanal. Chem., vol. 762, pp. 29–36, Feb. 2016.
[45] P. Srinivasu, “Highly dispersed platinum nanoparticles on mesoporous materials,” Pure Appl. Chem., Vol. 82, No. 11, pp. 2111–2120, 2010.
[46] S. Song et al., “Effect of pore morphology of mesoporous carbons on the electrocatalytic activity of Pt nanoparticles for fuel cell reactions,” Appl. Catal. B Environ., vol. 98, no. 3–4, pp. 132–137, Aug. 2010.
[47] S. Song, S. Yin, Z. Li, P. K. Shen, R. Fu, and D. Wu, “Effect of pore diameter of wormhole like mesoporous carbon supports on the activity of Pt nanoparticles towards hydrogen electrooxidation,” J. Power Sources, vol. 195, no. 7, pp. 1946–1949, Apr. 2010.
[48] F. J. Vidal-Iglesias, J. Solla-Gullón, J. M. Pérez, and A. Aldaz, “Evidence by SERS of azide anion participation in ammonia electrooxidation in alkaline medium on nanostructured Pt electrodes,” Electrochem. commun., vol. 8, no. 1, pp. 102–106, Jan. 2006.
[49] R. E. Kunz, J. G. Gordon, M. R. Philpott, and A. Girlando, “Surface-enhanced Raman spectra from silver electrodes in azide solution,” J. Electroanal. Chem. Interfacial Electrochem., vol. 112, no. 2, pp. 391–395, Sep. 1980.
[50] T. M. Klapötke, H. Nöth, T. Schütt, and M. Suter, “Mixed chloride/azide complexes of arsenic and antimony,” Eur. J. Inorg. Chem., no. 9, pp. 2511–2517, 2002.
[51] K. N. K. S. Y. Y. Osawa, “Surface-Enhanced Infrared Absorption Spectroscopic Studies of Adsorbed Nitrate, Nitric Oxide, and Related Compounds 2: Nitrate Ion Adsorption at a Platinum Electrode,”
76
Langmuir,248,4358-4363, 2008.
[52] S. Wasmus, E. J. Vasini, M. Krausa, H. T. Mishima, and W. Vielstich, “DEMS-cyclic voltammetry investigation of the electrochemistry of nitrogen compounds in 0.5 M potassium hydroxide,” Electrochim. Acta, vol. 39, no. 1, pp. 23–31, Jan. 1994.
[53] F. Rahman Rima, K. Nakata, K. Shimazu, and M. Osawa, “Surface-Enhanced Infrared Absorption Spectroscopic Studies of Adsorbed Nitrate, Nitric Oxide, and Related Compounds. 3. Formation and Reduction of Adsorbed Nitrite at a Platinum Electrode,” J. Phys. Chem. C, vol. 114, no. 13, pp. 6011–6018, Mar. 2010.
[54] F. J. Vidal-Iglesias, J. Solla-Gullón, J. M. Feliu, H. Baltruschat, and A. Aldaz, “DEMS study of ammonia oxidation on platinum basal planes,” J. Electroanal. Chem., vol. 588, no. 2, pp. 331–338, Mar. 2006.
[55] T. Endo, K., Nakamura, K., Katayama, Y., & Miura, “Pt-Me (Me = Ir, Ru, Ni) binary alloys as an ammonia oxidation anode.,” Electrochim. Acta, 49(15), 2503-2509, 2004.
[56] C. H. Cheng Zhong, Jie Liu, Zhengyang NiYida, Deng Bin, “Shape-controlled synthesis of Pt-Ir nanocubes with preferential (100) orientation and their unusual enhanced electrocatalytic activities,” Sci. China Mater. , 57, 13–25, 2014.
[57] J. A. Herron, P. Ferrin, and M. Mavrikakis, “Electrocatalytic Oxidation of Ammonia on Transition-Metal Surfaces: A First-Principles Study,” J. Phys. Chem. C, vol. 119, no. 26, pp. 14692–14701, Feb. 2015.
[58] H. Han, K., Lee, J. & Kim, “Preparation and characterization of high metal content Pt–Ru alloy catalysts on various carbon blacks for DMFCs,” Electrochim. Acta. 52, 4, 1697-1702, 2006.
[59] Q. Zhang, Z. Yang, Y. Ling, X. Yu, Y. Zhang, and H. Cheng, “Improvement in stability of PtRu electrocatalyst by carbonization of in-situ polymerized polyaniline,” Int. J. Hydrogen Energy, vol. 43, no. 28, pp. 12730–12738, Jul. 2018.

77
Chapter 5: General Conclusions and future works
Renewable energy resources can be considered as an ultimate solution for lowering CO2 emissions
and pollution restriction. Among all potential resources, hydrogen is the most abundant energy
vector, though the main issues with hydrogen are storage and transport due to flammability and
the formation of explosive mixtures. To address these complications, ammonia as a suitable energy
carrier was introduced. It is favourable to utilize ammonia directly as fuel as it improves efficiency
by excluding challenges involved with hydrogen transportation and storage.
Electrooxidation of ammonia is highly important in terms of power generation, as it is prevalent
in several areas like direct ammonia fuel cells and wastewater treatment. The
predominant problems in ammonia electrooxidation are attributed to the sluggish kinetic rates of
the reaction. Developing high-performance electrocatalysts for ammonia electro-oxidation is vital
to tackle these challenges. A suitable catalyst should satisfy a few preconditions, including
improved activity and stability. This research aims to explore Pt-based nanostructured catalysts
for ammonia oxidation in alkaline media in order to obtain effective and stable electrocatalyst.
In the first section of this work, the particular goal was the investigation of the size effect of Pt
nanoparticles on the catalytic activity of catalyst toward ammonia electrooxidation. PM-IRRAS was
combined with electrochemical measurements to identify the impact of size on the catalytic
performance of carbon-supported Pt nanoparticles using 20wt% loading of metal. Pt particle size
at 1.3 nm provided relatively better activity although, 2.2 nm demonstrated better stability with
reasonable performance. In-situ PM-IRRAS revealed that this would be due to OH- formation by
applying the oxidation potential for a longer time. Besides, the onset potential was discovered to
be more negative for the smallest mean particle size as a desirable factor for an electrocatalyst in
a fuel cell.
The oxidation species was identified by implementing specific potentials within the oxidation
region using in-situ PM-IRRAS. N-H species were noted, as were azide ions and nitro-compounds.
In the second section, the catalytic activity of Pt, PtIr and PtRu on engineered carbon support was
examined. X-ray diffraction (XRD) patterns indicated Pt's typical face-centred cubic structure and
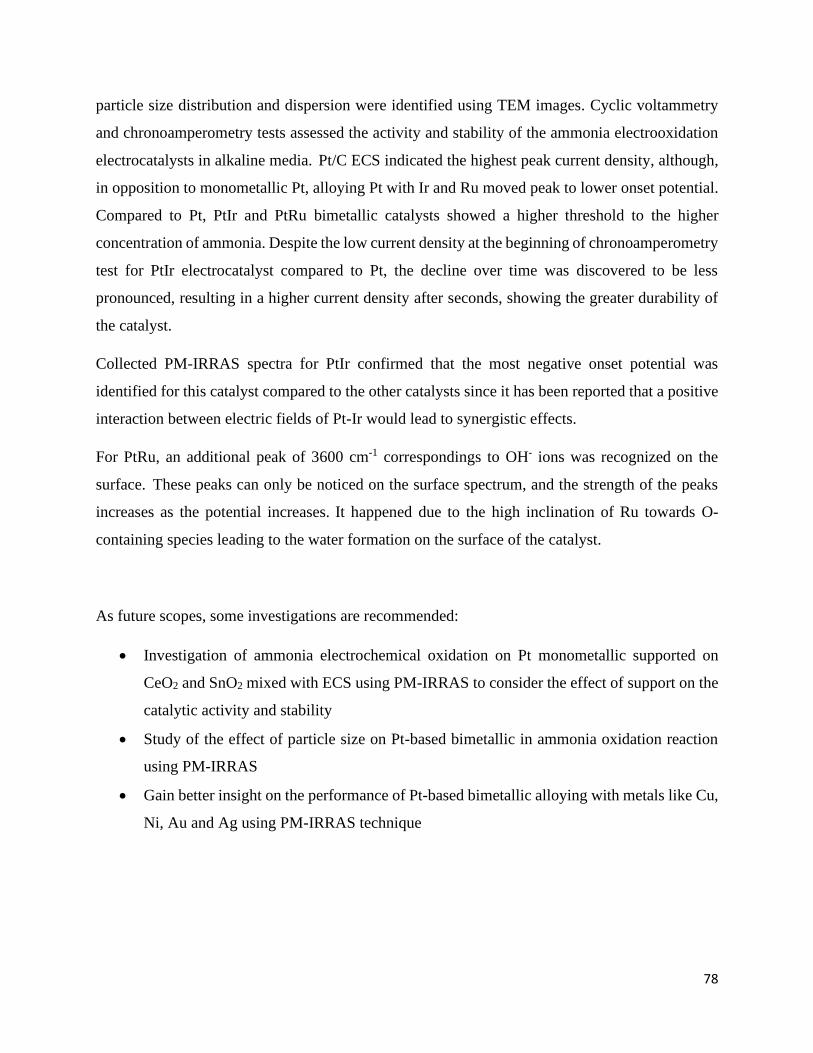
78
particle size distribution and dispersion were identified using TEM images. Cyclic voltammetry
and chronoamperometry tests assessed the activity and stability of the ammonia electrooxidation
electrocatalysts in alkaline media. Pt/C ECS indicated the highest peak current density, although,
in opposition to monometallic Pt, alloying Pt with Ir and Ru moved peak to lower onset potential.
Compared to Pt, PtIr and PtRu bimetallic catalysts showed a higher threshold to the higher
concentration of ammonia. Despite the low current density at the beginning of chronoamperometry
test for PtIr electrocatalyst compared to Pt, the decline over time was discovered to be less
pronounced, resulting in a higher current density after seconds, showing the greater durability of
the catalyst.
Collected PM-IRRAS spectra for PtIr confirmed that the most negative onset potential was
identified for this catalyst compared to the other catalysts since it has been reported that a positive
interaction between electric fields of Pt-Ir would lead to synergistic effects.
For PtRu, an additional peak of 3600 cm-1 correspondings to OH- ions was recognized on the
surface. These peaks can only be noticed on the surface spectrum, and the strength of the peaks
increases as the potential increases. It happened due to the high inclination of Ru towards O-
containing species leading to the water formation on the surface of the catalyst.
As future scopes, some investigations are recommended:
• Investigation of ammonia electrochemical oxidation on Pt monometallic supported on
CeO2 and SnO2 mixed with ECS using PM-IRRAS to consider the effect of support on the
catalytic activity and stability
• Study of the effect of particle size on Pt-based bimetallic in ammonia oxidation reaction
using PM-IRRAS
• Gain better insight on the performance of Pt-based bimetallic alloying with metals like Cu,
Ni, Au and Ag using PM-IRRAS technique

79
In fact, the PM-IRRAS technique helps to demonstrate the precise function of poisoning
intermediates leading to a slower ammonia oxidation rate in order
to select suitable potential and electrocatalyst.
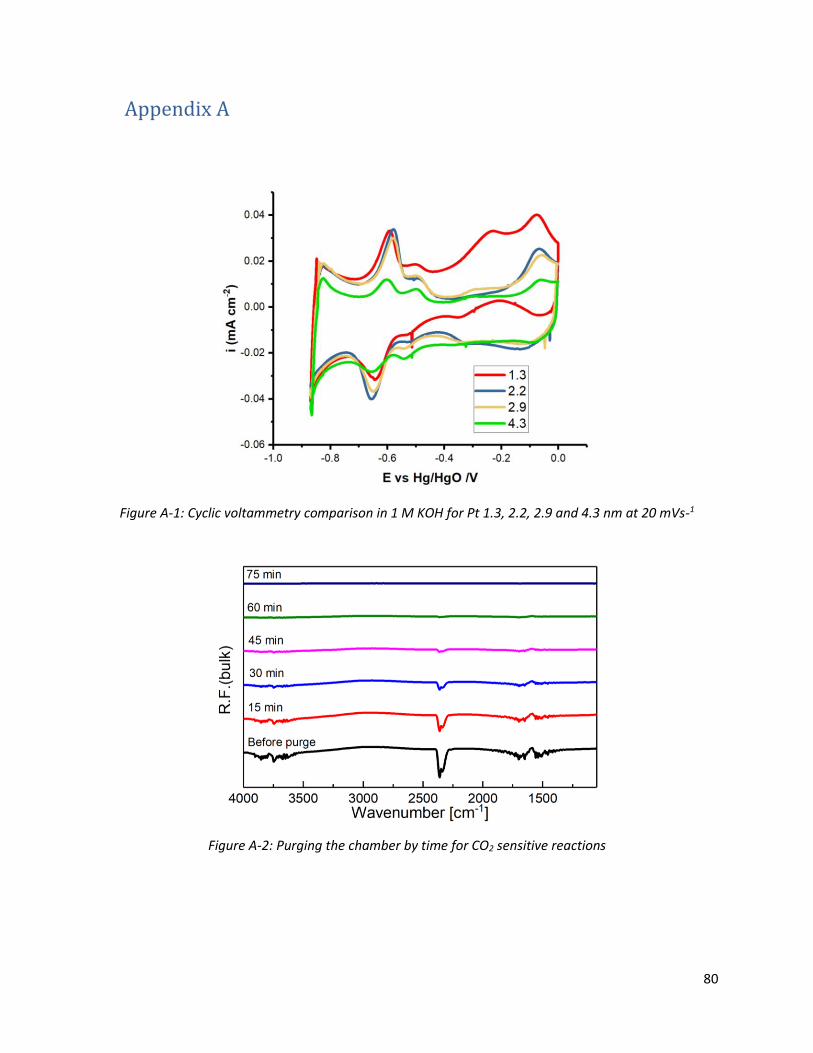
80
Appendix A
Figure A-1: Cyclic voltammetry comparison in 1 M KOH for Pt 1.3, 2.2, 2.9 and 4.3 nm at 20 mVs-1
Figure A-2: Purging the chamber by time for CO2 sensitive reactions

81
Appendix B
Figure B-1: a) XRD patterns of Engineered Carbon Supports and b) Raman spectra of Engineered Carbon Supports
a
ECS-1 ECS-1
ECS-2
ECS-2
b
Pt Pt75Ir25
Pt67Ru33 1
Pt67Ru33 2
Pt67Ru33 3
Figure B-2: CO stripping voltammograms in 1M KOH saturated with CO at a sweep of 20 mV/s for Pt, Pt75Ir25 and Pt67Ru33 1, 2 and 3 electrocatalysts

82
Figure B-3: PM-IRRAS spectra (considering KOH at -0.4 V as reference) on Pt a) references in 1 M KOH b) in 1MKOH+0.5M NH4OH in the bulk of electrolyte(left) and on the surface (right)
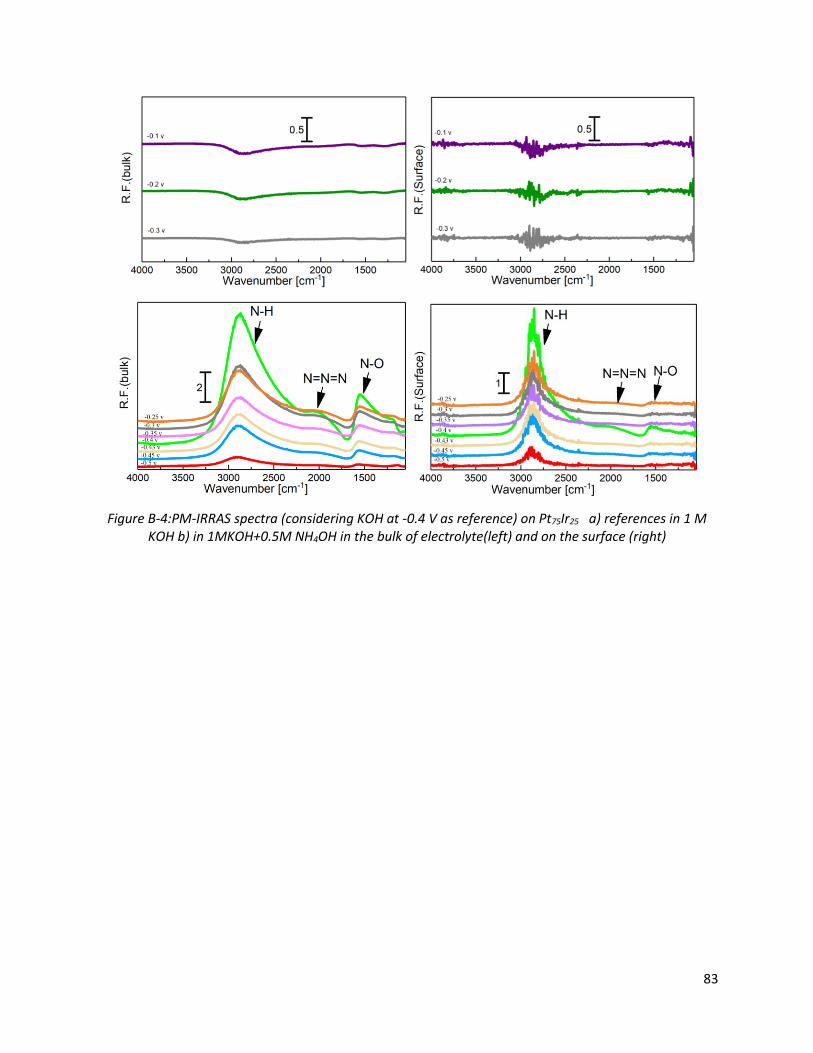
83
Figure B-4:PM-IRRAS spectra (considering KOH at -0.4 V as reference) on Pt75Ir25 a) references in 1 M KOH b) in 1MKOH+0.5M NH4OH in the bulk of electrolyte(left) and on the surface (right)

84
Figure B-5: PM-IRRAS spectra (considering KOH at -0.4 V as reference) on Pt67Ru33 1 a) references in 1 M KOH b) in 1MKOH+0.5M NH4OH in the bulk of electrolyte(left) and on the surface (right)

85
Figure B-6: PM-IRRAS spectra (considering KOH at -0.4 V as reference) on Pt67Ru33 2 a) references in 1 M KOH b) in 1MKOH+0.5M NH4OH in the bulk of electrolyte(left) and on the surface (right)

86
Figure B-7: PM-IRRAS spectra (considering KOH at -0.4 V as reference) on Pt67Ru33 3 a) references in 1 M KOH b) in 1MKOH+0.5M NH4OH in the bulk of electrolyte(left) and on the surface (right)


