Structural Health Monitoring: SMART STRUCTURES & STRUCTURAL INTEGRITY
Samir Mustapha | PhD BE (Hon I)
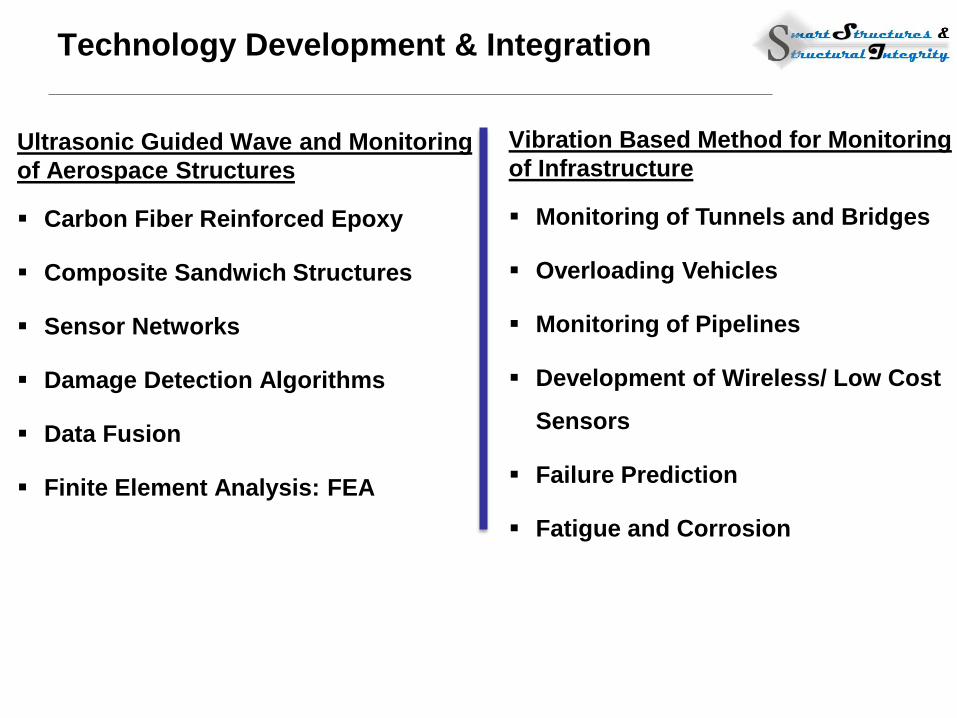
Vibration Based Method for Monitoring
of Infrastructure
Monitoring of Tunnels and Bridges
Overloading Vehicles
Monitoring of Pipelines
Development of Wireless/ Low Cost
Sensors
Failure Prediction
Fatigue and Corrosion
Technology Development & Integration
Ultrasonic Guided Wave and Monitoring
of Aerospace Structures
Carbon Fiber Reinforced Epoxy
Composite Sandwich Structures
Sensor Networks
Damage Detection Algorithms
Data Fusion
Finite Element Analysis: FEA
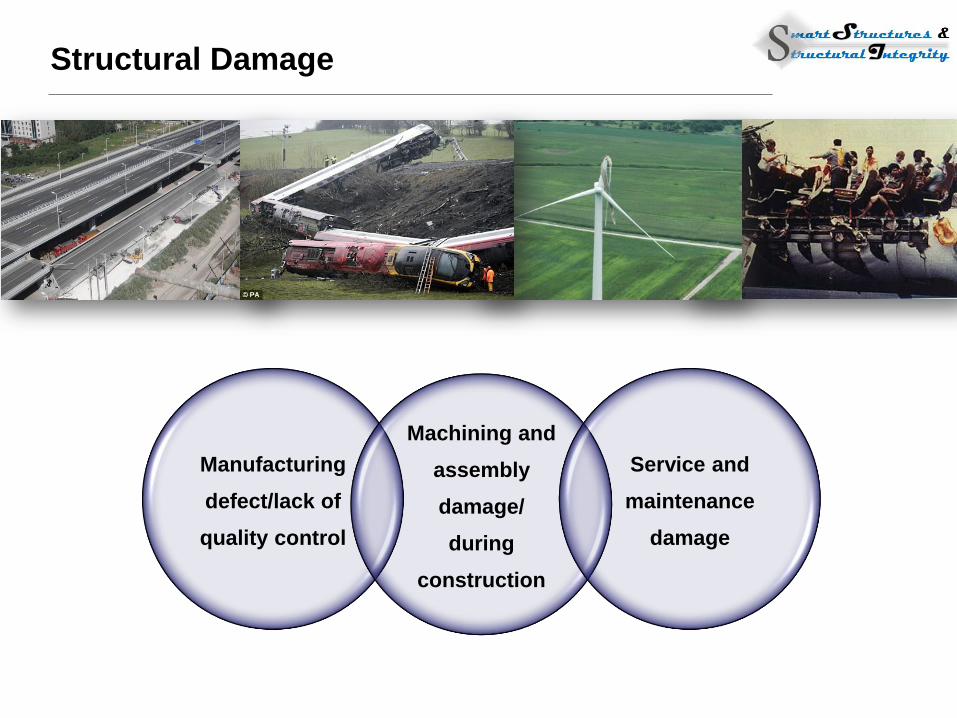
Structural Damage
Manufacturing
defect/lack of
quality control
Machining and
assembly
damage/
during
construction
Service and
maintenance
damage
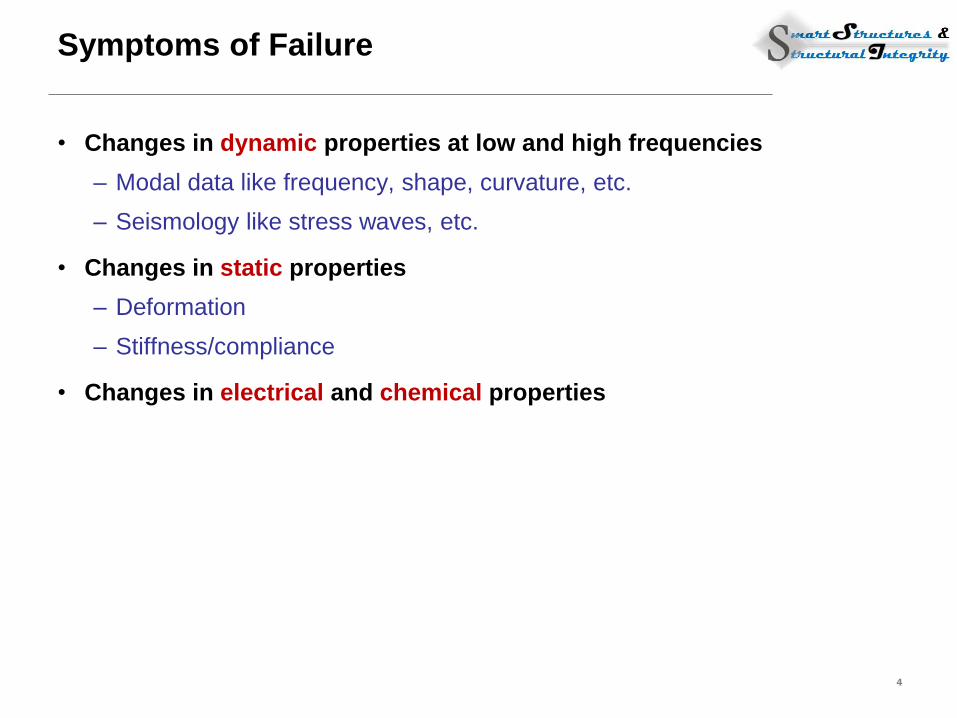
Symptoms of Failure
• Changes in dynamic properties at low and high frequencies
– Modal data like frequency, shape, curvature, etc.
– Seismology like stress waves, etc.
• Changes in static properties
– Deformation
– Stiffness/compliance
• Changes in electrical and chemical properties
4
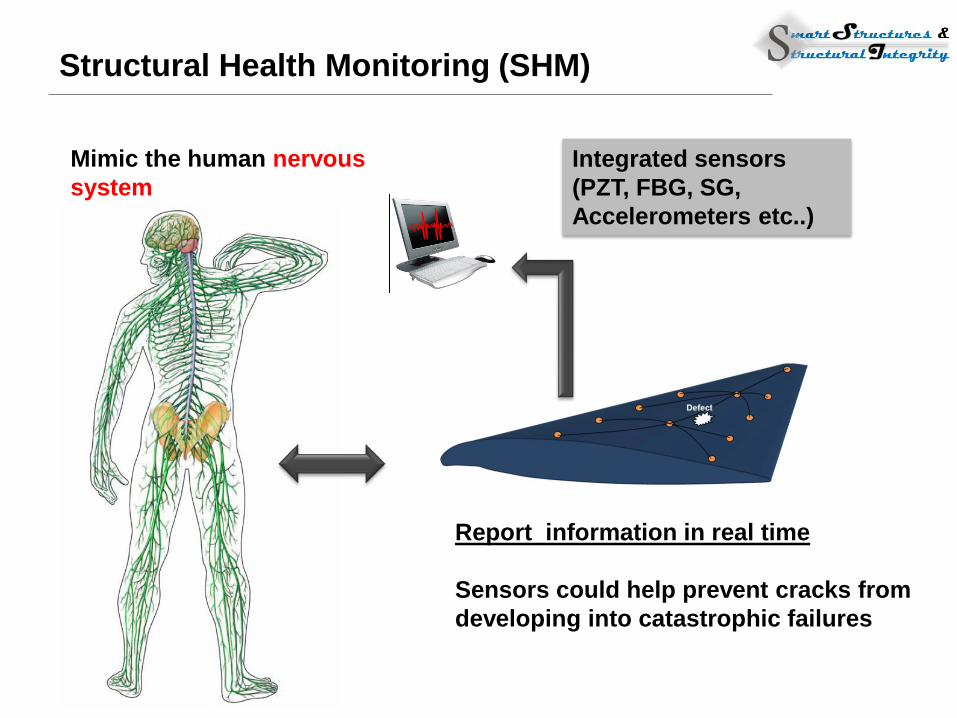
Structural Health Monitoring (SHM)
Mimic the human nervous
system
Integrated sensors
(PZT, FBG, SG,
Accelerometers etc..)
Report information in real time
Sensors could help prevent cracks from
developing into catastrophic failures
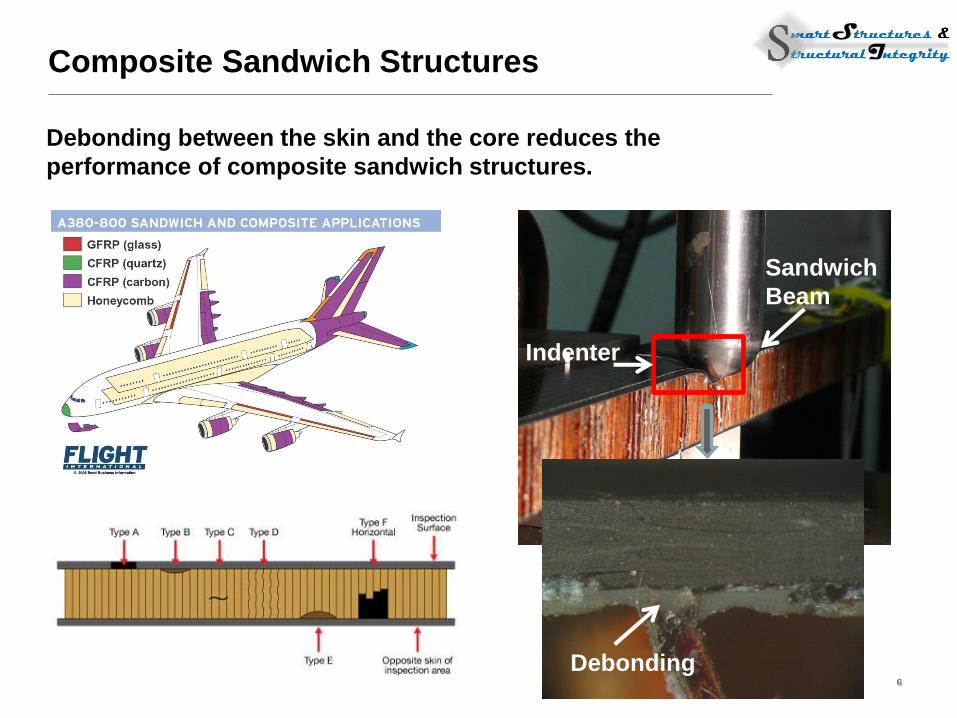
Indenter
Sandwich
Beam
Debonding
Composite Sandwich Structures
Debonding between the skin and the core reduces the
performance of composite sandwich structures.
6
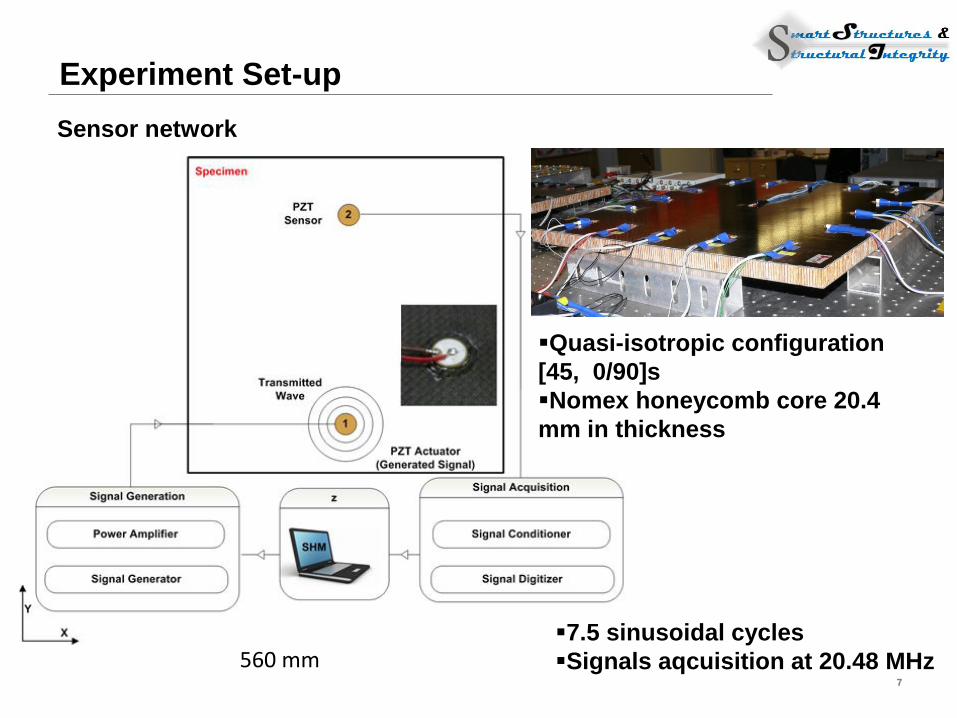
Experiment Set-up
7
7
6
280 mm
560 mm
Artificial debonding TPF
(40mm×40mm) 56
0 mm
440 mm
1 2 3 4 5
13
12
11
10
9
14
15
8
16
x-direction
y-d
irec
tio
n
17
Sensor network
Quasi-isotropic configuration
[45, 0/90]s
Nomex honeycomb core 20.4
mm in thickness
7.5 sinusoidal cycles
Signals aqcuisition at 20.48 MHz
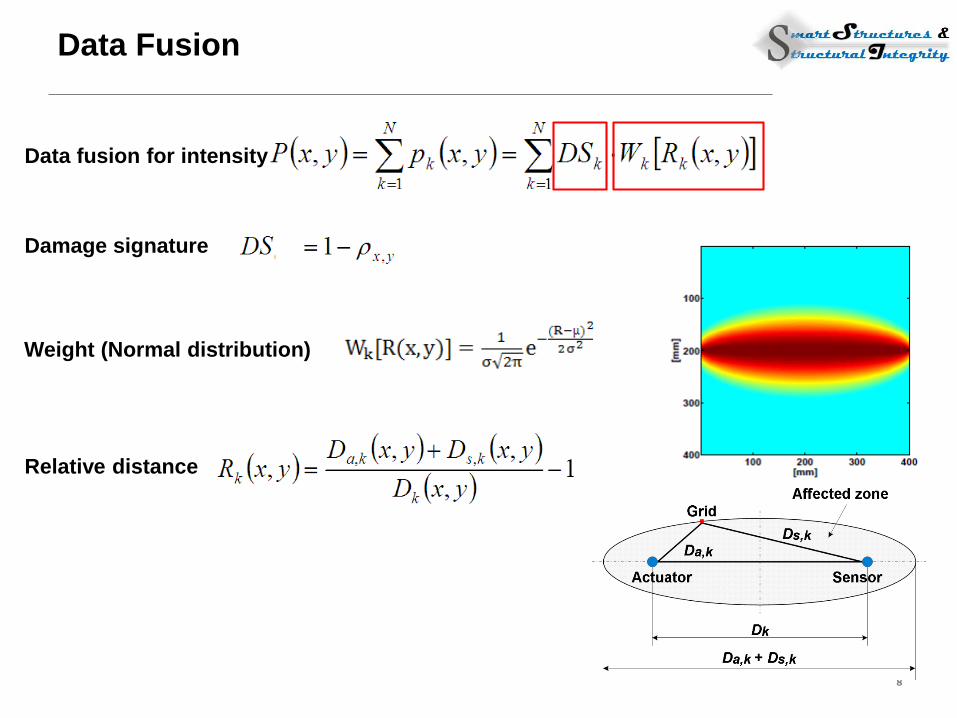
Data Fusion
8
Data fusion for intensity
Weight (Normal distribution)
Damage signature
Relative distance
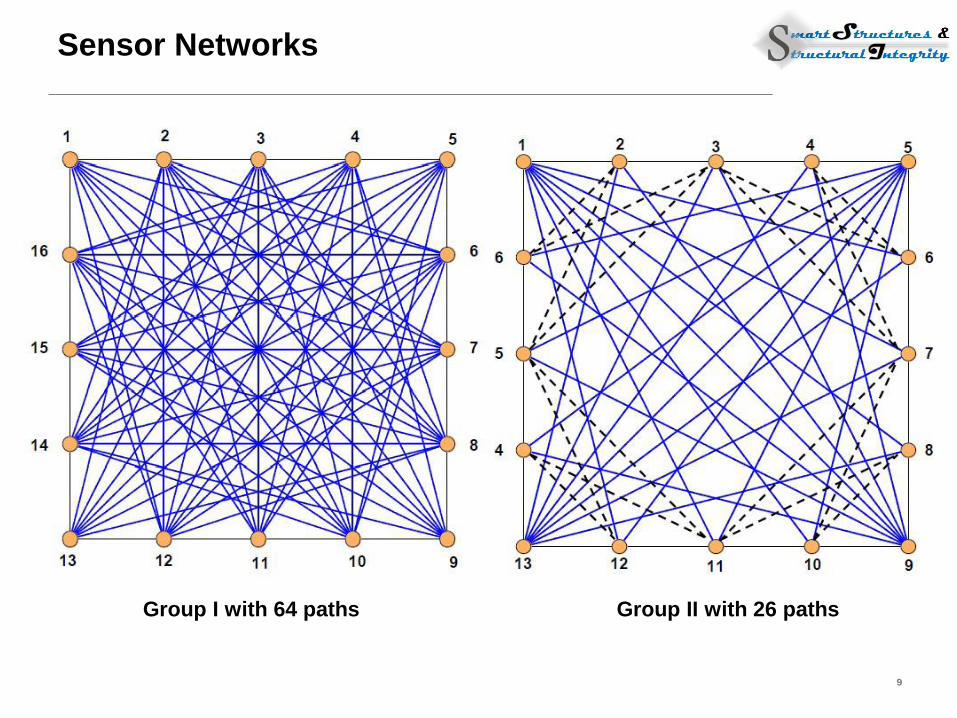
Sensor Networks
9
Group I with 64 paths Group II with 26 paths
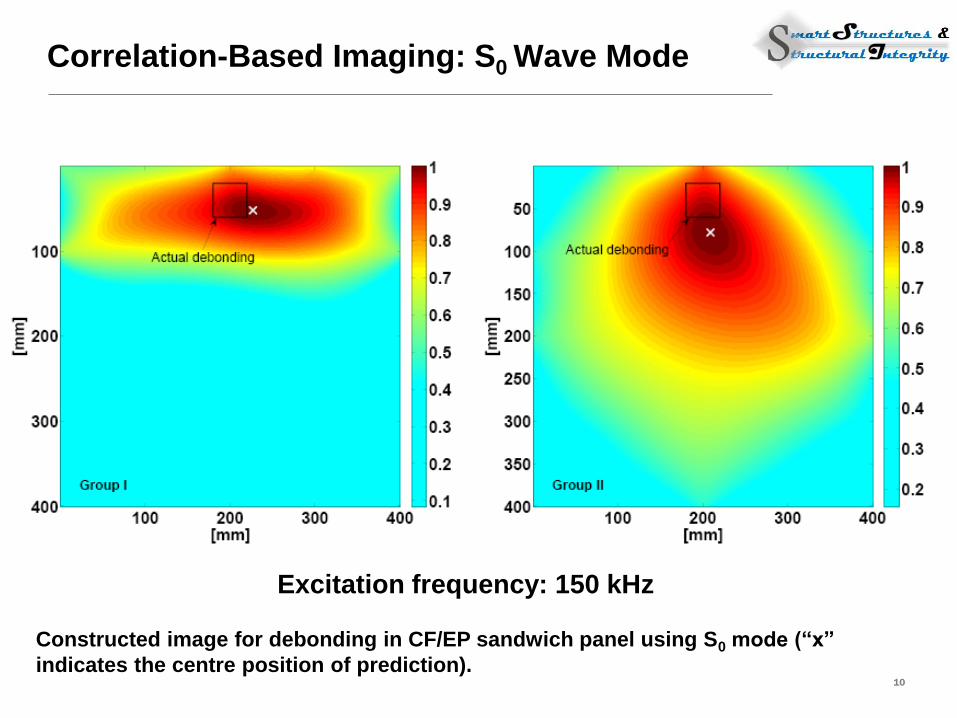
Correlation-Based Imaging: S0 Wave Mode
10
Constructed image for debonding in CF/EP sandwich panel using S0 mode (“x”
indicates the centre position of prediction).
Excitation frequency: 150 kHz
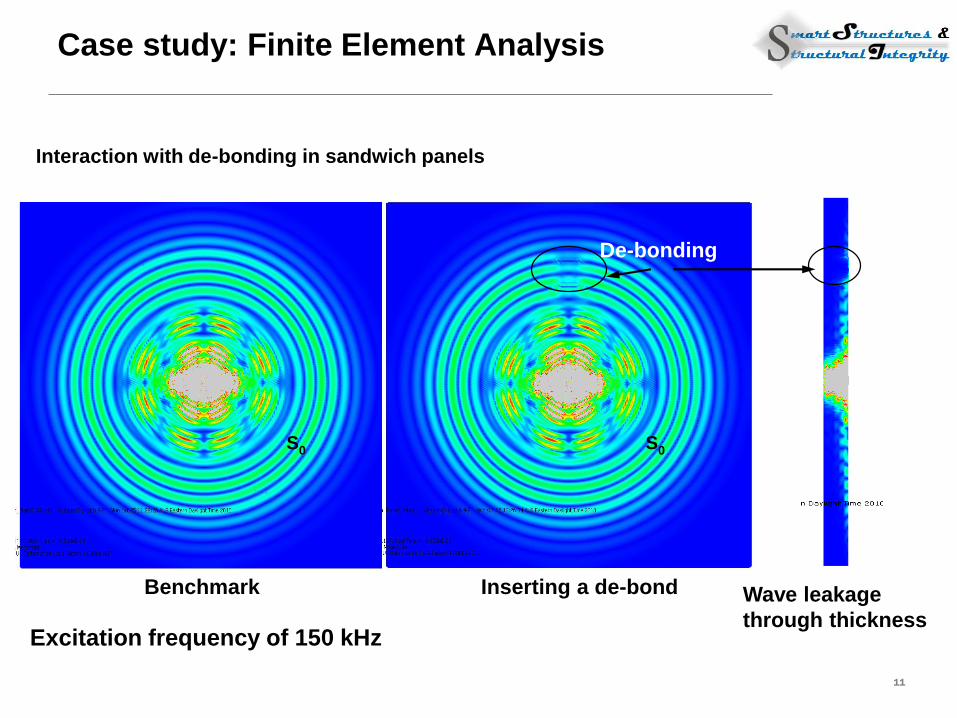
Case study: Finite Element Analysis
Interaction with de-bonding in sandwich panels
11
Excitation frequency of 150 kHz
De-bonding
S0 S0
Benchmark Inserting a de-bond Wave leakage
through thickness
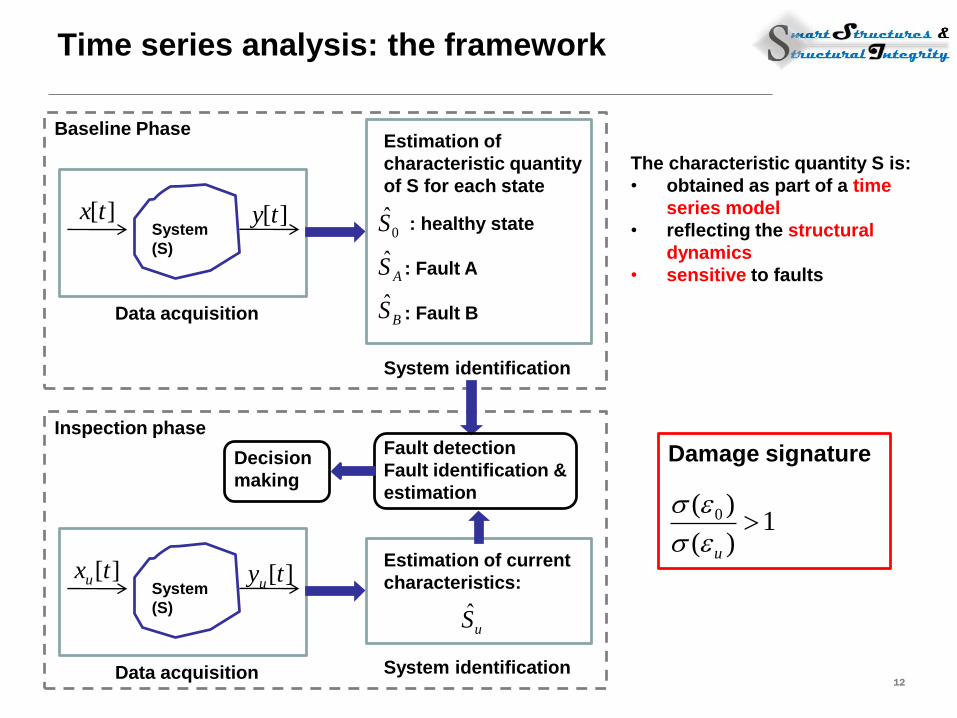
Time series analysis: the framework
12
][tx ][ty
Data acquisition
Estimation of
characteristic quantity
of S for each state
: healthy state
: Fault A
: Fault B B
A
S
S
S
ˆ
ˆ
ˆ0System
(S)
Baseline Phase
System identification
][txu ][tyu
Data acquisition
Estimation of current
characteristics:
uS
System
(S)
Inspection phase
System identification
Fault detection
Fault identification &
estimation
The characteristic quantity S is:
• obtained as part of a time
series model
• reflecting the structural
dynamics
• sensitive to faults
Decision
making
Damage signature
1)(
)( 0 u
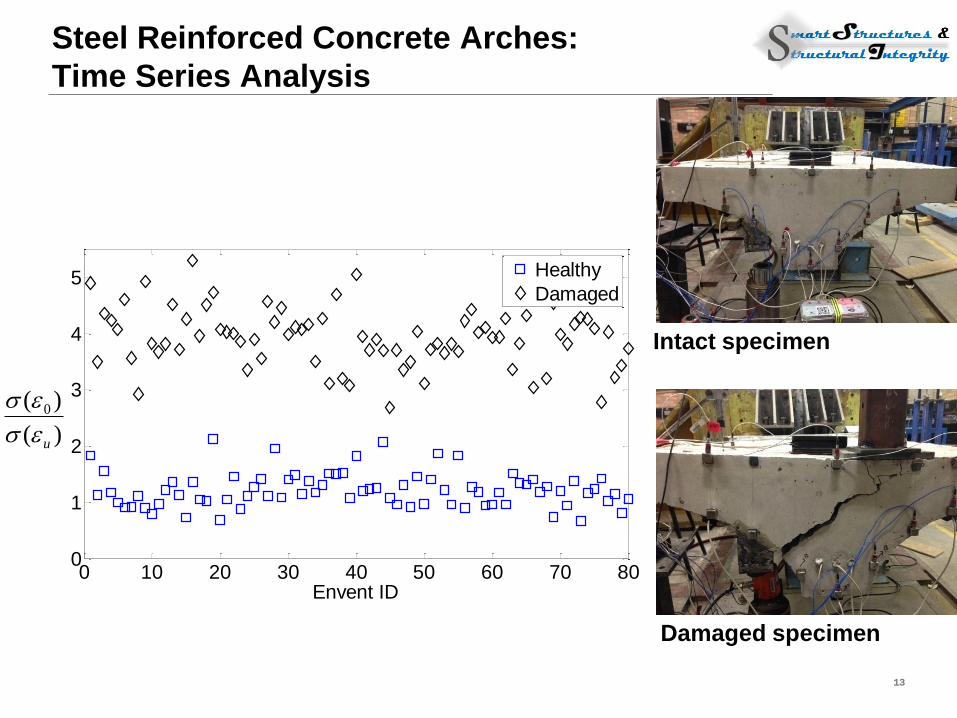
Steel Reinforced Concrete Arches:
Time Series Analysis
13
Intact specimen
Damaged specimen
0 10 20 30 40 50 60 70 800
1
2
3
4
5
Envent ID
Healthy
Damaged
)(
)( 0
u
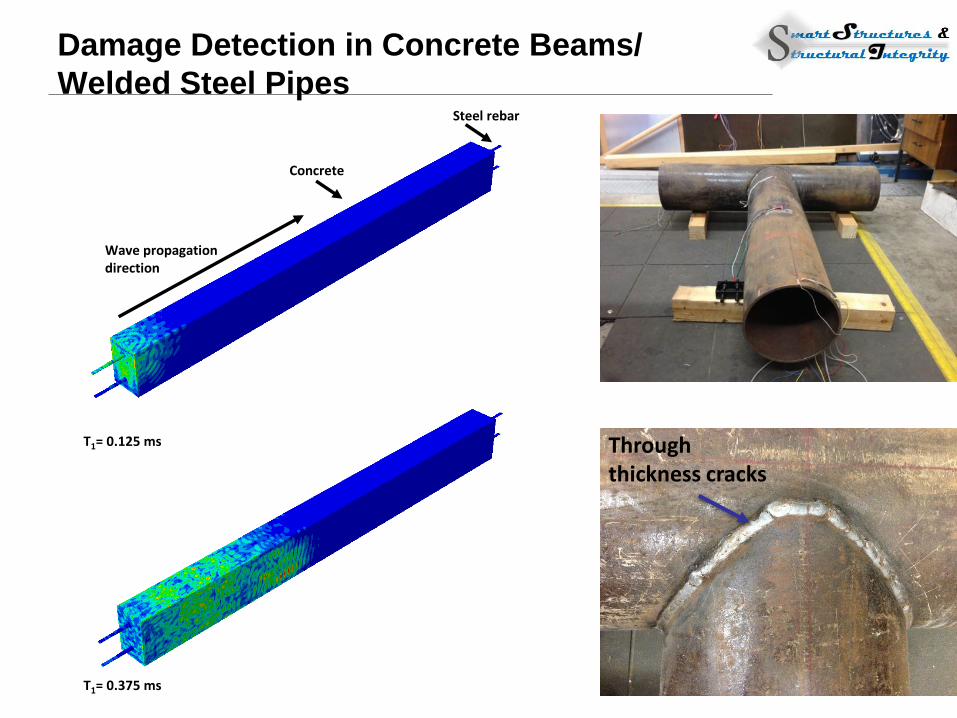
Damage Detection in Concrete Beams/
Welded Steel Pipes
14
Through thickness cracks
Wave propagation direction
T1= 0.125 ms
Steel rebar
Concrete
T1= 0.375 ms

Contact Details
15
Samir Mustapha BE, Ph.D.
Assistant Professor
Department of Mechanical Engineering
Faculty of Engineering and Architecture
American University of Beirut
Tel: 961-1-350 000 ext 3445
Email: [email protected]


