The Value of Enterprise Risk Management
in Strategic Planning
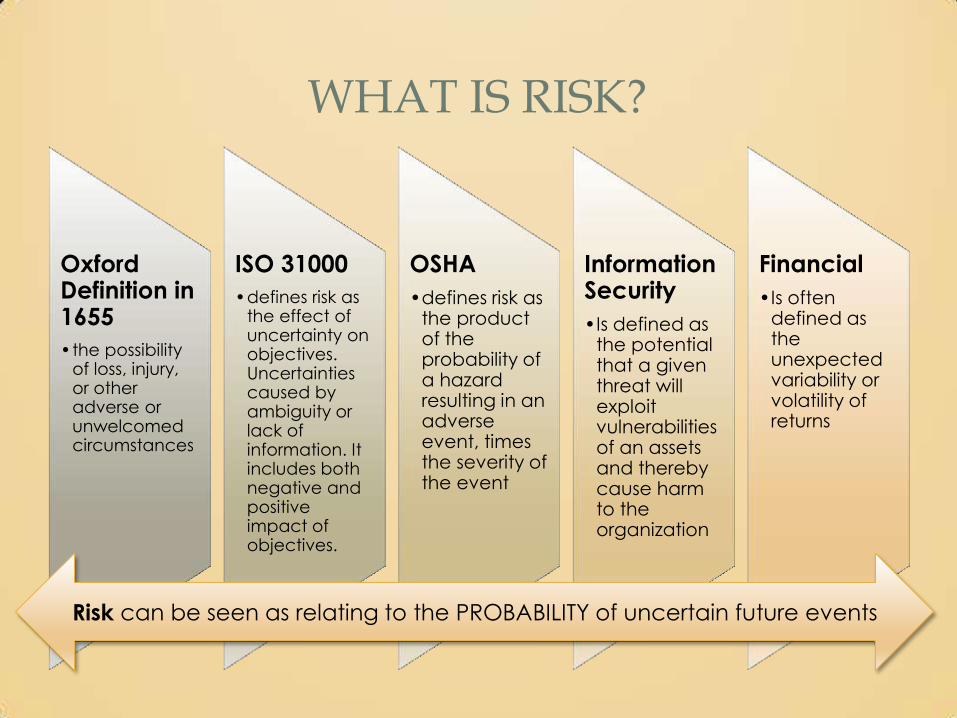
WHAT IS RISK?
Oxford Definition in 1655
•the possibility of loss, injury, or other adverse or unwelcomed circumstances
ISO 31000
•defines risk as the effect of uncertainty on objectives. Uncertainties caused by ambiguity or lack of information. It includes both negative and positive impact of objectives.
OSHA
•defines risk as the product of the probability of a hazard resulting in an adverse event, times the severity of the event
Information Security
•Is defined as the potential that a given threat will exploit vulnerabilities of an assets and thereby cause harm to the organization
Financial
•Is often defined as the unexpected variability or volatility of returns
Risk can be seen as relating to the PROBABILITY of uncertain future events

GROUP ACTIVITY?
•Come up with a universal definition of risk that you can explain to the CEO of your organization during a 60 second ride up with him on the company’s elevator.
The many inconsistent and
ambiguous meanings attached
to “risk” lead to widespread
confusion and also mean that very
different approaches to risk management are taken in different
fields

RISK CULTURE AT UNIVERSITY OF CALIFORNIA
Like organizations within the private sector, the UC system operates in an inherently risky environment. By strategically managing risk, they can reduce
the chance of loss, create greater financial stability, and protect their resources so they can continue their mission of supporting teaching, research
and public service.
Everyone a Risk Manager
Be Smart About Safety
Enterprise Risk Management Information System
Annual ERM Summits
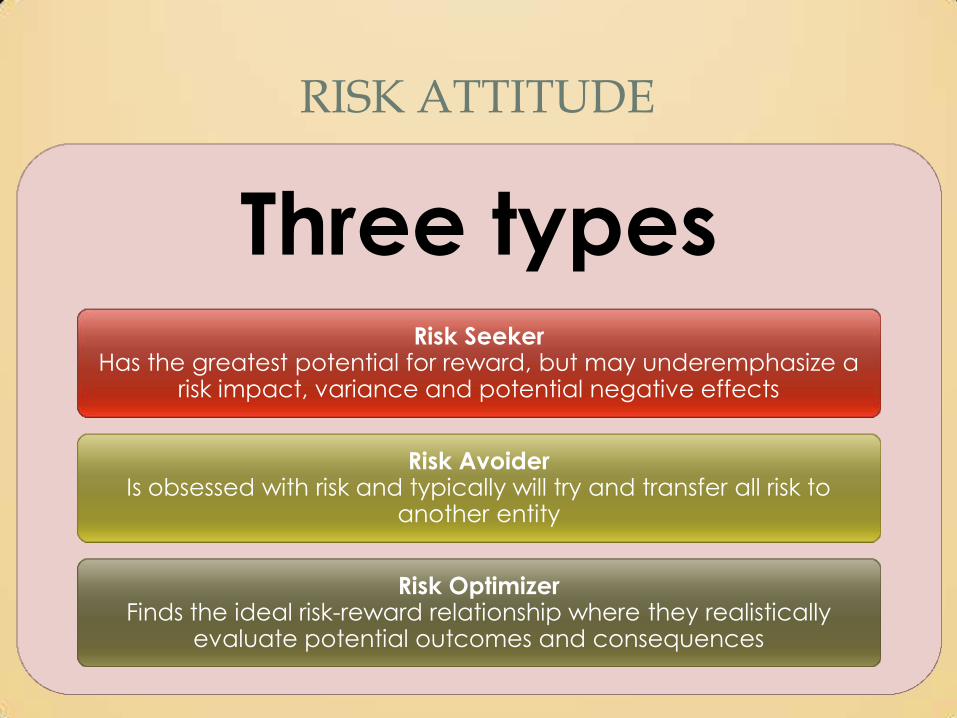
RISK ATTITUDE
Three types Risk Seeker
Has the greatest potential for reward, but may underemphasize a risk impact, variance and potential negative effects
Risk Avoider Is obsessed with risk and typically will try and transfer all risk to
another entity
Risk Optimizer Finds the ideal risk-reward relationship where they realistically
evaluate potential outcomes and consequences

STRATEGIC DIRECTION OF THE ORGANIZATION
Tactical Objectives
• Are created on the board or executive level and are general and conceptual and give the organization its direction
Operational objectives
• Are created at the staff management level and are functional in nature and cut across all departments within an organization
Strategic goals
• Are created at the line management level and represent specific tasks. These objectives relate to producing the organization’s products and services

WSDOT SETTING STRATEGIC GOALS
Safety - to provide for and improve the safety and security of transportation customers and the transportation system
Preservation - to maintain, preserve and extend the life and utility of prior investments in transportation systems and services
Mobility - to improve the predictable movement of goods and people throughout Washington state
Environment - to enhance Washington’s quality of life through transportation investments that promote energy conservation, enhance healthy communities and protect the environment
Stewardship - to continuously improve the quality effectiveness and efficiency of the transportation system
Economic Vitality - to promote and develop transportation systems that stimulate, support, and enhance the movement of people and goods to ensure a prosperous economy
Washington State Department of Transportation has a strategic plan 2011-
2017 that lists six strategic goals:
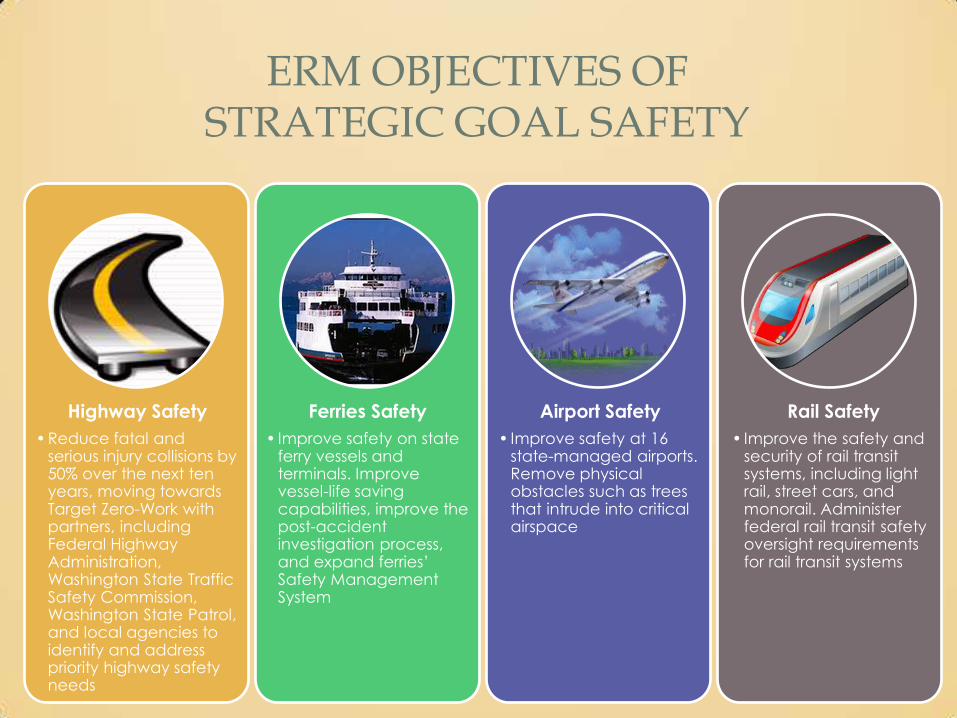
ERM OBJECTIVES OF STRATEGIC GOAL SAFETY
Highway Safety
• Reduce fatal and serious injury collisions by 50% over the next ten years, moving towards Target Zero-Work with partners, including Federal Highway Administration, Washington State Traffic Safety Commission, Washington State Patrol, and local agencies to identify and address priority highway safety needs
Ferries Safety
• Improve safety on state ferry vessels and terminals. Improve vessel-life saving capabilities, improve the post-accident investigation process, and expand ferries’ Safety Management System
Airport Safety
• Improve safety at 16 state-managed airports. Remove physical obstacles such as trees that intrude into critical airspace
Rail Safety
• Improve the safety and security of rail transit systems, including light rail, street cars, and monorail. Administer federal rail transit safety oversight requirements for rail transit systems

ERM OBJECTIVES TO STRATEGIC GOAL OF SAFETY
System and Facility Security
Improve WSDOT’s ability to prevent, mitigate, and respond to acts of terrorism on transportation systems and facilities. Implement high-priority infrastructure “burdening” capital projects identified in vulnerability assessments. Improve ferry vessel security
Continuity of Operations, Emergency
Management, and Responses
Increase WSDOT’s ability to respond to, recover from, and deliver vital services during emergencies and disasters-Improve planning and coordination with local and regional partners, improve WSDOT’s emergency response capabilities
Workers Safety
Continue to advocate WSDOT’s worker safety program to attain injury and illness reduction targets with the goal of zero work-related injuries and illnesses by 2019. Enhance communication of workers safety expectations and goals within WSDOT and with partners and establish a comprehensive return-to-work program
Bridge Risk Reduction
Reduce the risk of bridge collapse due to earthquakes, liquefaction, and foundation scour during high water flows. Complete bridge seismic retrofit projects funded by the Transportation Partnership Account to reduce seismic risks. Develop and begin implementing the I-5 lifeline corridor plan to provide for safety and mobility during catastrophic events

CASE STUDY: DAKOTA COUNTY, MN
Dakota County, Minnesota
Has created an Operations Management-Risk Management and Homeland Security Manual that is tied to their annual budget and identifies key accomplishments (strengths ) by strategic goals and challenges ( weaknesses ) by strategic goals. Key accomplishments are broken down into three perspectives:
• Stakeholder
• Financial • Internal

CASE STUDY-DAKOTA COUNTY, MN
• Stakeholder perspective- is to provide a
safe, healthy and productive environment
• Financial perspective- is to deliver cost
effective solutions
• Internal perspective-is to capitalize on
innovation

CASE STUDY-DAKOTA COUNTY, MN
Annually, Dakota County, MN reviews their accomplishments and their challenges towards their strategic goals:
Accomplishments- • Recognized by Minnesota Safety Council with the Award of
Honor for the County’s safety performance
• Developed the County’s After Action Report
• Updated the Continuity of Operations Plan
• Completed awareness training on how to prevent slips, trips and falls
• Secured $ 292,750 for new radio channel

CASE STUDY- DAKOTA COUNTY, MN
It is important to not only list responses to challenges,
but also come up with a method to track who within
the organization will be accountable for the response
to the identified challenge:
• Provide on-going management and technical support for
new radio channel
• Develop investment justification for projects under the 2010
Homeland Security UASI grant program
• Assist County Emergency Manager in updating the All Mitigation Plan

OVERVIEW OF ERM FRAMEWORKS
• Focus is to establish ERM goals as part of the strategic management process. It does not dive into the details of risk management approaches and process, but addresses threats to the organization and the need for proper controls.
COSO II
• Rooted in risk management principles and designed to provide an organized methodology to evaluate risk exposures and react to the environment.
ISO 31000
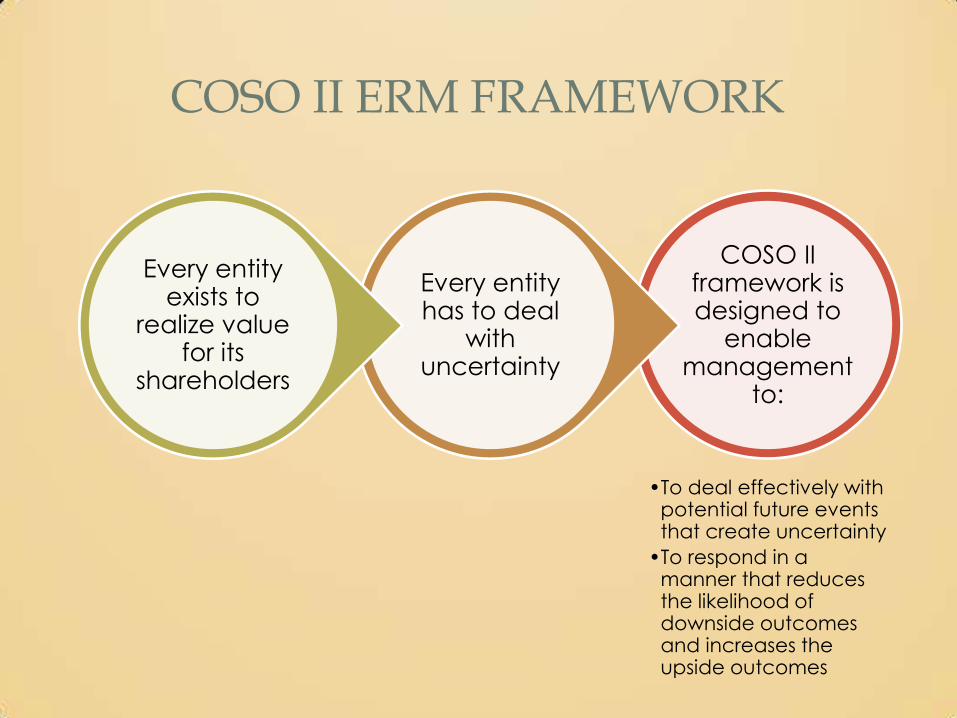
COSO II ERM FRAMEWORK
COSO II framework is designed to
enable management
to:
•To deal effectively with potential future events that create uncertainty
•To respond in a manner that reduces the likelihood of downside outcomes and increases the upside outcomes
Every entity has to deal
with uncertainty
Every entity exists to
realize value for its
shareholders

COSO II ERM DEFINITION
Enterprise Risk Management
Is a process
Effected by an entity’s board of directors, management, and other personnel
Applied in a strategy setting and across the entire entity
Designed to identify and manage potential events that may affect the entity
Provide reasonable assurance regarding the achievement of entity objectives

Objective
Categories
Strategic
Operations
Reporting
Compliance Entity objectives
can be viewed in
the context of four
categories
COSO II ERM FRAMEWORK

Monitoring Separate Evaluations – Ongoing Evaluations
Information and Communication Information – Strategic and Integrated Systems - Communication
Control Activities Integration with Risk Response – Types of Control Activities – General Controls – Application Controls – Entity Specific
Risk Response Identify Risk Responses – Evaluate Possible Risk Responses – Select Responses – Portfolio View
Risk Assessment Inherent and Residual Risk – Likelihood and Impact – Methodologies and Techniques - Correlation
Event Identification Events – Factors Influencing Strategy and Objectives – Methodologies and Techniques – Event Interdependencies –
Event Categories – Risks and Opportunities
Objective Setting Strategic Objectives - Related Objectives - Selected Objectives - Risk Appetite - Risk Tolerance
Internal Environment Risk Management Philosophy - Risk Culture - Board of Directors - Integrity and Ethical Values - Commitment to
Competence - Management Operating Style - Risk Appetite - Organizational Structure - Authority and Responsibility

INTERNAL ENVIRONMENT COSO II ERM FRAMEWORK
Risk Management
Philosophy
Risk Culture
Board of Directors
Integrity and Ethical Values
Commitment to Competence
Management Operating Style
Risk Appetite
Organizational Structure
Authority and Responsibility

OBJECTIVE SETTING COSO II ERM FRAMEWORK
Strategic Objectives
Related Objectives
Selected Objectives
Risk Appetite
Risk Tolerance

EVENT IDENTIFICATION COSO II ERM FRAMEWORK
Events
Factors Influencing Strategy and
Objectives
Methodologies and Techniques
Event Interdependencies
Event Categories
Risks and Opportunities

RISK ASSESSMENT COSO II ERM FRAMEWORK
Inherent and Residual Risk
Likelihood and Impact
Methodologies and
Techniques
Correlation

RISK RESPONSE COSO II ERM FRAMEWORK
Identify Risk
Responses
Evaluate Possible
Risk Responses
Select Responses
Portfolio View

CONTROL ACTIVITIES COSO II ERM FRAMEWORK
Integration with Risk Response
Types of Control Activities
General Controls
Application Controls
Entity Specific

INFORMATION & COMMUNICATION COSO II ERM FRAMEWORK
Information
Strategic and Integrated
Systems
Communication

MONITORING COSO II ERM FRAMEWORK
•Ongoing monitoring activities
•Separate evaluations
•A combination of these two
Monitoring
Improves the ongoing
effectiveness of the other
enterprise risk management components
through:

ROLES AND RESPONSIBILITIES
Four Broad Areas of Roles and Responsibilities
Board of Directors
Responsible for overseeing management’s design and operation of ERM
Executive Management
Responsible for the design of an entity’s enterprise risk management framework
Risk Officers
Work with managers in establishing and maintaining effective risk management
Internal Auditors
Contribute to the ongoing effectiveness of the enterprise risk management

VALUE AND UTILITY OF COSO ERM
•A definition of risk management
•A vocabulary, concepts and principles shared by all the parties involved
•Criteria to evaluate the effectiveness
•Guidelines for entities
For Organizations
•Align strategy with risk appetite
•Enhance risk response decisions
•Reduce the likelihood and/ or impact of negative events
•Seize opportunities
•Identify and manage multiple and cross-enterprise risks
For Managers
•Play an important role in monitoring ERM
•Internal Auditor do not have a primary responsibility for its implementation or maintenance
•Assist management and the board or audit committee in the process
For Internal Auditors

ISO 31000
• Create and protect value by using risk management to help achieve your organization’s objectives and improve its performance
• Make risk management part of every process within your organization at every level
• Make risk management a responsibility of every manager within your organization
Risk Management Should Create and Protect Value

ISO 31000
Risk Management
Should Be Part of Your Decision
Making
Use risk management to make informed
choices
Use risk management to prioritize actions
Risk Management
Should Be Used to Deal with
Uncertainty
Use risk management to
address the uncertainty that
your organization faces
Use risk management to
identify and define the nature
and type of c

ISO 31000
Risk Criteria
Consider your organization and how it
functions when you define your
risk criteria
Consider the views of your
organization’s stakeholders
when you define your risk
criteria
Consider the consequences, likelihood and
level of risk when you
define your risk criteria
Consider whether
combinations of multiple risks
should be taken into account
when you define your risk
criteria

ISO 31000
Risk Assessment Process
Identify your organization’s
risks
Choose suitable risk
identification tools
Select the right people to
identify
Generate comprehensive
list of risks
Analyze your organization’s risks
Estimate your organization’s
level of risk
Specify how much
confidence you have in your analysis
Use your risk analysis to
understand your
organization’s risk
Communicate the results

ISO 31000
Risk Assessment
• Evaluate your organization’s risks
• Use the results of your risk analysis to evaluate your organization’s risks
• Use the results of your analysis to consider risk treatment options

ISO 31000
Formulate and Implement Your Risk Treatment Plans
• Explore your organization’s risk treatment options
• Establish a cyclical risk treatment process
• Consider your organization’s risk treatment
• Select your organization’s risk treatment options
• Select the most appropriate risk treatment option
• Plan the implementation of your risk treatment

ISO 31000
Formulate and Implement Your Risk Treatment Plans
Prepare risk treatment implementation plans
• Document your organization’s risk treatment plans
• Discuss risk treatment plans with all participants
• Carry out your risk treatment implementation plans
Monitor and Review Your Risk Management Process
• Plan your risk management monitoring and review processes
• Monitor and review all aspects of your risk management process
• Record your organization’s monitoring and review results
• Report your risk management monitoring review and results

GROUP ACTIVITY
Describe the benefits of having an ERM program?
How would an ERM program help with the decision making process in an organization ?
Tell us about a company from the headlines that would have benefitted from implementing an ERM program in their organization?

MODEL OF GOOD JUDGMENT
“Avoiding Judgment Traps and Biases”
By KPMG, Dr. Glover and Dr. Prawitt from BYU
COSO report March 2012
Judgment is the process of reaching
a decision or drawing a
conclusion when there are a number
of possible alternative solutions
An effective judgment process
will be logical, flexible, unbiased,
objective and consistent
It will utilize an appropriate
amount of relevant information,
properly balancing experience, knowledge,
intuition, and emotion

STEPS OF JUDGMENT PROCESS
Define problem and identify fundamental objectives
Consider alternatives
Gather and evaluate information
Reach a conclusion
Articulate and document rationale
PITFALLS AND BIASES IN JUDGMENT
Rush to Solve - Tendency to want to immediately solve a problem by making a quick judgment results in underinvestment in steps 1 Define problem and identify fundamental objective and step 2 to consider the alternative in the judgment process
•Often the solution is to select the first seemingly workable alternative without sufficient consideration of the problem to be solved and the objectives to be achieved
•As a result of the rush-to-solve trap, decision makers sometimes end up solving the wrong problem, or they might settle foe a suboptimal outcome

PITFALLS AND BIASES IN JUDGMENT
Judgment Trigger
Every judgment or decision has an initiating force that triggers a decision and that trigger can lead the
decision maker to skip the early steps in the judgment process
Triggers often come in the form of an alternative masquerading as a problem definition, and thus
move forward without a complete understanding of the problem or objectives and without a
complete consideration of other alternatives

PITFALLS AND BIASES IN JUDGMENT
• Judgment Framing is a mental structure or perspective that people use to determine the relevance or importance of information
• Different vistas or frames also are possible with judgment
problems; often, there are many possible perspectives on the same situation
• People’s willingness to take on risk depends on how a situation is framed
• One way to recognize a frame is by identifying the analogies or metaphors being used

PITFALLS AND BIASES IN JUDGMENT
Overconfidence- The pervasive tendency to be
overconfident can lead to suboptimal behavior in
every step of a good judgment process
• Overconfidence can lead to underinvesting in
defining the problem and identifying
fundamental objectives, the consideration of too
few alternatives, or truncating or skipping an
information search, all of which can lead to a
suboptimal conclusion

PITFALLS AND BIASES IN JUDGMENT
Confirmation-Tendency and related potential
judgment bias primarily affects steps 3 gather and
evaluate information & step 4 of reaching a
conclusion of the judgment process
• Human tendency is to seek and overweight
confirming information in the information
gathering and evaluation steps and to favor
conclusions that are consistent with our initial
beliefs or preferences

PITFALLS AND BIASES IN JUDGMENT
Anchoring- Tendency and related potential
judgment bias primarily affects step 3 to gather and
evaluate information of the judgment process
• In gathering and evaluating information, it is
human nature to anchor on an initial value and
adjust insufficiently away from the value in making
our final assessment

PITFALLS AND BIASES IN JUDGMENT
Availability- Tendency limits alternative considered or
information gathered to those alternatives or
information that readily come to mind
• The availability tendency can have particular
influence on steps 2 consider the alternative and
step 3 gather and evaluate the information of the
judgment process
HOW TO IMPROVE DECISION MAKING
• Evaluate management’s business strategies and
whether management is taking necessary steps to
achieve strategic goals
• Evaluating risk, including the risks of fraud, and
assessing management’s internal control and other
responses to those risks
• Reviewing and approving financial budgets and
forecasts

HOW TO IMPROVE DECISION MAKING
• Reviewing the adoption of new technology
• Evaluating management’s plans to address
the risks of various potential disasters

CASE STUDY: TITANIC
Titanic was one of the greatest
maritime disasters of all time that took place on April 14/15 of 1912
Over 1,500 lives perished in the
disaster
In 1900, travel from Europe to America was exclusively by
ship
Competition of business was
fiercely competitive
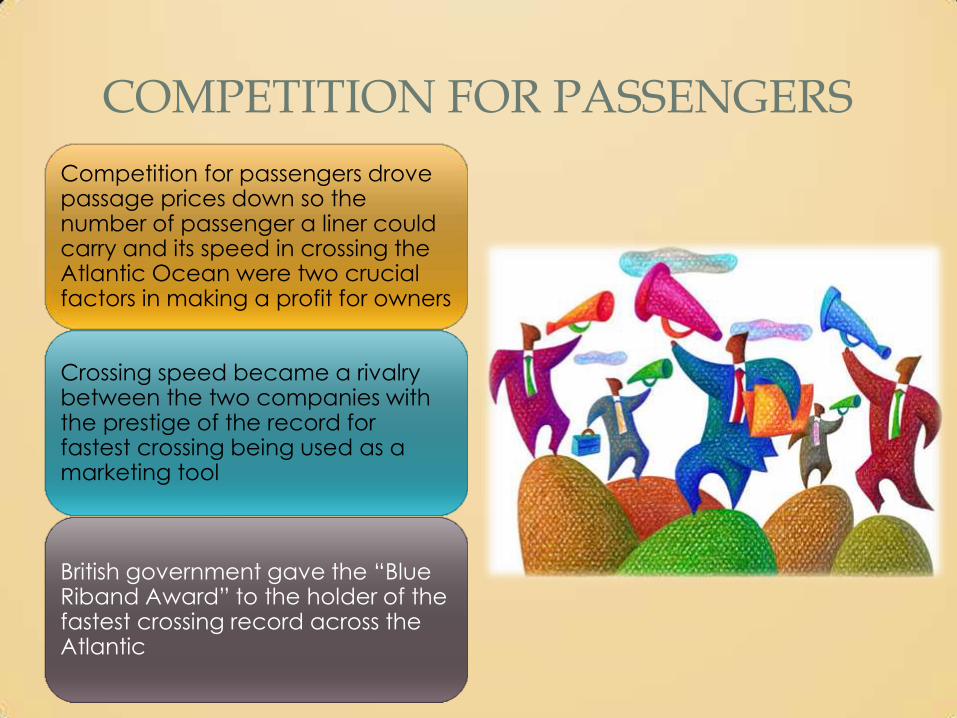
COMPETITION FOR PASSENGERS
Competition for passengers drove passage prices down so the number of passenger a liner could carry and its speed in crossing the Atlantic Ocean were two crucial factors in making a profit for owners
Crossing speed became a rivalry between the two companies with the prestige of the record for fastest crossing being used as a marketing tool
British government gave the “Blue Riband Award” to the holder of the fastest crossing record across the Atlantic

“BLUE RIBAND” AWARD
• Cunard Line held Blue Riband Award for 22 years
• Cunard Line’s Mauritania made the fastest crossing in 1907
• Mauritania was not only the fastest passenger ship on the Atlantic run, but also one the biggest and most luxurious
• White Star were desperate
to build a liner that could compete with Mauritania

WHITE STAR’S COMPETING STRATEGIES
• Wanting to be the fastest ship to cross the Atlantic
• Build a luxurious ship to attract the very richest and most demanding passengers
• Build a large enough ship to accommodate many second and third class passengers because the profit lay with the number of passengers on the ship
• They wanted the safest ship crossing the Atlantic and be able to claim the ship was unsinkable

SHIP BUILDING IN 1900
Ships built with steel that had a high sulphur content which
tends to make the steel brittle
Brittleness increases as the temperature drops and the North Atlantic can be very
cold with icebergs
Riveting steel plates instead of welding which is a weaker
technique

SEVERAL COMPETING FACTORS
Speed is the result of several factors
Length of the hull
• Longer the ship’s waterline, the faster she goes
• Broad beamed heavy ship will be slower
Width of the hull
• Narrower hull will be faster
• Narrower hull has less room for luxury

SEVERAL COMPETING FACTORS
Speed is the result of several factors Weight of the ship
• More powerful engine required more boilers
• More powerful engines needed more space for coal
Space for Cabins
• More space each cabin has, fewer the total cabins on ship
• Ship was only 890 feet with 3,500 passengers
Space for Lifeboats
• More lifeboats meant less room for paying customers
• Passenger ships only required to carry 16 lifeboats regardless the number of passengers

SAFETY CONSIDERATIONS
Operation of doors would be
automatic or controlled
manually from the bridge
Second inner hull would
protect the outer hull if breached
Telegraph used to advise the
ship of weather conditions and
hazards to navigation
Life boats to be used only as a
last resort

CONTRIBUTING FACTORS TO DISASTER
• Demand for use of telegraph by passengers handicapped Titanic in receiving emergency warnings of icebergs
• Crow’s nest did not have a set of binoculars
• Calm waves and dark opaque surface of ice made it hard to see icebergs
• Ship was going too fast through icebergs
• Rudder damaged when leaving South Hampton’s dock

RESPONSE TO THE DISASTER
First lifeboat to leave could have held 68 men, but only had 12 passengers
Crew tried to have passengers fill lifeboats, but reluctant passengers went
back to their compartments, the smoking room, or the gymnasium
Water tight doors to individual compartments were not water tight and
flood water began to float to next compartment
Fourth officer reported prematurely to Captain Smith that there was little
damage to the ship
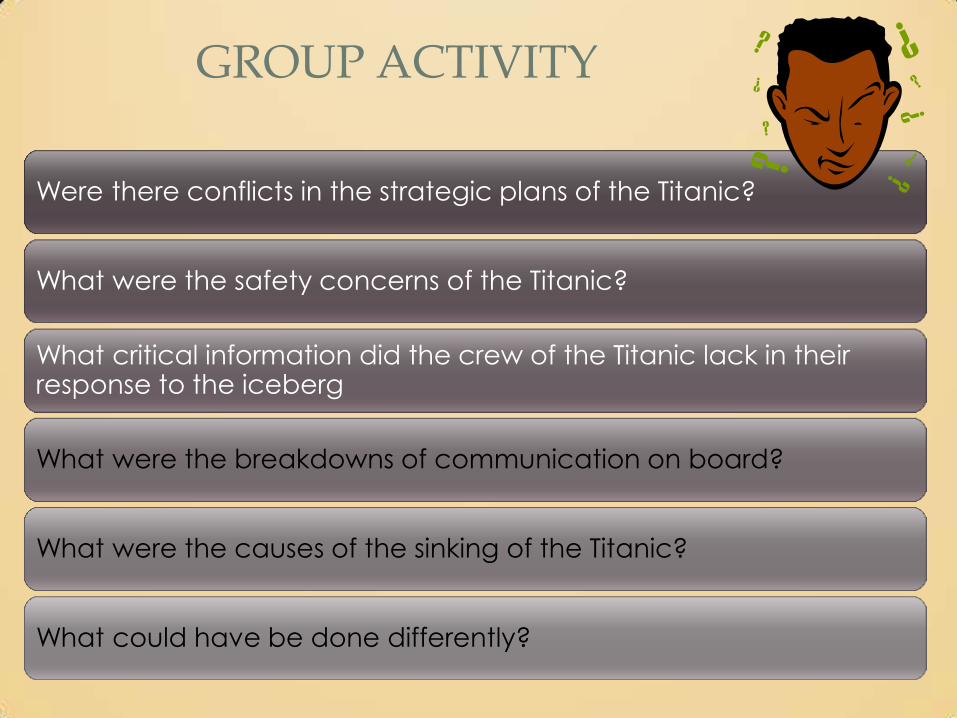
GROUP ACTIVITY
Were there conflicts in the strategic plans of the Titanic?
What were the safety concerns of the Titanic?
What critical information did the crew of the Titanic lack in their response to the iceberg
What were the breakdowns of communication on board?
What were the causes of the sinking of the Titanic?
What could have be done differently?

SIX STEP APPROACH TO ERM
1
Risk Identification
2
Risk Assessment
3
Risk Analysis
4
Implementation
5
Monitoring
6
Evaluation
1. RISK IDENTIFICATION
The process of taking inventory of all risks in an organization and
defining the potential risk event,
the causes to that risk event, and
the potential outcome if that risk
event were to occur
Focus not only on hazard or operational risks, but
also strategic, financial, reputational,
compliance, environmental, human capital and
technology, market, and supply chain risks
1
Risk Identification

SCOPE OF RISK IDENTIFICATION
Strategic Operational
Financial Other
Risk Categories
Define where
the source of a
potential risk
event is coming
from; Inside or
Outside the
organization.
Establishing risk
categories helps
to identify the
sources of a risk
event.
1
Risk Identification

STRATEGIC RISK CATEGORIES
Strategic Risks
Innovation Risk
Customer Risk
Market Risk
Investor Risk
Brand Risk Planning
Risk
Partnering Risk
Supply Chain Risk
R&D Risk
1
Risk Identification

OPERATIONAL RISK CATEGORIES
Operational Risk
Human Capital Risk
Communication Risk
Sustainability Risk
Regulatory and Legal
Risk
Governance Risk
Financial Reporting
Risk
Fraud Risk
Emerging Risk
Technology Risk
Hazard Risk
1
Risk Identification

FINANCIAL RISK CATEGORIES
Financial Risks
Financial Market
Risk
Credit Risk
Liquidity Risk
Interest Risk
Asset Risk
Foreign Investment
Risk
Inflation Risk
Hedging Risk
Valuation Risk
1
Risk Identification

OTHER RISK CATEGORIES
Other
Reputational Risk
Environmental Risk
Third Party Risk
Economic Risk
Project Risk
Investment Risk
1
Risk Identification

RISK COUNCIL
Risk Council
Aviation Real Estate
Information Technology
Finance
Environmental Affairs
Energy & Transportation
Airport Development & Engineering
Risk Management
Revenue management
Operations
Human resources
Department of Public Safety
Asset Management
Audit Services
Government & Stakeholders
Affairs
1
Risk Identification

DALLAS / FORT WORTH INTERNATIONAL AIRPORT
1
Risk Identification
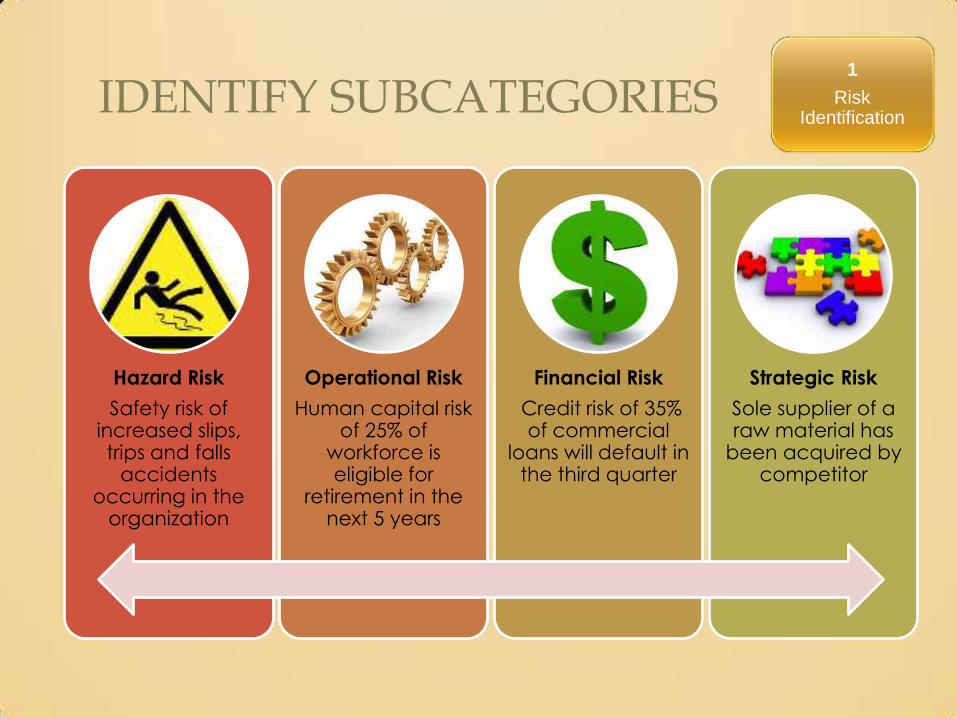
IDENTIFY SUBCATEGORIES
Hazard Risk
Safety risk of increased slips, trips and falls
accidents occurring in the
organization
Operational Risk
Human capital risk of 25% of
workforce is eligible for
retirement in the next 5 years
Financial Risk
Credit risk of 35% of commercial
loans will default in the third quarter
Strategic Risk
Sole supplier of a raw material has
been acquired by competitor
1
Risk Identification

EXISTING & EMERGING RISK
Look not only at existing risks,
but also the emerging risks
to the organization.
• What new business processes have been added to the organization?
• What changes have been made in the organizational chart?
• What are some external risks that could impact the organization like economic, environmental, societal, geopolitical, and technological?
1
Risk Identification

KNOW WHERE YOU STAND
Meet with senior management to define the strategic goals of your organization
Review the mission and vision statements of the organization
Define the expectations of internal and external stakeholders
1
Risk Identification

DON’T BE CONFLICTED
One of GSK’s strategic goals was to sell safe
and effective prescription medication
Another goal was to increase profitability
by outsourcing manufacturing to other parts of the
world
This conflict caused the quality control of manufacturing to suffer.
Case in point – the Cidra Plant in Puerto Rico made 20 drugs under unhealthy conditions that lead to a $750 million FDA fine
GlaxoSmithKline – A study in conflicting strategic goals
1
Risk Identification

NEXT STEPS
Identify the risk management objectives to support the strategic goals
of the organization
Review the Risk Policy of the organization
Create a SWOT Analysis (Strengths, Weaknesses,
Opportunities, and Threats) reviewing the internal and
external content of the organization
1
Risk Identification

SWOT ANALYSIS 1
Risk Identification

RISK IDENTIFICATION ACTIVITIES
Brainstorming
Can effectively generate lots of
ideas of potential risk scenarios that could
take place
Structured Interviews
Uses a risk survey or questionnaire to ask
specific questions related to different
types of potential risk events facing a
particular risk owner or risk center
Top Down / Bottom Up Approach
1
Risk Identification

ESTABLISH RISK CRITERIA
External and internal parameters for managing risk in an organization
Responsibilities of risk owner
Risk centers assigned to risk owner
Determine critical risks in the organization.
Prioritize the critical risks from greatest to least
1
Risk Identification

UC’S ERM WORK PLAN
University of California has developed an ERM Work Plan for its employees. Within the context of campus/medical center’s mission, the management team establishes strategic goals, selects strategy and aligns ERM objectives to the strategic plan. The enterprise risk management framework is geared to achieving objectives in four categories:
Strategic
High-level goals,
aligned with and
supporting their mission
Operations
Effective and efficient use of their resources
Reporting
Reliability of reporting
Compliance
Compliance with
applicable laws and
regulations
1
Risk Identification

KEY PERFORMANCE INDICATORS (KPI)
• % of customer attrition
• % of employee turnover
• Rejection rate
• Meantime to repair IT problems
• Customer order waiting time
• Profitability of customers by demographic segments
KPIs help you understand how well you are performing in relation to your strategic goals and objectives.
In order for KPIs to be effective, they need to be measurable.
1
Risk Identification

NUCLEAR INDUSTRY KEY PERFORMANCE INDICATORS
• U.S. Nuclear Power Plants have dramatically
improved performance in many areas of plant
operations including:
• Operating capacity
• Unplanned automatic reactor trips
• Collective radiation exposures
• The development and management of key
performance indicators has been the key driving
performance at nuclear power plants
1
Risk Identification

INDUSTRY PROGRESS WITH THE USE OF KPI
• Capacity Factors • 1980s typical nuclear reactor produced 63% of maximum
possible power
• Today nuclear reactors produce around 91%
• Unplanned Automatic Shutdowns • 1980s there were about seven per year
• Today median unplanned automatic shutdown rate value is zero
• Collective Radiation Exposures • Since 1980s collective radiation exposure has been reduced by
a factor of six
• BLS shows that it is safer to work at nuclear power plant than in manufacturing or real estate or finance sectors
1
Risk Identification

FUTURE KPIS IN NUCLEAR INDUSTRY
• Human Performance Indicators
• 80% of accidents involve culture, management and or
human performance
• Strong need to measure human performance
• Emergency Planning
• Work Management
• Corrective Actions
• High Radiation Area Controls
• Unplanned Dose Events
• Radioactive Material Found Outside
1
Risk Identification

KEY RISK INDICATORS (KRIS)
KRIs are leading indicators of risk to business performance. They give us an early warning to identify a potential event that may harm continuity of the activity or project.
% of suppliers with no business
continuity management
% of mission -critical
recovery plans not
exercised with the last 12
months
% turnover of mission - critical IT
personnel
% of mission –critical
business processes with
a backup / recovery
architecture
1
Risk Identification
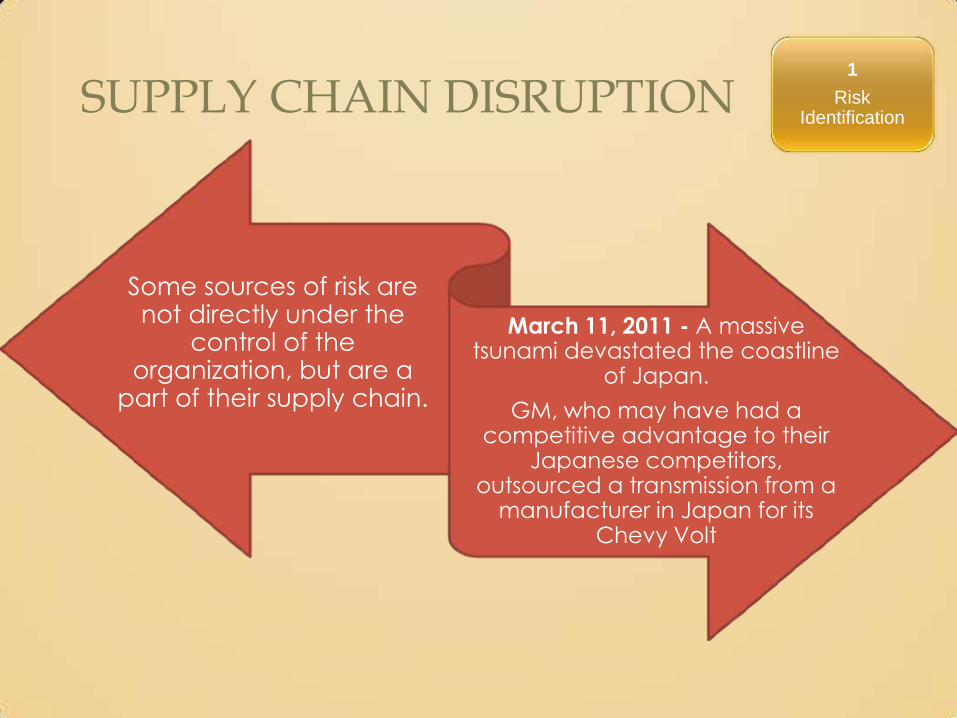
SUPPLY CHAIN DISRUPTION
Some sources of risk are not directly under the
control of the organization, but are a
part of their supply chain.
March 11, 2011 - A massive tsunami devastated the coastline
of Japan.
GM, who may have had a competitive advantage to their
Japanese competitors, outsourced a transmission from a
manufacturer in Japan for its Chevy Volt
1
Risk Identification

CASCADING EFFECTS
Business is interrupted
Loss of employees
Quality and productivity goes
down
Competitor takes market share due to business interruption
1
Risk Identification
SUPPLY CHAIN ASSESSMENT
• Determine critical supplies and suppliers
• Supplier profit & loss mapping
• Calculate financial loss scenarios
• Alternatives if supply chain fails
• Review mitigation plans
• Recommend improvements
1
Risk Identification

SUPPLY CHAIN RISK HEALTH CHECK
• Do you know who your critical suppliers are, and
how much their failure would impact your
company’s profits?
• Have you fully mapped your critical supply chains
upstream to the raw material level and downstream
to the customer level?
• Do you integrate risk management processes into
your supply chain?
1
Risk Identification

SUPPLY CHAIN RISK HEALTH CHECK
• Do you record details of supply chain incidents and recovery, to avoid future incidents?
• Do your tier 1 suppliers have business continuity plans that are stress tested for viability?
• Have you provided risk training to procurement/supply chain teams?
• Is risk on the agenda at performance meetings with strategic suppliers?
1
Risk Identification

SUPPLY CHAIN RISK HEALTH CHECK
• Are there systems for measuring financial stability of
critical suppliers?
• Are tier 1 production facilities and logistic hub
exposed to natural catastrophe?
• Is proactive supply chain risk management
integrated into your enterprise risk management
approach and business resiliency planning
1
Risk Identification

TOOLS AND TECHNIQUES
Tools and Techniques
Questionnaire & Risk Survey
Loss Histories
Financial Statements
Flowcharts
Personal Inspections Interview
Subject Matter Experts
Conduct HAZOP and
“what if” scenarios”
Define business or process
drivers of the organization
Review what is said about your organization on
social media networks
1
Risk Identification

CREATE A RISK REGISTER
Create A Risk
Register
Identify a potential risk
event Categorize
the risk event
Identify potential causes
Assign risk owner
Determine the likelihood
Determine the consequences
What is the financial impact
Risk treatment
Date to review risk
1
Risk Identification

SAMPLE RISK REGISTER 1
Risk Identification

SAMPLE RISK HEAT MAP
1
Risk Identification

RISK TORNADO DIAGRAM 1
Risk Identification

2. RISK ASSESSMENT
Root Cause Analysis
Find the root cause of a
potential risk event
Qualitative Assessment
Recognizes the source of the risk
event
Quantitative Assessment
Measures the value of the
impact
Risk Assessment
A process to
determine the
cause of the risk
event, the risk
event itself, and
the impact and
the velocity of
the risk event.
2
Risk Assessment

CAUSES OF RISK
Three Basic Causes Physical causes
A tangible or material item failed in some
way.
Brakes stop working on a car
Human causes
People did something wrong or did not do something required.
No one check the condition of the
brakes
Organization causes
A system, process or policy that people use to make decisions in
doing their work is faulty.
No procedure for checking the
maintenance of the cars
2
Risk Assessment

ROOT CAUSE ANALYSIS
Methods
The
“5-Whys”
Barrier Analysis
Change Analysis
Parent Analysis
Casual Factor Tree Analysis
Fish-Bone Diagram or
Ishikawa Diagram
Failure Mode Effect Analysis
Fault Tree Analysis
Management Oversight and
Risk Tree
2
Risk Assessment

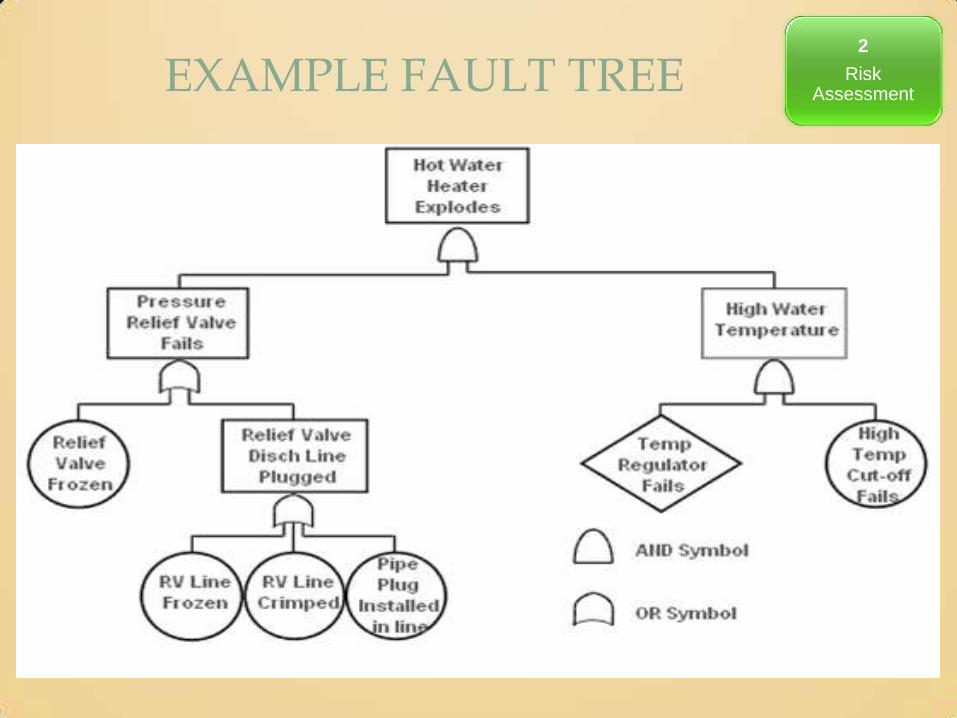
FAULT TREE ANALYSIS
Very useful in examining the
possible conditions that may lead to a
desired or undesired event
Top event will be placed at the top of
the tree and all subsequent events
that lead to the main event will be
placed as branches
Symbols provide a pictorial
representation of the event and how
it interacts with other events on the
tree
2
Risk Assessment
Fault Tree Analysis is a deductive method of logic moving from the
general to the specific that exams the possible conditions that may
led to or influence an undesirable or desirable event

SYMBOLS OF FAULT TREE ANALYSIS
A RECTANGLE INDICATES AND EVENT TO BE ANALYZED.
A CIRCLE INDICATES A BASIC FAULT EVENT OR PRIMARY FAILURE OF A COMPONENT. IT REQUIRES NO FURTHER DEVELOPMENT.
THE HOUSE IS USED FOR EVENTS THAT NORMALLY OCCUR IN THE SYSTEM. IT REPRESENTS CONTINUED OPERATION OF THE COMPONENT.
THE DIAMOND IS USED FOR NON PRIMAL EVENTS WHICH ARE NOT DEVELOPED FURTHER FOR LACK OF INFORMATION OR INSUFFICIENT CONSEQUENCE.
THE OVAL IS USED TO REPRESENT A CONDITION. IT DEFINES THE STATE OF THE SYSTEM THAT PERMITS A FAULT SEQUENCE TO OCCUR. IT MAY BE NORMAL OR RESULT FROM FAILURES.
THE AND GATE SERVES TO INDICATE THAT ALL INPUT EVENTS ARE REQUIRED IN ORDER TO CAUSE THE OUTPUT EVENT.
THE OR GATE SERVES TO INDICATE THAT ONE OR MORE OF THE INPUT EVENTS ARE REQUIRED TO PRODUCE THE GATED EVENT.
2
Risk Assessment
EXAMPLE FAULT TREE 2
Risk Assessment

RISK ASSESSMENT USING ROOT CAUSE ANALYSIS
Proactive method where RCA is used to forecast or predict probable risk events before they occur (Bonneville Power Administration)
After a risk event has occurred (Investigation of the Macondo Well Explosion)
Without RCA, one cannot determine what an effective corrective action for the defined problem will be.
The nature of RCA is to identify all contributing factors to a problem or event
Two Approaches
2
Risk Assessment

CASE STUDY: MACONDO WELL EXPLOSION
2
Risk Assessment

CASE STUDY: MACONDO WELL EXPLOSION
Decisions to change well design appeared to have been made by BP Macondo team without any formal risk analysis or internal expert review
Lack of proper risk communication between Haliburton and BP’s management processes to ensure that the cement was adequately tested
BP did not share important information with its contractors, or even sometimes internally with members of its own team and they didn’t share critical risk information with BP
Individuals often found themselves making critical decisions without a full appreciation for the context in which they were making decisions or without recognition that the decisions they were making were critical to the entire
operation
2
Risk Assessment

EXPLOSION FAULT TREE 2
Risk Assessment

INVESTIGATION FOUND EIGHT KEY FINDINGS FOR ACCIDENT
The annulus cement barrier did not isolate
the hydrocarbons
The shoe track barriers did not
isolate the hydrocarbons
The negative-pressure test
was accepted although well integrity had
not been established
Influx was not recognized
until hydrocarbons
were in the riser
Well control response
actions failed to regain
control of the well
Diversion to the MGS resulted in gas venting
onto the rig
The fire and gas system did
not prevent hydrocarbon
ignition
The blow out preventer
(BOP) emergency
mode did not seal the well
2
Risk Assessment

USING RCA FOR FORECASTING BUSINESS RISKS
• Bonneville Power Administration is a self-financed governmental agency that was established in 1937 by the Bonneville Project Act
• BPA funds it activities through the sales of power that is generated by entities in the Federal Columbia River Power System which includes 31 federal dams, one nuclear power plant and other nonfederal power generation facilities
• Operational risks posed by fluctuations in river flows and electric market prices, net revenues that result from underlying surplus or deflect energy positions are inherently uncertain
2
Risk Assessment

BPA STRATEGIC DECISION PROCESS
• BPA’s strategic goals are clearly defined, measurable, and reflect the agency’s level of tolerance for risk taking activities
• Existing and emerging risks are dynamically identified and managed
• Decisions and policy are based on a complete and shared understanding of objectives and a robust consideration of risks
• Management of risk-taking activities is an integral part of BPA culture
2
Risk Assessment

BPA USES ROOT CAUSE ANALYSIS
Hybrid of two RCA methods: the 5 Whys and the Fishbone diagram
• 5 Whys is a question-asking method used to explore the cause/effect relationships underlying a particular problem, with the goals of determining a root cause of a defect or problem
• Fishbone Diagram identifies many possible causes for an effect or problem and groups causes into categories of: people, methods, machines, materials, measurements, and environment
2
Risk Assessment

SAMPLE FISHBONE DIAGRAM
2
Risk Assessment

RCA HELPS DETERMINE PROPER MITIGATION STRATEGIES
• BPA realizes that to select the correct risk controls
and risk responses to a particular risk event, it’s
necessary to focus on root causes of the potential
risk event instead of treating just the symptoms of
the risk event
• By doing this, an organization is more likely to be
effective in mitigating the effects of risks around the
event and on achieving their ERM performance
goals that align to the BPA strategic goals
2
Risk Assessment

QUALITATIVE ANALYSIS
Positive Fault Tree Analysis
Will identify the events necessary to achieve a top desired event for example
no accident in manufacturing facility
Negative Fault Tree Analysis
Constructed to show those events or conditions that will lead to a top undesired risk event such as a fire in the
manufacturing facility
2
Risk Assessment
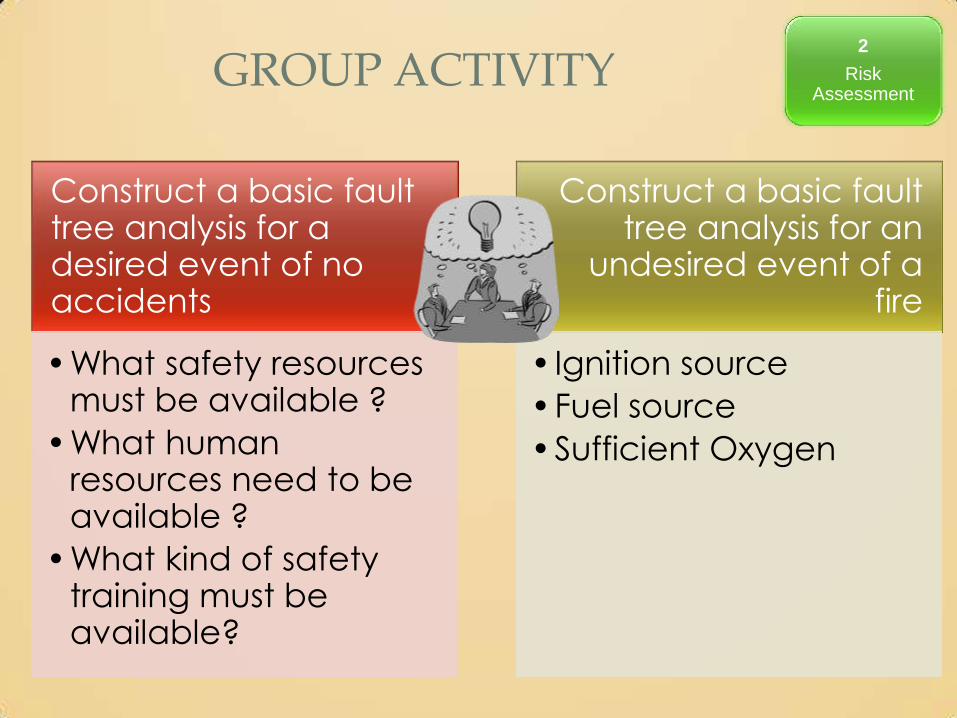
GROUP ACTIVITY
Construct a basic fault tree analysis for a desired event of no accidents
•What safety resources must be available ?
•What human resources need to be available ?
•What kind of safety training must be available?
Construct a basic fault tree analysis for an
undesired event of a fire
• Ignition source
•Fuel source
•Sufficient Oxygen
2
Risk Assessment

QUANTITATIVE ANALYSIS
When the likelihood of an event is known and a probability value has been assigned, then analysis of these events on a fault tree will also yield quantitative results.
Financial impact can be added to each stage of the Fault Tree Analysis.
Risk correlation can be demonstrated.
2
Risk Assessment

STATE OF WASHINGTON’S NINE STEP APPROACH TO ROOT CAUSE ANALYSIS
Verify the incident and define the
problem
Map a timeline of events
Identify critical events
Analyze the critical event’s
cause and impact
Identify root causes
Support each root cause with evidence
Identify and select the best solutions
Develop recommendations
Track implementation of
solutions
2
Risk Assessment

3. RISK ANALYSIS
Understand
Risk aggregation and risk
correlation in an organization’s risk portfolio
Determine
The interrelationship of risk exposures
to a potential risk event
Formulate
The best risk strategies for the
organization from risk
assessments
3
Risk Analysis

DEPARTMENT OF HOMELAND SECURITY
DHS plays a leadership role in the Nation’s unified effort to manage risk working across the homeland security enterprise which includes Federal, state, local, tribal, territorial, non-governmental and private sector entities. As part of the analysis in their ERM program, DHS used an integrated risk management structure to share risk information and analysis. The goal of using integrated risk management structure is to be able to work with its partners to address uncertainty inherent in their complex mission space, and help make the tough decisions necessary to keep the nation resilient and secure with limited resources.
3
Risk Analysis

DHS ANALYSIS TOOLS
DHS uses Influence Diagrams to analyze the
interrelationships and interdependencies of risks across
the enterprise.
3
Risk Analysis

DHS ANALYSIS TOOLS
DHS uses analytic tools like RAPID-Risk Assessment Process for Informed Decision-Making to manage risks associated with their strategic goals.
3
Risk Analysis

VALUE OF DATA ANALYSIS TO DHS
Data analysis allows for more transparent and defensible decisions.
Contextualizes homeland security threats, showing which are the most likely and which have the highest impact.
Helps prioritization decisions among terrorism, natural disasters, cyber, pandemics, and border security hazards.
Provides a performance measure for programs across the homeland security mission space.
Identifies opportunities for reducing risk exposures of potential risk events.
Allows for understanding of the impact of combined risk exposures taking place at the same time.
3
Risk Analysis

4. IMPLEMENTATION
Implementation - incorporating an ERM structure, practices, and strategies to
fulfill the goals of the organization.
ERM framework
Risk controls
Risk champions and risk centers
Risk communication structure
Crisis management protocol
Business Continuity
4
Implementation

RISK CONTROLS
IT Systems Financial & Operations
Property & Assets Safety & Liability
Some Areas for Risk
Controls
Management is
responsible for
implementing
appropriate
controls to
reduce risk and to achieve
operational
objectives.
4
Implementation

RISK CHAMPIONS AND RISK CENTERS
Risk Champions
• Accountable for ensuring accuracy within their department or business unit around the identification, assessment, management and monitoring of risk
• They are the eyes and ears of risk information for the risk manager who is in charge of assessing risk across the enterprise
• Not necessarily responsible for performing the actual risk management activities
Risk Center
• A department or unit within the organization charged with the risk exposures that are related to their duties and responsibilities
4
Implementation

RISK CHAMPIONS AND RISK CENTERS AT INTUIT
CRO and ERM program office have ownership and accountability for Intuit’s ERM program and drive Intuit’s ERM capabilities
Ownership and accountability for identified risks are shared by executive and business unit level leaders
Risk communication is not only to report progress, but also so that business units can share and leverage risk knowledge
“When we talk
about growth
strategies for the
company, we talk
deliberately
about both risks
and
opportunities” Janet Nasburg, Chief Risk Officer at Intuit
4
Implementation

ANNUAL ASSESSMENTS AT INTUIT
Annual assessments cycles have been integrated with the strategic planning process:
Began tracking key performance indicators for each strategic risk
Established monitoring and reporting processes for risk trending and risk activities
Now have robust ERM program to monitor strategic, operational, market / business and financial and compliance risks
4
Implementation

RISK COMMUNICATION STRUCTURE
Simple State System
The event can be resolved through routine
decisions
Complicated State System
The event is more difficult
to resolve than a simple system, but it not unusual
Complex State System
The event is unusual, and
potentially critical to the organization
Chaotic State System
The event is a dramatic,
unforeseen situation that threatens the organization’s
survival
4
Implementation
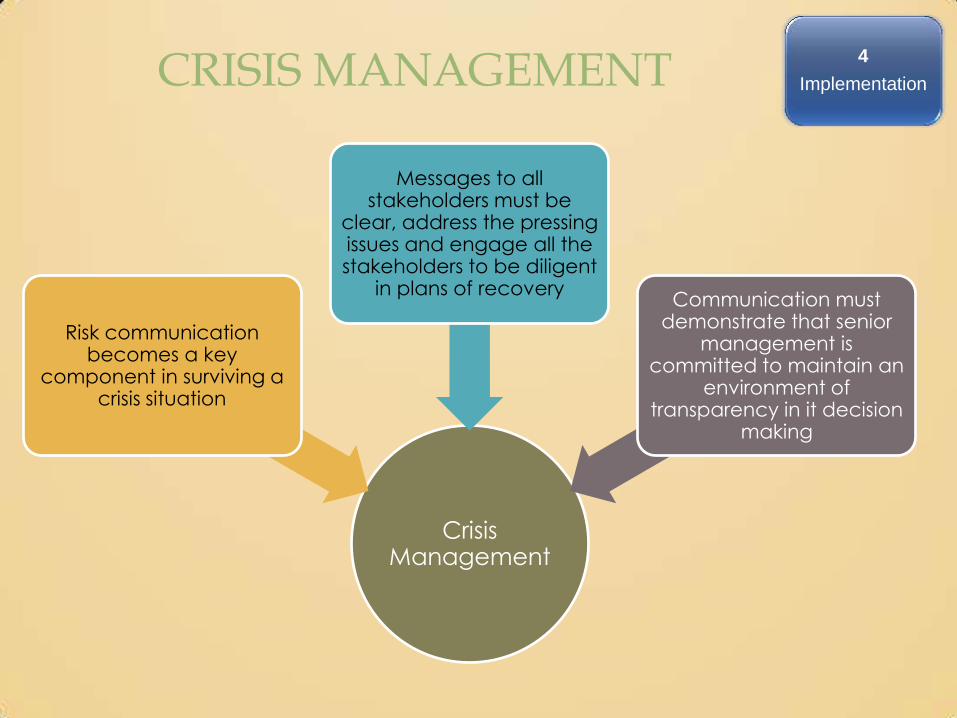
CRISIS MANAGEMENT
Crisis Management
Risk communication becomes a key
component in surviving a crisis situation
Messages to all stakeholders must be
clear, address the pressing issues and engage all the stakeholders to be diligent
in plans of recovery Communication must
demonstrate that senior management is
committed to maintain an environment of
transparency in it decision making
4
Implementation

SF ALL-HAZARDS STRATEGIC PLAN
• The City and County of San Francisco’s Strategic Plan is intended to enhance the City’s ability to detect, prevent, respond to and recover from acts of terrorism and natural and human-caused disasters through development of a single common preparedness vision and strategy
• The Strategic Plan was development in close collaboration with the City’s emergency management and homeland security stakeholders
• There are 20 strategic goals
4
Implementation

STRATEGIC GOALS FOR EMERGENCY MANAGEMENT AT SFC
• Strategic Goal #14 Improve chemical, biological, radiological, nuclear and explosive/weapons of mass destruction/hazardous materials response and decontamination capabilities
• Objective# 1-Conduct assessments of City’s and region’s chemical,
biological, radiological, nuclear explosive, weapons of mass destruction/hazardous material response & decontamination resources and capabilities including State and Federal assets
• Objective #2 Test the chemical, biological, radiological, nuclear, and explosive/weapon of mass destruction/hazardous materials response and decontamination resources & capabilities through exercise, specially the ability to provide pre-hospital care at the incident & ability to decontaminate the deceased
4
Implementation

KPIS FOR STRATEGIC GOAL # 14
• List of regional chemical, biological, radiological, nuclear and explosive/weapons of mass destruction/hazardous materials response resources is developed
• Plan and procedures for mass decontamination are incorporated in the City’s Emergency Response Plan
• Number of exercises held that test mass decontamination capabilities
4
Implementation

STRATEGIC PLAN IMPLEMENTATION ROADMAP
• Roadmap document describes specific activities or milestones that the City will undertake to accomplish each of the strategic goals
• Development of a work plan and actual implementation of the strategic goals will be the responsibility of the coordinating lead agencies
• City departments are involved in scores of improvement efforts targeted at the operational and tactical level
4
Implementation

ELEMENTS OF CONTINUITY PLAN
Statement of acceptable level of
functioning
Recovery time objectives, resources
needed and potential failure
points
Task and activities required
Procedures and processes
Supporting documentation and
information
Structure to support the plan
Description of personnel duties and
responsibilities
Describe interdependencies among the various
departments
4
Implementation

IDENTIFY CRITICAL ACTIVITIES
• Proactive risk management
• Identify vulnerabilities and minimize uncertainty
• Appropriate focused attention
• Efficient resource and capital allocation
• Informed decision making
4
Implementation

BUSINESS IMPACT ANALYSIS
• Key Business Process Analysis
• Business Value Chain
• Supply Chain Mapping & BI Modeling Output
• Mission Critical Activities
4
Implementation

BUSINESS CONTINUITY MANAGEMENT
• Determine mission critical activities
• Evaluation of GAP between recovery and customer loyalty
• Safety and security plans
• Emergency plans
• Crisis management plans
• Audit & testing of existing plans
4
Implementation

5. MONITORING
Monitoring involves communication of risk both upstream and downstream across the organization. It includes periodic reporting and follow-up on the risks by various levels of management, risk committees, and internal auditors
KPIs and KRIs are a valuable way to monitor key risks linked to improved cash flows and earnings
5
Monitoring

TOOLS USED FOR MONITORING
Spreadsheets
Like risk registers
Balanced Scorecards
Captures company’s strategy by
•Customer
•Internal Processes
•Innovation and Learning
•Financial
Dashboards
Pictorial reporting
of risks
Governance Risk and
Compliance Software
Focus on audit and
compliance
Enterprise Risk Management
Software
ERM focus on software solutions
5
Monitoring

BALANCED SCORE CARDS AT UNIVERSITY OF CALIFORNIA
The Customer Perspective
emphasizes satisfying the needs of customers.
The Financial Perspective
emphasizes the stakeholder concern
about how efficient and effective the unit is at
using its resources.
The Internal Business Perspective
Emphasizes excellence at performing internal
processes and in employee competencies.
The Innovation & Learning Perspective
emphasizes continuous improvement and the
creation of value.
Divisions and units within the campuses and locations will sometimes
need to define goals and objectives as a first step in their
implementation of ERM
5
Monitoring

BALANCED SCORECARDS AT UNIVERSITY OF CALIFORNIA
The “Scorecard” measures the
achievement of objectives.
Begin by making a list for each objective of
what is measured currently and what else
could be measured.
Select those measures that present the most complete indication that the objective is
being achieved.
Try to limit the number of measures to no more
than six per objective and be sure to
measure results and desired outcomes,
rather than processes. The measures you
select will be your Key Performance
Indicators.
5
Monitoring

CRITICAL RISK: MITIGATION PLAN
5
Monitoring

CASE STUDY: WALMART
Walmart also uses these metrics to determine the value added by the
ERM process.
Metrics used to track performance on risk and to determine the company’s
progress in managing the risk.
Developed KPI and KRI metrics incorporated in a balanced
scorecard.
5
Monitoring

6. EVALUATION
Ascertaining the strengths and weaknesses of the ERM program with regard to the
organization’s strategic goals
Risk Optimization / Value Creation
Return on Investment ERM’s Role in Governance
Evaluation
6
Evaluation
RISK OPTIMIZATION
Balance between taking on too much risk
and not taking on enough risk to explore
opportunities for growth
Explore various risk-return outcomes
Evaluate risk controls in place and decide the
best use of financial resources to provide needed protection
6
Evaluation
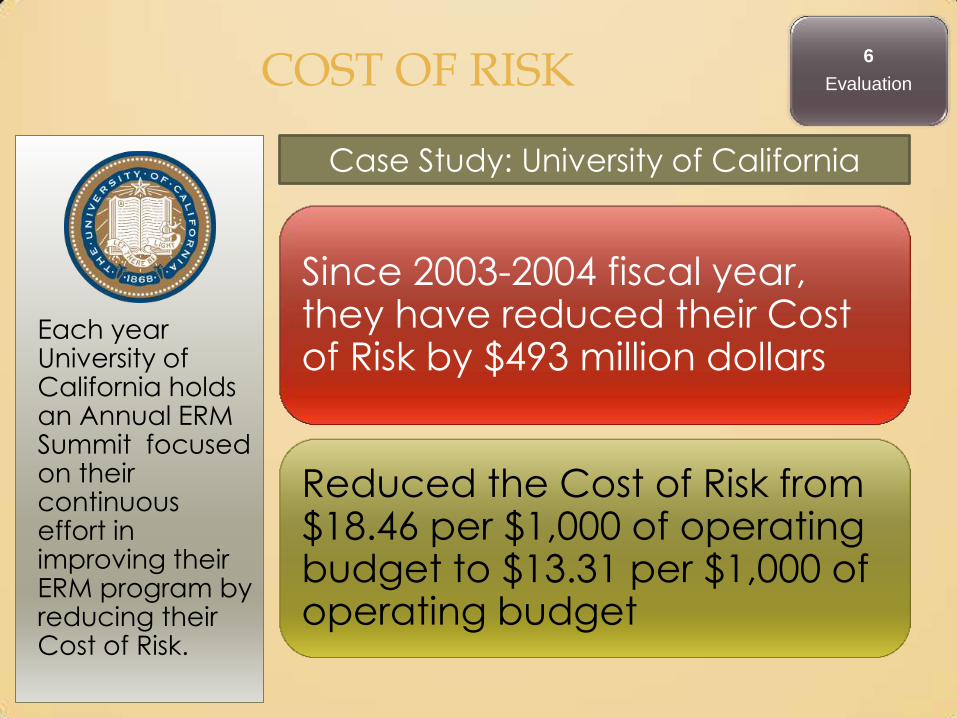
COST OF RISK
Since 2003-2004 fiscal year, they have reduced their Cost of Risk by $493 million dollars
Reduced the Cost of Risk from $18.46 per $1,000 of operating budget to $13.31 per $1,000 of operating budget
Each year University of California holds an Annual ERM Summit focused on their continuous effort in improving their ERM program by reducing their Cost of Risk.
Case Study: University of California
6
Evaluation

UNIVERSITY OF CALIFORNIA’S COST OF RISK
• Cost of Risk- Quantitative measurement of the total
costs ( losses, risk control costs, financing costs, and
administrative costs ) associated with the risk
management function, as compared to a
business’s sales assets, and number of employees
• The purpose of such a comparison is to determine
whether the total costs of the risk management
function are increasing, decreasing, or remaining
constant as a function of the business’s economic
activity
6
Evaluation

UNIVERSITY OF CALIFORNIA’S COST OF BORROWING
• Cost of Borrowing-On July 22, 2009 Standard & Poor’s ( S & P ) released a progress report regarding enhancement of its global rating process for non-financial companies by including enterprise risk management assessments in its rating
• S & P has recognized UC for its ERM program and stated “ The UC has implemented a system-wide enterprise risk management information system which, in our opinion, is a credit strength”
• S&P gave UC a higher rating in Fall 2010 which is a $ 10 million dollar savings on their debt load
6
Evaluation

UC CREATES EFFICIENCY
• The creation of automated reports within the ERMIS
has increased workforce efficiency.
• Reduced the staff time spent in updating
information provided monthly to University
leadership
• More reliable information is updated more
frequently
6
Evaluation

UC REDUCES REDUNDANCY
• Eliminating same or similar reports being developed
and maintained with the benefit of shared
knowledge at different divisions, departments,
schools, campuses, medical center and other
locations
• ERMIS enables sharing of analyses and information
easily and efficiently across multiple different
locations
6
Evaluation

RISK GOVERNANCE
National Association of Corporate Directors report, “Risk Governance: Balancing Risk and
Reward”
Guidance principles for board risk oversight
Key drivers of success and
risks in the company’s
strategy
Crafting the right
relationship between the board and its
standing committees as to risk oversight
Establishing and providing appropriate resources to support risk
management systems
Monitoring potential risks in the company’s
culture and incentive systems
Developing an effective risk
dialogue with management
6
Evaluation

GM’S EVOLVING BOARD RISK GOVERNANCE
• Prior to August 3, 2010, GM had an Investment Fund
Committee, which was dissolved and ultimately
replaced with a Finance and Risk Committee
• This new committee focuses on two major
objectives. Under finance section of the charter it
focuses on the financial policies, strategies, and
capital structure. In the risk management section of
the charter, it focuses on the company’s risk
management strategies and policies
6
Evaluation

RISK GOVERNANCE RESPONSIBILITIES
• GM’s Finance and Risk Committee Charter states that the risk assessment and risk management are the responsibility of the company’s management
• The Committee’s risk responsibility is one of oversight and review
• Composition of Finance and Risk Committee is comprised of two insiders, its CEO, its Vice President of Strategy and Business Development and three independent directors
6
Evaluation

COORDINATING WITH AUDIT COMMITTEE
• The independent directors include the chairs of both the audit and executive compensation committee
• Audit Committee and Finance and Risk Committee are receiving all information necessary to permit them to fulfill their duties and responsibilities with respect to oversight of the risk assessment and risk management
• Executive Compensation Committee also on the Finance and Risk Committee, this ensures that GM’s compensation arrangements are designed to provide incentives that are consistent with the interests of GM’s stockholders
6
Evaluation

EXECUTIVE RISK COMMITTEE
The Executive Risk Committee Provides the Board of Directors with:
A structure that provides the board with the appropriate information that defines the
firm’s risk profile
A system that provides an audit of the effectiveness of
the risk management process
A system that affords an evolving understanding of key risks to the company
“Boards are now finally asking management about the nature of
the risk information process in place. Boards want to gather information
about new or emerging risks and the extent to which these risks require a more in-depth analysis. This is being done to ensure future opportunities
and threats to the company’s performance are appropriately
managed.”
John Bugalla, James Kallman, Chris Mandel and Kristina Narvaez
The Corporate Board
6
Evaluation


ZURICH FINANCIAL SERVICES GROUP
• Insurance-based financial services provider
• Fourth-largest Property-Casualty Insurer
• Global network of subsidiaries and offices in North America and Europe as well as in Asia Pacific, Latin America and other markets
• Approximately 60,000 employees
• Serving customers in more than 180 countries and territories

ERM OBJECTIVES AT ZURICH
• Protect the capital base by monitoring that risks are not taken beyond the Group’s risk tolerance level
• Enhance value creation and contribute to an optimal risk-return profile by providing the basis for an efficient capital deployment
• Support the Group’s decision-making processes by providing consistent, reliable and timely risk information
• Protect Zurich’s reputation and brand by promoting a sound culture of risk awareness and disciplined and informed risk taking

QUALITATIVE METRICS AT ZURICH INSURANCE
Qualitative Method
• Total Risk Profiling
• Proprietary tool for risk ( Zurich Risk Room )
• 3-5 years time horizon
Operational Risk & Control
• Integrated Risk & Control framework and methodology
• Top Down Scenarios
• Operational Risk Assessments
• Issue Register
• Loss Events

QUANTITATIVE METRICS AT ZURICH INSURANCE
Risk Tolerance • Defines and informs risk limits
• Takes a shareholder view
• Capital-at-Risk
• Earnings-at Risk
• Financial flexibility
Risk-Based Capital • Amount of capital based on an assessment of risks that a
company should hold to protect customers against adverse development
• Sets target capitalization at AA level
• Takes a policyholder view ( 1/2000 years )

TOTAL RISK PROFILING
• Identify potential risk issues
• Develop risk scenarios
• Assess current rating
• Define risk priority boundary and prioritize risk scenarios
• Develop improvement actions for the prioritized scenarios
• Key risks and actions are loaded into Planview

DEVELOP RISK SCENARIOS
Vulnerability • What could happen ?
• Where could it happen ?
• What were the controls ?
Trigger • How could it happen?
• Why would it happen?
• When would it happen?
Consequences • How big would it be?
• How bad would it be?
• How much would it be?

CASE STUDY-LEGO GROUP
LEGO Group developed risk management in four steps:
• Step 1 Enterprise Risk Management includes financial, operational, hazard, and strategic risks
• Step 2 Monte Carlo Simulation were added to understand the financial performance volatility and drivers behind it to integrate risk management into the budgeting and reporting process

STRATEGIC RISK MANAGEMENT AT LEGO
• Step 3 Active Risk and Opportunity Planning where
business projects go through a systematic risk and
opportunity process as part of preparing the
business case before final decisions about the
projects have been made.
• Step 4 Preparing for Uncertainty where
management tries to ensure that long-term
strategies are relevant for and resilient to future
changes that may very well differ from those
planned for.

RETURN ON INVESTMENT
• 20% average growth from 2006 to 2010 in a market
with 2%to 3% growth
• Grown from 17% return on sales to 31% on sales in
2010
• Reasons for the Turnaround
• Monte Carlo Simulation has shown us what uncertainty is
• Risk appetite has shown us what the uncertainty is
• Making bigger supply chain investments
• Integration of risk management into strategic planning

CASE STUDY-SAFEWAY
Safeway is a grocery store chain that is a Fortune #60 company with sales of $40 billion in 2010
• Significant operating companies are VONS, Dominick’s,
Randall, Tom Thumb, Genuards, Pavillions, Carrs, and Safeway
• GroceryWorks.com is their online grocery and delivery services
• Blackhawk Network Holding Inc. which is a third provider of third-party gift and related prepaid cards
• Casa Ley-Safeway has a 49 percent ownership of Casa Ley which operates 137 food and general merchandise stores in Western Mexico

RISK IDENTIFICATION
Why is risk identification so important to Safeway?
• Shareholders demand that management
adequately identify all material risks facing the
organization
• Auditing protocols are beginning to require
organizations to report risks in a forward looking
context
• Market analysts are demanding that corporate
management strengthen their risk disclosure
capabilities
RISK IDENTIFICATION
• Financial and operational managers are
increasingly being held accountable for managing
their operations and risks on a portfolio basis
• Failure to anticipate, analyze and possibly exploit
risk opportunistically could places the company at
a strategic disadvantage

RISK PARADIGM AT SAFEWAY
• Risk is capital
• Risk has both an upside and downside potential. The
question is which is most valuable to the corporation?
• Risks do not exist in isolation. They should be managed
that way. Risks are better managed in portfolios
• There exists an “efficient frontier” upon which risk and
reward are reflected in risk assumptions and transfer
decisions

STRATEGIC RISKS AT SAFEWAY
• What are the material risks to the
organization?
• How does the corporation reduce the
volatility of risk?
• Are the types of internal risk mitigation
techniques appropriate to the risks the
organization faces?

STRATEGIC RISKS AT SAFEWAY
• If we think of risk as capital, what is the economic value of risk transfer vs. risk assumption/exploitation upon shareholder value?
• If the organization understands it’s risks and insurance was never invented, what risk mitigation methods would a corporation use?’
• How are their risks exploitable to create a competitive advantage?
• How does Safeway create new value to the organization?
HORIZONTAL INTEGRATION AT SAFEWAY
• Horizontal integration in marketing is generally considered to be defined as a company's efforts to buy out various operations of the same kind, that is, the competition.
• Conversely the advantage of this is to capture markets by running those added companies as a part of the main corporation's larger central operation.
• For example, at present, Safeway is the controlling concern in the Carrs food stores in Alaska, Randalls and Tom Thumb stores in Texas, Vons in Southern California and Nevada, as well as Genuardi's in the Philadelphia. .
SAFEWAY’S VERTICAL INTEGRATION
• Vertical integration is when a corporation takes on
the nature of other services required to assist in the
marketing of the corporation's output, thus gaining
savings in areas such as packaging and
transportation.
• For example Safeway has vertically integrated its
business by operating transportation and
warehousing operations within their parent
companies structure.

SAFEWAY’S VERTICAL INTEGRATION
• Safeway owns its own transportation system
• Operating their own trucking line helps to get control of costs and distribution concerns, this is one of the benefits to this kind of vertical integration.
• Another benefit is found in bulk buying power. With a warehouse, larger loads of goods can be bought at lower prices.

SAFEWAY’S VERTICAL INTEGRATION
• This bulk buying concept is well known in the
grocery industry and relates to the idea of
economies of scale.
• The savings found in buying in bulk can be passed
along to the consumer making the store more
competitive. In the past, at certain times of the
year, some products may have been straight
hauled by the grower to a local store.

SAFEWAY’S VERTICAL INTEGRATION
• Straight hauled goods are typically fruits or
vegetables that have short marketing windows.
• A marketing window is the period of time during
which the product traditionally sells or moves the
best.
• A marketing window may also refer to the period of
time a product can be maintained for sales before
spoilage destroys it. This is also known as shelf life.

SAFEWAY’S VERTICAL INTEGRATION
• Pumpkins are a good example, the marketing window for this highly specialized (and perishable) product is in October.
• To save on marketing time and over the dock charges a produce grower may contact the store and ship direct (straight hauled) rather than through the warehouse.
• Christmas Trees are another example of a commodity with a short marketing window.

STRATEGIC LOCATION OF STORES
• The location for stores such as these are typically found on the basis of marketing models that take into account, the core population, business location and other issues associated with the demographic of a market area or tributary.
• Ultimately the company makes a decision on the size of the store based on the market tributary it can draw from. It is not chance that a nearly comparable size super store (Albertsons) is not far from this Safeway.
• Competitive linkages are normally planned within the store's locational strategies which, by the way, are in the "top secrete" file drawer in the store's headquarters.

STRATEGIC LOCATION OF STORES
• Basically, there is a demographic gravitational
attraction that this store will reflect based on the
functions it offers, its size and the marketing model
that's used to establish the store's location.
• The drawing power of a store is influenced by the
number of competing stores in the area and the
demographics of the population of the market in
which it draws from.

GROUP ACTIVITY
• What are some of the horizontal risk challenges for
Safeway?
• What are some of the vertical risk challenges for
Safeway?
• What are some of the risk challenges in the location
of Safeway stores ?


