
State of the U.S. Multifamily Market
Q3 2016 Review and Forecast

Agenda
Macro Overview
Apartment Market Fundamentals
Apartment Rent Trends
Capital Markets

Macro Overview

Real GDP Growth (SAAR)
Sources: BEA; CoStar Portfolio Strategy As of 16Q4
2.9%
(6%)
(4%)
(2%)
0%
2%
4%
6%
11 12 13 14 15 16
GDP Growth

GDP Growth by Sector
Sources: BEA; CoStar Portfolio Strategy As of 16Q4
(6%)
(4%)
(2%)
0%
2%
4%
6%
11 12 13 14 15 16
Contribution to GDP Growth

GDP Growth by Sector: Net Exports
Sources: BEA; CoStar Portfolio Strategy As of 16Q4
(6%)
(4%)
(2%)
0%
2%
4%
6%
11 12 13 14 15 16
Contribution to GDP Growth
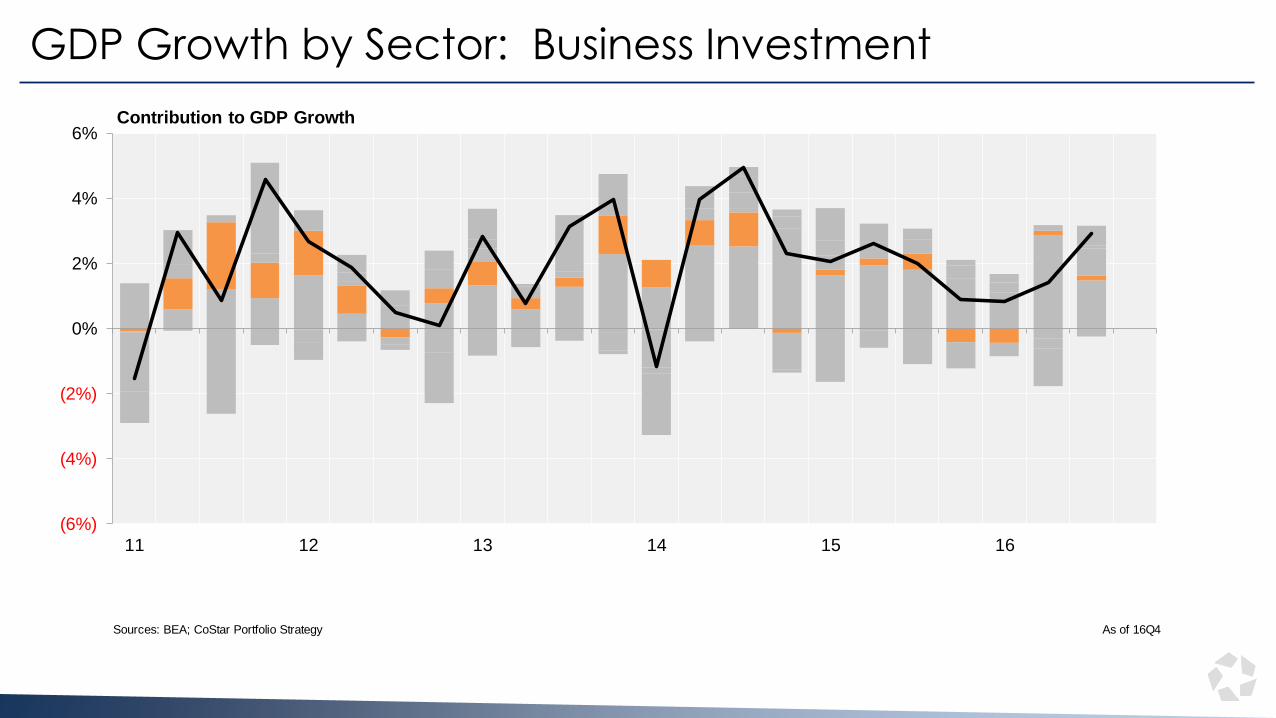
GDP Growth by Sector: Business Investment
Sources: BEA; CoStar Portfolio Strategy As of 16Q4
(6%)
(4%)
(2%)
0%
2%
4%
6%
11 12 13 14 15 16
Contribution to GDP Growth

GDP Growth by Sector: Government
Sources: BEA; CoStar Portfolio Strategy As of 16Q4
(6%)
(4%)
(2%)
0%
2%
4%
6%
11 12 13 14 15 16
Contribution to GDP Growth

GDP Growth by Sector: Residential Investment
Sources: BEA; CoStar Portfolio Strategy As of 16Q4
(6%)
(4%)
(2%)
0%
2%
4%
6%
11 12 13 14 15 16
Contribution to GDP Growth

Too Much Supply? Or Not Enough…
31-Mar-65
30-Jun-65
30-Sep-65
31-Dec-65
31-Mar-66
30-Jun-66
30-Sep-66
31-Dec-66
31-Mar-67
30-Jun-67
30-Sep-67
31-Dec-67
31-Mar-68
30-Jun-68
30-Sep-68
31-Dec-68
31-Mar-69
30-Jun-69
30-Sep-69
31-Dec-69
31-Mar-70
30-Jun-70
30-Sep-70
31-Dec-70
31-Mar-71
30-Jun-71
30-Sep-71
Source: Census Bureau; CoStar. Current totals are annualized based on prior years. As of November 2016
0
500
1,000
1,500
2,000
2,500
1968 1970 1972 1974 1976 1978 1980 1982 1984 1986 1988 1990 1992 1994 1996 1998 2000 2002 2004 2006 2008 2010 2012 2014 2016
Multifamily Single Family
Multifamily Average: 399,000 new units per year
Total New Housing Construction (000s of Housing Units)
Average: 1,419,000 new units per year

Too Much Supply? Or Not Enough…
31-Mar-65
30-Jun-65
30-Sep-65
31-Dec-65
31-Mar-66
30-Jun-66
30-Sep-66
31-Dec-66
31-Mar-67
30-Jun-67
30-Sep-67
31-Dec-67
31-Mar-68
30-Jun-68
30-Sep-68
31-Dec-68
31-Mar-69
30-Jun-69
30-Sep-69
31-Dec-69
31-Mar-70
30-Jun-70
30-Sep-70
31-Dec-70
31-Mar-71
30-Jun-71
30-Sep-71
Source: Census Bureau; CoStar. Current totals are annualized based on prior years. As of November 2016
0
500
1,000
1,500
2,000
2,500
3,000
3,500
4,000
1968 1970 1972 1974 1976 1978 1980 1982 1984 1986 1988 1990 1992 1994 1996 1998 2000 2002 2004 2006 2008 2010 2012 2014 2016
Multifamily Single Family Change in Households
Total New Housing Construction (000s of Housing Units) and Change in Households

Too Much Supply? Or Not Enough…
31-Mar-65
30-Jun-65
30-Sep-65
31-Dec-65
31-Mar-66
30-Jun-66
30-Sep-66
31-Dec-66
31-Mar-67
30-Jun-67
30-Sep-67
31-Dec-67
31-Mar-68
30-Jun-68
30-Sep-68
31-Dec-68
31-Mar-69
30-Jun-69
30-Sep-69
31-Dec-69
31-Mar-70
30-Jun-70
30-Sep-70
31-Dec-70
31-Mar-71
30-Jun-71
30-Sep-71
Source: Census Bureau; CoStar. As of November 2016
(4,000)
(3,000)
(2,000)
(1,000)
0
1,000
2,000
3,000
4,000
1968 1970 1972 1974 1976 1978 1980 1982 1984 1986 1988 1990 1992 1994 1996 1998 2000 2002 2004 2006 2008 2010 2012 2014 2016
Trailing 5-Year Housing Construction less Household Formation
Too much housing relative to household formation over previous 5 years
Not enough housing relative to household formation over previous 5 years


Homeownership Ticked Up In The Third Quarter
60
60
60
60
61
61
61
61
62
62
62
62
63
63
63
63
64
64
64
64
65
65
65
65
66
66
Sources: Moody's Analytics; U.S. Census Bureau (CPS/HVS); CoStar Portfolio Strategy As of 16Q3
30
32
34
36
38
40
42
44
46
60%
61%
62%
63%
64%
65%
66%
67%
68%
69%
70%
94 96 98 00 02 04 06 08 10 12 14 16
Renter Households U.S. HO Rate
Homeownership Rate Renter Occupied Households (Millions)
H.O. Rate in 2004 Peak : 69.2%2016 Q3 H.O. Rate : 63.5%
Increase in Renter HH's : 10.3MIncrease due to HH Formation: 3.5M
Increase due to Change in H.O. Rate: 6.8M
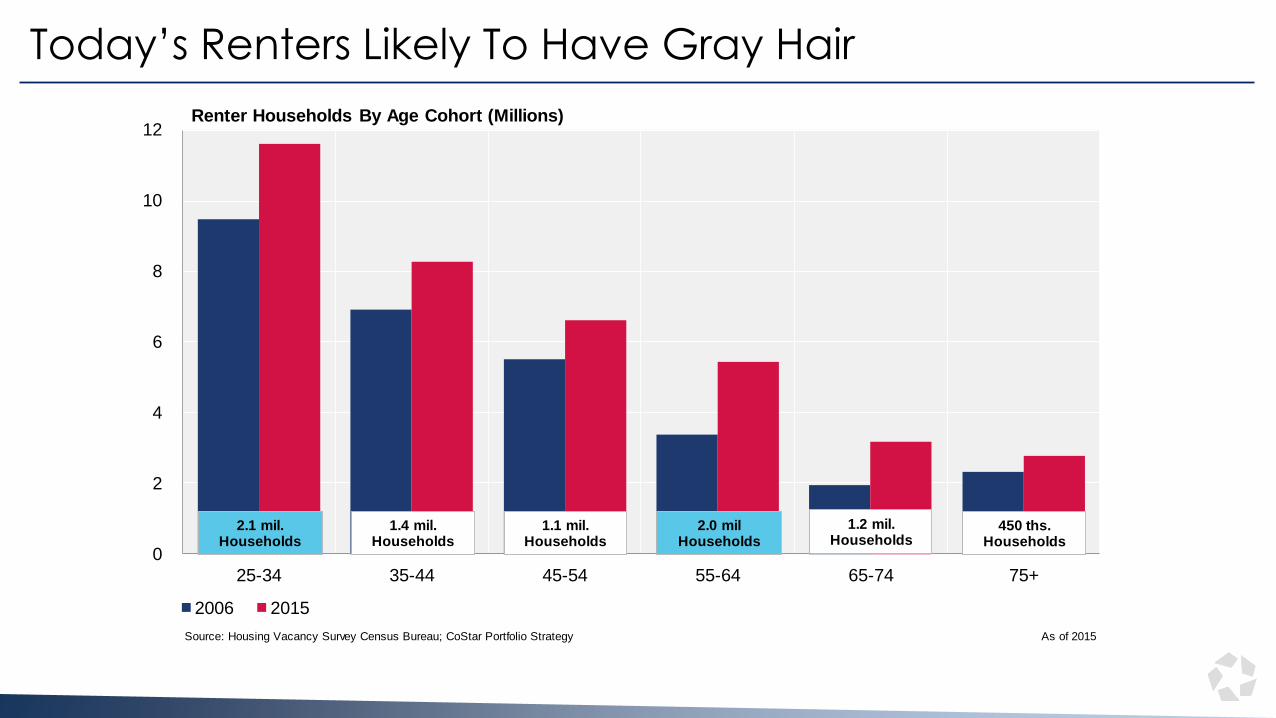
Today’s Renters Likely To Have Gray Hair
25-34
35-44
45-54
55-64
65-74
75+
Source: Housing Vacancy Survey Census Bureau; CoStar Portfolio Strategy As of 2015
0
2
4
6
8
10
12
25-34 35-44 45-54 55-64 65-74 75+
2006 2015
1.2 mil.Households
Renter Households By Age Cohort (Millions)
2.1 mil.Households
1.4 mil.Households
1.1 mil.Households
2.0 milHouseholds
450 ths.Households

Potential Upside Demand For Institutional Landlords?
Renter-occupied housing units:
41423632
114271804
Renter HouseholdsSingle Family or Non-CRE
2185843055.1%
Sources: U.S. Census ACS Survey; CoStar Portfolio Strategy As of 2015
55.1%
44.9%
20%
30%
40%
50%
60%
70%
0
5
10
15
20
25
Single Family or Non-CRE 5+ Units
Renter Occupied Households (Millions) % Of Renter Occupied
# Of Renter Households By Unit Type % Of All Renter Households By Unit Type

Petula Clark Was Right: “Downtown”….
CBD
Urban
Suburban
Sources: Neustar; CoStar Portfolio Strategy As of 16Q4
**Analysis limited to National Index (54 major metros)
CBDSecondary Core
Urban
Prime Suburban
Suburban
(1.0%)
(0.8%)
(0.6%)
(0.4%)
(0.2%)
0.0%
0.2%
0.4%
0.6%
4% 5% 6% 7% 8% 9% 10% 11% 12% 13% 14% 15%
Change In Share Of Renter Households (2010-16Q4)
Percentage Growth Of Renter Households (2010-16Q4)
Bu
bb
leS
ize
De
no
tes
# O
f R
en
ter
Ho
us
eh
old
s In
1
6Q
4

The National Market Is Still Quite Healthy
90
90
90
90
91
91
91
91
92
92
92
92
93
93
93
93
94
94
94
94
95
95
95
95
96
96
96
96
Source: CoStar Portfolio Strategy As of 16Q3
4.0%
4.5%
5.0%
5.5%
6.0%
6.5%
7.0%
7.5%
8.0%
0
10
20
30
40
50
60
70
80
01 02 03 04 05 06 07 08 09 10 11 12 13 14 15 16
Demand Change (Q/Q) Supply Change (Q/Q) Vacancy Historical Avg Vacancy (2001-2016)
Demand & Supply (000s Units) Vacancy
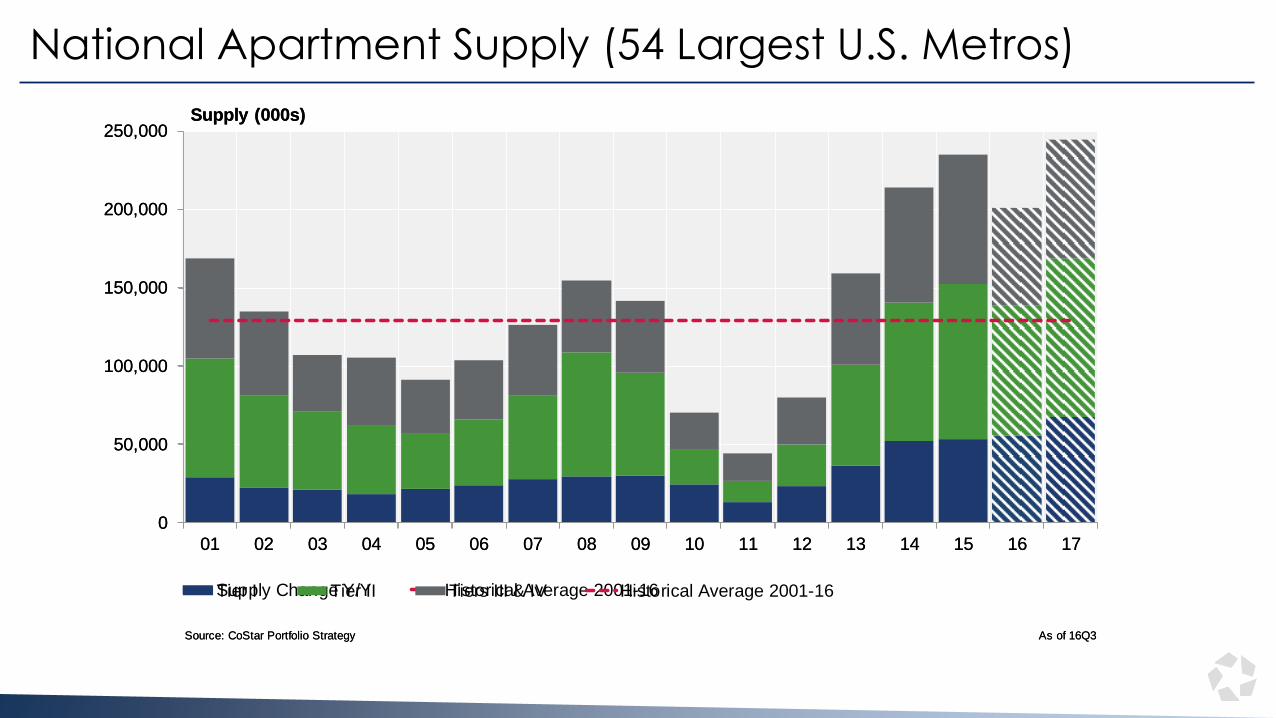
National Apartment Supply (54 Largest U.S. Metros)
00010203040506070809101112131415161718192021
Source: CoStar Portfolio Strategy As of 16Q3
0
50,000
100,000
150,000
200,000
250,000
01 02 03 04 05 06 07 08 09 10 11 12 13 14 15 16 17
Supply Change Y/Y Historical Average 2001-16
Supply (000s)
00010203040506070809101112131415161718192021
Source: CoStar Portfolio Strategy As of 16Q3
0
50,000
100,000
150,000
200,000
250,000
01 02 03 04 05 06 07 08 09 10 11 12 13 14 15 16 17
Tier I Tier II Tiers III & IV Historical Average 2001-16
Supply (000s)

Supply Growth Snapshot (16Q3-17Q4)
Rank1
2
3
4
5
6
7
8
9
10
11
12
13
14
15
16
17
18
19
20
21
22
23
24
25
Source: CoStar Portfolio Strategy As of 16Q3
0%
1%
2%
3%
4%
5%
6%
7%
8%
0
5,000
10,000
15,000
20,000
25,000
30,000
35,000
Ne
w Y
ork
Da
llas
Ho
usto
n
Los A
ngele
s
Washin
gto
n, D
C
Sea
ttle
Atlan
ta
De
nve
r
Bosto
n
Ch
icago
Austin
Ch
arlotte
Na
sh
vill
e
Mia
mi
San
An
tonio
Ora
ng
e C
ounty
Tam
pa
Pho
enix
Kan
sa
s C
ity
Port
land,
OR
San
Jo
se
Fort
Laud
erd
ale
San
Fra
ncis
co
Orlando
Co
lum
bus
Completions As A % Of InventorySouth East Midwest West
New Supply (As % of Inventory)New Supply (Units)

Does Los Angeles Need More Supply?
1
2
3
4
5
6
7
8
9
10
xx
Source: CoStar Portfolio Strategy As of 16Q3
0%
2%
4%
6%
8%
10%
12%
2012 2013 2014 2015 2016 2017
Cumulative Supply Growth
Memphis
Sacramento
National Index
Inland EmpireLos Angeles
Las Vegas
Detroit
East BayCleveland

Lease Up Takes Time
3/31/20006/30/20009/30/2000
12/31/20003/31/20016/30/20019/30/2001
12/31/20013/31/20026/30/20029/30/2002
12/31/20023/31/20036/30/20039/30/2003
12/31/20033/31/20046/30/20049/30/2004
12/31/20043/31/20056/30/20059/30/2005
12/31/20053/31/20066/30/20069/30/2006
12/31/2006
Source: CoStar Portfolio Strategy As of 16Q3
3.0%
3.5%
4.0%
4.5%
5.0%
5.5%
6.0%
6.5%
7.0%
7.5%
8.0%
8.5%
9.0%
9.5%
10.0%
08 09 10 11 12 13 14 15 16
Overall Vacancy 4 & 5 Star 3 Star 1 & 2 Star
Vacancy

Market Scorecard: Year-Over-Year Vacancy Change
1
2
3
4
5
6
7
8
9
10
11
12
13
14
15
16
17
18
19
20
21
22
23
24
25
26
27
Source: CoStar Portfolio Strategy As of 16Q3
*Historical Average Since 2001
(150)
(100)
(50)
0
50
100
150
200
Salt L
ake C
ity
San
An
tonio
Ha
rtfo
rdS
an
Die
go
Long I
sla
nd
Min
nea
polis
Orlando
Sea
ttle
Bosto
nIn
dia
na
polis
San
Jose
De
nve
rD
alla
s -
FW
No
rthern
NJ
Sacra
mento
Ho
nolu
luR
ichm
ond
Austin
Tam
pa
Co
lum
bus O
HK
an
sa
s C
ity
Pho
enix
De
troit
Ra
leig
hN
ew
York
Ne
w O
rlean
sC
leve
land
Mia
mi
Cin
cin
nati
Jacksonvill
eS
tam
ford
Las V
egas
Inla
nd E
mpire
Atlan
taW
ashin
gto
n, D
CE
ast
Bay
No
rfolk
Ora
ng
e C
ounty
Los A
ngele
sC
harlotte
Sain
t Louis
Milw
aukee
Phila
delp
hia
Mem
phis
Ch
icago
San
Fra
ncis
co
Na
shvill
eB
altim
ore
Pitts
burg
hP
ort
land O
RF
ort
Laud
erd
ale
Palm
Be
ach
Okla
hom
a C
ity
Ho
usto
n
Below Historical Avg. Above Historical Avg.
One Year Vacancy Change (BPS)

High Supply Growth* Submarkets Have More Coming
30
29
28
27
26
25
24
23
22
21
20
19
18
17
16
15
14
13
12
11
10
9
8
7
6
5
4
Source: CoStar Portfolio Strategy As of 16Q3
0 1,000 2,000 3,000 4,000 5,000 6,000 7,000 8,000
NEWY - Jersey City Waterfront
DALL - Plano
AUST - South
KANS - Johnson County KS
HOUS - Cinco Ranch
DALL - East Dallas
RALE - Central Raleigh
NEWY - Midtown West
HOUS - Northwest Houston
DALL - Farmers Branch/Addison
HOUS - Briar Forest/West Memorial
LOSA - Downtown Los Angeles
SANA - Northwest Side
NASH - West End/CBD
ATLA - Downtown/Midtown
DALL - Uptown/Park Cities
DENV - Downtown/Cherry Creek
ATLA - Buckhead-Brookhaven
HOUS - Neartown/River Oaks
CHIC - Downtown Chicago
Units Delivered Units Under Construction
Units Delivered And Under Construction
*Units Delivered 14Q4-16Q3, Under Construction As of 16Q3

Largest Vacancy Changes By Submarket (Y/O/Y)
25
24
23
22
21
20
19
18
17
16
15
14
13
12
11
10
9
8
7
6
5
4
3
2
1
Source: CoStar Portfolio Strategy As of 16Q3
*Includes submarkets with at least 5,000 units.
3.1%
3.2%
3.3%
3.3%
3.4%
3.4%
3.4%
3.4%
3.6%
3.7%
4.0%
4.1%
4.2%
4.5%
5.2%
5.7%
6.5%
6.9%
10.1%
10.1%
0% 5% 10% 15%
BALT - Harford County
PITT - Central Pittsburgh
WASH - Reston-Herndon Corridor
HOUS - Pearland
BOST - Quincy/Milton/Randolph
SEAT - Lake Union
AUST - Southeast
HOUS - Westchase/Woodlake
NEWY - Staten Island
HOUS - Alief
PALM - Boca Raton
CHIC - Downtown Chicago
OKLA - Central Oklahoma City
BALT - North Baltimore City
HOUS - Greenspoint/IAH Airport
CHAR - Southpark/Myers Park
SANF - South Of Market
NASH - West End/CBD
PHIL - Art Museum
WASH - Southwest/Navy Yard
(3.3%)
(3.3%)
(3.4%)
(3.5%)
(3.5%)
(3.7%)
(3.7%)
(3.8%)
(4.0%)
(4.1%)
(4.2%)
(4.6%)
(4.6%)
(4.7%)
(4.8%)
(5.2%)
(6.5%)
(7.9%)
(8.0%)
(9.1%)
(15%) (10%) (5%) 0%
DALL - Allen/McKinney
MIAM - Coral Gables
DENV - Highlands/Lone Tree
COLU - Downtown
AUST - Downtown/University
WASH - Ashburn/Sterling
BOST- Harvard/Cambridge
WASH - Falls Church/Vienna
SEAT - Kirkland
BOST - Everett/Malden
ORLA - Osceola County
NEWO - St Tammany Parish
WASH - H Street/NoMa
ATLA - Buckhead-Brookhaven
DENV - DTC/Southeast Corridor
ATLA - Cherokee County
HOUS - Cinco Ranch
SAND - Downtown
OKLA - Moore
SANJ - North San Jose
Largest Vacancy Increase Largest Vacancy Decrease

Rents
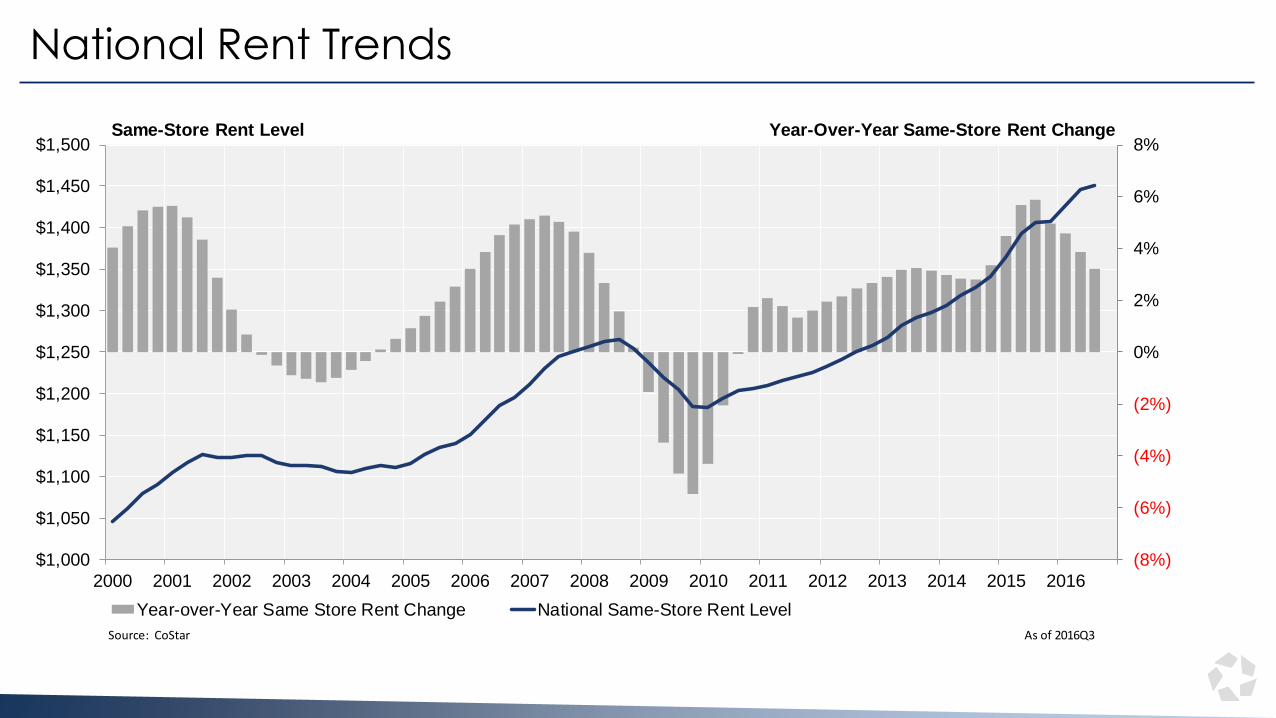
National Rent Trends
ZPPR54ZPPR54ZPPR54ZPPR54ZPPR54ZPPR54ZPPR54ZPPR54ZPPR54ZPPR54ZPPR54ZPPR54ZPPR54ZPPR54ZPPR54ZPPR54ZPPR54ZPPR54ZPPR54ZPPR54ZPPR54ZPPR54ZPPR54ZPPR54ZPPR54ZPPR54ZPPR54ZPPR54ZPPR54ZPPR54ZPPR54
Source: CoStar As of 2016Q3
(8%)
(6%)
(4%)
(2%)
0%
2%
4%
6%
8%
$1,000
$1,050
$1,100
$1,150
$1,200
$1,250
$1,300
$1,350
$1,400
$1,450
$1,500
2000 2001 2002 2003 2004 2005 2006 2007 2008 2009 2010 2011 2012 2013 2014 2015 2016
Year-over-Year Same Store Rent Change National Same-Store Rent Level
Same-Store Rent Level Year-Over-Year Same-Store Rent Change
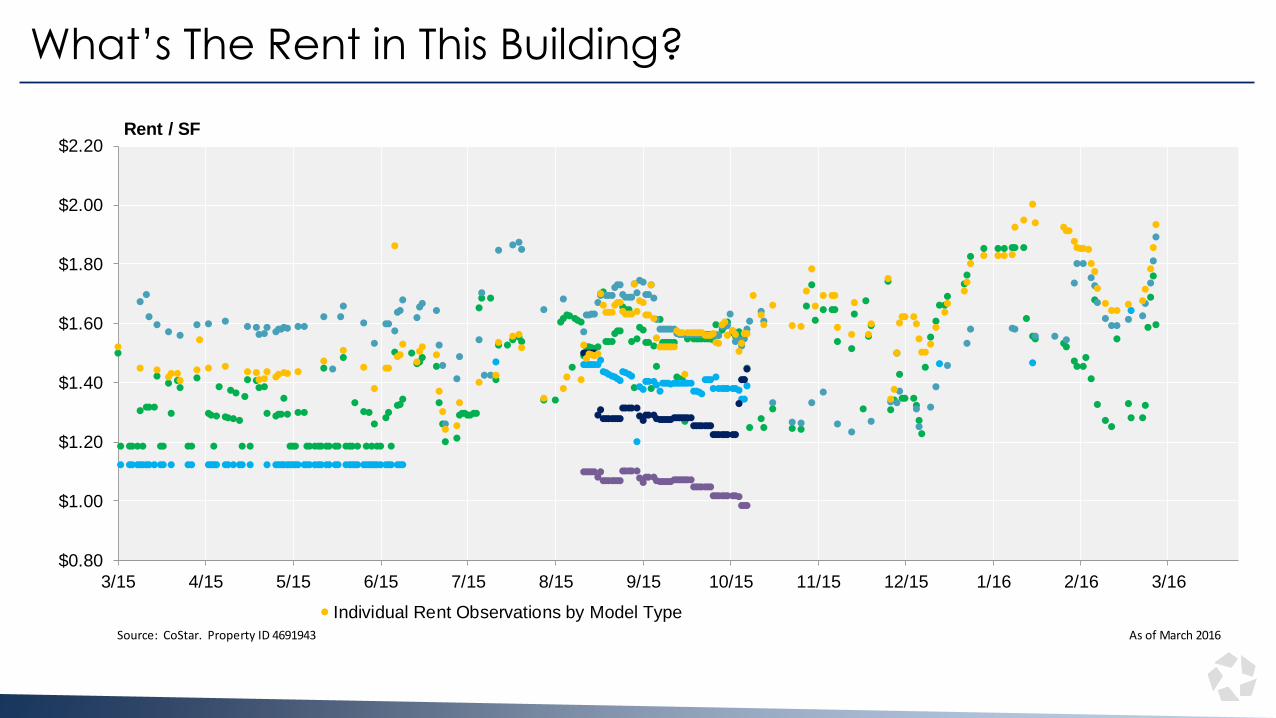
What’s The Rent in This Building?
1111111111111111111111111111111
Source: CoStar. Property ID 4691943 As of March 2016
$0.80
$1.00
$1.20
$1.40
$1.60
$1.80
$2.00
$2.20
3/15 4/15 5/15 6/15 7/15 8/15 9/15 10/15 11/15 12/15 1/16 2/16 3/16
Individual Rent Observations by Model Type
Rent / SF

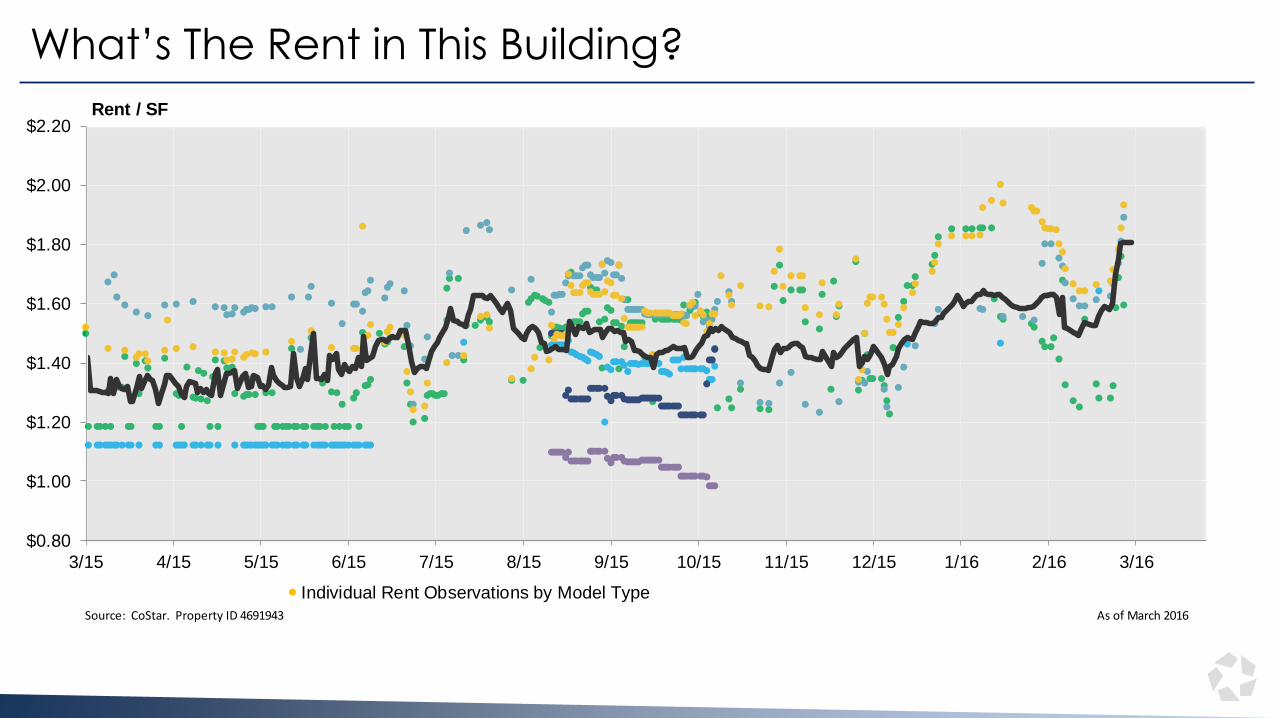
What’s The Rent In This Building?
1/1/20151/2/20151/3/20151/4/20151/5/20151/6/20151/7/20151/8/20151/9/2015
1/10/20151/11/20151/12/20151/13/20151/14/20151/15/20151/16/20151/17/20151/18/20151/19/20151/20/20151/21/20151/22/20151/23/20151/24/20151/25/20151/26/20151/27/20151/28/20151/29/20151/30/20151/31/2015
Source: CoStar. Property ID 4691943 As of March 2016
$0.80
$1.00
$1.20
$1.40
$1.60
$1.80
$2.00
$2.20
3/15 4/15 5/15 6/15 7/15 8/15 9/15 10/15 11/15 12/15 1/16 2/16 3/16
Individual Rent Observations by Model Type
Rent / SF

How To Make A Same-Store Rent Series
— Interpolate between data points
— Assume rents followed building—or market—trend before first datapoint and after last datapoint
— Estimate rents in models that don’t have ANY data

Estimating Rent Levels: CoStar Relative Rent Matrix
National
Source: CoStar As of 2015Q4
0.4
0.5
0.6
0.7
0.8
0.9
1.0
1.10
/1
1/1
1/2
2/1
2/2
2/3
3/1
3/2
3/3
4/2
4/3
National: 3 Star National: 4 & 5 Star

Relationship of Rents at Unit Type to Each Other
55 potential coefficients to estimate(1 bed 1 bath to 1 bed 2 bath, etc.)
Studio1 Bed1 Bath
1 Bed2+ Bath
2 Bed1 Bath
2 Bed2 Bath
2 Bed3+ Bath
3 Bed1 Bath
3 Bed2 Bath
3 Bed3+ Bath
4 Bed2 Bath
4 Bed3+ Bath
Possible Coefficients between all unit types

Model Another Number and Estimate Based on That
11 potential coefficients to estimate
Studio1 Bed1 Bath
1 Bed2+ Bath
2 Bed1 Bath
2 Bed2 Bath
2 Bed3+ Bath
3 Bed1 Bath
3 Bed2 Bath
3 Bed3+ Bath
4 Bed2 Bath
4 Bed3+ Bath
µ

Example: Estimating a Unit Type Which Has No Data
The unit types that we observe are used to predict µ, based on theirobserved coefficients
1 Bed1 Bath
1 Bed2+ Bath
2 Bed1 Bath
2 Bed2 Bath
2 Bed3+ Bath
µ
µ is used to predict the remaining unit type, based on its predicted coefficient, from the submarket-slice

Equations for µ, the Coefficients, and the Estimates
1111111111111111111111111111111
Source: CoStar. Property ID 4691943 As of March 2016
$0.80
$1.00
$1.20
$1.40
$1.60
$1.80
$2.00
$2.20
3/15 4/15 5/15 6/15 7/15 8/15 9/15 10/15 11/15 12/15 1/16 2/16 3/16
Individual Rent Observations by Model Type
Rent / SF 1111111111111111111111111111111
What’s The Rent in This Building?

Top 20 Rent Growth Markets
SACRSEATINLASALTDURHLASVATLAORANPHOENASHTAMPPORTDALLSANDLOSAORLARALELONGMEMPDETRCHARMINNCOLUCINCKANSINDIFORTJACKRICHEASTNORT
Source: CoStar As of November 2016
9.7%
7.5%7.0%
6.5% 6.3%5.9% 5.8% 5.7% 5.7% 5.5% 5.3% 5.2% 5.2% 5.1% 5.0%
4.7% 4.7% 4.4% 4.3% 4.1%
0%
2%
4%
6%
8%
10%
12%S
acra
mento
Sea
ttle
Inla
nd E
mpire
Salt L
ake C
ity
Du
rham
Las V
egas
Atlan
ta
Ora
ng
e C
ounty
Pho
enix
Na
shvill
e
Tam
pa
Port
land O
R
Da
llas -
Fort
Wort
h
San
Die
go
Los A
ngele
s
Orlando
Ra
leig
h
Long I
sla
nd
Mem
phis
De
troit
Year-Over-Year Same-Store Rent Change, 2015Q3 - 2016Q3
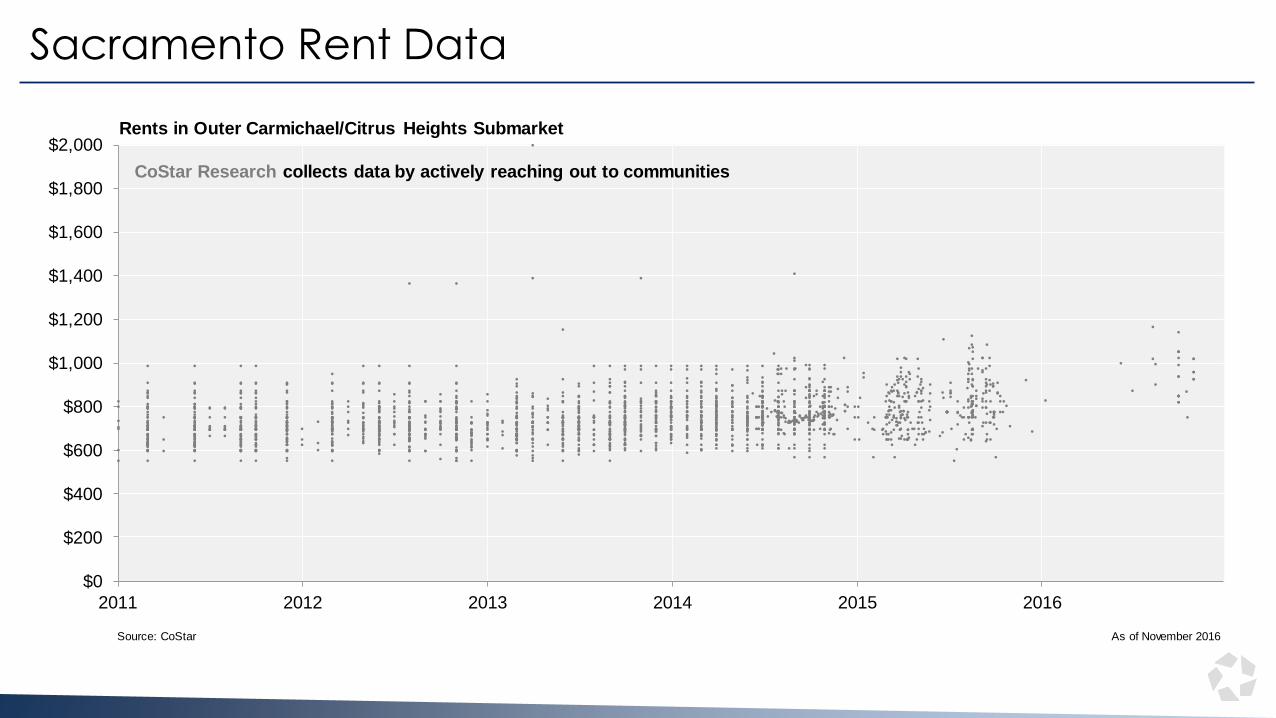
Sacramento Rent Data
AR Data
PropertyID
841302
1593865
4062347
4115560
7761475
4411690
7761475
7761475
4411690
4062003
7762534
4106521
4115560
4683162
7761475
7762534
5897524
5897524
4341184
850078
850078
7768831
7761670
7762467
742121
5881201
4494520
1593865
Source: CoStar As of November 2016
$0
$200
$400
$600
$800
$1,000
$1,200
$1,400
$1,600
$1,800
$2,000
2011 2012 2013 2014 2015 2016
Rents in Outer Carmichael/Citrus Heights Submarket
CoStar Research collects data by actively reaching out to communities

Sacramento Rent Data
AR Data
PropertyID
841302
1593865
4062347
4115560
7761475
4411690
7761475
7761475
4411690
4062003
7762534
4106521
4115560
4683162
7761475
7762534
5897524
5897524
4341184
850078
850078
7768831
7761670
7762467
742121
5881201
4494520
1593865
Source: CoStar As of November 2016
$0
$200
$400
$600
$800
$1,000
$1,200
$1,400
$1,600
$1,800
$2,000
2011 2012 2013 2014 2015 2016
Rents in Outer Carmichael/Citrus Heights Submarket
Community Callers collect rent information as potential renters

Sacramento Rent Data
AR Data
PropertyID
841302
1593865
4062347
4115560
7761475
4411690
7761475
7761475
4411690
4062003
7762534
4106521
4115560
4683162
7761475
7762534
5897524
5897524
4341184
850078
850078
7768831
7761670
7762467
742121
5881201
4494520
1593865
Source: CoStar As of November 2016
$0
$200
$400
$600
$800
$1,000
$1,200
$1,400
$1,600
$1,800
$2,000
2011 2012 2013 2014 2015 2016
Rents in Outer Carmichael/Citrus Heights Submarket
Automated Data Collection uses web scraping technology to collect high-frequency rent observations

Sacramento Rent Data
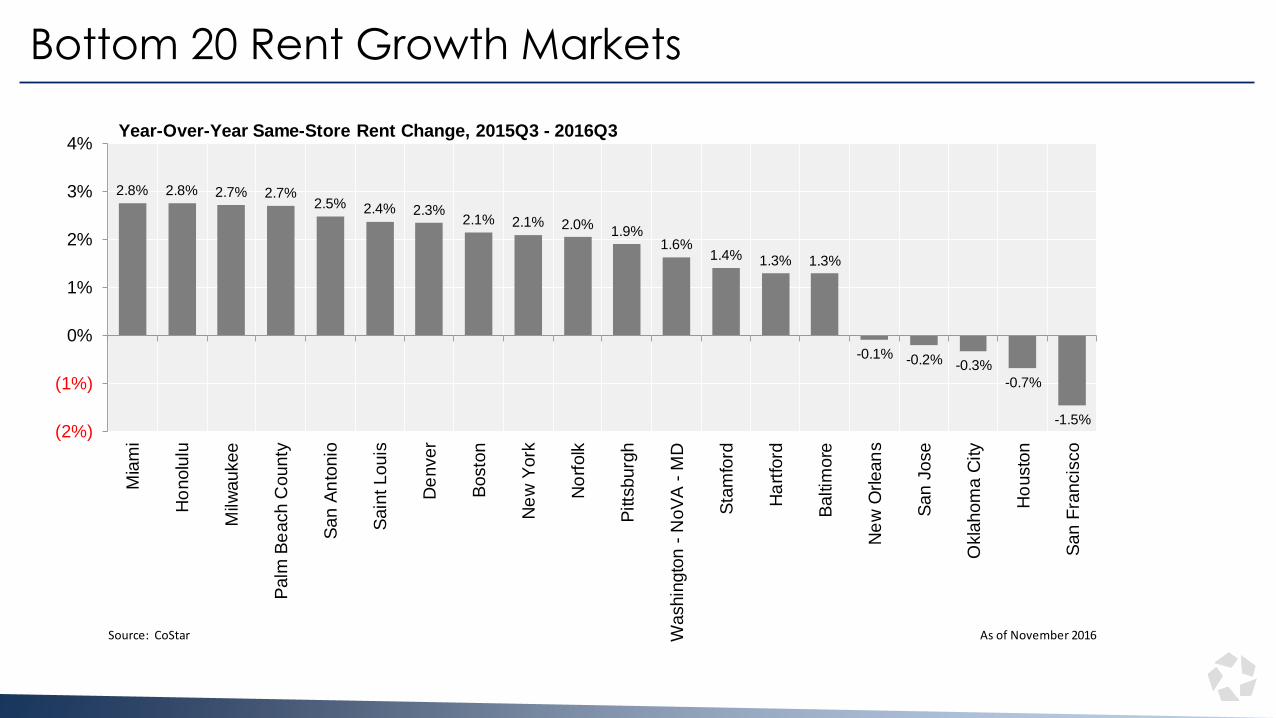
Bottom 20 Rent Growth Markets
MIAMHONOMILWPALMSANASTLODENVBOSTNEWYNORFPITTWASHSTAMHARTBALTNEWOSANJOKLAHOUSSANF
CHICCLEVAUSTPHILNORTEASTRICHJACKFORTINDI
Source: CoStar As of November 2016
2.8% 2.8% 2.7% 2.7%2.5% 2.4% 2.3%
2.1% 2.1% 2.0%1.9%
1.6%1.4% 1.3% 1.3%
-0.1% -0.2% -0.3%
-0.7%
-1.5%(2%)
(1%)
0%
1%
2%
3%
4%M
iam
i
Ho
nolu
lu
Milw
aukee
Palm
Be
ach C
ounty
San
An
tonio
Sain
t Louis
De
nver
Bosto
n
Ne
w Y
ork
No
rfolk
Pitts
burg
h
Washin
gto
n -
NoV
A -
MD
Sta
mfo
rd
Ha
rtfo
rd
Baltim
ore
Ne
w O
rlean
s
San
Jose
Okla
hom
a C
ity
Ho
usto
n
San
Fra
ncis
co
Year-Over-Year Same-Store Rent Change, 2015Q3 - 2016Q3

San Francisco Rent Data

Houston Rent Data
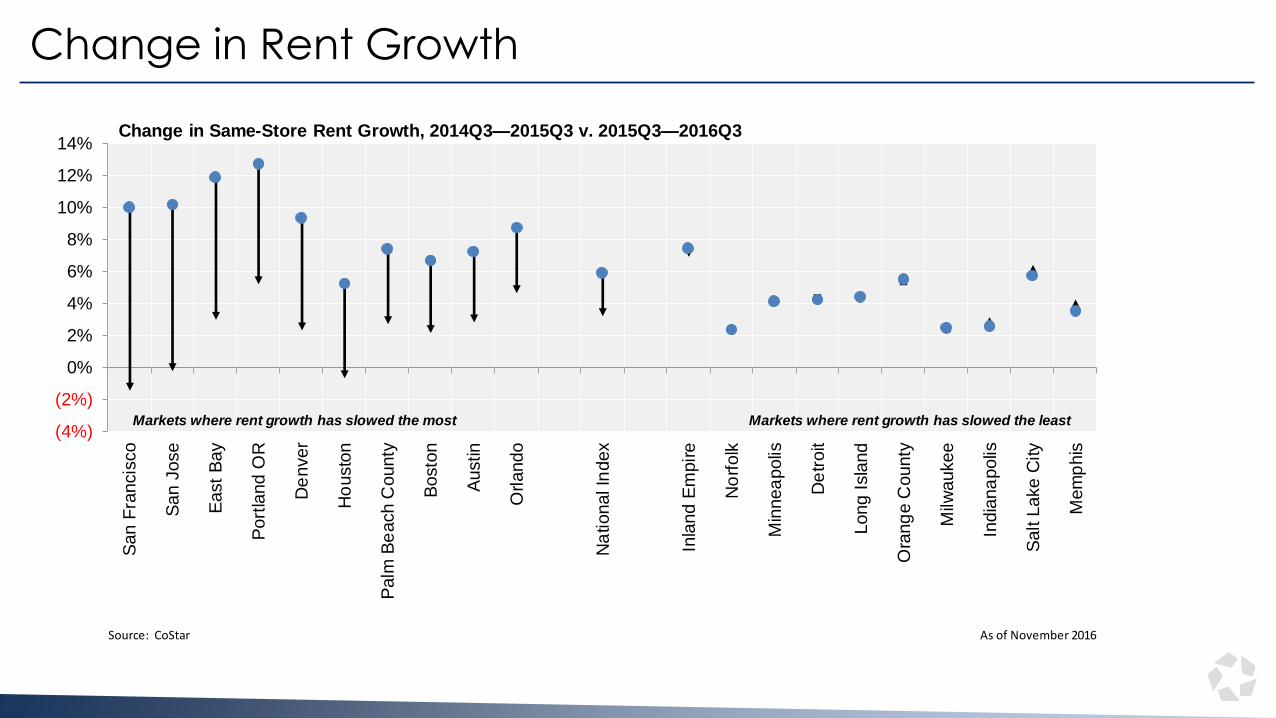
Change in Rent Growth
SANFSANJEASTPORTDENVHOUSPALMBOSTAUSTORLA
ZPPR54
INLANORFMINNDETRLONGORANMILWINDISALTMEMP
Source: CoStar As of November 2016
(4%)
(2%)
0%
2%
4%
6%
8%
10%
12%
14%S
an
Fra
ncis
co
San
Jose
East
Bay
Port
land O
R
De
nver
Ho
usto
n
Palm
Be
ach C
ounty
Bosto
n
Austin
Orlando
Na
tional In
dex
Inla
nd E
mpire
No
rfolk
Min
nea
polis
De
troit
Long I
sla
nd
Ora
ng
e C
ounty
Milw
aukee
India
na
polis
Salt L
ake C
ity
Mem
phis
Change in Same-Store Rent Growth, 2014Q3—2015Q3 v. 2015Q3—2016Q3
Markets where rent growth has slowed the most Markets where rent growth has slowed the least

Capital Markets

Sales Volume Last Four Quarters Remains Strong
2016
2015
2014
2013
2012
2011
2010
2009
2008
2007
2006
2005
2004
2003
2002
2001
2000
previous
Y/Y Change
Source: CoStar Group As of 16Q3
(15%)
(10%)
(5%)
0%
5%
10%
15%
20%
$0
$20
$40
$60
$80
$100
$120
$140
$160
$180
Hospitality Industrial Office Multi-Family Retail
Sales Volume (Billions)
Sales Volume Y/Y Change
Y/Y Change In Sales Volume
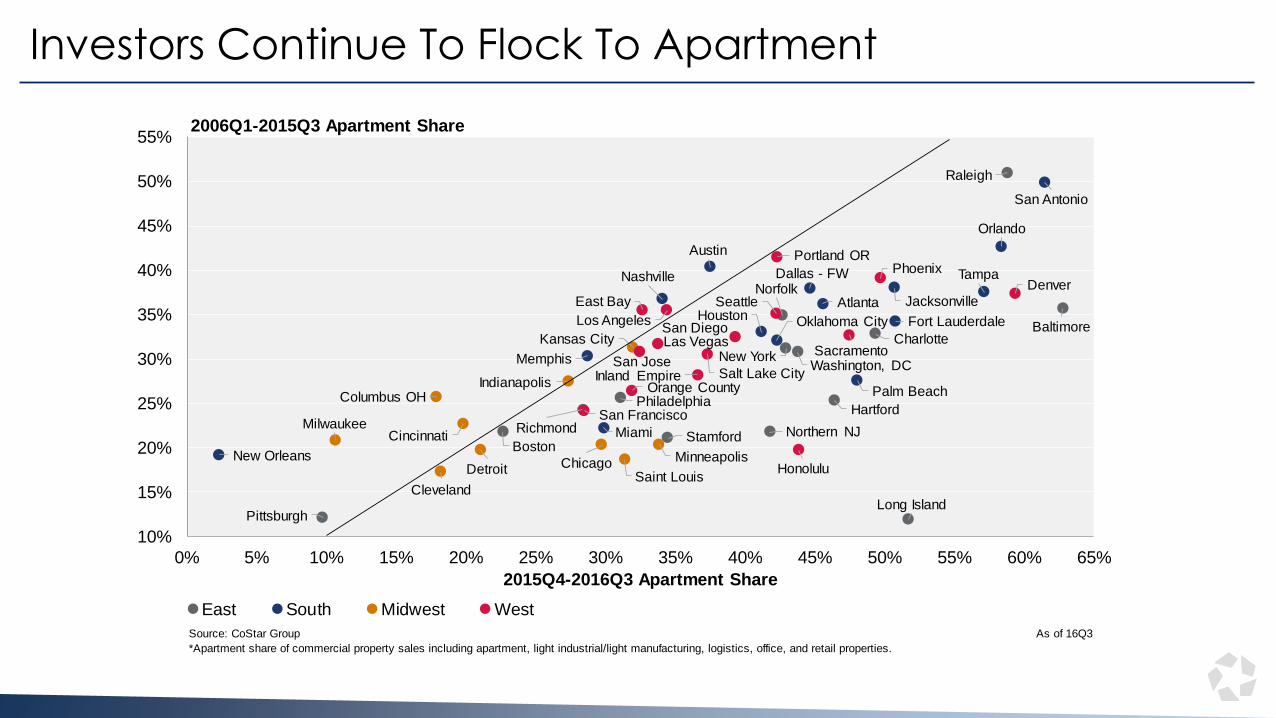
Investors Continue To Flock To Apartment
Atlanta
Austin
Baltimore
Boston
Charlotte
Chicago
Cincinnati
Cleveland
Columbus OH
Dallas - FW
Denver
Detroit
East Bay
Hartford
Honolulu
Houston
Indianapolis
Inland Empire
Jacksonville
Kansas City
Las Vegas
Long Island
Los Angeles
Memphis
Miami
Milwaukee
Minneapolis
Nashville
Source: CoStar Group As of 16Q3
*Apartment share of commercial property sales including apartment, light industrial/light manufacturing, logistics, office, and retail properties.
Baltimore
Boston
Charlotte
Hartford
Long Island
New York
Norfolk
Northern NJ
Philadelphia
Pittsburgh
Raleigh
RichmondStamford
Washington, DC
Atlanta
Austin
Dallas - FW
Fort LauderdaleHoustonJacksonville
Memphis
Miami
Nashville
New Orleans
Oklahoma City
Orlando
Palm Beach
San Antonio
Tampa
Chicago
Cincinnati
Cleveland
Columbus OH
Detroit
Indianapolis
Kansas City
Milwaukee
Minneapolis
Saint Louis
Denver
East Bay
Honolulu
Inland Empire
Las Vegas
Los Angeles
Orange County
PhoenixPortland OR
Sacramento
Salt Lake City
San Diego
San Francisco
San Jose
Seattle
10%
15%
20%
25%
30%
35%
40%
45%
50%
55%
0% 5% 10% 15% 20% 25% 30% 35% 40% 45% 50% 55% 60% 65%
East South Midwest West
2015Q4-2016Q3 Apartment Share
2006Q1-2015Q3 Apartment Share

Are Apartment Capital Markets Peaking?
67
66
65
64
63
62
61
60
59
58
57
56
55
54
53
52
51
50
49
48
47
46
45
44
43
42
41
40
Source: CoStar Group As of 16Q3
0
1
2
3
4
5
6
7
8
9
$0
$10
$20
$30
$40
$50
$60
05 06 07 08 09 10 11 12 13 14 15 16
Sales Volume (Billions)
Quarterly Sales Volume Number Of Buildings Sold
Number Of Buildings Sold (000s)

Sustained Price Growth Across All Regions
07
07
07
07
08
08
08
08
09
09
09
09
10
10
10
10
11
11
11
11
12
12
12
Source: CoStar Portfolio Strategy As of 16Q3
$0
$50,000
$100,000
$150,000
$200,000
$250,000
07 08 09 10 11 12 13 14 15 16
Price Per Unit (Four-Quarter Rolling Average)
East South Midwest West National Index

Recent Price Appreciation Strongest In West Coast Metros
Cleveland
Long Island
Miami
Palm Beach
Hartford
Denver
Honolulu
Las Vegas
Phoenix
San Jose
East Bay
Richmond
Jacksonville
Raleigh
Austin
Baltimore
San Diego
Charlotte
Portland OR
Columbus OH
Nashville
Northern NJ
Minneapolis
Source: CoStar Portfolio Strategy As of 16Q3
(40%)
(20%)
0%
20%
40%
60%
80%
Cle
vela
nd
Long I
sla
nd
Mia
mi
Palm
Be
ach
Ha
rtfo
rdD
enver
Ho
nolu
luLas V
egas
Pho
enix
San
Jose
East
Bay
Ric
hm
ond
Ora
ng
e C
ounty
Fort
Laud
erd
ale
Jacksonvill
eO
kla
hom
a C
ity
Ra
leig
hA
ustin
Baltim
ore
Washin
gto
n, D
CS
an
Die
go
Ch
arlotte
Port
land O
RC
olu
mbus O
HN
ashvill
eN
ort
hern
NJ
Min
nea
polis
Ne
w Y
ork
Inla
nd E
mpire
Ch
icago
Salt L
ake C
ity
Kan
sas C
ity
De
troit
Los A
ngele
sN
orf
olk
Atlan
taT
am
pa
Cin
cin
nati
India
na
polis
Sea
ttle
Sacra
mento
Da
llas -
FW
Orlando
Milw
aukee
Phila
delp
hia
Bosto
nH
ousto
nS
an
An
tonio
Mem
phis
Sta
mfo
rdS
an
Fra
ncis
co
Pitts
burg
hS
ain
t Louis
Ne
w O
rlean
s
Y/Y Price Growth
South East Midwest West
DecreaseIncrease
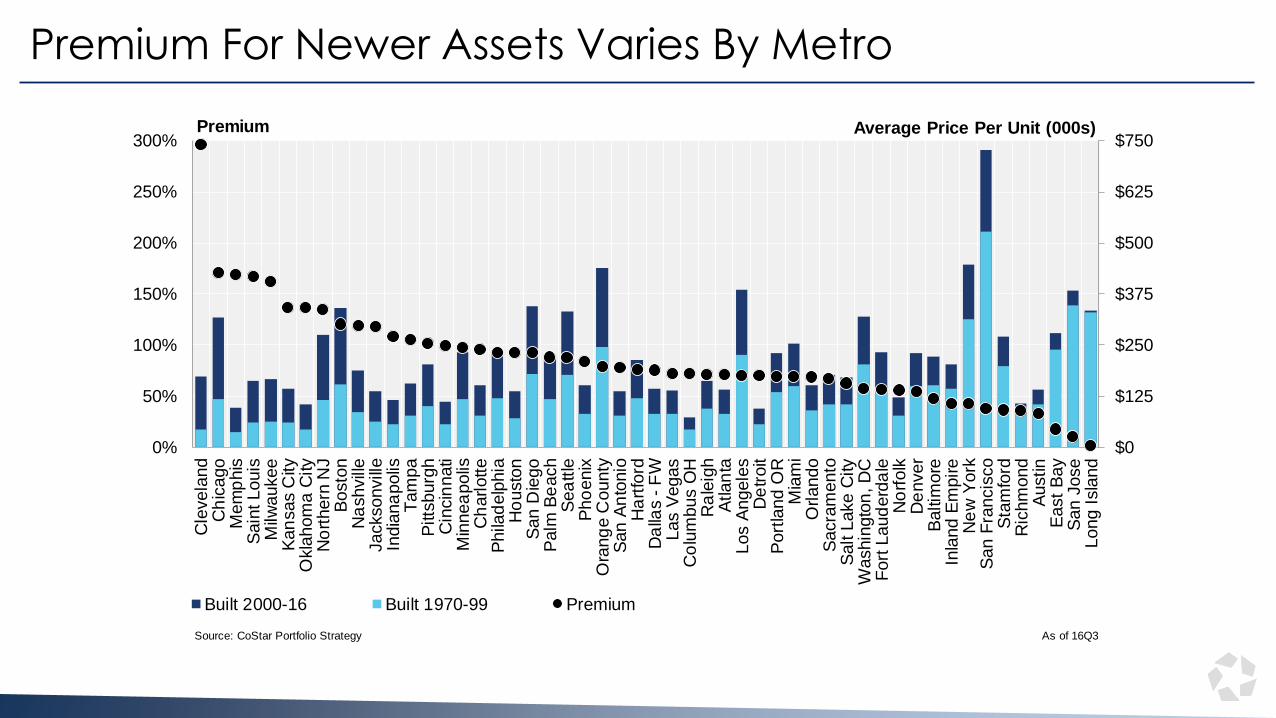
Premium For Newer Assets Varies By Metro
Cleveland
Chicago
Memphis
Saint Louis
Milwaukee
Kansas City
Northern NJ
Boston
Nashville
Jacksonville
Indianapolis
Tampa
Pittsburgh
Cincinnati
Minneapolis
Charlotte
Philadelphia
Houston
San Diego
Palm Beach
Seattle
Phoenix
San Antonio
Hartford
Dallas - FW
Source: CoStar Portfolio Strategy As of 16Q3
$0
$125
$250
$375
$500
$625
$750
0%
50%
100%
150%
200%
250%
300%
Cle
vela
nd
Ch
icago
Mem
phis
Sain
t Louis
Milw
aukee
Kan
sas C
ity
Okla
hom
a C
ity
No
rthern
NJ
Bosto
nN
ashvill
eJackso
nvill
eIn
dia
na
polis
Tam
pa
Pitts
burg
hC
incin
nati
Min
nea
polis
Ch
arlotte
Phila
delp
hia
Ho
usto
nS
an
Die
go
Palm
Be
ach
Sea
ttle
Pho
enix
Ora
ng
e C
ounty
San
An
tonio
Ha
rtfo
rdD
alla
s -
FW
Las V
egas
Co
lum
bus O
HR
ale
igh
Atlan
taLos A
ngele
sD
etr
oit
Port
land O
RM
iam
iO
rlando
Sacra
mento
Salt L
ake C
ity
Washin
gto
n, D
CF
ort
Laud
erd
ale
No
rfolk
De
nver
Baltim
ore
Inla
nd E
mpire
Ne
w Y
ork
San
Fra
ncis
co
Sta
mfo
rdR
ichm
ond
Austin
East
Bay
San
Jose
Long I
sla
nd
Premium
Built 2000-16 Built 1970-99 Premium
Average Price Per Unit (000s)

Select Top Multifamily Deals – 3Q 2016
Savoy Park
New York, NY
A joint venture comprised of L&M
Development Partners and Savanna sold
the 1,790-unit apartment community to
Fairstead Capital for $315 Million or
$176K/unit.
LIV Apartments
Bellevue, WA
Goodman Real Estate, Inc. sold the 451-
unit apartment community to Kennedy-
Wilson Properties, Ltd. for $172 Million or
$381K/unit.
Cap Rate: 4.7%
Axion Tustin
Tustin, CA
AvalonBay Communities, Inc. sold
the 628- unit community to Raintree
Partners for $163.55 Million or
$260K/unit.
Cap Rate: 4.94%
The Residence Buckhead Atlanta
Atlanta, GA
Oliver McMillan sold the 370-unit
community to Simpson Housing for
$136.5 Million or $369K/unit.
Pro-Forma Cap Rate: 5.6%
Century Summerfield @ Morgan Metro
Landover, MD
Camden Property Trust sold the 478-unit
community to Centennial Holding
Company, LLC for $110 Million or
$230K/unit.
Cap Rate: 6%
One East Delaware
Chicago, IL
Waterton Associates, LLC sold the 306-
unit community to a joint venture
comprised of Golub & Company and
Alcion Ventures for $146 Million or
$477K/unit.
Cap Rate: 4.75%

© Copyright 2016 CoStar Group, Inc. All Rights Reserved. Although CoStar makes efforts to ensure the accuracy and reliability of the information contained herein, the following information includes projections that are based on various assumptions by CoStar concerning future events and circumstances, as well as historical and current data maintained in CoStar’s database. Actual results may vary from the projections presented. The information in this presentation is provided ‘as is’ and CoStar expressly disclaims any guarantees, representations or warranties of any kind, including those of merchantability and fitness for a particular purpose. Features shown in this presentation may require additional subscriptions.


