SSI Recipientsby State andCounty, 2003
Social Security AdministrationOffice of PolicyOffice of Research, Evaluation, and Statistics
SSIRecipientSt&Ctycovers2003.qxp 3/30/2004 11:00 AM Page 3


Preface
County data on Supplemental Security Income (SSI) are a measure of the local impact of the program. This report is a resource for Social Security Administration (SSA) staff in formulating policy and for local service providers and economic planners.
The SSI program is a cash assistance program that provides monthly benefits to low-income aged, blind, or disabled persons in the 50 states, the District of Columbia, and the Northern Mariana Islands. The states and other jurisdictions have the option of supplementing their residents' SSI payments and may choose to have the additional payments administered by the federal government. When a state chooses federal administration, SSA maintains the payment records and issues the federal payment and the state supplement in one check. The data presented in this document are for federal and federally administered state payments only. State-administered supplementation payments are not included.
The tables present SSI data by eligibility category (aged, blind, and disabled) and age. State data on the number of recipients and amount of payments are shown in Tables 1 and 2, respectively. SSI recipients who also receive Social Security (Old-Age, Survivors, and Disability Insurance) benefits are shown in Table 1 and also in Table 3, which presents data at the county level.
The data are drawn from the Supplemental Security Record, the principal administrative data file for the SSI program. State and county payment amounts are rounded to whole dollars. To avoid disclosure of information for particular individuals, data are not shown for states, counties, or eligibility groups with fewer than 15 recipients. Therefore, some state totals shown include a small number of recipients not distributed by county.
Stella M. Coleman in the Division of SSI Statistics and Analysis programmed and compiled the data for this report. Emil Loomis designed the cover, Celine Houget edited the report, Kathryn Winstead produced the print publication, and Laurie Brown prepared the electronic versions for the Web at http://www.socialsecurity.gov/policy.
For questions pertaining to the data, please call Stella Coleman at 410-965-0157 or e-mail [email protected]. For additional copies of this report, please telephone 202-358-6274 or e-mail [email protected].
Edward J. DeMarcoAssociate Commissionerfor Research, Evaluation, and Statistics
March 2004


Tables
1. Number of recipients by state or other area, eligibility category, age,and receipt of OASDI benefits, December 2003 . . . . . . . . . . . . . . . . . . . . . . .1
2. Amount of payments, by state or other area, eligibility category,and age, December 2003. . . . . . . . . . . . . . . . . . . . . . . . . . . . . . . . . . . . . . . . .2
3. Number of recipients in state (by eligibility category, age, and receiptof OASDI benefits) and amount of payments, by county, December 2003
Alabama . . . . . . . . . . . . . . . . . . .3Alaska . . . . . . . . . . . . . . . . . . . . .5Arizona . . . . . . . . . . . . . . . . . . . .6Arkansas . . . . . . . . . . . . . . . . . . .7California . . . . . . . . . . . . . . . . . . .9
Colorado . . . . . . . . . . . . . . . . . .11Connecticut . . . . . . . . . . . . . . . .13Delaware . . . . . . . . . . . . . . . . . .14District of Columbia . . . . . . . . . . .aFlorida . . . . . . . . . . . . . . . . . . . .15
Georgia . . . . . . . . . . . . . . . . . . .17Hawaii . . . . . . . . . . . . . . . . . . . .21Idaho . . . . . . . . . . . . . . . . . . . . .22Illinois . . . . . . . . . . . . . . . . . . . .24Indiana . . . . . . . . . . . . . . . . . . .27
Iowa . . . . . . . . . . . . . . . . . . . . .30Kansas . . . . . . . . . . . . . . . . . . .33Kentucky . . . . . . . . . . . . . . . . . .36Louisiana . . . . . . . . . . . . . . . . . .39Maine . . . . . . . . . . . . . . . . . . . .41
Maryland . . . . . . . . . . . . . . . . . .42Massachusetts . . . . . . . . . . . . .43Michigan . . . . . . . . . . . . . . . . . .44Minnesota . . . . . . . . . . . . . . . . .47Mississippi . . . . . . . . . . . . . . . . .50
Missouri . . . . . . . . . . . . . . . . . . .53Montana . . . . . . . . . . . . . . . . . .56Nebraska . . . . . . . . . . . . . . . . . .58Nevada . . . . . . . . . . . . . . . . . . .61New Hampshire . . . . . . . . . . . . .62
New Jersey . . . . . . . . . . . . . . . .63New Mexico . . . . . . . . . . . . . . . .64New York . . . . . . . . . . . . . . . . . .65North Carolina . . . . . . . . . . . . . .67North Dakota . . . . . . . . . . . . . . .70
Ohio . . . . . . . . . . . . . . . . . . . . . .72Oklahoma . . . . . . . . . . . . . . . . .75Oregon . . . . . . . . . . . . . . . . . . .77Pennsylvania . . . . . . . . . . . . . . .78Rhode Island . . . . . . . . . . . . . . .80
South Carolina . . . . . . . . . . . . .81South Dakota . . . . . . . . . . . . . .83Tennessee . . . . . . . . . . . . . . . .85Texas . . . . . . . . . . . . . . . . . . . .88Utah . . . . . . . . . . . . . . . . . . . . . .95
Vermont . . . . . . . . . . . . . . . . . . .96Virginia . . . . . . . . . . . . . . . . . . .97Washington . . . . . . . . . . . . . . .101West Virginia . . . . . . . . . . . . . .103Wisconsin . . . . . . . . . . . . . . . .105Wyoming . . . . . . . . . . . . . . . . .107
Outlying area Northern Mariana Islands . . . .a
a. County data are not applicable. Data for this jurisdiction are shown in Tables 1 and 2.


SSI Recipients by State and County, 2003 ♦ 1
Table 1.Number of recipients by state or other area, eligibility category, age, and receipt of OASDI benefits,December 2003
AgedBlind anddisabled Under 18 18–64
65 orolder
All areas 6,902,364 1,232,802 5,669,562 959,379 3,953,248 1,989,737 2,421,362
163,772 21,005 142,767 27,308 97,739 38,725 67,03510,651 2,229 8,422 1,064 6,539 3,048 3,69791,853 13,244 78,609 15,556 53,555 22,742 29,92886,563 11,182 75,381 15,363 50,313 20,887 37,422
1,161,467 345,681 815,786 92,704 566,668 502,095 433,485
54,054 8,555 45,499 6,587 33,808 13,659 19,56651,170 6,945 44,225 6,293 32,450 12,427 15,49012,968 1,307 11,661 2,977 7,568 2,423 4,31520,393 2,157 18,236 3,907 12,045 4,441 5,211
410,027 95,672 314,355 77,292 195,795 136,940 137,389
199,991 29,708 170,283 30,857 115,188 53,946 77,77421,757 6,523 15,234 1,380 11,884 8,493 6,90520,279 1,714 18,565 3,543 13,730 3,006 7,350
255,262 30,892 224,370 42,559 155,318 57,385 60,74494,027 6,310 87,717 19,036 62,363 12,628 30,272
41,890 3,836 38,054 6,295 28,383 7,212 16,48437,813 3,481 34,332 6,608 24,591 6,614 13,690
178,852 15,732 163,120 25,184 118,258 35,410 63,095167,800 20,713 147,087 29,460 98,939 39,401 58,70831,438 2,750 28,688 3,198 22,580 5,660 13,794
90,983 15,541 75,442 14,046 52,124 24,813 26,307167,883 44,795 123,088 16,610 103,163 48,110 62,696216,629 17,624 199,005 35,552 144,705 36,372 65,79669,020 9,806 59,214 9,593 43,802 15,625 22,090
126,282 17,536 108,746 21,262 71,364 33,656 52,691
115,131 10,606 104,525 18,101 75,861 21,169 42,75614,365 1,212 13,153 1,805 10,080 2,480 5,66221,876 2,184 19,692 3,399 14,519 3,958 8,73730,983 7,920 23,063 5,251 17,375 8,357 10,19312,762 930 11,832 1,725 9,201 1,836 4,756
149,376 33,654 115,722 20,861 78,236 50,279 47,48550,212 8,711 41,501 6,273 28,498 15,441 19,845
623,774 133,964 489,810 67,961 333,258 222,555 196,206194,611 28,241 166,370 33,450 109,308 51,853 83,446
8,101 1,145 6,956 935 5,174 1,992 3,711
243,679 15,938 227,741 41,456 165,968 36,255 67,42075,262 8,939 66,323 11,602 47,024 16,636 27,45457,506 7,587 49,919 7,508 37,598 12,400 19,968
310,485 32,883 277,602 50,888 195,711 63,886 96,81629,143 4,145 24,998 3,738 18,076 7,329 11,241
105,693 13,872 91,821 17,721 61,098 26,874 42,47212,574 1,777 10,797 1,885 7,495 3,194 5,253
161,361 18,854 142,507 21,907 101,263 38,191 63,860455,232 111,313 343,919 65,288 228,697 161,247 181,99721,394 2,140 19,254 3,837 13,846 3,711 6,424
12,819 1,307 11,512 1,487 8,639 2,693 6,066133,731 22,183 111,548 20,351 76,567 36,813 49,948109,056 14,192 94,864 13,105 71,006 24,945 29,61675,257 4,700 70,557 8,207 54,468 12,582 24,05788,750 8,823 79,927 15,415 57,112 16,223 31,6385,665 484 5,181 822 3,926 917 2,198
734 159 575 166 366 202 202
8 1 7 1 6 1 1
Washington
Outlying areaNorthern Mariana Islands
SOURCE: Social Security Administration, Supplemental Security Record (Characteristic Extract Record format), 100 percent data.
West VirginiaWisconsinWyoming
Unknown
TexasUtah
VermontVirginia
Rhode Island
South CarolinaSouth DakotaTennessee
OhioOklahomaOregonPennsylvania
New MexicoNew YorkNorth CarolinaNorth Dakota
NebraskaNevadaNew Hampshire
New Jersey
MinnesotaMississippi
MissouriMontana
Maine
MarylandMassachusettsMichigan
IowaKansasKentuckyLouisiana
HawaiiIdahoIllinoisIndiana
DelawareDistrict of ColumbiaFlorida
Georgia
ArkansasCalifornia
ColoradoConnecticut
State or area
AlabamaAlaskaArizona
Total
Category Age
SSIrecipients
alsoreceiving
OASDI
2 ♦ SSI Recipients by State and County, 2003
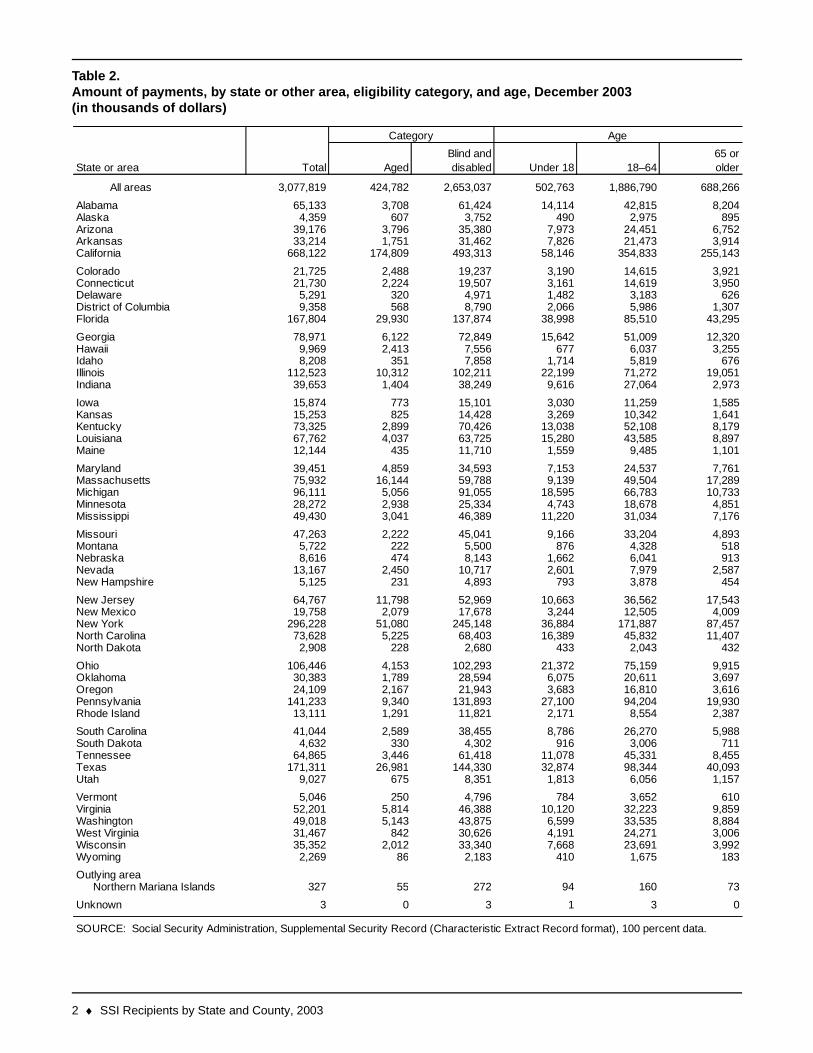
Table 2.Amount of payments, by state or other area, eligibility category, and age, December 2003(in thousands of dollars)
AgedBlind anddisabled Under 18 18–64
65 orolder
All areas 3,077,819 424,782 2,653,037 502,763 1,886,790 688,266
65,133 3,708 61,424 14,114 42,815 8,2044,359 607 3,752 490 2,975 895
39,176 3,796 35,380 7,973 24,451 6,75233,214 1,751 31,462 7,826 21,473 3,914
668,122 174,809 493,313 58,146 354,833 255,143
21,725 2,488 19,237 3,190 14,615 3,92121,730 2,224 19,507 3,161 14,619 3,9505,291 320 4,971 1,482 3,183 6269,358 568 8,790 2,066 5,986 1,307
167,804 29,930 137,874 38,998 85,510 43,295
78,971 6,122 72,849 15,642 51,009 12,3209,969 2,413 7,556 677 6,037 3,2558,208 351 7,858 1,714 5,819 676
112,523 10,312 102,211 22,199 71,272 19,05139,653 1,404 38,249 9,616 27,064 2,973
15,874 773 15,101 3,030 11,259 1,58515,253 825 14,428 3,269 10,342 1,64173,325 2,899 70,426 13,038 52,108 8,17967,762 4,037 63,725 15,280 43,585 8,89712,144 435 11,710 1,559 9,485 1,101
39,451 4,859 34,593 7,153 24,537 7,76175,932 16,144 59,788 9,139 49,504 17,28996,111 5,056 91,055 18,595 66,783 10,73328,272 2,938 25,334 4,743 18,678 4,85149,430 3,041 46,389 11,220 31,034 7,176
47,263 2,222 45,041 9,166 33,204 4,8935,722 222 5,500 876 4,328 5188,616 474 8,143 1,662 6,041 913
13,167 2,450 10,717 2,601 7,979 2,5875,125 231 4,893 793 3,878 454
64,767 11,798 52,969 10,663 36,562 17,54319,758 2,079 17,678 3,244 12,505 4,009
296,228 51,080 245,148 36,884 171,887 87,45773,628 5,225 68,403 16,389 45,832 11,4072,908 228 2,680 433 2,043 432
106,446 4,153 102,293 21,372 75,159 9,91530,383 1,789 28,594 6,075 20,611 3,69724,109 2,167 21,943 3,683 16,810 3,616
141,233 9,340 131,893 27,100 94,204 19,93013,111 1,291 11,821 2,171 8,554 2,387
41,044 2,589 38,455 8,786 26,270 5,9884,632 330 4,302 916 3,006 711
64,865 3,446 61,418 11,078 45,331 8,455171,311 26,981 144,330 32,874 98,344 40,093
9,027 675 8,351 1,813 6,056 1,157
5,046 250 4,796 784 3,652 61052,201 5,814 46,388 10,120 32,223 9,85949,018 5,143 43,875 6,599 33,535 8,88431,467 842 30,626 4,191 24,271 3,00635,352 2,012 33,340 7,668 23,691 3,9922,269 86 2,183 410 1,675 183
327 55 272 94 160 73
3 0 3 1 3 0
Outlying areaNorthern Mariana Islands
SOURCE: Social Security Administration, Supplemental Security Record (Characteristic Extract Record format), 100 percent data.
West VirginiaWisconsinWyoming
Unknown
Utah
VermontVirginiaWashington
South CarolinaSouth DakotaTennesseeTexas
OklahomaOregonPennsylvaniaRhode Island
New YorkNorth CarolinaNorth Dakota
Ohio
NevadaNew Hampshire
New JerseyNew Mexico
Mississippi
MissouriMontanaNebraska
MarylandMassachusettsMichiganMinnesota
KansasKentuckyLouisianaMaine
IdahoIllinoisIndiana
Iowa
District of ColumbiaFlorida
GeorgiaHawaii
California
ColoradoConnecticutDelaware
AlabamaAlaskaArizonaArkansas
Total
Category Age
State or area

SSI Recipients by State and County, 2003 ♦ 3
Alabama
Table 3.Number of recipients in state (by eligibility category, age, and receipt of OASDI benefits)and amount of payments, by county, December 2003
AgedBlind anddisabled Under 18 18–64
65 orolder
Total, Alabama 163,772 21,005 142,767 27,308 97,739 38,725 67,035 65,133
1,288 163 1,125 257 761 270 499 5332,818 312 2,506 464 1,824 530 1,176 1,1551,630 259 1,371 285 838 507 750 671
924 93 831 186 553 185 419 3551,193 209 984 138 698 357 566 447
931 198 733 174 440 317 419 3861,291 226 1,065 213 706 372 581 5114,658 403 4,255 695 3,119 844 1,920 1,8261,429 220 1,209 221 803 405 598 554
727 104 623 85 457 185 344 267
1,272 180 1,092 160 782 330 568 501964 209 755 103 504 357 451 373
1,713 288 1,425 202 1,028 483 795 644521 97 424 72 283 166 238 188481 67 414 65 276 140 227 180
1,455 235 1,220 230 863 362 658 5521,887 222 1,665 256 1,199 432 817 729
854 137 717 114 494 246 372 319519 48 471 83 341 95 220 197
1,669 284 1,385 188 988 493 844 560
734 167 567 73 368 293 375 2632,455 456 1,999 295 1,415 745 1,216 8541,922 250 1,672 331 1,160 431 854 8374,867 655 4,212 852 2,854 1,161 1,760 2,0472,224 460 1,764 163 1,296 765 1,164 798
1,975 207 1,768 414 1,180 381 754 7991,466 235 1,231 175 892 399 689 5414,422 485 3,937 574 2,868 980 1,851 1,721
767 128 639 66 474 227 356 2861,158 173 985 114 715 329 526 431
1,176 198 978 135 675 366 606 460929 186 743 124 487 318 395 359
1,219 242 977 211 615 393 528 490746 171 575 109 365 272 391 280
3,651 466 3,185 721 2,101 829 1,643 1,502
1,784 312 1,472 161 1,025 598 847 60622,934 2,070 20,864 4,888 14,005 4,041 7,950 9,884
642 123 519 65 376 201 317 2342,787 334 2,453 357 1,813 617 1,213 1,1051,211 224 987 118 692 401 576 425
Total
Amount ofpayments
(thousandsof dollars)
Category Age
SSIrecipients
alsoreceiving
OASDICounty
AutaugaBaldwinBarbourBibbBlount
BullockButlerCalhounChambersCherokee
ChiltonChoctawClarkeClayCleburne
CoffeeColbertConecuhCoosaCovington
CrenshawCullmanDaleDallasDeKalb
ElmoreEscambiaEtowahFayetteFranklin
GenevaGreeneHaleHenryHouston
JacksonJeffersonLamarLauderdaleLawrence
(Continued)

4 ♦ SSI Recipients by State and County, 2003
Alabama
Table 3.Continued
AgedBlind anddisabled Under 18 18–64
65 orolder
2,804 352 2,452 550 1,586 668 1,095 1,1121,735 294 1,441 186 1,027 522 821 611
930 149 781 151 521 258 406 3711,291 189 1,102 223 717 351 505 4995,879 768 5,111 991 3,471 1,417 2,333 2,309
1,535 249 1,286 238 874 423 624 6151,027 162 865 100 631 296 484 3833,031 496 2,535 330 1,810 891 1,510 1,093
13,910 1,519 12,391 2,516 8,612 2,782 4,991 5,6151,078 174 904 118 656 304 503 399
9,494 1,034 8,460 2,292 5,281 1,921 3,538 3,9453,161 398 2,763 471 1,906 784 1,386 1,1751,250 212 1,038 256 648 346 456 5051,423 272 1,151 211 748 464 593 5541,694 254 1,440 286 910 498 751 659
836 146 690 108 466 262 366 3102,069 311 1,758 368 1,136 565 783 8221,538 160 1,378 254 970 314 616 5851,510 143 1,367 213 1,015 282 637 5591,212 224 988 191 631 390 474 523
4,135 314 3,821 621 2,710 804 1,636 1,6691,845 208 1,637 370 1,055 420 800 7426,025 530 5,495 1,302 3,579 1,144 2,204 2,4733,230 324 2,906 348 2,179 703 1,326 1,222
839 148 691 76 512 251 408 316
1,793 258 1,535 271 1,056 466 695 7511,110 197 913 114 653 343 574 415
95 24 71 16 46 33 47 30
Amount ofpayments
(thousandsof dollars)
LeeLimestoneLowndes
County Total
Category Age
SSIrecipients
alsoreceiving
OASDI
MaconMadison
MarengoMarionMarshallMobileMonroe
MontgomeryMorganPerryPickensPike
Tuscaloosa
RandolphRussellShelbySt. Clair
Walker
Sumter
SOURCE: Social Security Administration, Supplemental Security Record (Characteristic Extract Record format), 100 percent data.
Washington
WilcoxWinston
Unknown
TalladegaTallapoosa

SSI Recipients by State and County, 2003 ♦ 5
Alaska
Table 3.Number of recipients in state (by eligibility category, age, and receipt of OASDI benefits)and amount of payments, by county, December 2003
AgedBlind anddisabled Under 18 18–64
65 orolder
Total, Alaska 10,651 2,229 8,422 1,064 6,539 3,048 3,697 4,359
29 9 20 2 16 11 15 84,969 917 4,052 533 3,181 1,255 1,419 2,113
29 13 16 a a 17 20 759 14 45 8 33 18 22 20
459 202 257 41 132 286 253 164
136 60 76 8 61 67 82 37160 31 129 21 100 39 53 61
24 6 18 2 13 9 10 7862 98 764 83 616 163 276 360
34 4 30 2 26 6 10 14
569 105 464 97 344 128 229 222725 85 640 56 537 132 281 305213 29 184 10 166 37 78 88111 53 58 9 37 65 64 33
87 30 57 9 43 35 25 37
97 50 47 a a 65 37 38840 91 749 74 627 139 255 390214 90 124 21 73 120 104 70
19 2 17 0 14 5 10 745 9 36 3 29 13 14 16
53 5 48 6 40 7 13 2287 10 77 9 62 16 29 3427 3 24 4 18 5 9 10
163 49 114 13 75 75 45 7468 28 40 2 30 36 29 24
91 16 75 8 64 19 43 38278 142 136 26 69 183 178 86
54 8 46 4 39 11 18 20141 70 71 8 47 86 75 48
8 0 8 2 6 0 1 4
a.
Yukon-Koyukuk
Unknown
SOURCE: Social Security Administration, Supplemental Security Record (Characteristic Extract Record format), 100 percent data.
Upper Yukon
Valdez-Chitina-WhittierWade HamptonWrangell-Petersburg
SewardSitka
Kuskokwim
Skagway-YakutatSoutheast Fairbanks
Matanuska-SusitnaNomeOuter KetchikanPrince of Wales
Kenai-Cook InletKetchikan GatewayKobukKodiak Island
Cordova-McCarthyFairbanks North StarHaines
Juneau
Barrow-North SlopeBethel
Bristol BayBristol Bay Borough
Data not shown to avoid disclosure of information for particular individuals.
Total
Amount ofpayments
(thousandsof dollars)
Category Age
SSIrecipients
alsoreceiving
OASDICounty
Aleutian IslandsAnchorageAngoon

6 ♦ SSI Recipients by State and County, 2003
Arizona
Table 3.Number of recipients in state (by eligibility category, age, and receipt of OASDI benefits)and amount of payments, by county, December 2003
AgedBlind anddisabled Under 18 18–64
65 orolder
Total, Arizona 91,853 13,244 78,609 15,556 53,555 22,742 29,928 39,176
4,609 975 3,634 585 2,000 2,024 1,870 1,9002,579 526 2,053 271 1,498 810 1,039 9643,112 459 2,653 384 1,613 1,115 1,280 1,2041,150 122 1,028 164 754 232 370 480
932 102 830 159 569 204 321 382
125 14 111 11 80 34 52 50385 46 339 45 259 81 133 165
44,814 5,602 39,212 8,990 26,501 9,323 12,959 19,6412,957 245 2,712 429 2,092 436 1,046 1,4214,466 679 3,787 781 2,282 1,403 1,454 1,855
15,877 2,381 13,496 2,276 9,661 3,940 5,176 6,7333,671 405 3,266 617 2,277 777 1,275 1,5991,250 582 668 126 372 752 545 4452,912 277 2,635 341 2,127 444 1,124 1,2062,950 825 2,125 364 1,431 1,155 1,263 1,104
64 4 60 13 39 12 21 28
Pinal
Maricopa
SOURCE: Social Security Administration, Supplemental Security Record (Characteristic Extract Record format), 100 percent data.
Santa CruzYavapaiYuma
Unknown
MohaveNavajo
Pima
GilaGraham
GreenleeLa Paz
County
ApacheCochiseCoconino
Total
Amount ofpayments
(thousandsof dollars)
Category Age
SSIrecipients
alsoreceiving
OASDI
SSI Recipients by State and County, 2003 ♦ 7
Arkansas
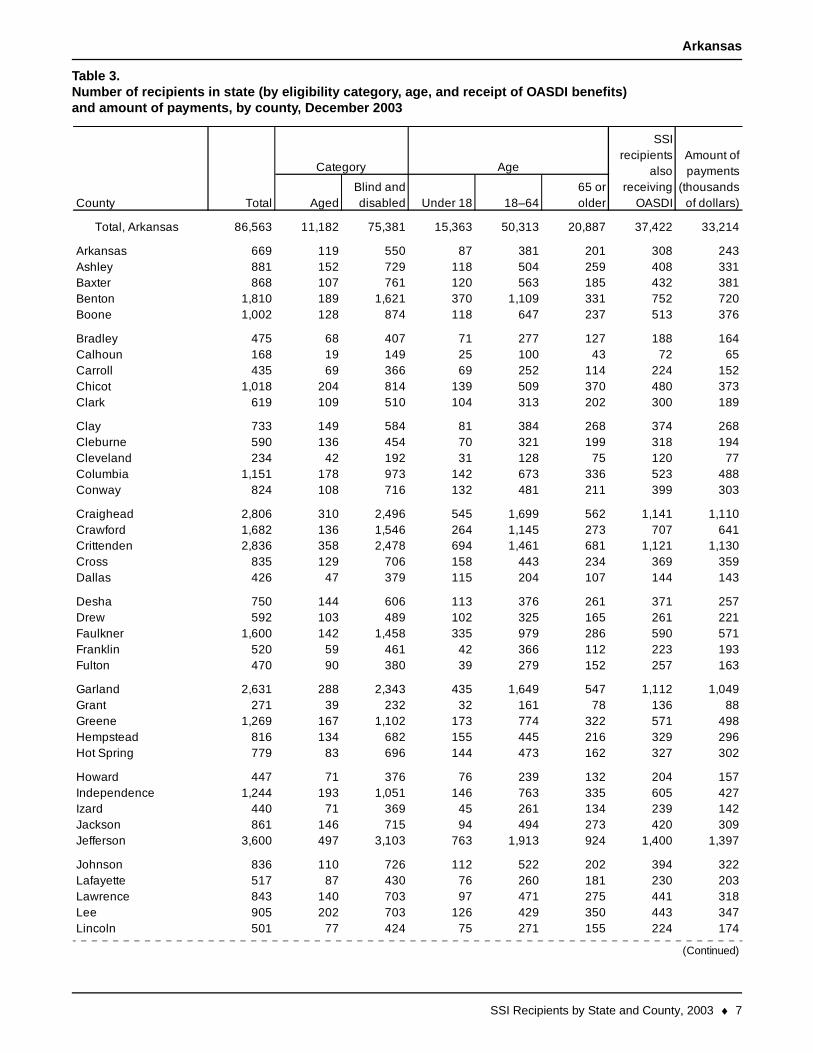
Table 3.Number of recipients in state (by eligibility category, age, and receipt of OASDI benefits)and amount of payments, by county, December 2003
AgedBlind anddisabled Under 18 18–64
65 orolder
Total, Arkansas 86,563 11,182 75,381 15,363 50,313 20,887 37,422 33,214
669 119 550 87 381 201 308 243881 152 729 118 504 259 408 331868 107 761 120 563 185 432 381
1,810 189 1,621 370 1,109 331 752 7201,002 128 874 118 647 237 513 376
475 68 407 71 277 127 188 164168 19 149 25 100 43 72 65435 69 366 69 252 114 224 152
1,018 204 814 139 509 370 480 373619 109 510 104 313 202 300 189
733 149 584 81 384 268 374 268590 136 454 70 321 199 318 194234 42 192 31 128 75 120 77
1,151 178 973 142 673 336 523 488824 108 716 132 481 211 399 303
2,806 310 2,496 545 1,699 562 1,141 1,1101,682 136 1,546 264 1,145 273 707 6412,836 358 2,478 694 1,461 681 1,121 1,130
835 129 706 158 443 234 369 359426 47 379 115 204 107 144 143
750 144 606 113 376 261 371 257592 103 489 102 325 165 261 221
1,600 142 1,458 335 979 286 590 571520 59 461 42 366 112 223 193470 90 380 39 279 152 257 163
2,631 288 2,343 435 1,649 547 1,112 1,049271 39 232 32 161 78 136 88
1,269 167 1,102 173 774 322 571 498816 134 682 155 445 216 329 296779 83 696 144 473 162 327 302
447 71 376 76 239 132 204 1571,244 193 1,051 146 763 335 605 427
440 71 369 45 261 134 239 142861 146 715 94 494 273 420 309
3,600 497 3,103 763 1,913 924 1,400 1,397
836 110 726 112 522 202 394 322517 87 430 76 260 181 230 203843 140 703 97 471 275 441 318905 202 703 126 429 350 443 347501 77 424 75 271 155 224 174Lincoln
(Continued)
JohnsonLafayetteLawrenceLee
IndependenceIzardJacksonJefferson
GreeneHempsteadHot Spring
Howard
FranklinFulton
GarlandGrant
Dallas
DeshaDrewFaulkner
CraigheadCrawfordCrittendenCross
CleburneClevelandColumbiaConway
CarrollChicotClark
Clay
BentonBoone
BradleyCalhoun
County
ArkansasAshleyBaxter
Total
Amount ofpayments
(thousandsof dollars)
Category Age
SSIrecipients
alsoreceiving
OASDI
8 ♦ SSI Recipients by State and County, 2003
Arkansas
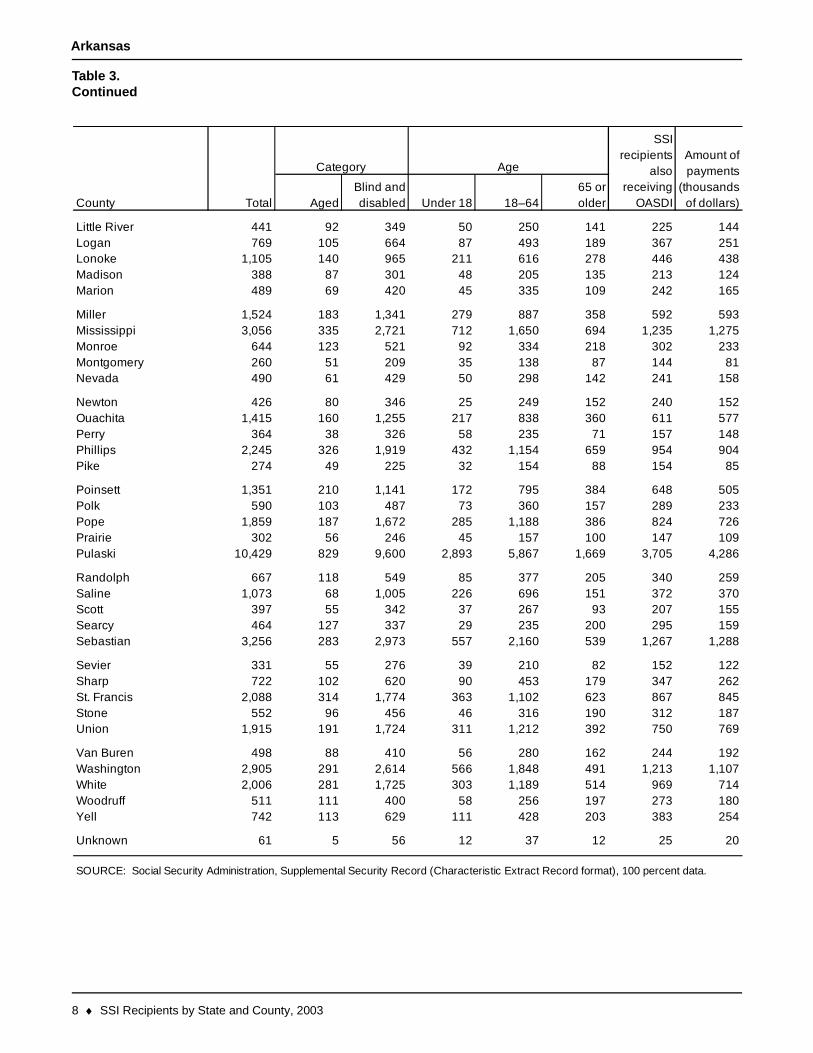
Table 3.Continued
AgedBlind anddisabled Under 18 18–64
65 orolder
441 92 349 50 250 141 225 144769 105 664 87 493 189 367 251
1,105 140 965 211 616 278 446 438388 87 301 48 205 135 213 124489 69 420 45 335 109 242 165
1,524 183 1,341 279 887 358 592 5933,056 335 2,721 712 1,650 694 1,235 1,275
644 123 521 92 334 218 302 233260 51 209 35 138 87 144 81490 61 429 50 298 142 241 158
426 80 346 25 249 152 240 1521,415 160 1,255 217 838 360 611 577
364 38 326 58 235 71 157 1482,245 326 1,919 432 1,154 659 954 904
274 49 225 32 154 88 154 85
1,351 210 1,141 172 795 384 648 505590 103 487 73 360 157 289 233
1,859 187 1,672 285 1,188 386 824 726302 56 246 45 157 100 147 109
10,429 829 9,600 2,893 5,867 1,669 3,705 4,286
667 118 549 85 377 205 340 2591,073 68 1,005 226 696 151 372 370
397 55 342 37 267 93 207 155464 127 337 29 235 200 295 159
3,256 283 2,973 557 2,160 539 1,267 1,288
331 55 276 39 210 82 152 122722 102 620 90 453 179 347 262
2,088 314 1,774 363 1,102 623 867 845552 96 456 46 316 190 312 187
1,915 191 1,724 311 1,212 392 750 769
498 88 410 56 280 162 244 1922,905 291 2,614 566 1,848 491 1,213 1,1072,006 281 1,725 303 1,189 514 969 714
511 111 400 58 256 197 273 180742 113 629 111 428 203 383 254
61 5 56 12 37 12 25 20
Washington
St. Francis
SOURCE: Social Security Administration, Supplemental Security Record (Characteristic Extract Record format), 100 percent data.
WhiteWoodruffYell
Unknown
StoneUnion
Van Buren
SearcySebastian
SevierSharp
Pulaski
RandolphSalineScott
PoinsettPolkPopePrairie
OuachitaPerryPhillipsPike
MonroeMontgomeryNevada
Newton
MadisonMarion
MillerMississippi
Little RiverLoganLonoke
County Total
Category Age
SSIrecipients
alsoreceiving
OASDI
Amount ofpayments
(thousandsof dollars)

SSI Recipients by State and County, 2003 ♦ 9
California
Table 3.Number of recipients in state (by eligibility category, age, and receipt of OASDI benefits)and amount of payments, by county, December 2003
AgedBlind anddisabled Under 18 18–64
65 orolder
Total, California 1,161,467 345,681 815,786 92,704 566,668 502,095 433,485 668,122
48,900 15,000 33,900 3,307 24,469 21,124 15,390 29,57829 5 24 0 20 9 14 14
489 70 419 38 334 117 252 2559,985 1,076 8,909 888 7,014 2,083 4,478 5,5651,006 132 874 82 680 244 499 546
563 160 403 19 300 244 350 27021,990 5,350 16,640 1,827 12,121 8,042 7,302 13,003
1,953 164 1,789 142 1,453 358 850 1,0702,754 410 2,344 183 1,930 641 1,334 1,466
38,896 8,725 30,171 3,809 20,832 14,255 16,452 22,136
968 186 782 76 606 286 489 5156,612 479 6,133 442 5,163 1,007 2,935 3,8159,342 3,788 5,554 548 3,609 5,185 5,606 4,450
432 81 351 20 273 139 243 20629,320 5,127 24,193 3,416 17,457 8,447 13,364 16,141
4,264 968 3,296 519 2,265 1,480 2,086 2,2943,669 386 3,283 255 2,668 746 1,760 2,0471,069 125 944 90 737 242 527 562
388,235 138,847 249,388 30,558 159,982 197,695 129,680 230,2254,441 1,047 3,394 471 2,254 1,716 2,372 2,245
3,542 742 2,800 146 2,317 1,079 1,439 1,955358 63 295 31 239 88 169 183
3,900 483 3,417 255 2,758 887 1,802 2,13310,061 2,190 7,871 1,120 5,426 3,515 4,406 5,540
341 50 291 24 225 92 190 168
106 20 86 5 71 30 51 558,957 2,627 6,330 787 4,399 3,771 4,764 4,4492,068 438 1,630 171 1,233 664 963 1,1331,646 203 1,443 107 1,193 346 831 868
61,912 25,159 36,753 3,535 24,624 33,753 18,831 36,105
4,523 751 3,772 307 2,898 1,318 2,099 2,385698 84 614 37 517 144 367 342
45,584 10,888 34,696 4,883 24,453 16,248 20,689 24,39054,037 9,186 44,851 5,103 32,360 16,574 16,748 33,286
835 293 542 59 376 400 492 375
60,845 12,419 48,426 8,171 33,553 19,121 23,829 34,44979,578 23,800 55,778 5,577 40,304 33,697 31,634 43,81745,681 20,122 25,559 772 18,156 26,753 15,535 27,79426,331 4,715 21,616 2,860 15,421 8,050 9,624 15,526
5,345 817 4,528 396 3,639 1,310 2,840 2,677
Total
Amount ofpayments
(thousandsof dollars)
Category Age
SSIrecipients
alsoreceiving
OASDICounty
AlamedaAlpineAmadorButteCalaveras
ColusaContra CostaDel NorteEl DoradoFresno
GlennHumboldtImperialInyoKern
KingsLakeLassenLos AngelesMadera
MarinMariposaMendocinoMercedModoc
MonoMontereyNapaNevadaOrange
PlacerPlumasRiversideSacramentoSan Benito
San BernardinoSan DiegoSan FranciscoSan JoaquinSan Luis Obispo
(Continued)

10 ♦ SSI Recipients by State and County, 2003
California
Table 3.Continued
AgedBlind anddisabled Under 18 18–64
65 orolder
12,577 5,702 6,875 518 4,800 7,259 4,698 6,8599,640 2,198 7,442 753 5,618 3,269 4,855 5,104
42,500 18,625 23,875 1,656 15,979 24,865 11,683 25,4245,475 1,150 4,325 315 3,399 1,761 2,922 2,8878,991 850 8,141 674 6,564 1,753 4,018 4,945
82 18 64 5 49 28 41 482,436 301 2,135 151 1,715 570 1,171 1,326
10,204 2,500 7,704 1,151 5,541 3,512 3,794 5,7529,315 1,531 7,784 604 6,170 2,541 4,389 4,782
19,593 3,743 15,850 1,833 11,272 6,488 8,397 10,901
3,347 860 2,487 240 1,839 1,268 1,723 1,7582,629 339 2,290 185 1,804 640 1,308 1,378
558 69 489 24 416 118 272 28717,079 4,045 13,034 1,726 8,848 6,505 8,882 8,852
1,673 225 1,448 113 1,197 363 838 857
14,939 4,677 10,262 1,035 7,496 6,408 7,444 7,7024,816 1,065 3,751 333 2,756 1,727 1,990 2,7153,696 457 3,239 313 2,493 890 1,527 2,137
652 150 502 39 383 230 247 375
San MateoSanta BarbaraSanta ClaraSanta CruzShasta
SierraSiskiyouSolanoSonomaStanislaus
SutterTehamaTrinityTulareTuolumne
VenturaYoloYuba
Unknown
SOURCE: Social Security Administration, Supplemental Security Record (Characteristic Extract Record format), 100 percent data.
County Total
Category Age
SSIrecipients
alsoreceiving
OASDI
Amount ofpayments
(thousandsof dollars)

SSI Recipients by State and County, 2003 ♦ 11
Colorado
Table 3.Number of recipients in state (by eligibility category, age, and receipt of OASDI benefits)and amount of payments, by county, December 2003
AgedBlind anddisabled Under 18 18–64
65 orolder
Total, Colorado 54,054 8,555 45,499 6,587 33,808 13,659 19,566 21,725
4,342 754 3,588 593 2,571 1,178 1,323 1,853562 91 471 42 370 150 252 206
3,494 758 2,736 456 2,004 1,034 981 1,497112 23 89 6 75 31 58 39
99 25 74 12 54 33 48 31
197 33 164 22 119 56 79 792,429 466 1,963 232 1,527 670 870 1,034
12 a a a a a a 6207 40 167 22 134 51 103 72
14 a a a a a a 4
51 8 43 4 33 14 24 18434 141 293 27 202 205 218 150288 96 192 18 128 142 187 86124 8 116 17 83 24 37 49
27 3 24 0 23 4 12 9
458 88 370 42 278 138 221 15413,208 2,483 10,725 1,590 7,722 3,896 4,407 5,367
32 3 29 3 25 4 14 11173 27 146 27 112 34 57 82
55 9 46 15 28 12 21 20
5,667 625 5,042 871 3,708 1,088 1,977 2,28039 7 32 8 22 9 12 15
886 86 800 104 636 146 367 359324 37 287 43 219 62 133 119
5 a a a a a a 1
47 11 36 7 28 12 22 1859 8 51 5 41 13 24 20
4 a a a a a a 1272 53 219 11 161 100 117 95
12 a a a a a a 7
3,943 599 3,344 494 2,594 855 1,254 1,64117 2 15 2 12 3 6 675 19 56 7 47 21 42 25
405 51 354 31 279 95 183 15453 6 47 7 39 7 23 21
1,851 206 1,645 230 1,274 347 758 721596 107 489 39 388 169 254 211
47 10 37 8 25 14 20 18310 42 268 39 208 63 150 119
2,088 233 1,855 251 1,432 405 817 792
County Total
Amount ofpayments
(thousandsof dollars)
Category Age
SSIrecipients
alsoreceiving
OASDI
AdamsAlamosaArapahoeArchuletaBaca
BentBoulderBroomfieldChaffeeCheyenne
Clear CreekConejosCostillaCrowleyCuste
DeltaDenverDoloresDouglasEagle
El PasoElbertFremontGarfieldGilpin
GrandGunnisonHinsdaleHuerfanoJackson
JeffersonKiowaKit CarsonLa PlataLake
LarimerLas AnimasLincolnLoganMesa
(Continued)

12 ♦ SSI Recipients by State and County, 2003
Colorado
Table 3.Continued
AgedBlind anddisabled Under 18 18–64
65 orolder
5 a a a a a a 2120 16 104 13 83 24 55 42450 65 385 60 284 106 188 194568 95 473 62 350 156 250 211320 47 273 45 187 88 142 133
836 127 709 91 485 260 375 31013 a a a a a a 447 2 45 6 35 6 15 2056 13 43 3 33 20 35 1320 2 18 2 13 5 5 11
342 63 279 52 193 97 159 1264,876 395 4,481 523 3,497 856 1,792 1,982
46 9 37 3 29 14 24 15352 83 269 36 181 135 187 124
70 7 63 6 53 11 24 26
132 43 89 11 65 56 63 544 a a a a a a 1
21 6 15 a 14 a 8 831 3 28 2 23 6 15 1025 3 22 4 16 5 7 10
89 7 82 10 65 14 29 2945 14 31 8 19 18 12 16
2,402 357 2,045 344 1,423 635 1,003 932113 23 90 16 69 28 52 40
53 6 47 1 41 11 22 20
a.
MineralMoffatMontezumaMontroseMorgan
OteroOurayParkPhillipsPitkin
ProwersPueblo
SedgwickSummit
Rio BlancoRio GrandeRoutt
Saguache
Unknown
SOURCE: Social Security Administration, Supplemental Security Record (Characteristic Extract Record format), 100 percent data.
Data not shown to avoid disclosure of information for particular individuals.
TellerWashingtonWeldYuma
San JuanSan Miguel
County Total
Category Age
SSIrecipients
alsoreceiving
OASDI
Amount ofpayments
(thousandsof dollars)

SSI Recipients by State and County, 2003 ♦ 13
Connecticut
Table 3.Number of recipients in state (by eligibility category, age, and receipt of OASDI benefits)and amount of payments, by county, December 2003
AgedBlind anddisabled Under 18 18–64
65 orolder
Total, Connecticut 51,170 6,945 44,225 6,293 32,450 12,427 15,490 21,730
10,451 2,049 8,402 1,046 6,104 3,301 3,088 4,28517,262 2,505 14,757 2,239 10,539 4,484 5,145 7,391
1,294 108 1,186 107 998 189 481 5281,212 110 1,102 112 857 243 413 508
15,256 1,678 13,578 2,086 9,937 3,233 4,417 6,554
3,162 280 2,882 387 2,202 573 1,041 1,396599 72 527 55 442 102 213 258
1,912 141 1,771 257 1,356 299 690 801
22 2 20 4 15 3 2 10Unknown
SOURCE: Social Security Administration, Supplemental Security Record (Characteristic Extract Record format), 100 percent data.
New Haven
New LondonTollandWindham
FairfieldHartfordLitchfieldMiddlesex
Total
Amount ofpayments
(thousandsof dollars)
Category Age
SSIrecipients
alsoreceiving
OASDICounty
14 ♦ SSI Recipients by State and County, 2003
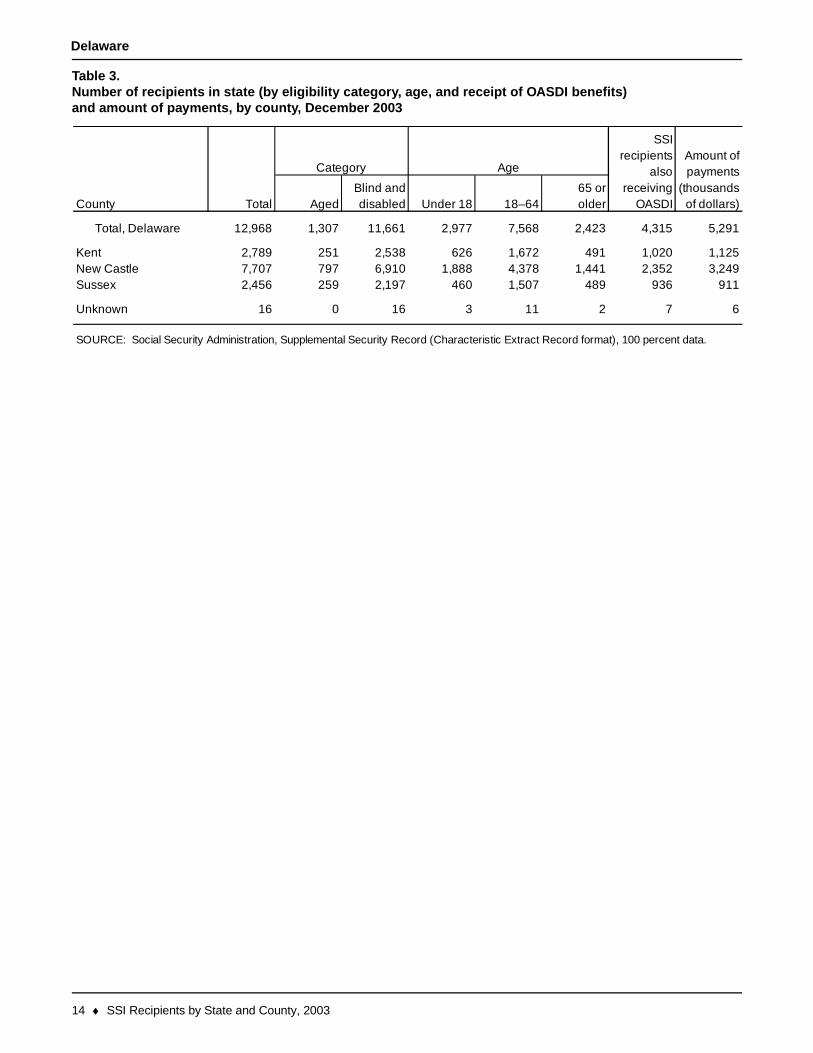
Delaware
Table 3.Number of recipients in state (by eligibility category, age, and receipt of OASDI benefits)and amount of payments, by county, December 2003
AgedBlind anddisabled Under 18 18–64
65 orolder
Total, Delaware 12,968 1,307 11,661 2,977 7,568 2,423 4,315 5,291
2,789 251 2,538 626 1,672 491 1,020 1,1257,707 797 6,910 1,888 4,378 1,441 2,352 3,2492,456 259 2,197 460 1,507 489 936 911
16 0 16 3 11 2 7 6
SSIrecipients
alsoreceiving
OASDICounty
SOURCE: Social Security Administration, Supplemental Security Record (Characteristic Extract Record format), 100 percent data.
Unknown
KentNew CastleSussex
Total
Amount ofpayments
(thousandsof dollars)
Category Age

SSI Recipients by State and County, 2003 ♦ 15
Florida
Table 3.Number of recipients in state (by eligibility category, age, and receipt of OASDI benefits)and amount of payments, by county, December 2003
AgedBlind anddisabled Under 18 18–64
65 orolder
Total, Florida 410,027 95,672 314,355 77,292 195,795 136,940 137,389 167,804
5,125 480 4,645 1,111 3,087 927 1,664 2,044468 45 423 72 315 81 154 218
3,862 407 3,455 654 2,442 766 1,503 1,502734 74 660 126 452 156 264 300
8,589 943 7,646 2,158 4,962 1,469 2,807 3,549
31,065 8,087 22,978 5,965 14,344 10,756 9,720 12,691489 64 425 50 281 158 222 163
1,713 273 1,440 313 1,010 390 662 6681,768 209 1,559 237 1,188 343 698 6661,379 145 1,234 320 818 241 433 574
2,131 585 1,546 302 1,020 809 813 7972,490 239 2,251 526 1,502 462 908 1,017
757 96 661 165 436 156 305 288607 49 558 102 395 110 248 265
19,061 2,381 16,680 4,393 10,652 4,016 6,003 8,046
8,866 840 8,026 1,906 5,359 1,601 2,997 3,608660 125 535 143 350 167 249 267360 62 298 34 193 133 182 152
2,584 310 2,274 587 1,369 628 1,087 1,046370 31 339 48 245 77 155 168
123 22 101 32 55 36 43 57356 45 311 39 229 88 151 125545 79 466 100 289 156 253 209864 161 703 144 465 255 407 332887 184 703 221 406 260 327 352
2,240 233 2,007 436 1,409 395 839 9012,145 305 1,840 487 1,158 500 866 845
29,244 4,477 24,767 7,149 15,149 6,946 9,119 12,406693 98 595 67 432 194 320 251
1,373 157 1,216 295 807 271 541 513
1,998 303 1,695 336 1,082 580 858 759646 107 539 128 335 183 254 256137 24 113 24 76 37 60 46
4,148 527 3,621 945 2,362 841 1,625 1,6636,878 841 6,037 1,660 3,820 1,398 2,271 2,745
4,261 481 3,780 1,041 2,364 856 1,420 1,7771,044 118 926 176 647 221 408 443
215 23 192 32 139 44 86 97985 122 863 229 507 249 364 407
3,820 459 3,361 984 2,108 728 1,413 1,548
County Total
Amount ofpayments
(thousandsof dollars)
Category Age
SSIrecipients
alsoreceiving
OASDI
AlachuaBakerBayBradfordBrevard
BrowardCalhounCharlotteCitrusClay
CollierColumbiaDeSotoDixieDuval
EscambiaFlaglerFranklinGadsdenGilchrist
GladesGulfHamiltonHardeeHendry
HernandoHighlandsHillsboroughHolmesIndian River
JacksonJeffersonLafayetteLakeLee
LeonLevyLibertyMadisonManatee
(Continued)

16 ♦ SSI Recipients by State and County, 2003
Florida
Table 3.Continued
AgedBlind anddisabled Under 18 18–64
65 orolder
6,637 805 5,832 1,413 3,889 1,335 2,467 2,6801,315 162 1,153 372 704 239 465 575
123,324 53,091 70,233 13,646 39,301 70,377 39,895 50,4821,224 274 950 124 685 415 429 458
766 62 704 149 473 144 276 308
2,475 244 2,231 442 1,577 456 958 932888 106 782 174 533 181 364 348
24,279 3,662 20,617 7,160 11,583 5,536 6,897 10,3503,946 657 3,289 1,052 1,916 978 1,196 1,671
15,805 3,777 12,028 3,017 7,657 5,131 5,134 6,463
7,595 720 6,875 1,511 4,879 1,205 2,795 3,18116,941 2,245 14,696 3,267 10,111 3,563 6,056 6,86813,978 1,350 12,628 3,883 7,737 2,358 4,848 5,658
2,727 229 2,498 495 1,727 505 1,045 1,1081,637 163 1,474 264 1,066 307 566 663
3,544 569 2,975 635 2,070 839 1,306 1,3605,029 781 4,248 1,267 2,529 1,233 1,610 1,9821,749 228 1,521 331 1,047 371 698 6605,173 553 4,620 1,424 2,843 906 1,777 2,1741,223 126 1,097 281 695 247 495 492
1,140 147 993 207 659 274 463 444655 83 572 131 370 154 244 267312 39 273 53 191 68 117 127
9,411 1,084 8,327 1,908 5,663 1,840 3,520 3,798512 65 447 101 304 107 198 192
847 94 753 94 556 197 357 339860 97 763 101 554 205 405 306
355 48 307 53 217 85 109 156
SOURCE: Social Security Administration, Supplemental Security Record (Characteristic Extract Record format), 100 percent data.
Marion
County Total
Category Age
SSIrecipients
alsoreceiving
OASDI
Amount ofpayments
(thousandsof dollars)
MartinMiami-DadeMonroeNassau
OkaloosaOkeechobeeOrangeOsceolaPalm Beach
PascoPinellasPolk
Sumter
Wakulla
PutnamSanta Rosa
SarasotaSeminoleSt. JohnsSt. Lucie
WaltonWashington
Unknown
SuwanneeTaylorUnionVolusia

SSI Recipients by State and County, 2003 ♦ 17
Georgia
Table 3.Number of recipients in state (by eligibility category, age, and receipt of OASDI benefits)and amount of payments, by county, December 2003
AgedBlind anddisabled Under 18 18–64
65 orolder
Total, Georgia 199,991 29,708 170,283 30,857 115,188 53,946 77,774 78,971
737 126 611 107 396 234 348 290403 58 345 53 226 124 187 143453 59 394 56 289 108 192 166199 41 158 25 104 70 98 74
1,345 123 1,222 197 877 271 437 508
286 40 246 33 174 79 139 941,271 171 1,100 179 770 322 503 4851,452 173 1,279 177 950 325 622 551
777 134 643 87 450 240 392 262660 97 563 87 387 186 307 237
6,903 672 6,231 1,090 4,323 1,490 2,755 2,767428 79 349 63 222 143 194 169467 54 413 59 299 109 210 176678 138 540 83 346 249 341 248471 54 417 80 276 115 182 198
1,564 193 1,371 264 903 397 626 6111,098 168 930 193 580 325 457 434
504 72 432 62 302 140 256 176371 86 285 39 174 158 196 131626 67 559 123 380 123 250 248
522 70 452 53 297 172 231 1782,456 306 2,150 356 1,503 597 980 990
757 81 676 111 476 170 319 306365 53 312 64 192 109 158 131
6,436 920 5,516 1,141 3,653 1,642 2,357 2,435
120 7 113 25 70 25 42 44827 103 724 82 531 214 362 309904 148 756 110 551 243 374 355
2,567 312 2,255 438 1,537 592 1,032 1,008212 46 166 28 99 85 108 72
5,465 607 4,858 1,315 3,118 1,032 1,468 2,368429 35 394 49 282 98 175 161
6,213 1,065 5,148 1,250 3,390 1,573 1,816 2,6951,494 207 1,287 230 872 392 649 5991,880 252 1,628 333 1,048 499 779 729
856 138 718 155 478 223 294 353621 114 507 90 331 200 296 229
1,434 187 1,247 224 870 340 588 549270 50 220 23 159 88 125 117
1,177 150 1,027 155 701 321 458 468Crisp
(Continued)
ColumbiaCookCowetaCrawford
ClinchCobbCoffeeColquitt
CherokeeClarkeClay
Clayton
CharltonChatham
ChattahoocheeChattooga
Camden
CandlerCarrollCatoosa
BullochBurkeButtsCalhoun
BleckleyBrantleyBrooksBryan
BartowBen HillBerrien
Bibb
BakerBaldwin
BanksBarrow
County
ApplingAtkinsonBacon
Total
Amount ofpayments
(thousandsof dollars)
Category Age
SSIrecipients
alsoreceiving
OASDI
18 ♦ SSI Recipients by State and County, 2003
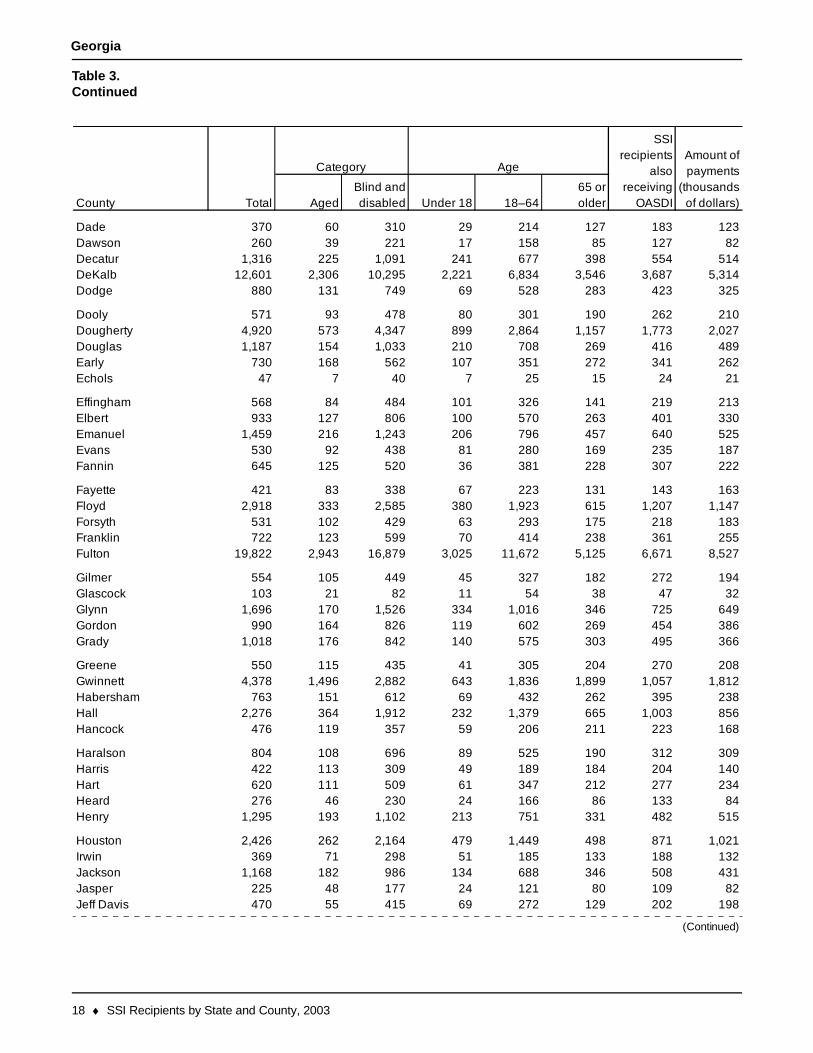
Georgia
Table 3.Continued
AgedBlind anddisabled Under 18 18–64
65 orolder
370 60 310 29 214 127 183 123260 39 221 17 158 85 127 82
1,316 225 1,091 241 677 398 554 51412,601 2,306 10,295 2,221 6,834 3,546 3,687 5,314
880 131 749 69 528 283 423 325
571 93 478 80 301 190 262 2104,920 573 4,347 899 2,864 1,157 1,773 2,0271,187 154 1,033 210 708 269 416 489
730 168 562 107 351 272 341 26247 7 40 7 25 15 24 21
568 84 484 101 326 141 219 213933 127 806 100 570 263 401 330
1,459 216 1,243 206 796 457 640 525530 92 438 81 280 169 235 187645 125 520 36 381 228 307 222
421 83 338 67 223 131 143 1632,918 333 2,585 380 1,923 615 1,207 1,147
531 102 429 63 293 175 218 183722 123 599 70 414 238 361 255
19,822 2,943 16,879 3,025 11,672 5,125 6,671 8,527
554 105 449 45 327 182 272 194103 21 82 11 54 38 47 32
1,696 170 1,526 334 1,016 346 725 649990 164 826 119 602 269 454 386
1,018 176 842 140 575 303 495 366
550 115 435 41 305 204 270 2084,378 1,496 2,882 643 1,836 1,899 1,057 1,812
763 151 612 69 432 262 395 2382,276 364 1,912 232 1,379 665 1,003 856
476 119 357 59 206 211 223 168
804 108 696 89 525 190 312 309422 113 309 49 189 184 204 140620 111 509 61 347 212 277 234276 46 230 24 166 86 133 84
1,295 193 1,102 213 751 331 482 515
2,426 262 2,164 479 1,449 498 871 1,021369 71 298 51 185 133 188 132
1,168 182 986 134 688 346 508 431225 48 177 24 121 80 109 82470 55 415 69 272 129 202 198
IrwinJacksonJasperJeff Davis
HartHeardHenry
Houston
HallHancock
HaralsonHarris
Grady
GreeneGwinnettHabersham
GilmerGlascockGlynnGordon
FloydForsythFranklinFulton
EmanuelEvansFannin
Fayette
EarlyEchols
EffinghamElbert
Dodge
DoolyDoughertyDouglas
DadeDawsonDecatur
County Total
Category Age
SSIrecipients
alsoreceiving
OASDI
Amount ofpayments
(thousandsof dollars)
(Continued)
DeKalb

SSI Recipients by State and County, 2003 ♦ 19
Georgia
Table 3.Continued
AgedBlind anddisabled Under 18 18–64
65 orolder
1,178 209 969 176 632 370 509 457479 70 409 71 243 165 224 165483 103 380 66 251 166 232 185353 33 320 49 229 75 152 175368 58 310 36 219 113 181 132
255 35 220 27 156 72 129 951,943 295 1,648 261 1,098 584 838 728
352 58 294 58 196 98 157 133989 139 850 224 515 250 357 374249 55 194 32 126 91 128 89
153 24 129 16 85 52 70 522,877 374 2,503 494 1,635 748 1,202 1,086
408 72 336 22 236 150 203 130755 135 620 77 421 257 310 305773 106 667 112 454 207 310 295
243 49 194 28 112 103 96 84848 117 731 92 504 252 349 324397 55 342 54 228 115 206 144942 153 789 155 507 280 384 356294 69 225 52 133 109 138 103
1,120 182 938 183 577 360 503 482428 74 354 54 243 131 207 151380 55 325 34 224 122 203 120381 93 288 46 187 148 208 148864 92 772 116 554 194 398 310
6,012 621 5,391 1,183 3,592 1,237 1,957 2,4272,009 196 1,813 415 1,199 395 671 853
293 39 254 39 184 70 134 101305 50 255 35 178 92 142 120623 72 551 85 381 157 235 254
866 113 753 135 520 211 378 338408 59 349 31 261 116 186 149720 92 628 81 459 180 323 257291 64 227 23 161 107 146 100
1,271 147 1,124 105 848 318 552 482
385 78 307 40 198 147 192 139383 58 325 51 213 119 166 141160 35 125 19 81 60 72 57423 94 329 39 227 157 209 145466 104 362 44 231 191 233 172
(Continued)
PutnamQuitmanRabunRandolph
PiercePikePolk
Pulaski
OglethorpePaulding
PeachPickens
Murray
MuscogeeNewtonOconee
MitchellMonroeMontgomeryMorgan
McDuffieMcIntoshMeriwetherMiller
LumpkinMaconMadison
Marion
LibertyLincoln
LongLowndes
Lamar
LanierLaurensLee
JeffersonJenkinsJohnsonJones
County Total
Category Age
SSIrecipients
alsoreceiving
OASDI
Amount ofpayments
(thousandsof dollars)

20 ♦ SSI Recipients by State and County, 2003
Georgia
Table 3.Continued
AgedBlind anddisabled Under 18 18–64
65 orolder
7,040 640 6,400 1,248 4,356 1,436 2,412 2,869933 149 784 190 514 229 334 373147 31 116 32 64 51 64 59763 147 616 100 400 263 358 292480 100 380 61 258 161 216 178
2,070 229 1,841 317 1,289 464 829 8141,065 145 920 142 642 281 504 368
325 80 245 30 146 149 164 1231,411 202 1,209 245 802 364 565 578
323 62 261 30 167 126 150 115
117 23 94 13 59 45 58 43956 147 809 128 512 316 438 355561 92 469 59 323 179 216 228635 114 521 54 353 228 311 233609 129 480 88 291 230 276 229
2,264 298 1,966 351 1,350 563 988 9011,594 270 1,324 250 858 486 769 6021,500 219 1,281 201 870 429 664 558
225 59 166 15 99 111 118 67373 53 320 33 213 127 191 151
2,219 312 1,907 366 1,235 618 901 877471 80 391 66 241 164 221 174390 51 339 65 224 101 164 160471 115 356 31 260 180 241 149879 115 764 138 535 206 362 341
1,637 190 1,447 196 1,078 363 660 6071,336 189 1,147 162 803 371 545 5262,024 188 1,836 271 1,305 448 841 807
301 74 227 32 137 132 147 102913 199 714 97 460 356 455 334
949 106 843 146 577 226 378 38988 29 59 7 40 41 49 25
282 56 226 18 159 105 135 115424 99 325 50 218 156 213 150
1,777 268 1,509 276 1,053 448 789 635
418 72 346 39 231 148 171 152536 133 403 34 286 216 293 175340 37 303 52 207 81 140 141802 145 657 143 408 251 347 302
208 24 184 37 118 53 85 77
Wilcox
Webster
SOURCE: Social Security Administration, Supplemental Security Record (Characteristic Extract Record format), 100 percent data.
WilkesWilkinsonWorth
Unknown
WheelerWhiteWhitfield
WareWarrenWashington
Wayne
UnionUpson
WalkerWalton
Treutlen
TroupTurnerTwiggs
ThomasTiftToombsTowns
TattnallTaylorTelfairTerrell
StewartSumterTalbot
Taliaferro
ScrevenSeminole
SpaldingStephens
RichmondRockdaleSchley
County Total
Category Age
SSIrecipients
alsoreceiving
OASDI
Amount ofpayments
(thousandsof dollars)

SSI Recipients by State and County, 2003 ♦ 21
Hawaii
Table 3.Number of recipients in state (by eligibility category, age, and receipt of OASDI benefits)and amount of payments, by county, December 2003
AgedBlind anddisabled Under 18 18–64
65 orolder
Total, Hawaii 21,757 6,523 15,234 1,380 11,884 8,493 6,905 9,969
3,544 481 3,063 354 2,500 690 1,015 1,68715,918 5,585 10,333 831 7,917 7,170 5,135 7,260
1 a a a a a a a862 167 695 73 546 243 290 368
1,418 284 1,134 122 913 383 458 649
14 5 9 0 8 6 7 5
a.
Maui
Unknown
SOURCE: Social Security Administration, Supplemental Security Record (Characteristic Extract Record format), 100 percent data.
Data not shown to avoid disclosure of information for particular individuals.
HawaiiHonoluluKalawaoKauai
Total
Amount ofpayments
(thousandsof dollars)
Category Age
SSIrecipients
alsoreceiving
OASDICounty
22 ♦ SSI Recipients by State and County, 2003
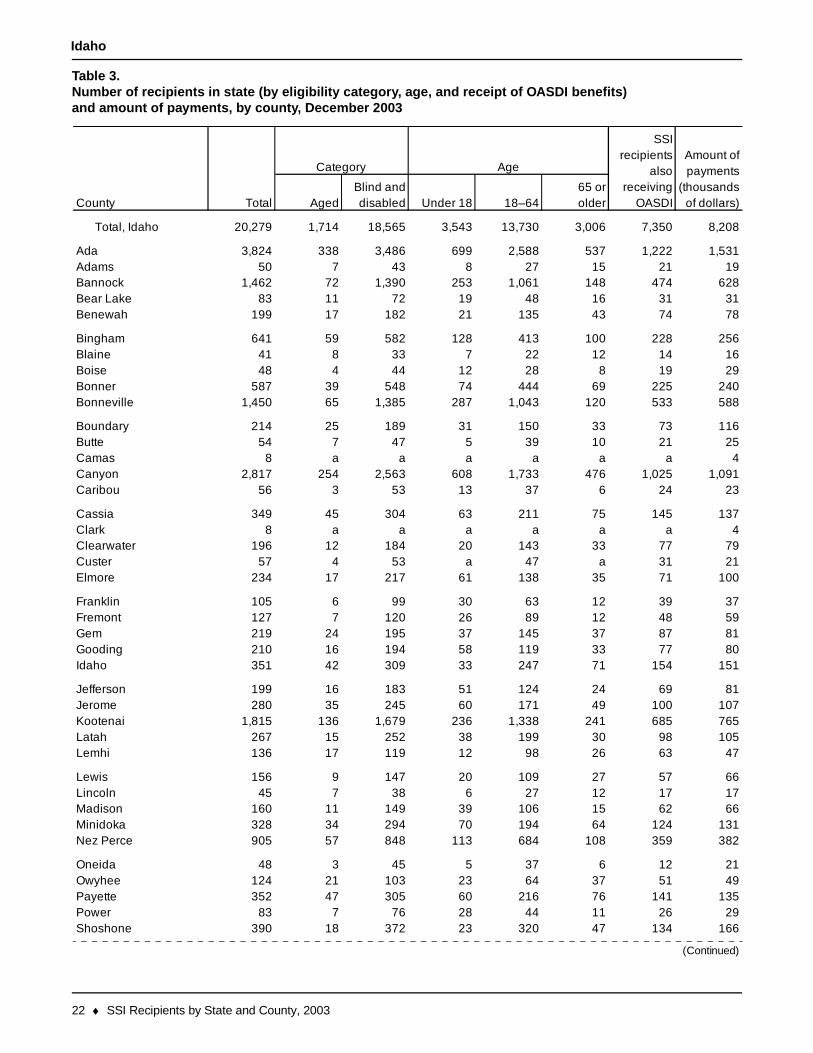
Idaho
Table 3.Number of recipients in state (by eligibility category, age, and receipt of OASDI benefits)and amount of payments, by county, December 2003
AgedBlind anddisabled Under 18 18–64
65 orolder
Total, Idaho 20,279 1,714 18,565 3,543 13,730 3,006 7,350 8,208
3,824 338 3,486 699 2,588 537 1,222 1,53150 7 43 8 27 15 21 19
1,462 72 1,390 253 1,061 148 474 62883 11 72 19 48 16 31 31
199 17 182 21 135 43 74 78
641 59 582 128 413 100 228 25641 8 33 7 22 12 14 1648 4 44 12 28 8 19 29
587 39 548 74 444 69 225 2401,450 65 1,385 287 1,043 120 533 588
214 25 189 31 150 33 73 11654 7 47 5 39 10 21 25
8 a a a a a a 42,817 254 2,563 608 1,733 476 1,025 1,091
56 3 53 13 37 6 24 23
349 45 304 63 211 75 145 1378 a a a a a a 4
196 12 184 20 143 33 77 7957 4 53 a 47 a 31 21
234 17 217 61 138 35 71 100
105 6 99 30 63 12 39 37127 7 120 26 89 12 48 59219 24 195 37 145 37 87 81210 16 194 58 119 33 77 80351 42 309 33 247 71 154 151
199 16 183 51 124 24 69 81280 35 245 60 171 49 100 107
1,815 136 1,679 236 1,338 241 685 765267 15 252 38 199 30 98 105136 17 119 12 98 26 63 47
156 9 147 20 109 27 57 6645 7 38 6 27 12 17 17
160 11 149 39 106 15 62 66328 34 294 70 194 64 124 131905 57 848 113 684 108 359 382
48 3 45 5 37 6 12 21124 21 103 23 64 37 51 49352 47 305 60 216 76 141 135
83 7 76 28 44 11 26 29390 18 372 23 320 47 134 166
OwyheePayette
Lincoln
PowerShoshone
MadisonMinidokaNez Perce
Oneida
KootenaiLatahLemhi
Lewis
GoodingIdaho
JeffersonJerome
Elmore
FranklinFremontGem
CassiaClarkClearwaterCuster
ButteCamasCanyonCaribou
BoiseBonnerBonneville
Boundary
Bear LakeBenewah
BinghamBlaine
County
AdaAdamsBannock
Total
Amount ofpayments
(thousandsof dollars)
Category Age
SSIrecipients
alsoreceiving
OASDI
(Continued)

SSI Recipients by State and County, 2003 ♦ 23
Idaho
Table 3.Continued
AgedBlind anddisabled Under 18 18–64
65 orolder
30 2 28 4 22 4 12 111,278 159 1,119 210 812 256 490 498
61 5 56 10 39 12 23 23218 31 187 36 138 44 102 80
14 1 13 1 8 5 7 4
a.
Unknown
SOURCE: Social Security Administration, Supplemental Security Record (Characteristic Extract Record format), 100 percent data.
Data not shown to avoid disclosure of information for particular individuals.
TetonTwin FallsValleyWashington
County Total
Category Age
SSIrecipients
alsoreceiving
OASDI
Amount ofpayments
(thousandsof dollars)

24 ♦ SSI Recipients by State and County, 2003
Illinois
Table 3.Number of recipients in state (by eligibility category, age, and receipt of OASDI benefits)and amount of payments, by county, December 2003
AgedBlind anddisabled Under 18 18–64
65 orolder
Total, Illinois 255,262 30,892 224,370 42,559 155,318 57,385 60,744 112,523
1,211 74 1,137 179 857 175 437 510634 46 588 93 411 130 206 287233 9 224 32 167 34 87 88261 31 230 49 165 47 86 124104 12 92 13 73 18 44 41
289 18 271 55 191 43 107 11086 11 75 4 57 25 38 33
189 23 166 36 122 31 75 91183 18 165 34 113 36 69 82
2,466 168 2,298 516 1,620 330 761 993
558 42 516 85 382 91 186 211247 19 228 35 172 40 95 100298 34 264 33 189 76 114 111245 17 228 28 180 37 84 87989 59 930 145 705 139 300 423
155,278 21,785 133,493 24,385 90,617 40,276 31,360 70,600285 18 267 45 197 43 79 124158 12 146 30 111 17 50 66420 34 386 72 299 49 126 171233 23 210 45 149 39 95 87
176 16 160 28 116 32 53 636,098 2,084 4,014 705 2,772 2,621 1,287 2,455
383 29 354 62 261 60 128 15679 10 69 10 56 13 23 31
420 37 383 64 284 72 183 164
482 35 447 60 337 85 187 178129 19 110 13 89 27 56 50
1,345 74 1,271 147 998 200 410 567577 48 529 80 396 101 190 229229 30 199 27 147 55 92 101
325 29 296 44 213 68 134 124151 13 138 34 95 22 51 60210 28 182 18 140 52 81 84252 24 228 37 163 52 90 102177 17 160 21 112 44 66 71
92 6 86 12 63 17 28 39408 37 371 88 262 58 124 160369 22 347 65 260 44 141 142
1,362 78 1,284 184 990 188 448 566138 14 124 22 89 27 45 59
Total
Amount ofpayments
(thousandsof dollars)
Category Age
SSIrecipients
alsoreceiving
OASDICounty
AdamsAlexanderBondBooneBrown
BureauCalhounCarrollCassChampaign
ChristianClarkClayClintonColes
CookCrawfordCumberlandDeKalbDeWitt
DouglasDu PageEdgarEdwardsEffingham
FayetteFordFranklinFultonGallatin
GreeneGrundyHamiltonHancockHardin
HendersonHenryIroquoisJacksonJasper
(Continued)

SSI Recipients by State and County, 2003 ♦ 25
Illinois
Table 3.Continued
AgedBlind anddisabled Under 18 18–64
65 orolder
960 75 885 158 629 173 325 386255 21 234 26 186 43 89 102154 20 134 23 103 28 55 58254 23 231 27 162 65 94 96
4,158 683 3,475 927 2,250 981 993 1,788
2,573 128 2,445 445 1,759 369 748 1,121117 16 101 16 82 19 40 52
1,224 61 1,163 185 886 153 354 4661,162 78 1,084 172 823 167 377 4655,096 955 4,141 851 2,837 1,408 1,267 2,177
320 31 289 29 217 74 129 110525 36 489 94 361 70 152 211413 19 394 84 286 43 146 155284 16 268 40 207 37 90 107
3,125 140 2,985 607 2,133 385 987 1,315
809 53 756 121 589 99 288 3664,701 233 4,468 781 3,368 552 1,419 2,0281,138 69 1,069 149 823 166 343 443
98 13 85 20 56 22 34 39252 26 226 31 178 43 97 98
427 42 385 56 270 101 165 172504 43 461 83 347 74 185 184
1,110 169 941 185 696 229 354 4431,392 97 1,295 327 879 186 477 571
120 5 115 22 84 14 41 50
140 12 128 19 95 26 50 54155 17 138 14 105 36 48 56610 34 576 89 431 90 180 246756 34 722 125 526 105 246 267130 7 123 16 96 18 44 46
323 28 295 70 203 50 114 1374,788 222 4,566 1,061 3,170 557 1,321 2,089
404 23 381 51 298 55 136 179111 6 105 13 81 17 44 37334 42 292 23 241 70 153 135
118 12 106 7 86 25 38 56335 36 299 44 198 93 134 134
45 3 42 7 31 7 18 15428 26 402 52 319 57 145 171358 21 337 39 259 60 137 142
JeffersonJerseyJo DaviessJohnsonKane
KankakeeKendallKnoxLa SalleLake
LawrenceLeeLivingstonLoganMacon
MacoupinMadisonMarionMarshallMason
MassacMcDonoughMcHenryMcLeanMenard
MercerMonroeMontgomeryMorganMoultrie
OglePeoriaPerryPiattPike
PopePulaskiPutnamRandolphRichland
County Total
Category Age
SSIrecipients
alsoreceiving
OASDI
Amount ofpayments
(thousandsof dollars)
(Continued)

26 ♦ SSI Recipients by State and County, 2003
Illinois
Table 3.Continued
AgedBlind anddisabled Under 18 18–64
65 orolder
2,915 160 2,755 578 1,970 367 878 1,2391,167 73 1,094 141 815 211 345 4774,726 189 4,537 1,557 2,693 476 1,317 2,070
90 11 79 9 61 20 37 4261 6 55 14 34 13 22 22
286 23 263 34 202 50 110 1108,606 388 8,218 1,809 5,617 1,180 2,114 3,823
48 7 41 10 25 13 21 18819 38 781 219 518 82 236 363
1,684 78 1,606 323 1,173 188 507 696
699 45 654 78 489 132 186 2512,538 101 2,437 454 1,829 255 841 1,071
175 9 166 21 124 30 62 80271 18 253 46 189 36 94 112120 12 108 16 84 20 40 51
276 33 243 32 180 64 107 114380 30 350 37 267 76 141 162950 52 898 187 648 115 294 345
4,176 452 3,724 786 2,642 748 1,066 1,8111,366 86 1,280 177 974 215 437 568
5,611 375 5,236 1,253 3,601 757 1,529 2,462154 11 143 23 110 21 46 55
169 17 152 31 103 35 41 72
Rock IslandSalineSangamonSchuylerScott
ShelbySt. ClairStarkStephensonTazewell
UnionVermilionWabashWarrenWashington
WayneWhiteWhitesideWillWilliamson
WinnebagoWoodford
Unknown
SOURCE: Social Security Administration, Supplemental Security Record (Characteristic Extract Record format), 100 percent data.
County Total
Category Age
SSIrecipients
alsoreceiving
OASDI
Amount ofpayments
(thousandsof dollars)

SSI Recipients by State and County, 2003 ♦ 27
Indiana
Table 3.Number of recipients in state (by eligibility category, age, and receipt of OASDI benefits)and amount of payments, by county, December 2003
AgedBlind anddisabled Under 18 18–64
65 orolder
Total, Indiana 94,027 6,310 87,717 19,036 62,363 12,628 30,272 39,653
213 14 199 37 149 27 68 854,973 326 4,647 1,178 3,172 623 1,499 2,1541,185 82 1,103 208 809 168 451 468
97 3 94 15 75 7 40 38188 14 174 48 113 27 65 70
248 28 220 41 160 47 101 9978 11 67 14 47 17 27 3495 8 87 24 59 12 34 32
588 27 561 110 430 48 192 2141,760 101 1,659 283 1,251 226 672 704
505 43 462 96 329 80 172 213369 20 349 77 251 41 133 160286 27 259 32 193 61 120 113481 34 447 78 337 66 174 181431 22 409 94 297 40 147 190
417 28 389 56 305 56 129 180298 26 272 40 204 54 122 128
2,653 140 2,513 415 1,921 317 872 1,156302 30 272 58 195 49 111 103
2,265 155 2,110 570 1,431 264 739 996
539 27 512 79 388 72 193 2111,489 80 1,409 244 1,078 167 516 653
284 13 271 48 199 37 127 113238 27 211 28 169 41 102 101209 11 198 47 135 27 69 82
375 32 343 50 266 59 145 1351,616 86 1,530 273 1,141 202 558 636
605 51 554 86 423 96 234 252661 71 590 116 435 110 194 263331 26 305 51 238 42 120 143
480 39 441 76 321 83 181 178378 37 341 65 260 53 123 139742 52 690 98 522 122 298 293
1,671 63 1,608 322 1,203 146 520 758340 26 314 69 226 45 97 158
636 35 601 111 435 90 244 243246 21 225 56 156 34 79 110308 19 289 72 195 41 98 125711 53 658 114 487 110 268 276467 22 445 78 322 67 153 196Jennings
(Continued)
JacksonJasperJayJefferson
HendricksHenryHowardHuntington
GreeneHamiltonHancock
Harrison
FranklinFulton
GibsonGrant
Elkhart
FayetteFloydFountain
DearbornDecaturDelawareDubois
ClintonCrawfordDaviessDe Kalb
CarrollCassClark
Clay
BentonBlackford
BooneBrown
County
AdamsAllenBartholomew
Total
Amount ofpayments
(thousandsof dollars)
Category Age
SSIrecipients
alsoreceiving
OASDI
28 ♦ SSI Recipients by State and County, 2003
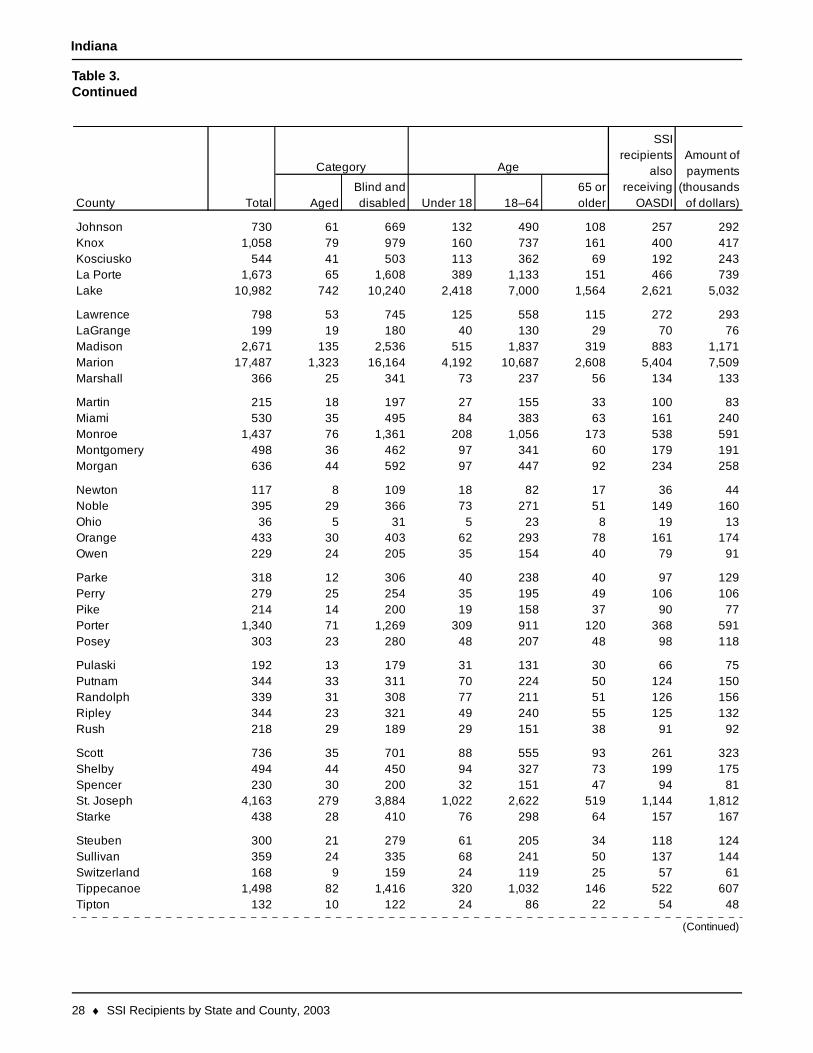
Indiana
Table 3.Continued
AgedBlind anddisabled Under 18 18–64
65 orolder
730 61 669 132 490 108 257 2921,058 79 979 160 737 161 400 417
544 41 503 113 362 69 192 2431,673 65 1,608 389 1,133 151 466 739
10,982 742 10,240 2,418 7,000 1,564 2,621 5,032
798 53 745 125 558 115 272 293199 19 180 40 130 29 70 76
2,671 135 2,536 515 1,837 319 883 1,17117,487 1,323 16,164 4,192 10,687 2,608 5,404 7,509
366 25 341 73 237 56 134 133
215 18 197 27 155 33 100 83530 35 495 84 383 63 161 240
1,437 76 1,361 208 1,056 173 538 591498 36 462 97 341 60 179 191636 44 592 97 447 92 234 258
117 8 109 18 82 17 36 44395 29 366 73 271 51 149 160
36 5 31 5 23 8 19 13433 30 403 62 293 78 161 174229 24 205 35 154 40 79 91
318 12 306 40 238 40 97 129279 25 254 35 195 49 106 106214 14 200 19 158 37 90 77
1,340 71 1,269 309 911 120 368 591303 23 280 48 207 48 98 118
192 13 179 31 131 30 66 75344 33 311 70 224 50 124 150339 31 308 77 211 51 126 156344 23 321 49 240 55 125 132218 29 189 29 151 38 91 92
736 35 701 88 555 93 261 323494 44 450 94 327 73 199 175230 30 200 32 151 47 94 81
4,163 279 3,884 1,022 2,622 519 1,144 1,812438 28 410 76 298 64 157 167
300 21 279 61 205 34 118 124359 24 335 68 241 50 137 144168 9 159 24 119 25 57 61
1,498 82 1,416 320 1,032 146 522 607132 10 122 24 86 22 54 48
SwitzerlandTippecanoeTipton
St. JosephStarke
SteubenSullivan
Rush
ScottShelbySpencer
PulaskiPutnamRandolphRipley
PerryPikePorterPosey
OhioOrangeOwen
Parke
MontgomeryMorgan
NewtonNoble
Marshall
MartinMiamiMonroe
LawrenceLaGrangeMadisonMarion
JohnsonKnoxKosciusko
County Total
Category Age
SSIrecipients
alsoreceiving
OASDI
Amount ofpayments
(thousandsof dollars)
(Continued)
La PorteLake
SSI Recipients by State and County, 2003 ♦ 29
Indiana
Table 3.Continued
AgedBlind anddisabled Under 18 18–64
65 orolder
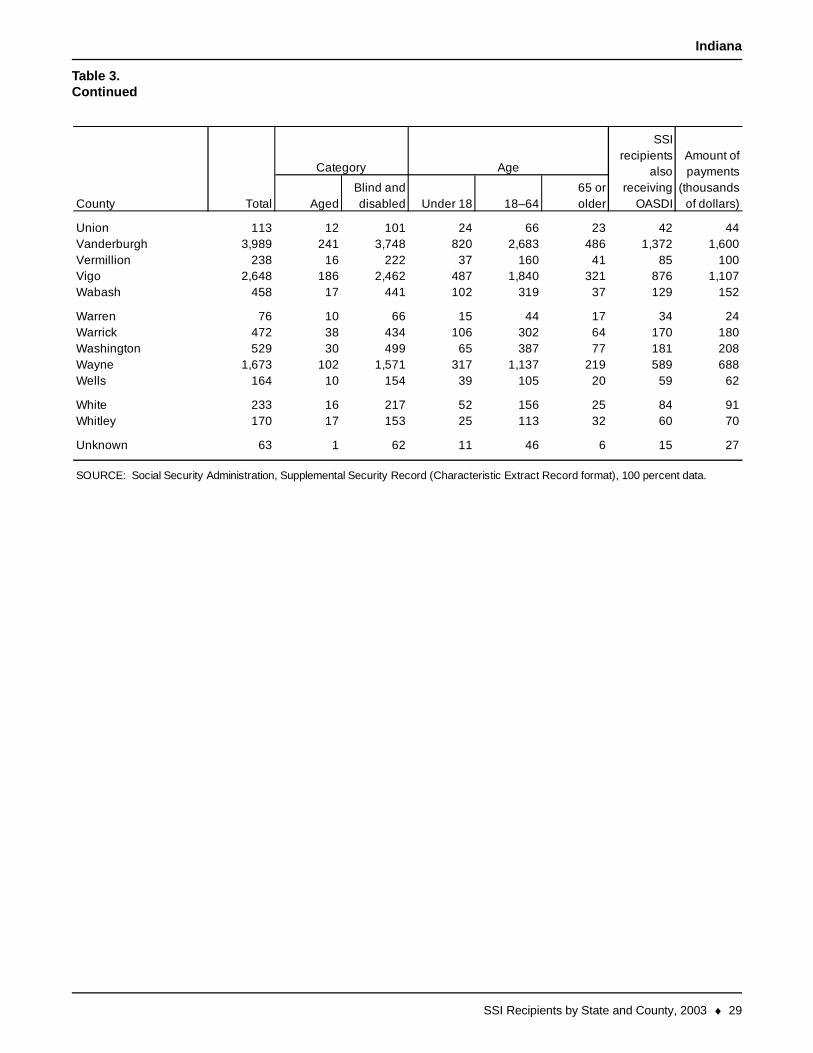
113 12 101 24 66 23 42 443,989 241 3,748 820 2,683 486 1,372 1,600
238 16 222 37 160 41 85 1002,648 186 2,462 487 1,840 321 876 1,107
458 17 441 102 319 37 129 152
76 10 66 15 44 17 34 24472 38 434 106 302 64 170 180529 30 499 65 387 77 181 208
1,673 102 1,571 317 1,137 219 589 688164 10 154 39 105 20 59 62
233 16 217 52 156 25 84 91170 17 153 25 113 32 60 70
63 1 62 11 46 6 15 27Unknown
SOURCE: Social Security Administration, Supplemental Security Record (Characteristic Extract Record format), 100 percent data.
WayneWells
WhiteWhitley
Wabash
WarrenWarrickWashington
UnionVanderburghVermillionVigo
County Total
Category Age
SSIrecipients
alsoreceiving
OASDI
Amount ofpayments
(thousandsof dollars)

30 ♦ SSI Recipients by State and County, 2003
Iowa
Table 3.Number of recipients in state (by eligibility category, age, and receipt of OASDI benefits)and amount of payments, by county, December 2003
AgedBlind anddisabled Under 18 18–64
65 orolder
Total, Iowa 41,890 3,836 38,054 6,295 28,383 7,212 16,484 15,874
78 19 59 7 42 29 37 25111 11 100 7 73 31 52 33171 44 127 14 94 63 98 47453 39 414 37 316 100 198 193
72 13 59 8 43 21 31 25
223 18 205 32 147 44 108 832,866 143 2,723 487 2,039 340 946 1,174
273 25 248 30 192 51 124 87184 28 156 28 113 43 80 62275 19 256 56 163 56 106 111
235 31 204 47 132 56 92 72152 15 137 29 97 26 63 51137 19 118 12 99 26 59 39267 30 237 27 179 61 131 82308 32 276 41 208 59 158 103
117 17 100 19 75 23 45 40768 49 719 108 565 95 337 277133 14 119 16 92 25 62 45125 17 108 15 75 35 63 44138 26 112 18 80 40 68 53
228 20 208 38 145 45 101 92258 46 212 28 162 68 124 79932 56 876 155 668 109 326 386204 38 166 31 121 52 102 69314 33 281 46 211 57 98 92
134 20 114 14 84 36 57 45189 31 158 19 118 52 92 62206 28 178 21 135 50 114 68891 44 847 140 653 98 330 373165 23 142 12 113 40 88 51
1,357 158 1,199 197 910 250 568 490121 23 98 8 77 36 61 41371 71 300 45 224 102 198 133315 14 301 50 228 37 112 102109 9 100 19 70 20 45 38
117 12 105 12 79 26 62 41157 18 139 22 96 39 83 47
60 10 50 14 35 11 26 23130 22 108 15 80 35 71 46190 15 175 26 137 27 79 69Hamilton
(Continued)
FremontGreeneGrundyGuthrie
EmmetFayetteFloydFranklin
DelawareDes MoinesDickinson
Dubuque
CrawfordDallas
DavisDecatur
Clarke
ClayClaytonClinton
CedarCerro GordoCherokeeChickasaw
ButlerCalhounCarrollCass
BooneBremerBuchanan
Buena Vista
AppanooseAudubon
BentonBlack Hawk
County
AdairAdamsAllamakee
Total
Amount ofpayments
(thousandsof dollars)
Category Age
SSIrecipients
alsoreceiving
OASDI

SSI Recipients by State and County, 2003 ♦ 31
Iowa
Table 3.Continued
AgedBlind anddisabled Under 18 18–64
65 orolder
105 20 85 14 62 29 56 31178 20 158 40 104 34 67 67230 39 191 26 140 64 111 76213 23 190 29 143 41 101 71117 34 83 12 62 43 62 36
125 12 113 18 89 18 53 4266 6 60 8 46 12 31 22
118 11 107 20 80 18 63 52305 50 255 49 188 68 118 124364 37 327 45 254 65 172 125
265 22 243 25 195 45 116 931,032 60 972 188 739 105 370 398
181 39 142 27 104 50 91 57186 20 166 26 123 37 81 65191 32 159 28 120 43 92 59
723 35 688 115 517 91 252 3152,344 145 2,199 395 1,645 304 863 920
116 15 101 21 72 23 48 46220 34 186 23 141 56 90 80
76 20 56 10 40 26 38 25
117 15 102 15 75 27 45 41422 39 383 47 294 81 161 181353 32 321 41 248 64 134 129573 45 528 110 375 88 210 221261 18 243 37 188 36 59 56
97 20 77 11 56 30 50 30166 24 142 24 102 40 72 63141 15 126 16 88 37 63 52215 18 197 28 156 31 108 73570 54 516 73 397 100 212 213
198 16 182 16 155 27 90 6565 4 61 12 44 9 25 26
311 23 288 30 211 70 160 104147 22 125 16 86 45 67 46179 20 159 21 127 31 88 67
105 18 87 15 61 29 46 385,687 583 5,104 952 3,661 1,074 1,846 2,3061,606 67 1,539 289 1,137 180 622 649
163 10 153 23 118 22 74 53106 23 83 11 58 37 51 36
PottawattamiePoweshiekRinggold
Palo AltoPlymouth
PocahontasPolk
Muscatine
O'BrienOsceolaPage
MitchellMononaMonroeMontgomery
MahaskaMarionMarshallMills
LouisaLucasLyon
Madison
KeokukKossuth
LeeLinn
Jasper
JeffersonJohnsonJones
HumboldtIdaIowaJackson
HancockHardinHarrison
County Total
Category Age
SSIrecipients
alsoreceiving
OASDI
Amount ofpayments
(thousandsof dollars)
(Continued)
HenryHoward

32 ♦ SSI Recipients by State and County, 2003
Iowa
Table 3.Continued
AgedBlind anddisabled Under 18 18–64
65 orolder
120 16 104 15 80 25 55 372,885 143 2,742 503 2,059 323 895 1,229
149 21 128 12 99 38 72 48211 26 185 31 137 43 96 69542 47 495 76 388 78 216 209
160 23 137 20 97 43 75 52126 27 99 9 71 46 71 38335 40 295 41 220 74 164 112144 21 123 19 87 38 76 48
1,132 64 1,068 134 829 169 439 467
202 20 182 25 141 36 96 67235 19 216 38 154 43 92 98169 26 143 21 102 46 79 61753 36 717 117 541 95 334 277124 13 111 19 90 15 45 32
189 46 143 24 105 60 113 511,938 174 1,764 292 1,310 336 790 716
87 13 74 20 47 20 30 33179 18 161 21 129 29 80 57
39 3 36 2 26 11 13 24
Winneshiek
Washington
SOURCE: Social Security Administration, Supplemental Security Record (Characteristic Extract Record format), 100 percent data.
WoodburyWorthWright
Unknown
WayneWebster
TamaTaylor
Winnebago
UnionVan BurenWapello
Warren
ScottShelbySiouxStory
Sac
County Total
Category Age
SSIrecipients
alsoreceiving
OASDI
Amount ofpayments
(thousandsof dollars)

SSI Recipients by State and County, 2003 ♦ 33
Kansas
Table 3.Number of recipients in state (by eligibility category, age, and receipt of OASDI benefits)and amount of payments, by county, December 2003
AgedBlind anddisabled Under 18 18–64
65 orolder
Total, Kansas 37,813 3,481 34,332 6,608 24,591 6,614 13,690 15,253
390 32 358 43 282 65 154 15587 13 74 23 44 20 35 33
293 43 250 48 173 72 114 10574 4 70 9 57 8 32 26
361 28 333 68 246 47 130 148
313 35 278 32 213 68 133 116218 20 198 30 152 36 83 81401 29 372 76 272 53 150 157
36 7 29 8 18 10 11 14113 16 97 10 72 31 47 45
597 53 544 63 424 110 228 23820 2 18 2 14 4 11 623 2 21 5 13 5 10 8
101 12 89 19 53 29 35 34164 22 142 18 116 30 79 49
148 15 133 16 103 29 73 6123 a a 4 12 7 8 5
755 56 699 129 500 126 305 288939 67 872 110 682 147 377 363
29 6 23 4 15 10 11 13
247 30 217 52 148 47 105 86116 11 105 19 72 25 43 45922 62 860 165 643 114 330 370
38 5 33 8 19 11 14 1264 4 60 5 53 6 29 33
354 22 332 57 254 43 159 12161 6 55 11 37 13 27 21
463 56 407 106 275 82 156 192376 47 329 87 210 79 136 146466 19 447 96 320 50 159 205
408 33 375 97 250 61 113 19716 a a a 9 a 4 746 8 38 a 29 a 26 1369 14 55 12 34 23 28 2422 3 19 3 14 5 10 7
8 a a a a a a 2172 11 161 24 117 31 72 69
33 5 28 7 17 9 10 1390 19 71 13 52 25 34 31
279 23 256 50 185 44 105 108
GreenwoodHamiltonHarperHarvey
GrahamGrantGray
Greeley
FordFranklin
GearyGove
Elk
EllisEllsworthFinney
DickinsonDoniphanDouglasEdwards
ComancheCowleyCrawfordDecatur
ClarkClayCloud
Coffey
ChaseChautauqua
CherokeeCheyenne
Barton
BourbonBrownButler
AllenAndersonAtchisonBarber
Total
Amount ofpayments
(thousandsof dollars)
Category Age
SSIrecipients
alsoreceiving
OASDICounty
(Continued)

34 ♦ SSI Recipients by State and County, 2003
Kansas
Table 3.Continued
AgedBlind anddisabled Under 18 18–64
65 orolder
33 9 24 4 19 10 13 114 a a a a a a 2
105 16 89 19 64 22 53 51128 10 118 19 87 22 52 46
50 9 41 6 30 14 26 22
2,424 468 1,956 364 1,416 644 684 99146 8 38 9 26 11 16 1679 2 77 18 47 14 25 2870 4 66 8 54 8 33 22
607 53 554 84 419 104 243 218
18 3 15 2 11 5 7 12536 42 494 93 362 81 179 233
32 5 27 5 21 6 16 17133 12 121 20 86 27 49 51
31 4 27 3 22 6 17 16
553 40 513 101 377 75 205 228135 13 122 27 83 25 61 42141 20 121 19 86 36 63 50201 14 187 38 127 36 89 71
31 4 27 7 19 5 10 12
375 20 355 41 288 46 132 14860 9 51 4 41 15 30 19
994 90 904 119 691 184 422 37568 10 58 14 37 17 31 2535 10 25 6 12 17 18 11
99 18 81 11 56 32 57 28322 30 292 31 230 61 128 129
17 3 14 2 9 6 6 680 8 72 4 62 14 29 32
202 17 185 33 134 35 85 71
45 6 39 7 24 14 20 1353 7 46 11 28 14 21 1673 11 62 14 43 16 24 2857 5 52 8 37 12 28 21
162 24 138 23 103 36 72 56
102 14 88 16 64 22 42 3536 5 31 5 23 8 18 11
1,105 94 1,011 186 743 176 412 45374 12 62 8 48 18 33 29
121 14 107 20 72 29 45 69
RawlinsRenoRepublicRice
PawneePhillipsPottawatomie
Pratt
NortonOsage
OsborneOttawa
Morton
NemahaNeoshoNess
MiamiMitchellMontgomeryMorris
MarionMarshallMcPhersonMeade
LincolnLinnLogan
Lyon
KiowaLabette
LaneLeavenworth
Jewell
JohnsonKearnyKingman
HaskellHodgemanJacksonJefferson
County Total
Category Age
SSIrecipients
alsoreceiving
OASDI
Amount ofpayments
(thousandsof dollars)
(Continued)

SSI Recipients by State and County, 2003 ♦ 35
Kansas
Table 3.Continued
AgedBlind anddisabled Under 18 18–64
65 orolder
512 35 477 78 373 61 235 18363 12 51 7 40 16 30 2265 9 56 7 45 13 25 34
122 5 117 15 88 19 55 55866 74 792 177 553 136 335 320
32 a a a a a a 117,853 702 7,151 1,503 4,958 1,392 2,508 3,268
282 36 246 52 165 65 98 1183,738 191 3,547 811 2,481 446 1,370 1,568
17 2 15 3 11 3 8 5
102 8 94 12 70 20 52 3649 9 40 3 32 14 27 1651 4 47 5 34 12 26 16
8 a a a a a a 237 3 34 7 22 8 19 11
285 20 265 47 192 46 108 11366 3 63 5 54 7 31 2142 7 35 5 28 9 15 1359 7 52 11 39 9 30 2710 a a a a a a 3
70 6 64 10 47 13 37 2114 a a a a a a 5
201 28 173 30 126 45 93 7573 11 62 6 45 22 43 25
4,386 317 4,069 855 2,812 719 1,420 1,904
38 1 37 5 27 6 13 16
a.
Wyandotte
Unknown
SOURCE: Social Security Administration, Supplemental Security Record (Characteristic Extract Record format), 100 percent data.
Data not shown to avoid disclosure of information for particular individuals.
WashingtonWichitaWilsonWoodson
ThomasTregoWabaunseeWallace
StaffordStantonStevens
Sumner
ShawneeSheridan
ShermanSmith
Saline
ScottSedgwickSeward
RileyRooksRushRussell
County Total
Category Age
SSIrecipients
alsoreceiving
OASDI
Amount ofpayments
(thousandsof dollars)

36 ♦ SSI Recipients by State and County, 2003
Kentucky
Table 3.Number of recipients in state (by eligibility category, age, and receipt of OASDI benefits)and amount of payments, by county, December 2003
AgedBlind anddisabled Under 18 18–64
65 orolder
Total, Kentucky 178,852 15,732 163,120 25,184 118,258 35,410 63,095 73,325
1,189 184 1,005 124 695 370 548 421833 90 743 82 546 205 371 334329 44 285 52 192 85 138 118258 31 227 42 158 58 114 95
1,706 250 1,456 202 1,017 487 791 633
952 122 830 98 615 239 360 3883,473 159 3,314 351 2,517 605 1,002 1,5061,308 86 1,222 302 851 155 430 536
651 94 557 81 404 166 286 2602,669 149 2,520 374 1,926 369 871 1,119
1,232 114 1,118 219 784 229 463 482330 55 275 59 177 94 146 132
2,364 104 2,260 252 1,729 383 673 1,009884 123 761 106 535 243 398 335927 62 865 165 637 125 344 376
583 87 496 45 373 165 274 192511 55 456 73 329 109 210 225719 71 648 97 487 135 331 271
1,813 105 1,708 340 1,227 246 606 801170 26 144 28 103 39 65 70
486 51 435 70 315 101 193 1971,850 207 1,643 218 1,157 475 681 7321,279 211 1,068 105 756 418 597 4732,334 268 2,066 514 1,330 490 887 9531,191 133 1,058 163 741 287 488 451
3,687 165 3,522 447 2,661 579 864 1,6581,014 141 873 49 638 327 462 364
317 37 280 31 205 81 141 112642 148 494 45 310 287 305 237
3,078 280 2,798 605 1,985 488 1,208 1,247
520 74 446 36 343 141 245 191539 48 491 56 358 125 173 215
1,244 109 1,135 137 805 302 455 5026,020 612 5,408 1,064 3,782 1,174 2,282 2,354
770 98 672 71 475 224 315 291
4,240 131 4,109 581 3,176 483 1,107 1,9671,864 144 1,720 252 1,226 386 654 672
549 48 501 97 343 109 220 243230 30 200 46 137 47 83 90580 70 510 84 362 134 246 216Garrard
(Continued)
FloydFranklinFultonGallatin
ElliottEstillFayetteFleming
CrittendenCumberlandDaviess
Edmonson
ChristianClark
ClayClinton
Carlisle
CarrollCarterCasey
ButlerCaldwellCallowayCampbell
BrackenBreathittBreckinridgeBullitt
BooneBourbonBoyd
Boyle
BallardBarren
BathBell
County
AdairAllenAnderson
Total
Amount ofpayments
(thousandsof dollars)
Category Age
SSIrecipients
alsoreceiving
OASDI
SSI Recipients by State and County, 2003 ♦ 37
Kentucky
Table 3.Continued
AgedBlind anddisabled Under 18 18–64
65 orolder
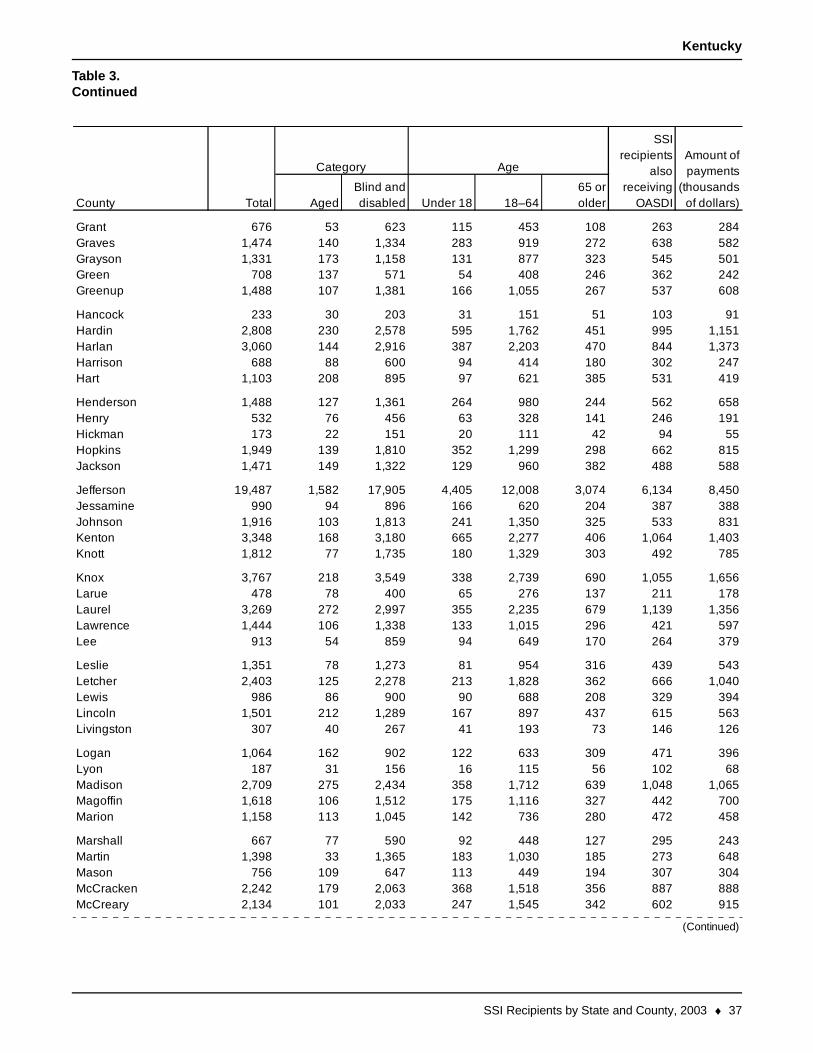
676 53 623 115 453 108 263 2841,474 140 1,334 283 919 272 638 5821,331 173 1,158 131 877 323 545 501
708 137 571 54 408 246 362 2421,488 107 1,381 166 1,055 267 537 608
233 30 203 31 151 51 103 912,808 230 2,578 595 1,762 451 995 1,1513,060 144 2,916 387 2,203 470 844 1,373
688 88 600 94 414 180 302 2471,103 208 895 97 621 385 531 419
1,488 127 1,361 264 980 244 562 658532 76 456 63 328 141 246 191173 22 151 20 111 42 94 55
1,949 139 1,810 352 1,299 298 662 8151,471 149 1,322 129 960 382 488 588
19,487 1,582 17,905 4,405 12,008 3,074 6,134 8,450990 94 896 166 620 204 387 388
1,916 103 1,813 241 1,350 325 533 8313,348 168 3,180 665 2,277 406 1,064 1,4031,812 77 1,735 180 1,329 303 492 785
3,767 218 3,549 338 2,739 690 1,055 1,656478 78 400 65 276 137 211 178
3,269 272 2,997 355 2,235 679 1,139 1,3561,444 106 1,338 133 1,015 296 421 597
913 54 859 94 649 170 264 379
1,351 78 1,273 81 954 316 439 5432,403 125 2,278 213 1,828 362 666 1,040
986 86 900 90 688 208 329 3941,501 212 1,289 167 897 437 615 563
307 40 267 41 193 73 146 126
1,064 162 902 122 633 309 471 396187 31 156 16 115 56 102 68
2,709 275 2,434 358 1,712 639 1,048 1,0651,618 106 1,512 175 1,116 327 442 7001,158 113 1,045 142 736 280 472 458
667 77 590 92 448 127 295 2431,398 33 1,365 183 1,030 185 273 648
756 109 647 113 449 194 307 3042,242 179 2,063 368 1,518 356 887 8882,134 101 2,033 247 1,545 342 602 915
MasonMcCrackenMcCreary
MagoffinMarion
MarshallMartin
Livingston
LoganLyonMadison
LeslieLetcherLewisLincoln
LarueLaurelLawrenceLee
JohnsonKentonKnott
Knox
HopkinsJackson
JeffersonJessamine
Hart
HendersonHenryHickman
HancockHardinHarlanHarrison
GrantGravesGrayson
County Total
Category Age
SSIrecipients
alsoreceiving
OASDI
Amount ofpayments
(thousandsof dollars)
(Continued)
GreenGreenup

38 ♦ SSI Recipients by State and County, 2003
Kentucky
Table 3.Continued
AgedBlind anddisabled Under 18 18–64
65 orolder
307 30 277 39 202 66 143 135488 43 445 71 334 83 183 191578 62 516 64 393 121 208 235703 112 591 99 404 200 327 248686 113 573 62 403 221 335 257
1,047 157 890 72 626 349 474 4161,153 125 1,028 147 737 269 442 4611,102 122 980 97 691 314 404 4261,437 122 1,315 243 925 269 555 5901,094 132 962 167 675 252 441 426
405 68 337 43 238 124 185 1411,057 102 955 148 714 195 384 437
315 28 287 64 189 62 112 125387 57 330 43 246 98 162 152
1,005 86 919 79 683 243 288 420
433 38 395 74 288 71 170 1823,279 153 3,126 334 2,481 464 920 1,4355,397 166 5,231 571 4,216 610 1,430 2,382
999 74 925 117 689 193 360 3934,106 422 3,684 435 2,757 914 1,630 1,582
110 12 98 15 64 31 47 371,207 160 1,047 105 726 376 473 4551,174 129 1,045 134 761 279 479 4621,397 203 1,194 131 866 400 633 509
797 97 700 109 483 205 341 304
633 73 560 107 376 150 280 226477 73 404 67 267 143 233 167264 29 235 30 168 66 126 87
1,466 143 1,323 182 989 295 601 566432 95 337 52 227 153 216 137
394 65 329 57 218 119 216 130228 22 206 41 135 52 89 87344 40 304 75 206 63 134 143
3,363 357 3,006 542 2,097 724 1,300 1,322477 92 385 43 264 170 240 175
1,929 215 1,714 184 1,249 496 758 766496 46 450 98 312 86 188 201
3,561 199 3,362 443 2,520 598 1,040 1,5611,288 103 1,185 145 868 275 384 552
337 47 290 45 208 84 149 119
78 2 76 16 55 7 22 35Unknown
SOURCE: Social Security Administration, Supplemental Security Record (Characteristic Extract Record format), 100 percent data.
WebsterWhitleyWolfeWoodford
UnionWarrenWashington
ShelbySimpsonSpencer
Wayne
TaylorTodd
TriggTrimble
RockcastleRowanRussellScott
PikePowellPulaski
Robertson
OwenOwsley
PendletonPerry
Nelson
NicholasOhioOldham
MonroeMontgomeryMorganMuhlenberg
MeadeMenifeeMercerMetcalfe
McLean
County Total
Category Age
SSIrecipients
alsoreceiving
OASDI
Amount ofpayments
(thousandsof dollars)

SSI Recipients by State and County, 2003 ♦ 39
Louisiana
Table 3.Number of recipients in state (by eligibility category, age, and receipt of OASDI benefits)and amount of payments, by county, December 2003
AgedBlind anddisabled Under 18 18–64
65 orolder
Total, Louisiana 167,800 20,713 147,087 29,460 98,939 39,401 58,708 67,762
2,820 410 2,410 344 1,688 788 1,191 1,026912 117 795 105 555 252 378 335
1,659 188 1,471 323 968 368 573 6871,046 135 911 193 592 261 405 4402,762 470 2,292 354 1,520 888 1,199 990
987 134 853 120 613 254 411 373796 184 612 119 363 314 367 290
2,059 287 1,772 422 1,164 473 685 78910,094 1,453 8,641 2,217 5,457 2,420 3,465 4,038
5,036 519 4,517 837 3,121 1,078 1,726 1,962
453 79 374 50 242 161 192 154122 19 103 17 74 31 55 45619 116 503 65 349 205 268 235841 189 652 160 379 302 359 331
1,122 216 906 169 603 350 471 418
1,240 272 968 174 611 455 528 47111,210 1,075 10,135 2,268 6,797 2,145 3,420 4,784
723 122 601 103 386 234 280 273872 121 751 98 508 266 295 328
2,673 279 2,394 262 1,662 749 1,002 1,049
1,301 287 1,014 174 611 516 541 463703 87 616 96 431 176 282 260
2,952 360 2,592 470 1,819 663 1,136 1,1731,474 152 1,322 241 891 342 496 600
559 93 466 54 320 185 226 201
13,486 1,548 11,938 2,924 7,983 2,579 3,980 5,8271,073 137 936 143 645 285 461 389
456 67 389 40 274 142 194 1575,007 635 4,372 793 2,974 1,240 1,881 1,9292,739 284 2,455 502 1,748 489 900 1,114
1,244 176 1,068 205 717 322 446 4771,812 180 1,632 277 1,176 359 629 748
832 161 671 163 412 257 320 3121,845 286 1,559 300 988 557 634 7501,961 353 1,608 267 1,063 631 777 739
26,714 2,768 23,946 5,608 15,808 5,298 8,468 11,7085,151 686 4,465 1,027 2,905 1,219 1,753 2,069
843 100 743 107 541 195 242 3351,104 158 946 173 577 354 402 4306,215 613 5,602 1,038 3,891 1,286 2,053 2,249
County Total
Amount ofpayments
(thousandsof dollars)
Category Age
SSIrecipients
alsoreceiving
OASDI
AcadiaAllenAscensionAssumptionAvoyelles
BeauregardBienvilleBossierCaddoCalcasieu
CaldwellCameronCatahoulaClaiborneConcordia
DeSotoEast Baton RougeEast CarrollEast FelicianaEvangeline
FranklinGrantIberiaIbervilleJackson
JeffersonJefferson DavisLa SalleLafayetteLafourche
LincolnLivingstonMadisonMorehouseNatchitoches
OrleansOuachitaPlaqueminesPointe CoupeeRapides
(Continued)

40 ♦ SSI Recipients by State and County, 2003
Louisiana
Table 3.Continued
AgedBlind anddisabled Under 18 18–64
65 orolder
482 93 389 67 254 161 168 1921,171 271 900 140 599 432 465 394
991 124 867 110 592 289 377 3751,805 163 1,642 303 1,180 322 617 750
969 94 875 220 568 181 284 404
458 65 393 60 268 130 178 184597 79 518 95 351 151 217 247
1,363 104 1,259 358 808 197 424 5655,980 772 5,208 712 3,512 1,756 2,474 2,2661,773 318 1,455 204 976 593 795 636
2,399 234 2,165 416 1,481 502 833 1,0353,730 358 3,372 706 2,314 710 1,310 1,5705,582 547 5,035 789 3,589 1,204 1,909 2,299
434 108 326 44 223 167 179 1704,090 316 3,774 849 2,609 632 1,314 1,682
786 166 620 113 385 288 349 2831,652 275 1,377 172 1,001 479 691 6281,153 132 1,021 190 697 266 414 4642,930 301 2,629 339 1,949 642 1,056 1,2331,752 301 1,451 284 946 522 701 638
616 83 533 85 375 156 200 236542 136 406 58 262 222 273 185318 57 261 49 164 105 133 107609 93 516 84 338 187 229 224
101 7 94 11 72 18 27 49
Red RiverRichlandSabineSt. BernardSt. Charles
St. HelenaSt. JamesSt. John the BaptistSt. LandrySt. Martin
St. MarySt. Tammany
Webster
TangipahoaTensasTerrebonne
Union
Unknown
SOURCE: Social Security Administration, Supplemental Security Record (Characteristic Extract Record format), 100 percent data.
West Baton RougeWest CarrollWest FelicianaWinn
VermilionVernonWashington
County Total
Category Age
SSIrecipients
alsoreceiving
OASDI
Amount ofpayments
(thousandsof dollars)

SSI Recipients by State and County, 2003 ♦ 41
Maine
Table 3.Number of recipients in state (by eligibility category, age, and receipt of OASDI benefits)and amount of payments, by county, December 2003
AgedBlind anddisabled Under 18 18–64
65 orolder
Total, Maine 31,438 2,750 28,688 3,198 22,580 5,660 13,794 12,144
3,436 222 3,214 397 2,536 503 1,462 1,3162,986 408 2,578 220 1,991 775 1,525 9994,952 413 4,539 495 3,601 856 2,100 2,013
701 57 644 88 505 108 300 276790 90 700 93 527 170 364 285
3,810 279 3,531 384 2,836 590 1,703 1,479812 79 733 78 561 173 377 298500 72 428 54 310 136 247 171
1,349 116 1,233 153 975 221 578 5414,503 289 4,214 438 3,414 651 1,815 1,840
465 46 419 49 326 90 182 200411 33 378 46 295 70 177 173
1,783 125 1,658 158 1,328 297 748 683985 92 893 138 650 197 394 400
1,166 165 1,001 76 767 323 565 4152,742 261 2,481 327 1,924 491 1,236 1,039
47 3 44 4 34 9 21 17Unknown
SOURCE: Social Security Administration, Supplemental Security Record (Characteristic Extract Record format), 100 percent data.
SomersetWaldoWashingtonYork
OxfordPenobscot
Piscataquis
Franklin
Sagadahoc
Hancock
KennebecKnoxLincoln
County
AndroscogginAroostookCumberland
Total
Amount ofpayments
(thousandsof dollars)
Category Age
SSIrecipients
alsoreceiving
OASDI

42 ♦ SSI Recipients by State and County, 2003
Maryland
Table 3.Number of recipients in state (by eligibility category, age, and receipt of OASDI benefits)and amount of payments, by county, December 2003
AgedBlind anddisabled Under 18 18–64
65 orolder
Total, Maryland 90,983 15,541 75,442 14,046 52,124 24,813 26,307 39,451
1,885 165 1,720 254 1,293 338 621 8215,097 551 4,546 945 3,196 956 1,525 2,216
12,425 1,850 10,575 2,254 7,322 2,849 3,376 5,76030,529 3,101 27,428 4,701 18,772 7,056 8,381 13,756
635 104 531 39 409 187 231 248
676 88 588 133 393 150 270 2721,149 100 1,049 131 817 201 420 4811,269 100 1,169 203 885 181 477 5331,276 167 1,109 167 788 321 415 510
896 145 751 170 491 235 410 349
1,385 190 1,195 170 917 298 487 574663 80 583 65 450 148 260 241
2,061 222 1,839 325 1,337 399 710 8751,670 530 1,140 155 841 674 444 687
330 54 276 29 207 94 166 118
10,823 5,135 5,688 833 3,835 6,155 2,443 4,56010,995 1,917 9,078 2,402 5,828 2,765 2,726 4,690
280 51 229 36 167 77 143 99632 122 510 89 356 187 300 248
1,061 198 863 103 635 323 382 427
530 101 429 71 310 149 262 1722,137 217 1,920 297 1,405 435 847 8291,729 207 1,522 377 959 393 663 664
681 119 562 79 415 187 301 251
169 27 142 18 96 55 47 68Unknown
SOURCE: Social Security Administration, Supplemental Security Record (Characteristic Extract Record format), 100 percent data.
TalbotWashingtonWicomicoWorcester
Prince George'sQueen Anne'sSomerset
Garrett
St. Mary's
HarfordHowardKent
Montgomery
CecilCharlesDorchester
Frederick
Baltimore CityCalvert
CarolineCarroll
County
AlleganyAnne ArundelBaltimore
Total
Amount ofpayments
(thousandsof dollars)
Category Age
SSIrecipients
alsoreceiving
OASDI

SSI Recipients by State and County, 2003 ♦ 43
Massachusetts
Table 3.Number of recipients in state (by eligibility category, age, and receipt of OASDI benefits)and amount of payments, by county, December 2003
AgedBlind anddisabled Under 18 18–64
65 orolder
Total,Massachusetts 167,883 44,795 123,088 16,610 103,163 48,110 62,696 75,932
3,463 618 2,845 297 2,487 679 1,604 1,4443,770 657 3,113 406 2,648 716 1,698 1,613
18,830 4,963 13,867 1,565 11,935 5,330 8,435 8,007151 44 107 11 89 51 87 50
20,322 5,564 14,758 2,095 12,274 5,953 7,289 9,480
1,950 303 1,647 237 1,382 331 843 85022,178 3,959 18,219 3,185 14,698 4,295 7,763 10,584
2,261 380 1,881 263 1,583 415 974 98624,511 8,037 16,474 1,783 14,192 8,536 9,294 10,707
46 6 40 6 32 8 16 20
8,331 2,925 5,406 551 4,663 3,117 3,197 3,6068,560 1,929 6,631 862 5,589 2,109 3,418 3,629
34,573 11,413 23,160 3,254 19,175 12,144 10,810 16,53918,745 3,949 14,796 2,084 12,289 4,372 7,194 8,330
192 48 144 11 127 54 74 87
Total
Amount ofpayments
(thousandsof dollars)
Category Age
SSIrecipients
alsoreceiving
OASDICounty
BarnstableBerkshireBristolDukesEssex
FranklinHampdenHampshireMiddlesexNantucket
NorfolkPlymouthSuffolkWorcester
Unknown
SOURCE: Social Security Administration, Supplemental Security Record (Characteristic Extract Record format), 100 percent data.
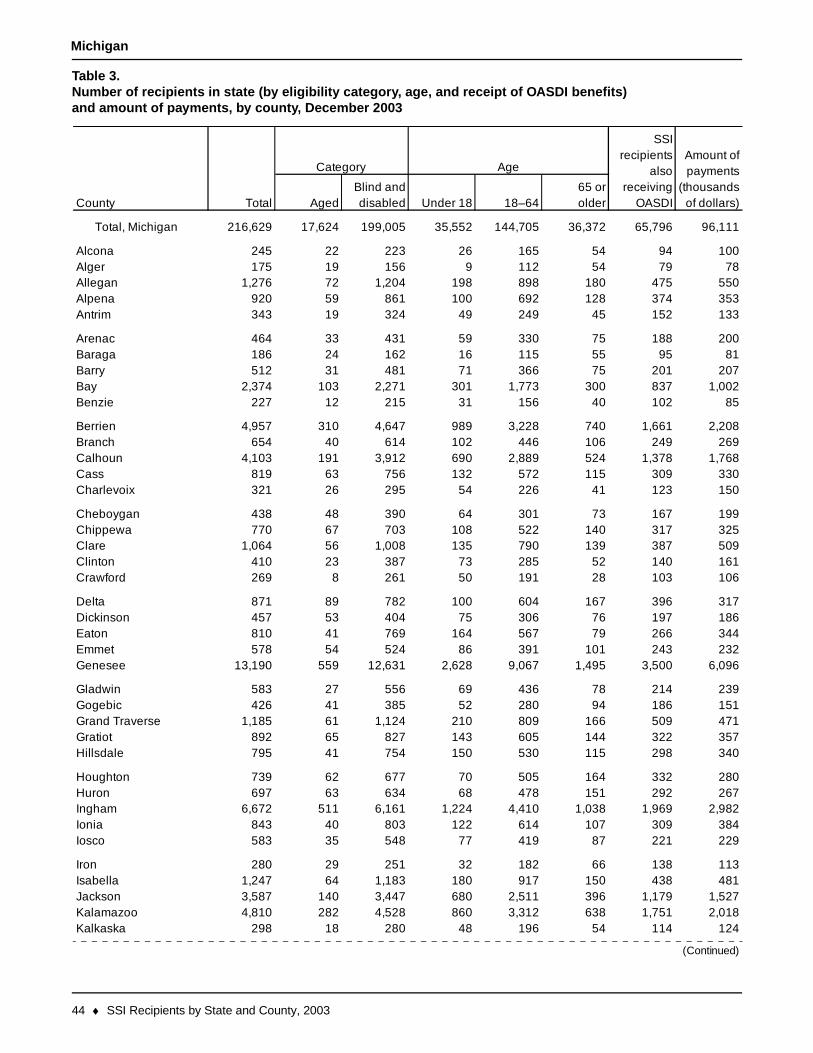
44 ♦ SSI Recipients by State and County, 2003
Michigan
Table 3.Number of recipients in state (by eligibility category, age, and receipt of OASDI benefits)and amount of payments, by county, December 2003
AgedBlind anddisabled Under 18 18–64
65 orolder
Total, Michigan 216,629 17,624 199,005 35,552 144,705 36,372 65,796 96,111
245 22 223 26 165 54 94 100175 19 156 9 112 54 79 78
1,276 72 1,204 198 898 180 475 550920 59 861 100 692 128 374 353343 19 324 49 249 45 152 133
464 33 431 59 330 75 188 200186 24 162 16 115 55 95 81512 31 481 71 366 75 201 207
2,374 103 2,271 301 1,773 300 837 1,002227 12 215 31 156 40 102 85
4,957 310 4,647 989 3,228 740 1,661 2,208654 40 614 102 446 106 249 269
4,103 191 3,912 690 2,889 524 1,378 1,768819 63 756 132 572 115 309 330321 26 295 54 226 41 123 150
438 48 390 64 301 73 167 199770 67 703 108 522 140 317 325
1,064 56 1,008 135 790 139 387 509410 23 387 73 285 52 140 161269 8 261 50 191 28 103 106
871 89 782 100 604 167 396 317457 53 404 75 306 76 197 186810 41 769 164 567 79 266 344578 54 524 86 391 101 243 232
13,190 559 12,631 2,628 9,067 1,495 3,500 6,096
583 27 556 69 436 78 214 239426 41 385 52 280 94 186 151
1,185 61 1,124 210 809 166 509 471892 65 827 143 605 144 322 357795 41 754 150 530 115 298 340
739 62 677 70 505 164 332 280697 63 634 68 478 151 292 267
6,672 511 6,161 1,224 4,410 1,038 1,969 2,982843 40 803 122 614 107 309 384583 35 548 77 419 87 221 229
280 29 251 32 182 66 138 1131,247 64 1,183 180 917 150 438 4813,587 140 3,447 680 2,511 396 1,179 1,5274,810 282 4,528 860 3,312 638 1,751 2,018
298 18 280 48 196 54 114 124Kalkaska
(Continued)
IronIsabellaJacksonKalamazoo
HuronInghamIoniaIosco
Grand TraverseGratiotHillsdale
Houghton
EmmetGenesee
GladwinGogebic
Crawford
DeltaDickinsonEaton
CheboyganChippewaClareClinton
BranchCalhounCassCharlevoix
BarryBayBenzie
Berrien
AlpenaAntrim
ArenacBaraga
County
AlconaAlgerAllegan
Total
Amount ofpayments
(thousandsof dollars)
Category Age
SSIrecipients
alsoreceiving
OASDI

SSI Recipients by State and County, 2003 ♦ 45
Michigan
Table 3.Continued
AgedBlind anddisabled Under 18 18–64
65 orolder
11,651 773 10,878 2,475 7,621 1,555 3,781 5,23440 6 34 9 22 9 11 16
540 36 504 58 406 76 212 236579 50 529 65 396 118 235 219
94 6 88 16 67 11 28 37
1,671 105 1,566 280 1,155 236 638 699587 37 550 89 416 82 187 231205 18 187 16 133 56 89 77180 14 166 24 123 33 96 63
9,440 1,494 7,946 1,160 5,807 2,473 2,695 4,003
513 28 485 57 384 72 209 216979 77 902 110 725 144 390 416677 49 628 111 469 97 253 298931 51 880 156 634 141 334 375410 56 354 48 261 101 195 142
1,095 75 1,020 144 818 133 357 454206 17 189 25 152 29 95 82
1,966 141 1,825 368 1,333 265 664 8531,240 83 1,157 203 874 163 444 552
273 20 253 31 191 51 111 101
5,267 182 5,085 911 3,818 538 1,791 2,390874 51 823 106 637 131 327 356
15,100 3,174 11,926 1,671 8,596 4,833 4,010 6,549636 41 595 90 445 101 270 270678 45 633 72 506 100 248 292
195 23 172 17 126 52 95 78662 39 623 88 460 114 240 279186 12 174 20 137 29 74 76368 21 347 65 254 49 128 168
1,924 190 1,734 324 1,280 320 703 793
309 41 268 32 202 75 158 117669 32 637 83 508 78 245 302
7,107 267 6,840 1,379 4,938 790 1,894 3,330692 55 637 87 476 129 285 285226 28 198 13 161 52 99 97
1,290 78 1,212 197 938 155 484 5332,651 147 2,504 389 1,922 340 913 1,1411,002 63 939 140 708 154 370 4151,007 52 955 155 726 126 335 4251,845 155 1,690 249 1,268 328 713 746Van Buren
ShiawasseeSt. ClairSt. Joseph
Ottawa
Presque Isle
Tuscola
RoscommonSaginawSanilacSchoolcraft
OntonagonOsceolaOscodaOtsego
NewaygoOaklandOceanaOgemaw
MonroeMontcalmMontmorency
Muskegon
MecostaMenominee
MidlandMissaukee
Macomb
ManisteeMarquetteMason
LenaweeLivingstonLuceMackinac
KentKeweenawLake
County Total
Category Age
SSIrecipients
alsoreceiving
OASDI
Amount ofpayments
(thousandsof dollars)
(Continued)
LapeerLeelanau
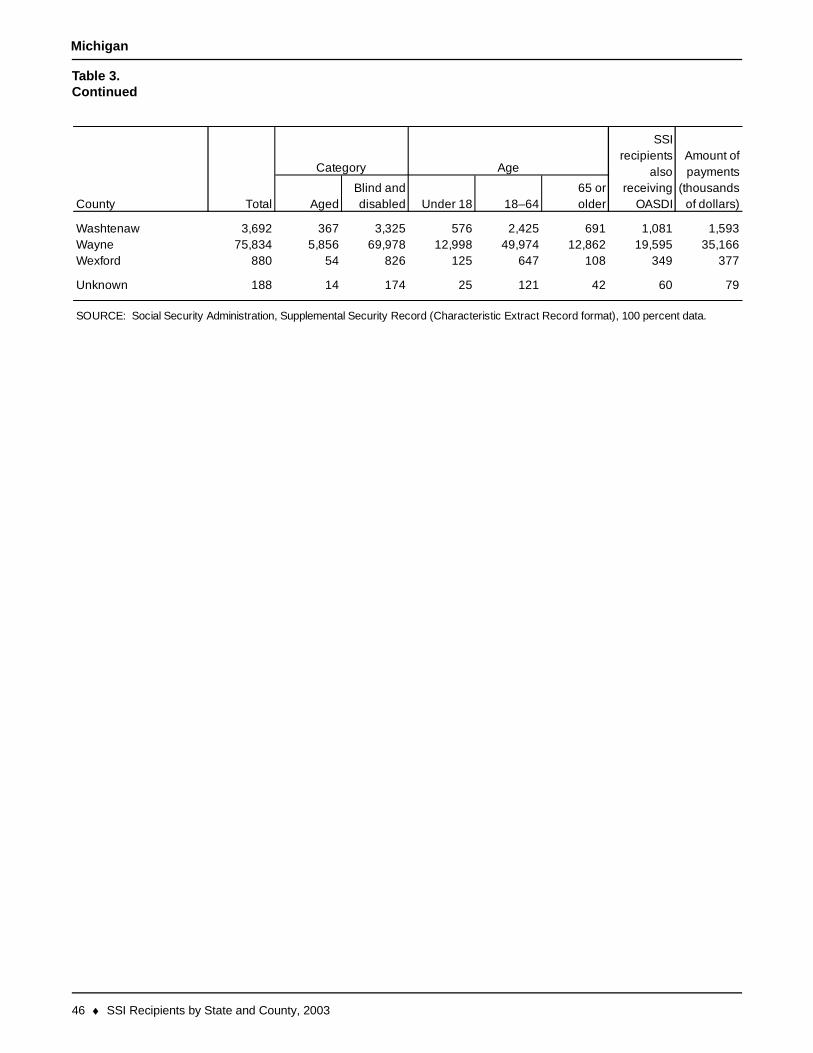
46 ♦ SSI Recipients by State and County, 2003
Michigan
Table 3.Continued
AgedBlind anddisabled Under 18 18–64
65 orolder
3,692 367 3,325 576 2,425 691 1,081 1,59375,834 5,856 69,978 12,998 49,974 12,862 19,595 35,166
880 54 826 125 647 108 349 377
188 14 174 25 121 42 60 79
SOURCE: Social Security Administration, Supplemental Security Record (Characteristic Extract Record format), 100 percent data.
WashtenawWayneWexford
Unknown
County Total
Category Age
SSIrecipients
alsoreceiving
OASDI
Amount ofpayments
(thousandsof dollars)

SSI Recipients by State and County, 2003 ♦ 47
Minnesota
Table 3.Number of recipients in state (by eligibility category, age, and receipt of OASDI benefits)and amount of payments, by county, December 2003
AgedBlind anddisabled Under 18 18–64
65 orolder
Total, Minnesota 69,020 9,806 59,214 9,593 43,802 15,625 22,090 28,272
258 40 218 26 163 69 106 1051,857 193 1,664 321 1,244 292 527 829
519 76 443 73 317 129 226 1861,077 101 976 173 707 197 402 432
290 45 245 42 168 80 135 92
97 28 69 14 50 33 43 28949 196 753 121 575 253 444 321253 45 208 32 157 64 134 83508 39 469 69 359 80 188 200210 32 178 30 142 38 66 82
562 72 490 82 341 139 234 221151 34 117 18 91 42 76 50302 26 276 52 210 40 86 124814 84 730 131 560 123 294 333196 49 147 28 98 70 94 66
35 7 28 4 20 11 17 12194 24 170 29 129 36 65 80952 120 832 103 653 196 409 339
1,875 272 1,603 302 1,175 398 517 784127 34 93 25 59 43 63 37
464 79 385 58 290 116 235 157203 35 168 25 122 56 90 72218 67 151 32 99 87 121 66422 57 365 59 266 97 203 156344 51 293 56 218 70 124 127
71 14 57 6 42 23 36 2319,829 3,102 16,727 2,951 12,082 4,796 4,569 8,763
195 40 155 21 117 57 90 65307 37 270 45 190 72 132 115251 27 224 32 179 40 91 94
774 68 706 93 559 122 306 29695 19 76 16 52 27 41 31
184 24 160 22 123 39 84 79582 49 533 62 410 110 295 198
66 14 52 5 33 28 31 19
283 28 255 25 198 60 113 10494 29 65 14 44 36 45 30
101 4 97 9 81 11 44 3441 8 33 4 24 13 21 13
219 49 170 36 117 66 101 82Le Sueur
(Continued)
KoochichingLac Qui ParleLakeLake of the Woods
JacksonKanabecKandiyohiKittson
HoustonHubbardIsanti
Itasca
FreebornGoodhue
GrantHennepin
Dodge
DouglasFaribaultFillmore
CookCottonwoodCrow WingDakota
ChippewaChisagoClayClearwater
BrownCarltonCarver
Cass
BeltramiBenton
Big StoneBlue Earth
County
AitkinAnokaBecker
Total
Amount ofpayments
(thousandsof dollars)
Category Age
SSIrecipients
alsoreceiving
OASDI

48 ♦ SSI Recipients by State and County, 2003
Minnesota
Table 3.Continued
AgedBlind anddisabled Under 18 18–64
65 orolder
80 26 54 5 38 37 50 22358 53 305 48 227 83 171 126125 22 103 8 77 40 59 45118 32 86 14 56 48 65 40334 41 293 65 204 65 155 113
194 30 164 34 111 49 88 66175 29 146 17 115 43 73 66347 68 279 38 221 88 150 143465 93 372 40 288 137 240 149647 71 576 100 409 138 264 250
82 22 60 13 38 31 48 25236 30 206 47 144 45 81 96302 52 250 46 170 86 110 109113 32 81 12 58 43 64 33
1,618 290 1,328 214 977 427 448 660
824 168 656 93 503 228 400 285204 47 157 25 114 65 94 68414 61 353 44 276 94 165 156131 32 99 16 66 49 57 51589 137 452 52 342 195 303 193
118 27 91 14 69 35 66 3913,278 1,682 11,596 1,789 8,495 2,994 3,090 5,915
52 15 37 3 28 21 25 16201 27 174 28 124 49 91 69159 30 129 26 81 52 83 50
502 61 441 72 324 106 211 17972 11 61 10 44 18 38 23
144 29 115 18 84 42 75 54335 58 277 52 195 88 82 133323 41 282 64 199 60 128 128
91 15 76 18 50 23 42 334,606 303 4,303 479 3,517 610 1,693 1,8441,815 260 1,555 274 1,175 366 796 675
289 37 252 51 185 53 92 118107 14 93 14 68 25 54 36
153 54 99 19 69 65 91 47454 112 342 45 251 158 247 144
46 9 37 4 29 13 23 18176 34 142 22 102 52 70 63364 66 298 34 235 95 165 128Wadena
SteeleStevens
SwiftToddTraverseWabasha
Sherburne
SibleySt. LouisStearns
RiceRockRoseauScott
RamseyRed LakeRedwoodRenville
PinePipestonePolk
Pope
NormanOlmsted
Otter TailPennington
Mower
MurrayNicolletNobles
McLeodMeekerMille LacsMorrison
LincolnLyonMahnomen
County Total
Category Age
SSIrecipients
alsoreceiving
OASDI
Amount ofpayments
(thousandsof dollars)
(Continued)
MarshallMartin

SSI Recipients by State and County, 2003 ♦ 49
Minnesota
Table 3.Continued
AgedBlind anddisabled Under 18 18–64
65 orolder
176 21 155 29 110 37 63 72757 81 676 103 516 138 243 334
94 11 83 17 56 21 31 4066 10 56 13 39 14 35 19
589 49 540 90 405 94 264 215
520 66 454 96 327 97 219 184142 27 115 22 80 40 68 45
66 2 64 10 47 9 22 27
Wilkin
SOURCE: Social Security Administration, Supplemental Security Record (Characteristic Extract Record format), 100 percent data.
Winona
WrightYellow Medicine
Unknown
WasecaWashingtonWatonwan
County Total
Category Age
SSIrecipients
alsoreceiving
OASDI
Amount ofpayments
(thousandsof dollars)

50 ♦ SSI Recipients by State and County, 2003
Mississippi
Table 3.Number of recipients in state (by eligibility category, age, and receipt of OASDI benefits)and amount of payments, by county, December 2003
AgedBlind anddisabled Under 18 18–64
65 orolder
Total, Mississippi 126,282 17,536 108,746 21,262 71,364 33,656 52,691 49,430
1,967 309 1,658 334 1,096 537 798 7641,881 249 1,632 176 1,229 476 929 735
666 129 537 74 364 228 317 2411,113 199 914 121 588 404 540 447
506 76 430 76 280 150 221 194
3,574 468 3,106 685 2,027 862 1,414 1,443857 149 708 89 460 308 441 289491 107 384 59 225 207 239 186
1,065 174 891 147 569 349 496 415493 72 421 63 278 152 213 216
755 113 642 110 425 220 272 303770 127 643 133 398 239 356 292
1,107 152 955 203 593 311 439 4832,595 397 2,198 483 1,373 739 1,050 1,0451,759 256 1,503 264 1,037 458 752 666
1,106 136 970 205 606 295 468 4331,541 241 1,300 286 843 412 679 5703,016 281 2,735 653 1,790 573 1,161 1,189
403 61 342 81 208 114 171 154656 90 566 105 401 150 286 248
427 71 356 53 224 150 193 1601,315 179 1,136 222 731 362 577 5051,077 114 963 162 694 221 380 4526,173 656 5,517 1,190 3,738 1,245 2,264 2,440
10,439 1,209 9,230 2,202 5,977 2,260 3,685 4,430
2,225 326 1,899 309 1,177 739 968 8831,010 160 850 157 561 292 436 418
99 16 83 13 52 34 50 32558 97 461 57 332 169 301 175
2,671 250 2,421 539 1,679 453 977 1,072
1,061 142 919 190 550 321 484 388819 79 740 134 488 197 298 337730 111 619 111 408 211 310 277
3,102 320 2,782 671 1,795 636 1,185 1,107585 135 450 57 296 232 303 210
888 141 747 113 535 240 375 261865 124 741 127 498 240 388 326
3,726 483 3,243 629 2,136 961 1,472 1,495645 96 549 89 355 201 307 235
1,082 214 868 170 523 389 550 385
LamarLauderdaleLawrenceLeake
Jefferson DavisJonesKemper
Lafayette
ItawambaJackson
JasperJefferson
Hinds
HolmesHumphreysIssaquena
GreeneGrenadaHancockHarrison
De SotoForrestFranklinGeorge
ClayCoahomaCopiah
Covington
ChickasawChoctaw
ClaiborneClarke
Benton
BolivarCalhounCarroll
AdamsAlcornAmiteAttala
Category Age
SSIrecipients
alsoreceiving
OASDICounty
(Continued)
Total
Amount ofpayments
(thousandsof dollars)

SSI Recipients by State and County, 2003 ♦ 51
Mississippi
Table 3.Continued
AgedBlind anddisabled Under 18 18–64
65 orolder
2,838 328 2,510 575 1,609 654 1,254 1,1172,961 390 2,571 561 1,654 746 1,121 1,2581,455 194 1,261 218 851 386 599 5262,593 350 2,243 468 1,460 665 1,040 1,0602,148 326 1,822 368 1,172 608 852 875
1,378 194 1,184 188 783 407 568 5182,009 342 1,667 292 1,078 639 914 7921,460 273 1,187 199 761 500 698 562
783 150 633 78 399 306 384 2721,160 152 1,008 196 629 335 487 434
1,118 205 913 160 558 400 551 4361,221 179 1,042 164 677 380 521 4721,729 197 1,532 288 1,008 433 674 6622,059 336 1,723 361 1,082 616 937 8591,589 179 1,410 220 1,010 359 632 628
530 76 454 58 327 145 240 1902,317 308 2,009 329 1,369 619 1,021 863
803 152 651 108 423 272 415 3061,015 195 820 114 574 327 576 314
976 147 829 169 515 292 443 409
2,245 251 1,994 374 1,371 500 767 7991,419 277 1,142 245 694 480 683 505
535 75 460 99 293 143 219 2211,184 143 1,041 202 695 287 450 427
635 82 553 132 333 170 284 231
494 47 447 90 309 95 195 1972,033 309 1,724 397 1,038 598 906 8161,281 199 1,082 190 695 396 572 495
880 188 692 98 461 321 429 3191,268 202 1,066 108 750 410 662 452
904 180 724 65 570 269 505 350672 119 553 115 345 212 328 256816 165 651 90 451 275 395 311862 112 750 124 482 256 372 314
1,866 243 1,623 386 1,012 468 734 746
4,942 587 4,355 1,034 2,838 1,070 1,733 2,1101,100 118 982 159 675 266 511 414
579 95 484 67 327 185 258 222819 134 685 119 451 249 348 321948 163 785 130 493 325 436 351
WayneWebsterWilkinsonWinston
UnionWalthallWarren
Washington
TateTippah
TishomingoTunica
Smith
StoneSunflowerTallahatchie
RankinScottSharkeySimpson
PikePontotocPrentissQuitman
OktibbehaPanolaPearl River
Perry
MontgomeryNeshoba
NewtonNoxubee
Madison
MarionMarshallMonroe
LeeLefloreLincolnLowndes
County Total
Category Age
SSIrecipients
alsoreceiving
OASDI
Amount ofpayments
(thousandsof dollars)
(Continued)
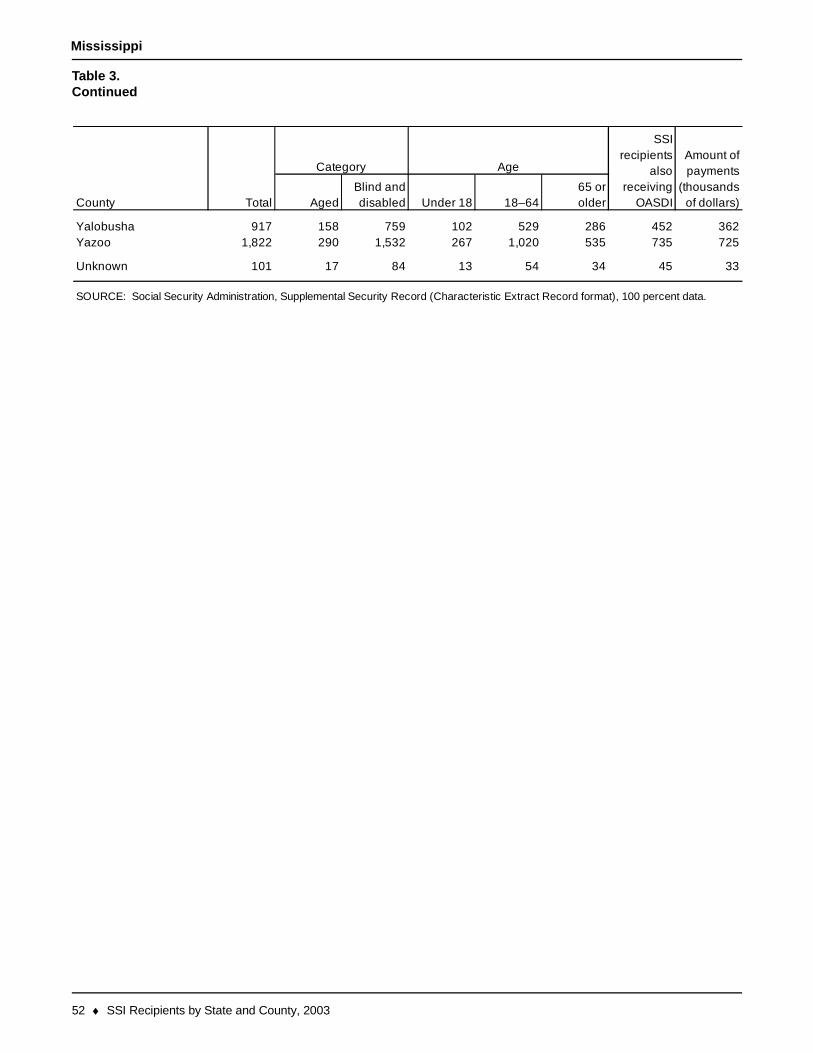
52 ♦ SSI Recipients by State and County, 2003
Mississippi
Table 3.Continued
AgedBlind anddisabled Under 18 18–64
65 orolder
917 158 759 102 529 286 452 3621,822 290 1,532 267 1,020 535 735 725
101 17 84 13 54 34 45 33
YalobushaYazoo
Unknown
SOURCE: Social Security Administration, Supplemental Security Record (Characteristic Extract Record format), 100 percent data.
County Total
Category Age
SSIrecipients
alsoreceiving
OASDI
Amount ofpayments
(thousandsof dollars)

SSI Recipients by State and County, 2003 ♦ 53
Missouri
Table 3.Number of recipients in state (by eligibility category, age, and receipt of OASDI benefits)and amount of payments, by county, December 2003
AgedBlind anddisabled Under 18 18–64
65 orolder
Total, Missouri 115,131 10,606 104,525 18,101 75,861 21,169 42,756 47,263
569 47 522 60 409 100 260 211142 23 119 22 86 34 54 52
96 15 81 15 54 27 44 40395 31 364 61 273 61 163 156759 97 662 99 491 169 325 310
243 25 218 30 166 47 98 109313 29 284 38 222 53 145 123427 43 384 41 311 75 191 176339 39 300 22 234 83 161 123
2,028 121 1,907 400 1,394 234 704 888
2,053 100 1,953 296 1,475 282 763 8222,312 209 2,103 266 1,554 492 989 878
145 13 132 23 99 23 51 58557 35 522 111 373 73 204 227393 31 362 47 283 63 181 147
1,425 106 1,319 214 979 232 554 583213 20 193 31 136 46 83 82331 46 285 33 209 89 150 131496 37 459 89 339 68 186 211374 45 329 37 253 84 154 137
151 14 137 12 108 31 59 66709 76 633 98 479 132 303 280105 19 86 17 63 25 45 37
1,529 129 1,400 260 1,041 228 563 600218 19 199 40 140 38 69 83
1,083 57 1,026 232 745 106 375 432197 13 184 25 133 39 93 65531 41 490 58 372 101 215 229170 25 145 19 105 46 67 83426 66 360 41 275 110 187 163
100 12 88 16 61 23 45 3685 13 72 12 52 21 36 31
485 43 442 50 345 90 203 193411 72 339 33 244 134 177 174
2,435 229 2,206 285 1,595 555 1,023 941
1,432 83 1,349 224 1,016 192 552 581187 20 167 31 121 35 84 69139 11 128 16 88 35 71 58
5,337 390 4,947 675 3,896 766 2,164 2,184231 31 200 14 151 66 120 87
County Total
Amount ofpayments
(thousandsof dollars)
Category Age
SSIrecipients
alsoreceiving
OASDI
AdairAndrewAtchisonAudrainBarry
BartonBatesBentonBollingerBoone
BuchananButlerCaldwellCallawayCamden
Cape GirardeauCarrollCarterCassCedar
CharitonChristianClarkClayClinton
ColeCooperCrawfordDadeDallas
DaviessDeKalbDentDouglasDunklin
FranklinGasconadeGentryGreeneGrundy
(Continued)

54 ♦ SSI Recipients by State and County, 2003
Missouri
Table 3.Continued
AgedBlind anddisabled Under 18 18–64
65 orolder
189 35 154 20 111 58 96 64634 49 585 90 429 115 292 245213 34 179 20 132 61 112 74
75 14 61 8 44 23 42 22209 35 174 22 118 69 113 64
1,495 157 1,338 170 987 338 658 591508 38 470 48 367 93 199 200
13,311 1,111 12,200 2,505 8,752 2,054 4,540 5,7313,064 267 2,797 397 2,149 518 1,231 1,2682,048 146 1,902 311 1,456 281 794 890
564 38 526 87 397 80 209 230113 14 99 9 75 29 63 40
1,002 91 911 122 670 210 417 375440 29 411 63 309 68 172 186666 76 590 68 441 157 302 273
162 31 131 18 95 49 80 61477 22 455 87 335 55 151 224308 47 261 45 188 75 133 113387 48 339 53 243 91 156 151268 37 231 37 168 63 130 103
387 39 348 44 270 73 153 190124 18 106 18 73 33 56 50973 48 925 132 707 134 358 392478 39 439 59 340 79 189 204
69 18 51 5 35 29 39 21
463 56 407 60 301 102 220 165696 108 588 82 404 210 331 260150 13 137 16 107 27 61 67132 21 111 17 73 42 73 45213 22 191 32 135 46 95 88
371 38 333 36 264 71 157 1361,066 170 896 139 589 338 530 367
682 64 618 84 466 132 280 261287 40 247 34 187 66 139 96551 93 458 52 332 167 278 194
110 22 88 12 65 33 58 40375 61 314 26 229 120 171 129
1,669 180 1,489 234 990 445 700 656270 22 248 45 171 54 109 93944 89 855 120 642 182 420 366
HarrisonHenryHickoryHoltHoward
HowellIronJacksonJasperJefferson
JohnsonKnoxLacledeLafayetteLawrence
LewisLincolnLinnLivingstonMacon
MadisonMariesMarionMcDonaldMercer
MillerMississippiMoniteauMonroeMontgomery
MorganNew MadridNewtonNodawayOregon
OsageOzarkPemiscotPerryPettis
County Total
Category Age
SSIrecipients
alsoreceiving
OASDI
Amount ofpayments
(thousandsof dollars)
(Continued)
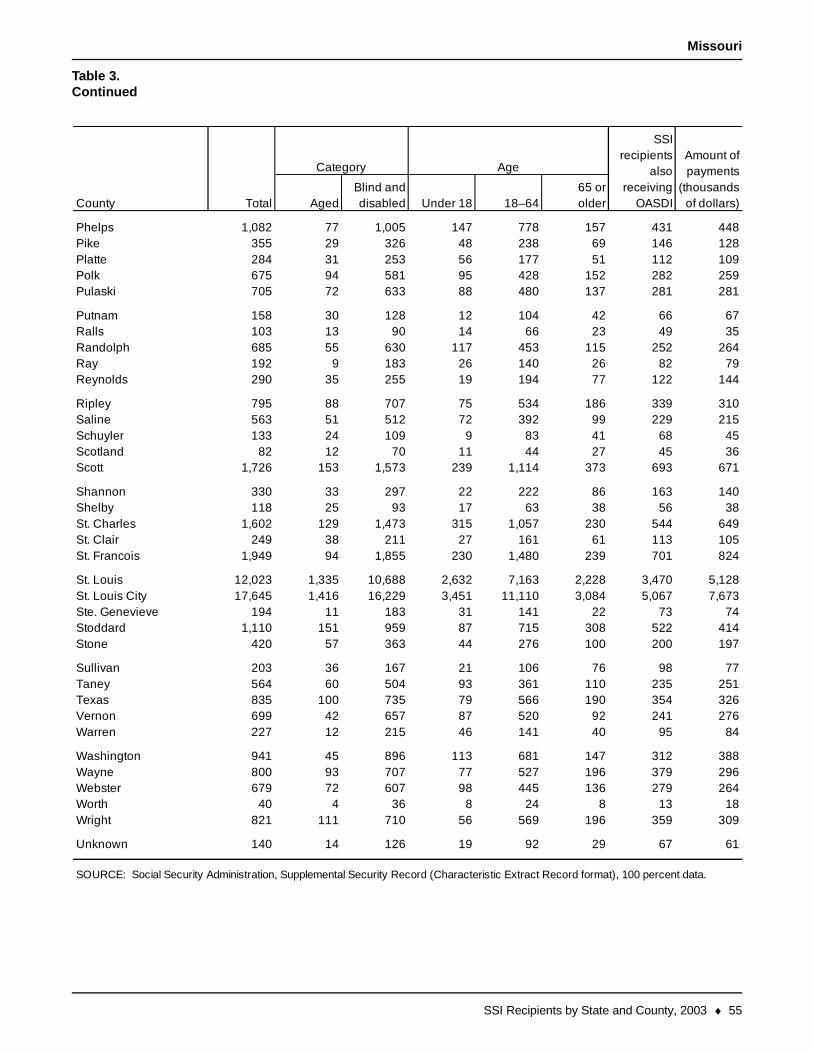
SSI Recipients by State and County, 2003 ♦ 55
Missouri
Table 3.Continued
AgedBlind anddisabled Under 18 18–64
65 orolder
1,082 77 1,005 147 778 157 431 448355 29 326 48 238 69 146 128284 31 253 56 177 51 112 109675 94 581 95 428 152 282 259705 72 633 88 480 137 281 281
158 30 128 12 104 42 66 67103 13 90 14 66 23 49 35685 55 630 117 453 115 252 264192 9 183 26 140 26 82 79290 35 255 19 194 77 122 144
795 88 707 75 534 186 339 310563 51 512 72 392 99 229 215133 24 109 9 83 41 68 45
82 12 70 11 44 27 45 361,726 153 1,573 239 1,114 373 693 671
330 33 297 22 222 86 163 140118 25 93 17 63 38 56 38
1,602 129 1,473 315 1,057 230 544 649249 38 211 27 161 61 113 105
1,949 94 1,855 230 1,480 239 701 824
12,023 1,335 10,688 2,632 7,163 2,228 3,470 5,12817,645 1,416 16,229 3,451 11,110 3,084 5,067 7,673
194 11 183 31 141 22 73 741,110 151 959 87 715 308 522 414
420 57 363 44 276 100 200 197
203 36 167 21 106 76 98 77564 60 504 93 361 110 235 251835 100 735 79 566 190 354 326699 42 657 87 520 92 241 276227 12 215 46 141 40 95 84
941 45 896 113 681 147 312 388800 93 707 77 527 196 379 296679 72 607 98 445 136 279 264
40 4 36 8 24 8 13 18821 111 710 56 569 196 359 309
140 14 126 19 92 29 67 61
PhelpsPikePlattePolkPulaski
PutnamRallsRandolphRayReynolds
RipleySalineSchuylerScotlandScott
ShannonShelbySt. CharlesSt. ClairSt. Francois
St. LouisSt. Louis CitySte. GenevieveStoddardStone
SullivanTaneyTexas
SOURCE: Social Security Administration, Supplemental Security Record (Characteristic Extract Record format), 100 percent data.
WebsterWorthWright
Unknown
VernonWarren
WashingtonWayne
County Total
Category Age
SSIrecipients
alsoreceiving
OASDI
Amount ofpayments
(thousandsof dollars)

56 ♦ SSI Recipients by State and County, 2003
Montana
Table 3.Number of recipients in state (by eligibility category, age, and receipt of OASDI benefits)and amount of payments, by county, December 2003
AgedBlind anddisabled Under 18 18–64
65 orolder
Total, Montana 14,365 1,212 13,153 1,805 10,080 2,480 5,662 5,722
91 10 81 12 55 24 36 34302 57 245 33 176 93 109 115151 17 134 22 95 34 46 71
66 8 58 11 38 17 33 2599 11 88 7 67 25 47 35
13 a a a a a a 41,514 91 1,423 182 1,107 225 592 612
55 5 50 5 38 12 27 18230 17 213 27 169 34 107 84
17 2 15 3 10 4 8 5
97 7 90 15 65 17 37 42254 11 243 25 201 28 83 112
22 4 18 3 10 9 12 7169 44 125 12 89 68 63 56
1,110 98 1,012 151 774 185 448 443
420 34 386 60 300 60 172 1718 a a a a a a 2
428 43 385 61 262 105 132 17811 a a a a a a 331 4 27 a 24 a 15 13
327 28 299 38 232 57 117 131102 5 97 9 77 16 37 26
19 6 13 3 8 8 6 6523 42 481 53 372 98 217 197866 39 827 115 658 93 340 351
12 a a a a a a 4450 27 423 41 338 71 187 175
29 6 23 4 17 8 14 818 5 13 2 9 7 13 520 2 18 5 9 6 10 5
93 6 87 9 74 10 39 321,637 96 1,541 202 1,224 211 612 668
79 14 65 8 48 23 40 26179 22 157 13 128 38 99 69
7 a a a a a a 2
99 16 83 5 61 33 40 36113 12 101 14 69 30 55 38
14 a a a a a a 480 8 72 12 51 17 32 2712 a a a a a a 4
County Total
Amount ofpayments
(thousandsof dollars)
Category Age
SSIrecipients
alsoreceiving
OASDI
BeaverheadBig HornBlaineBroadwaterCarbon
CarterCascadeChouteauCusterDaniels
DawsonDeer LodgeFallonFergusFlathead
GallatinGarfieldGlacierGolden ValleyGranite
HillJeffersonJudith BasinLakeLewis and Clark
LibertyLincolnMadisonMcConeMeagher
MineralMissoulaMusselshellParkPetroleum
PhillipsPonderaPowder RiverPowellPrairie
(Continued)

SSI Recipients by State and County, 2003 ♦ 57
Montana
Table 3.Continued
AgedBlind anddisabled Under 18 18–64
65 orolder
474 39 435 72 319 83 183 201118 13 105 13 82 23 56 41289 27 262 50 182 57 77 127162 16 146 29 98 35 61 73209 19 190 15 148 46 90 90
51 8 43 6 31 14 26 17867 46 821 101 650 116 311 360
72 5 67 7 52 13 32 2612 a a a a a a 565 7 58 4 48 13 27 22
62 2 60 6 48 8 29 215 a a a a a a 1
155 20 135 23 95 37 70 6122 6 16 3 11 8 12 713 a a a a a a 7
2,012 177 1,835 298 1,400 314 803 821
10 1 9 1 7 2 5 4
a.
RavalliRichlandRooseveltRosebud
TooleTreasure
Sanders
SheridanSilver BowStillwater
Unknown
SOURCE: Social Security Administration, Supplemental Security Record (Characteristic Extract Record format), 100 percent data.
Data not shown to avoid disclosure of information for particular individuals.
ValleyWheatlandWibauxYellowstone
Sweet GrassTeton
County Total
Category Age
SSIrecipients
alsoreceiving
OASDI
Amount ofpayments
(thousandsof dollars)
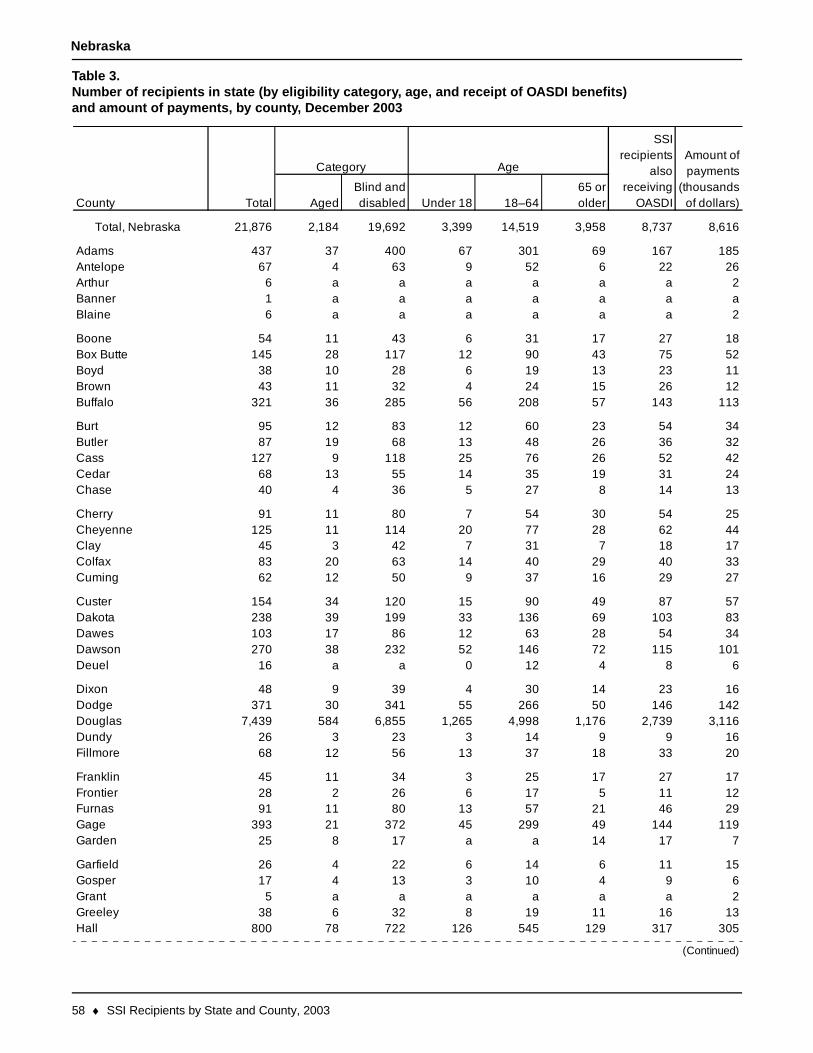
58 ♦ SSI Recipients by State and County, 2003
Nebraska
Table 3.Number of recipients in state (by eligibility category, age, and receipt of OASDI benefits)and amount of payments, by county, December 2003
AgedBlind anddisabled Under 18 18–64
65 orolder
Total, Nebraska 21,876 2,184 19,692 3,399 14,519 3,958 8,737 8,616
437 37 400 67 301 69 167 18567 4 63 9 52 6 22 26
6 a a a a a a 21 a a a a a a a6 a a a a a a 2
54 11 43 6 31 17 27 18145 28 117 12 90 43 75 52
38 10 28 6 19 13 23 1143 11 32 4 24 15 26 12
321 36 285 56 208 57 143 113
95 12 83 12 60 23 54 3487 19 68 13 48 26 36 32
127 9 118 25 76 26 52 4268 13 55 14 35 19 31 2440 4 36 5 27 8 14 13
91 11 80 7 54 30 54 25125 11 114 20 77 28 62 44
45 3 42 7 31 7 18 1783 20 63 14 40 29 40 3362 12 50 9 37 16 29 27
154 34 120 15 90 49 87 57238 39 199 33 136 69 103 83103 17 86 12 63 28 54 34270 38 232 52 146 72 115 101
16 a a 0 12 4 8 6
48 9 39 4 30 14 23 16371 30 341 55 266 50 146 142
7,439 584 6,855 1,265 4,998 1,176 2,739 3,11626 3 23 3 14 9 9 1668 12 56 13 37 18 33 20
45 11 34 3 25 17 27 1728 2 26 6 17 5 11 1291 11 80 13 57 21 46 29
393 21 372 45 299 49 144 11925 8 17 a a 14 17 7
26 4 22 6 14 6 11 1517 4 13 3 10 4 9 6
5 a a a a a a 238 6 32 8 19 11 16 13
800 78 722 126 545 129 317 305
Total
Amount ofpayments
(thousandsof dollars)
Category Age
SSIrecipients
alsoreceiving
OASDICounty
AdamsAntelopeArthurBannerBlaine
BooneBox ButteBoydBrownBuffalo
BurtButlerCassCedarChase
CherryCheyenneClayColfaxCuming
CusterDakotaDawesDawsonDeuel
DixonDodgeDouglasDundyFillmore
FranklinFrontierFurnasGageGarden
GarfieldGosperGrantGreeleyHall
(Continued)

SSI Recipients by State and County, 2003 ♦ 59
Nebraska
Table 3.Continued
AgedBlind anddisabled Under 18 18–64
65 orolder
61 6 55 10 42 9 23 2437 7 30 4 24 9 16 14
8 a a a a a a 340 9 31 6 24 10 19 16
183 32 151 23 108 52 106 57
6 a a a a a a 248 9 39 6 28 14 23 17
142 10 132 32 90 20 64 4743 8 35 7 20 16 19 1365 4 61 13 44 8 12 18
102 13 89 17 66 19 51 395 a a a a a a 2
48 3 45 9 33 6 21 16140 33 107 19 73 48 73 43
3,413 321 3,092 472 2,397 544 1,151 1,485
633 54 579 91 439 103 286 23212 a a a a a a 4
7 a a a a a a 2556 63 493 78 386 92 255 196
6 a a a a a a 3
100 7 93 13 75 12 47 3788 10 78 14 57 17 34 3971 5 66 8 45 18 31 18
111 14 97 19 71 21 48 3879 8 71 13 48 18 35 32
131 11 120 21 85 25 55 5041 7 34 2 25 14 19 1331 a a 5 22 4 11 1898 7 91 10 73 15 50 3357 10 47 8 32 17 27 19
230 30 200 26 150 54 107 8930 6 24 6 14 10 13 10
178 17 161 25 123 30 75 66149 21 128 14 96 39 78 54
29 6 23 9 11 9 13 8
108 4 104 16 77 15 39 38702 44 658 147 479 76 242 304124 22 102 14 74 36 58 43898 80 818 133 605 160 391 335
92 10 82 19 51 22 35 31
HamiltonHarlanHayesHitchockHolt
HookerHowardJeffersonJohnsonKearney
KeithKeya PahaKimballKnoxLancaster
LincolnLoganLoupMadisonMcPherson
MerrickMorrillNanceNemahaNuckolls
OtoePawneePerkinsPhelpsPierce
PlattePolkRed WillowRichardsonRock
SalineSarpySaundersScotts BluffSeward
County Total
Category Age
SSIrecipients
alsoreceiving
OASDI
Amount ofpayments
(thousandsof dollars)
(Continued)

60 ♦ SSI Recipients by State and County, 2003
Nebraska
Table 3.Continued
AgedBlind anddisabled Under 18 18–64
65 orolder
76 13 63 13 38 25 38 2842 11 31 8 19 15 23 13
3 a a a a a a a29 a a 6 18 5 9 1079 21 58 11 39 29 40 23
6 a a a a a a 2181 20 161 30 110 41 73 69
60 11 49 7 32 21 37 1772 12 60 15 39 18 33 2571 6 65 4 56 11 39 23
59 8 51 3 43 13 34 176 a a a a a a 3
124 9 115 24 80 20 57 44
24 2 22 5 17 2 5 10
a.
SheridanShermanSiouxStantonThayer
ThomasThurstonValleyWashingtonWayne
WebsterWheelerYork
Unknown
SOURCE: Social Security Administration, Supplemental Security Record (Characteristic Extract Record format), 100 percent data.
Data not shown to avoid disclosure of information for particular individuals.
County Total
Category Age
SSIrecipients
alsoreceiving
OASDI
Amount ofpayments
(thousandsof dollars)

SSI Recipients by State and County, 2003 ♦ 61
Nevada
Table 3.Number of recipients in state (by eligibility category, age, and receipt of OASDI benefits)and amount of payments, by county, December 2003
AgedBlind anddisabled Under 18 18–64
65 orolder
Total, Nevada 30,983 7,920 23,063 5,251 17,375 8,357 10,193 13,167
626 133 493 80 405 141 250 242326 66 260 36 217 73 127 142
23,009 6,069 16,940 4,122 12,497 6,390 7,129 9,957181 41 140 37 103 41 64 68408 107 301 44 249 115 171 167
19 3 16 2 14 3 10 619 6 13 2 10 7 6 14
197 48 149 11 131 55 88 8061 17 44 5 39 17 21 25
231 37 194 55 136 40 83 97
452 121 331 66 261 125 193 155119 32 87 8 78 33 50 42450 82 368 56 308 86 184 182
55 10 45 9 35 11 17 2214 a a a a a a 5
4,646 1,113 3,533 696 2,767 1,183 1,732 1,887126 22 104 10 93 23 49 59
44 11 33 10 23 11 12 18
a.
White Pine
Unknown
SOURCE: Social Security Administration, Supplemental Security Record (Characteristic Extract Record format), 100 percent data.
Data not shown to avoid disclosure of information for particular individuals.
NyePershingStorey
Washoe
LanderLincoln
LyonMineral
Elko
EsmeraldaEurekaHumboldt
Carson CityChurchillClarkDouglas
Total
Amount ofpayments
(thousandsof dollars)
Category Age
SSIrecipients
alsoreceiving
OASDICounty
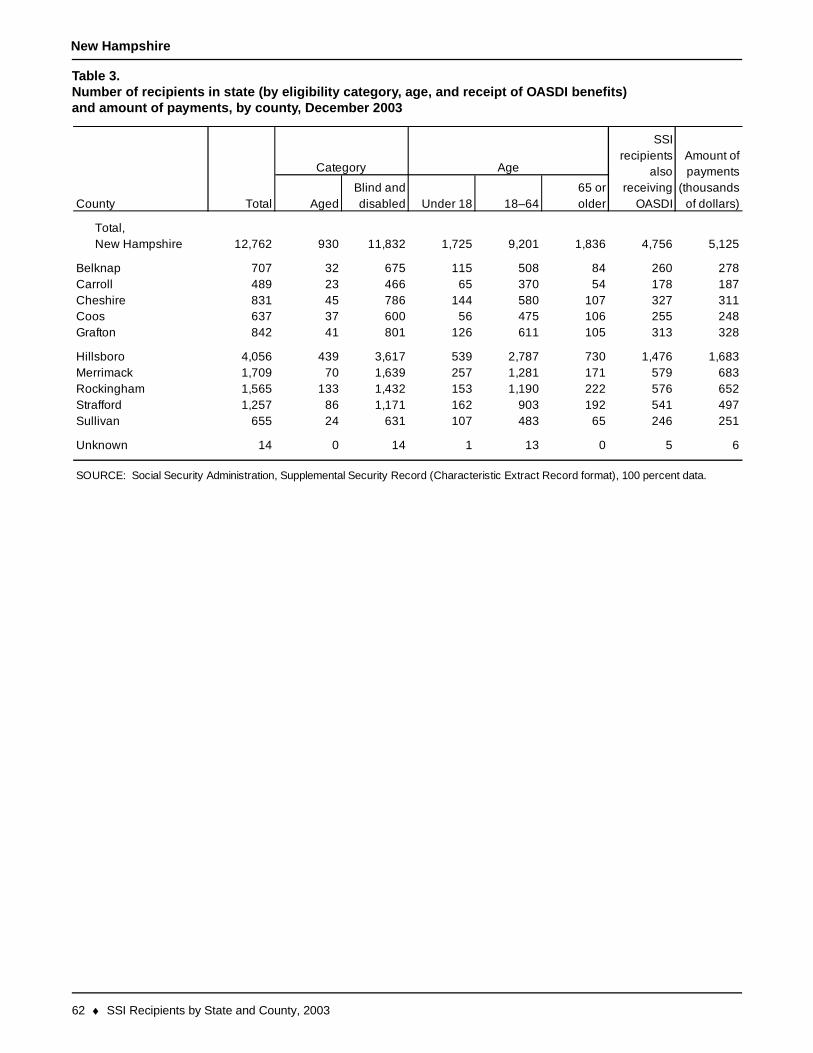
62 ♦ SSI Recipients by State and County, 2003
New Hampshire
Table 3.Number of recipients in state (by eligibility category, age, and receipt of OASDI benefits)and amount of payments, by county, December 2003
AgedBlind anddisabled Under 18 18–64
65 orolder
Total,New Hampshire 12,762 930 11,832 1,725 9,201 1,836 4,756 5,125
707 32 675 115 508 84 260 278489 23 466 65 370 54 178 187831 45 786 144 580 107 327 311637 37 600 56 475 106 255 248842 41 801 126 611 105 313 328
4,056 439 3,617 539 2,787 730 1,476 1,6831,709 70 1,639 257 1,281 171 579 6831,565 133 1,432 153 1,190 222 576 6521,257 86 1,171 162 903 192 541 497
655 24 631 107 483 65 246 251
14 0 14 1 13 0 5 6
Total
Amount ofpayments
(thousandsof dollars)
Category Age
SSIrecipients
alsoreceiving
OASDICounty
BelknapCarrollCheshireCoosGrafton
HillsboroMerrimackRockinghamStraffordSullivan
Unknown
SOURCE: Social Security Administration, Supplemental Security Record (Characteristic Extract Record format), 100 percent data.
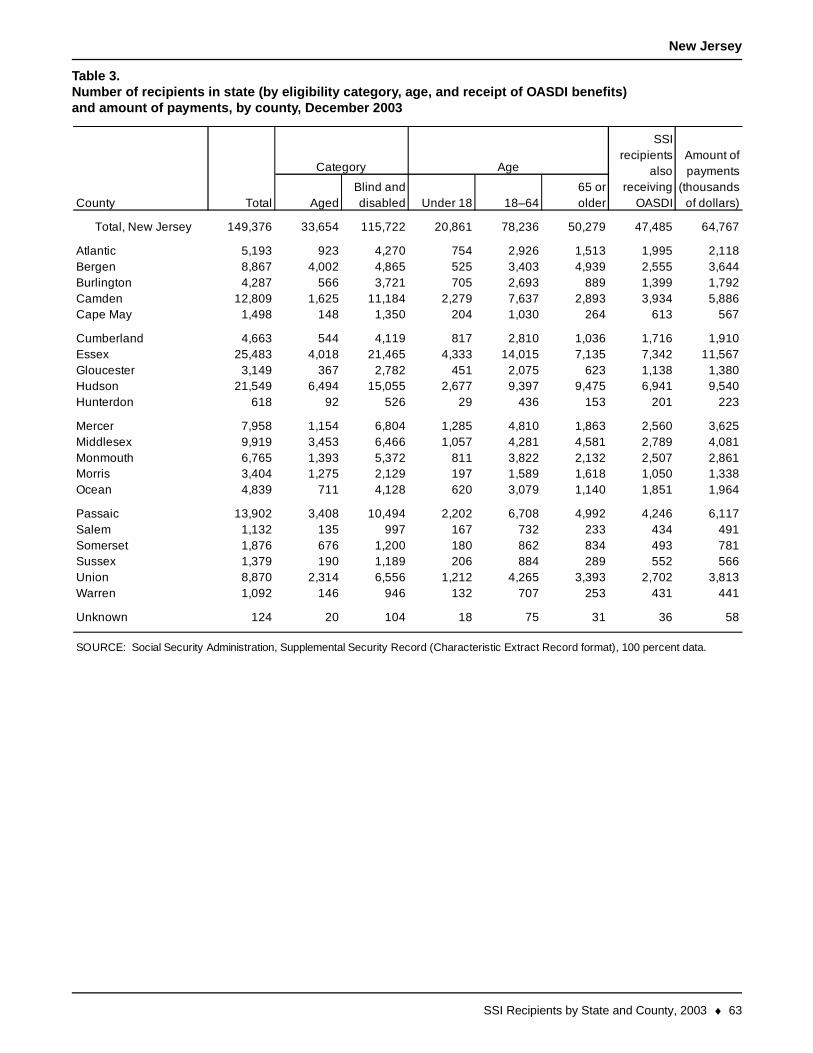
SSI Recipients by State and County, 2003 ♦ 63
New Jersey
Table 3.Number of recipients in state (by eligibility category, age, and receipt of OASDI benefits)and amount of payments, by county, December 2003
AgedBlind anddisabled Under 18 18–64
65 orolder
Total, New Jersey 149,376 33,654 115,722 20,861 78,236 50,279 47,485 64,767
5,193 923 4,270 754 2,926 1,513 1,995 2,1188,867 4,002 4,865 525 3,403 4,939 2,555 3,6444,287 566 3,721 705 2,693 889 1,399 1,792
12,809 1,625 11,184 2,279 7,637 2,893 3,934 5,8861,498 148 1,350 204 1,030 264 613 567
4,663 544 4,119 817 2,810 1,036 1,716 1,91025,483 4,018 21,465 4,333 14,015 7,135 7,342 11,567
3,149 367 2,782 451 2,075 623 1,138 1,38021,549 6,494 15,055 2,677 9,397 9,475 6,941 9,540
618 92 526 29 436 153 201 223
7,958 1,154 6,804 1,285 4,810 1,863 2,560 3,6259,919 3,453 6,466 1,057 4,281 4,581 2,789 4,0816,765 1,393 5,372 811 3,822 2,132 2,507 2,8613,404 1,275 2,129 197 1,589 1,618 1,050 1,3384,839 711 4,128 620 3,079 1,140 1,851 1,964
13,902 3,408 10,494 2,202 6,708 4,992 4,246 6,1171,132 135 997 167 732 233 434 4911,876 676 1,200 180 862 834 493 7811,379 190 1,189 206 884 289 552 5668,870 2,314 6,556 1,212 4,265 3,393 2,702 3,8131,092 146 946 132 707 253 431 441
124 20 104 18 75 31 36 58
Warren
Unknown
SOURCE: Social Security Administration, Supplemental Security Record (Characteristic Extract Record format), 100 percent data.
SalemSomersetSussexUnion
MonmouthMorris
Gloucester
Ocean
Passaic
HudsonHunterdon
MercerMiddlesex
CamdenCape May
CumberlandEssex
County
AtlanticBergenBurlington
Total
Amount ofpayments
(thousandsof dollars)
Category Age
SSIrecipients
alsoreceiving
OASDI

64 ♦ SSI Recipients by State and County, 2003
New Mexico
Table 3.Number of recipients in state (by eligibility category, age, and receipt of OASDI benefits)and amount of payments, by county, December 2003
AgedBlind anddisabled Under 18 18–64
65 orolder
Total, New Mexico 50,212 8,711 41,501 6,273 28,498 15,441 19,845 19,758
12,646 1,752 10,894 1,798 7,740 3,108 4,477 5,14455 11 44 6 33 16 24 22
2,156 325 1,831 251 1,315 590 897 786662 119 543 90 362 210 253 274350 62 288 41 198 111 156 138
1,426 137 1,289 206 897 323 548 57490 23 67 9 41 40 44 31
5,753 1,456 4,297 734 2,820 2,199 2,408 2,1981,448 247 1,201 153 883 412 575 565
775 102 673 63 531 181 285 337
263 47 216 15 148 100 127 9627 10 17 0 10 17 21 7
174 31 143 17 100 57 83 631,554 278 1,276 182 854 518 627 573
311 50 261 36 184 91 142 103
34 5 29 4 23 7 15 10940 327 613 84 424 432 453 357
3,975 904 3,071 490 1,873 1,612 1,483 1,614336 79 257 24 184 128 164 114
1,112 121 991 159 715 238 415 452
368 64 304 41 211 116 170 1371,666 252 1,414 170 975 521 722 629
564 78 486 65 326 173 247 2123,540 556 2,984 544 1,844 1,152 1,495 1,4061,861 262 1,599 147 1,141 573 704 748
1,649 409 1,240 183 803 663 662 6172,019 328 1,691 245 1,210 564 840 748
468 85 383 40 273 155 222 170759 106 653 96 451 212 284 327
1,020 217 803 72 540 408 507 404
387 49 338 54 228 105 153 149111 23 88 9 69 33 59 35
1,664 188 1,476 243 1,060 361 561 699
49 8 41 2 32 15 22 18
Valencia
Unknown
SOURCE: Social Security Administration, Supplemental Security Record (Characteristic Extract Record format), 100 percent data.
SocorroTaos
TorranceUnion
San Miguel
Sandoval
Otero
Santa FeSierra
QuayRio ArribaRooseveltSan Jaun
Los AlamosLunaMcKinleyMora
HardingHidalgoLeaLincoln
Dona AnaEddyGrant
Guadalupe
CibolaColfax
CurryDe Baca
County
BernalilloCatronChaves
Total
Amount ofpayments
(thousandsof dollars)
Category Age
SSIrecipients
alsoreceiving
OASDI
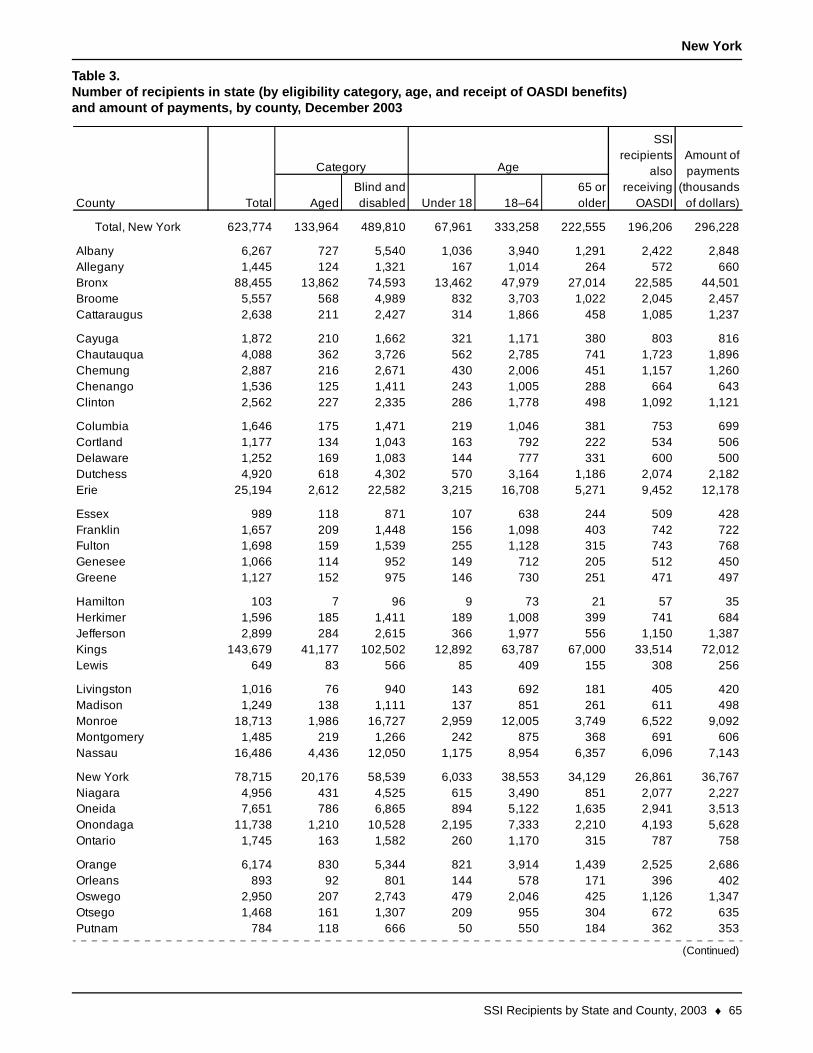
SSI Recipients by State and County, 2003 ♦ 65
New York
Table 3.Number of recipients in state (by eligibility category, age, and receipt of OASDI benefits)and amount of payments, by county, December 2003
AgedBlind anddisabled Under 18 18–64
65 orolder
Total, New York 623,774 133,964 489,810 67,961 333,258 222,555 196,206 296,228
6,267 727 5,540 1,036 3,940 1,291 2,422 2,8481,445 124 1,321 167 1,014 264 572 660
88,455 13,862 74,593 13,462 47,979 27,014 22,585 44,5015,557 568 4,989 832 3,703 1,022 2,045 2,4572,638 211 2,427 314 1,866 458 1,085 1,237
1,872 210 1,662 321 1,171 380 803 8164,088 362 3,726 562 2,785 741 1,723 1,8962,887 216 2,671 430 2,006 451 1,157 1,2601,536 125 1,411 243 1,005 288 664 6432,562 227 2,335 286 1,778 498 1,092 1,121
1,646 175 1,471 219 1,046 381 753 6991,177 134 1,043 163 792 222 534 5061,252 169 1,083 144 777 331 600 5004,920 618 4,302 570 3,164 1,186 2,074 2,182
25,194 2,612 22,582 3,215 16,708 5,271 9,452 12,178
989 118 871 107 638 244 509 4281,657 209 1,448 156 1,098 403 742 7221,698 159 1,539 255 1,128 315 743 7681,066 114 952 149 712 205 512 4501,127 152 975 146 730 251 471 497
103 7 96 9 73 21 57 351,596 185 1,411 189 1,008 399 741 6842,899 284 2,615 366 1,977 556 1,150 1,387
143,679 41,177 102,502 12,892 63,787 67,000 33,514 72,012649 83 566 85 409 155 308 256
1,016 76 940 143 692 181 405 4201,249 138 1,111 137 851 261 611 498
18,713 1,986 16,727 2,959 12,005 3,749 6,522 9,0921,485 219 1,266 242 875 368 691 606
16,486 4,436 12,050 1,175 8,954 6,357 6,096 7,143
78,715 20,176 58,539 6,033 38,553 34,129 26,861 36,7674,956 431 4,525 615 3,490 851 2,077 2,2277,651 786 6,865 894 5,122 1,635 2,941 3,513
11,738 1,210 10,528 2,195 7,333 2,210 4,193 5,6281,745 163 1,582 260 1,170 315 787 758
6,174 830 5,344 821 3,914 1,439 2,525 2,686893 92 801 144 578 171 396 402
2,950 207 2,743 479 2,046 425 1,126 1,3471,468 161 1,307 209 955 304 672 635
784 118 666 50 550 184 362 353
OrleansOswegoOtsegoPutnam
OneidaOnondagaOntario
Orange
MontgomeryNassau
New YorkNiagara
Lewis
LivingstonMadisonMonroe
HamiltonHerkimerJeffersonKings
FranklinFultonGeneseeGreene
DelawareDutchessErie
Essex
ChenangoClinton
ColumbiaCortland
Cattaraugus
CayugaChautauquaChemung
AlbanyAlleganyBronxBroome
Category Age
SSIrecipients
alsoreceiving
OASDICounty
(Continued)
Total
Amount ofpayments
(thousandsof dollars)

66 ♦ SSI Recipients by State and County, 2003
New York
Table 3.Continued
AgedBlind anddisabled Under 18 18–64
65 orolder
72,652 26,305 46,347 5,221 30,033 37,398 19,506 33,6573,231 347 2,884 526 2,077 628 1,328 1,476
11,838 2,378 9,460 1,258 6,762 3,818 3,560 5,7315,049 1,404 3,645 362 2,664 2,023 1,928 2,3212,556 247 2,309 354 1,736 466 1,187 1,116
4,033 384 3,649 592 2,748 693 1,620 1,821682 99 583 70 429 183 362 282421 76 345 58 257 106 190 171727 68 659 120 460 147 322 317
3,749 321 3,428 415 2,617 717 1,446 1,704
2,984 237 2,747 463 1,999 522 1,108 1,36321,207 3,269 17,938 2,056 13,637 5,514 8,671 9,595
2,789 285 2,504 318 1,903 568 1,222 1,261983 83 900 177 647 159 357 434
1,571 174 1,397 192 1,068 311 676 687
4,266 434 3,832 469 2,925 872 1,834 1,8921,582 150 1,432 208 1,094 280 768 6441,438 140 1,298 201 958 279 687 6132,016 165 1,851 303 1,264 449 914 849
15,260 3,364 11,896 1,732 8,395 5,133 5,136 6,806
620 53 567 74 439 107 269 242560 67 493 73 354 133 274 215
578 57 521 45 410 123 268 214
WyomingYates
Unknown
SOURCE: Social Security Administration, Supplemental Security Record (Characteristic Extract Record format), 100 percent data.
WarrenWashingtonWayneWestchester
SullivanTiogaTompkins
Ulster
SenecaSt. Lawrence
SteubenSuffolk
Saratoga
SchnectadySchoharieSchuyler
QueensRensselaerRichmondRockland
County Total
Category Age
SSIrecipients
alsoreceiving
OASDI
Amount ofpayments
(thousandsof dollars)

SSI Recipients by State and County, 2003 ♦ 67
North Carolina
Table 3.Number of recipients in state (by eligibility category, age, and receipt of OASDI benefits)and amount of payments, by county, December 2003
AgedBlind anddisabled Under 18 18–64
65 orolder
Total,North Carolina 194,611 28,241 166,370 33,450 109,308 51,853 83,446 73,628
2,346 358 1,988 419 1,299 628 1,085 877553 105 448 57 317 179 243 221339 82 257 32 166 141 176 103
1,048 151 897 213 551 284 455 403920 209 711 63 459 398 488 299
435 107 328 26 227 182 221 1401,806 314 1,492 269 984 553 897 6551,464 289 1,175 224 726 514 779 5201,848 297 1,551 269 1,043 536 909 6701,895 226 1,669 299 1,182 414 801 743
4,564 618 3,946 492 2,928 1,144 1,983 1,7731,825 232 1,593 243 1,139 443 731 6561,819 213 1,606 399 1,003 417 763 6561,375 172 1,203 220 844 311 561 544
130 29 101 17 81 32 66 44
1,116 156 960 131 699 286 522 426789 157 632 71 429 289 402 286
2,191 320 1,871 349 1,290 552 872 800677 114 563 100 368 209 334 218914 193 721 75 493 346 475 308
543 101 442 86 288 169 259 195301 65 236 27 165 109 157 113
2,681 326 2,355 451 1,628 602 1,120 1,0513,777 532 3,245 616 2,066 1,095 1,798 1,4472,546 359 2,187 444 1,446 656 1,061 944
7,614 692 6,922 1,673 4,524 1,417 2,599 3,136259 39 220 59 146 54 109 108253 26 227 39 167 47 102 102
2,261 237 2,024 437 1,369 455 893 859525 88 437 73 293 159 256 183
1,932 421 1,511 275 970 687 998 6804,539 489 4,050 1,048 2,507 984 1,722 1,8422,940 442 2,498 563 1,533 844 1,289 1,0735,687 596 5,091 1,117 3,308 1,262 2,180 2,2021,487 275 1,212 199 769 519 781 524
County Total
Amount ofpayments
(thousandsof dollars)
Category Age
SSIrecipients
alsoreceiving
OASDI
AlamanceAlexanderAlleghanyAnsonAshe
AveryBeaufortBertieBladenBrunswick
BuncombeBurkeCabarrusCaldwellCamden
CarteretCaswellCatawbaChathamCherokee
ChowanClayClevelandColumbusCraven
CumberlandCurrituckDareDavidsonDavie
DuplinDurhamEdgecombeForsythFranklin
(Continued)
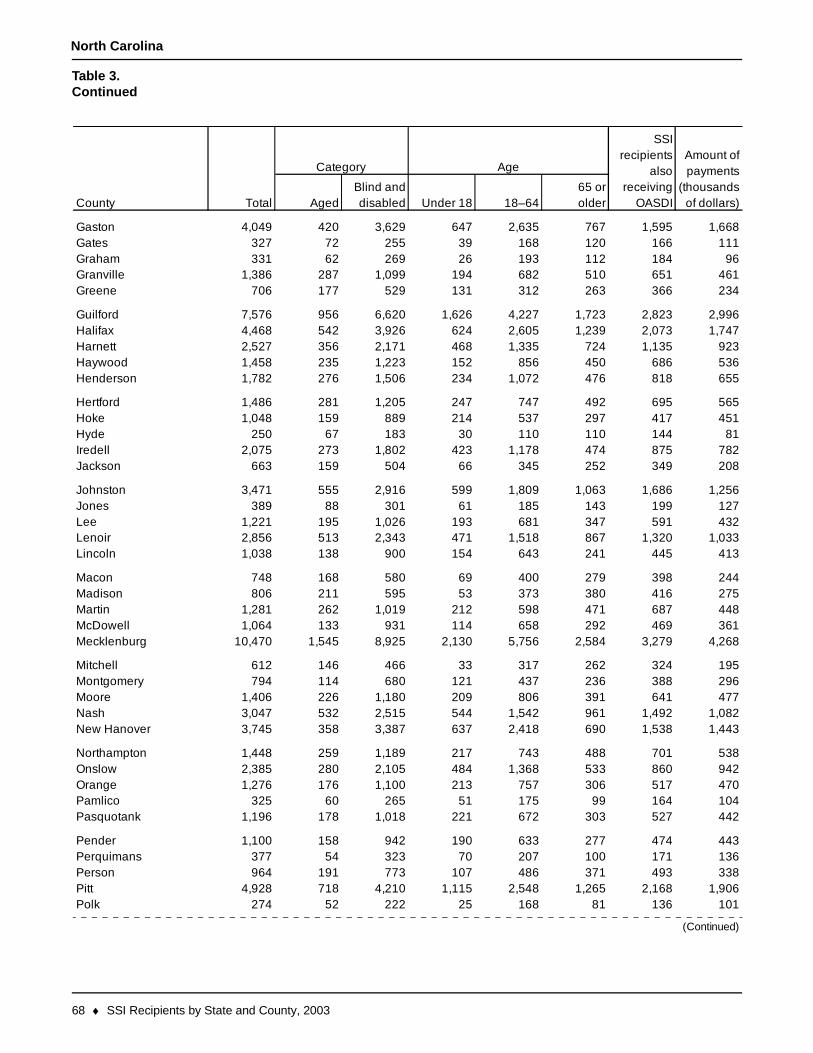
68 ♦ SSI Recipients by State and County, 2003
North Carolina
Table 3.Continued
AgedBlind anddisabled Under 18 18–64
65 orolder
4,049 420 3,629 647 2,635 767 1,595 1,668327 72 255 39 168 120 166 111331 62 269 26 193 112 184 96
1,386 287 1,099 194 682 510 651 461706 177 529 131 312 263 366 234
7,576 956 6,620 1,626 4,227 1,723 2,823 2,9964,468 542 3,926 624 2,605 1,239 2,073 1,7472,527 356 2,171 468 1,335 724 1,135 9231,458 235 1,223 152 856 450 686 5361,782 276 1,506 234 1,072 476 818 655
1,486 281 1,205 247 747 492 695 5651,048 159 889 214 537 297 417 451
250 67 183 30 110 110 144 812,075 273 1,802 423 1,178 474 875 782
663 159 504 66 345 252 349 208
3,471 555 2,916 599 1,809 1,063 1,686 1,256389 88 301 61 185 143 199 127
1,221 195 1,026 193 681 347 591 4322,856 513 2,343 471 1,518 867 1,320 1,0331,038 138 900 154 643 241 445 413
748 168 580 69 400 279 398 244806 211 595 53 373 380 416 275
1,281 262 1,019 212 598 471 687 4481,064 133 931 114 658 292 469 361
10,470 1,545 8,925 2,130 5,756 2,584 3,279 4,268
612 146 466 33 317 262 324 195794 114 680 121 437 236 388 296
1,406 226 1,180 209 806 391 641 4773,047 532 2,515 544 1,542 961 1,492 1,0823,745 358 3,387 637 2,418 690 1,538 1,443
1,448 259 1,189 217 743 488 701 5382,385 280 2,105 484 1,368 533 860 9421,276 176 1,100 213 757 306 517 470
325 60 265 51 175 99 164 1041,196 178 1,018 221 672 303 527 442
1,100 158 942 190 633 277 474 443377 54 323 70 207 100 171 136964 191 773 107 486 371 493 338
4,928 718 4,210 1,115 2,548 1,265 2,168 1,906274 52 222 25 168 81 136 101
Gaston
County Total
Category Age
SSIrecipients
alsoreceiving
OASDI
GatesGrahamGranvilleGreene
GuilfordHalifaxHarnettHaywoodHenderson
HertfordHokeHydeIredellJackson
JohnstonJonesLeeLenoirLincoln
MaconMadisonMartinMcDowellMecklenburg
MitchellMontgomeryMooreNashNew Hanover
NorthamptonOnslowOrange
Polk
PamlicoPasquotank
PenderPerquimans
Amount ofpayments
(thousandsof dollars)
(Continued)
PersonPitt
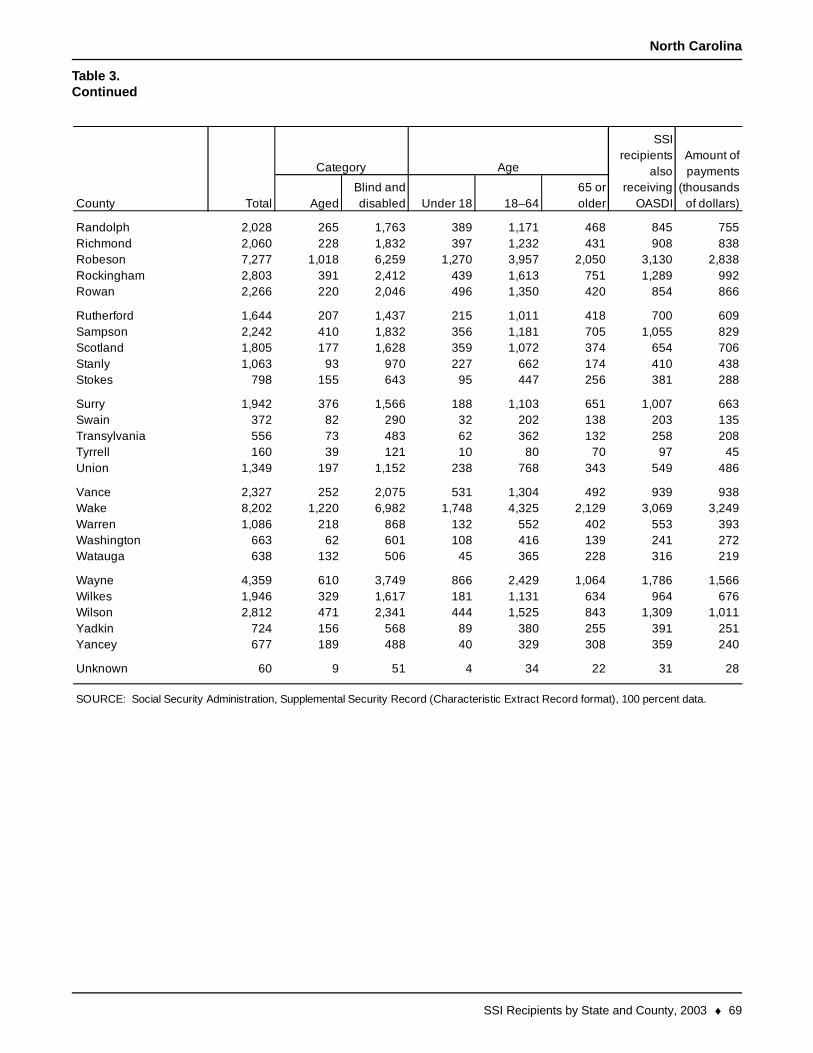
SSI Recipients by State and County, 2003 ♦ 69
North Carolina
Table 3.Continued
AgedBlind anddisabled Under 18 18–64
65 orolder
2,028 265 1,763 389 1,171 468 845 7552,060 228 1,832 397 1,232 431 908 8387,277 1,018 6,259 1,270 3,957 2,050 3,130 2,8382,803 391 2,412 439 1,613 751 1,289 9922,266 220 2,046 496 1,350 420 854 866
1,644 207 1,437 215 1,011 418 700 6092,242 410 1,832 356 1,181 705 1,055 8291,805 177 1,628 359 1,072 374 654 7061,063 93 970 227 662 174 410 438
798 155 643 95 447 256 381 288
1,942 376 1,566 188 1,103 651 1,007 663372 82 290 32 202 138 203 135556 73 483 62 362 132 258 208160 39 121 10 80 70 97 45
1,349 197 1,152 238 768 343 549 486
2,327 252 2,075 531 1,304 492 939 9388,202 1,220 6,982 1,748 4,325 2,129 3,069 3,2491,086 218 868 132 552 402 553 393
663 62 601 108 416 139 241 272638 132 506 45 365 228 316 219
4,359 610 3,749 866 2,429 1,064 1,786 1,5661,946 329 1,617 181 1,131 634 964 6762,812 471 2,341 444 1,525 843 1,309 1,011
724 156 568 89 380 255 391 251677 189 488 40 329 308 359 240
60 9 51 4 34 22 31 28
RandolphRichmondRobesonRockinghamRowan
RutherfordSampsonScotlandStanlyStokes
SurrySwainTransylvania
Wayne
TyrrellUnion
VanceWake
Unknown
SOURCE: Social Security Administration, Supplemental Security Record (Characteristic Extract Record format), 100 percent data.
WilkesWilsonYadkinYancey
WarrenWashingtonWatauga
County Total
Category Age
SSIrecipients
alsoreceiving
OASDI
Amount ofpayments
(thousandsof dollars)

70 ♦ SSI Recipients by State and County, 2003
North Dakota
Table 3.Number of recipients in state (by eligibility category, age, and receipt of OASDI benefits)and amount of payments, by county, December 2003
AgedBlind anddisabled Under 18 18–64
65 orolder
Total, North Dakota 8,101 1,145 6,956 935 5,174 1,992 3,711 2,908
29 4 25 3 19 7 13 9144 24 120 9 103 32 68 39188 17 171 31 110 47 72 78
3 a a a a a a a63 18 45 7 34 22 36 20
34 7 27 2 18 14 16 1117 5 12 2 8 7 10 5
929 95 834 117 641 171 457 3421,264 139 1,125 147 882 235 509 480
38 9 29 3 17 18 21 10
79 29 50 4 34 41 37 2418 3 15 2 7 9 10 540 4 36 3 29 8 13 1833 2 31 a 24 a 18 952 12 40 5 27 20 31 15
28 9 19 2 14 12 22 57 a a a a a a 2
603 55 548 69 447 87 250 21148 21 27 5 16 27 30 1437 12 25 4 14 19 18 12
22 4 18 3 13 6 10 835 15 20 2 13 20 23 845 18 27 a 23 a 20 1530 16 14 0 10 20 22 678 21 57 7 36 35 46 31
42 18 24 a a 27 28 1059 10 49 5 34 20 30 19
116 21 95 9 63 44 54 4262 16 46 3 34 25 33 21
330 40 290 49 201 80 160 114
111 21 90 13 59 39 44 4323 7 16 4 6 13 12 6
9 a a a a a a 472 21 51 2 37 33 49 1845 11 34 a 26 a 28 17
217 32 185 27 133 57 103 6849 15 34 3 25 21 23 1313 a a a a a a 4
125 21 104 12 73 40 59 48647 76 571 113 386 148 240 301
RansomRenvilleRichlandRolette
OliverPembinaPierce
Ramsey
MercerMorton
MountrialNelson
McHenry
McIntoshMcKenzieMcLean
HettingerKidderLa MoureLogan
Golden ValleyGrand ForksGrantGriggs
DunnEddyEmmons
Foster
CassCavalier
DickeyDivide
Bottineau
BowmanBurkeBurleigh
AdamsBarnesBensonBillings
Total
Amount ofpayments
(thousandsof dollars)
Category Age
SSIrecipients
alsoreceiving
OASDICounty
(Continued)
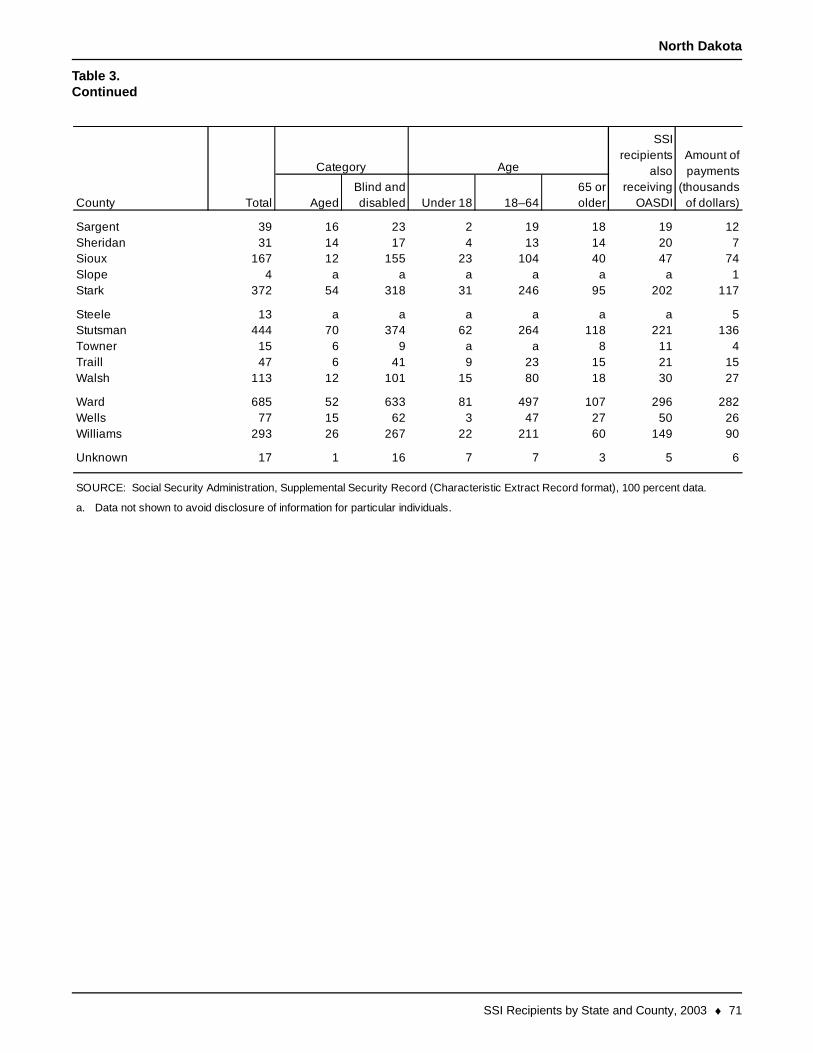
SSI Recipients by State and County, 2003 ♦ 71
North Dakota
Table 3.Continued
AgedBlind anddisabled Under 18 18–64
65 orolder
39 16 23 2 19 18 19 1231 14 17 4 13 14 20 7
167 12 155 23 104 40 47 744 a a a a a a 1
372 54 318 31 246 95 202 117
13 a a a a a a 5444 70 374 62 264 118 221 136
15 6 9 a a 8 11 447 6 41 9 23 15 21 15
113 12 101 15 80 18 30 27
685 52 633 81 497 107 296 28277 15 62 3 47 27 50 26
293 26 267 22 211 60 149 90
17 1 16 7 7 3 5 6
a.
Williams
Unknown
SOURCE: Social Security Administration, Supplemental Security Record (Characteristic Extract Record format), 100 percent data.
Data not shown to avoid disclosure of information for particular individuals.
TraillWalsh
WardWells
Stark
SteeleStutsmanTowner
SargentSheridanSiouxSlope
County Total
Category Age
SSIrecipients
alsoreceiving
OASDI
Amount ofpayments
(thousandsof dollars)

72 ♦ SSI Recipients by State and County, 2003
Ohio
Table 3.Number of recipients in state (by eligibility category, age, and receipt of OASDI benefits)and amount of payments, by county, December 2003
AgedBlind anddisabled Under 18 18–64
65 orolder
Total, Ohio 243,679 15,938 227,741 41,456 165,968 36,255 67,420 106,446
1,610 119 1,491 137 1,125 348 479 6722,466 104 2,362 485 1,705 276 682 1,100
472 35 437 87 324 61 160 1932,402 101 2,301 413 1,718 271 594 1,0002,073 84 1,989 226 1,570 277 546 924
357 18 339 60 249 48 120 1242,050 122 1,928 254 1,511 285 559 915
868 63 805 119 604 145 318 3505,525 304 5,221 885 3,942 698 1,613 2,393
309 17 292 50 214 45 98 139
446 29 417 66 318 62 163 1663,606 160 3,446 625 2,513 468 1,024 1,5282,225 110 2,115 314 1,648 263 665 904
650 47 603 108 443 99 221 2622,681 140 2,541 424 1,966 291 726 1,194
709 32 677 68 537 104 237 277866 32 834 114 652 100 254 406
40,325 4,193 36,132 7,806 24,369 8,150 9,843 18,273621 32 589 118 433 70 197 238658 23 635 127 471 60 185 308
629 71 558 90 429 110 207 2621,245 58 1,187 234 869 142 407 5591,751 109 1,642 242 1,274 235 591 704
706 47 659 93 495 118 213 27923,437 1,767 21,670 4,226 15,372 3,839 5,953 10,326
378 18 360 77 265 36 125 1531,702 99 1,603 188 1,229 285 459 726
438 108 330 58 249 131 185 1591,631 121 1,510 247 1,118 266 490 6681,332 88 1,244 163 965 204 454 554
20,886 1,457 19,429 4,578 13,112 3,196 5,818 9,093749 39 710 137 529 83 260 285538 31 507 70 385 83 162 226406 28 378 49 307 50 101 188286 22 264 48 192 46 98 109
996 69 927 132 679 185 322 427777 50 727 109 546 122 266 324283 26 257 49 183 51 69 101878 44 834 169 599 110 284 365
1,462 73 1,389 143 1,058 261 436 628Jackson
HighlandHockingHolmesHuron
HancockHardinHarrisonHenry
GeaugaGreeneGuernsey
Hamilton
FayetteFranklin
FultonGallia
Defiance
DelawareErieFairfield
CoshoctonCrawfordCuyahogaDarke
ClarkClermontClintonColumbiana
BrownButlerCarroll
Champaign
AshtabulaAthens
AuglaizeBelmont
County
AdamsAllenAshland
Total
Amount ofpayments
(thousandsof dollars)
Category Age
SSIrecipients
alsoreceiving
OASDI
(Continued)
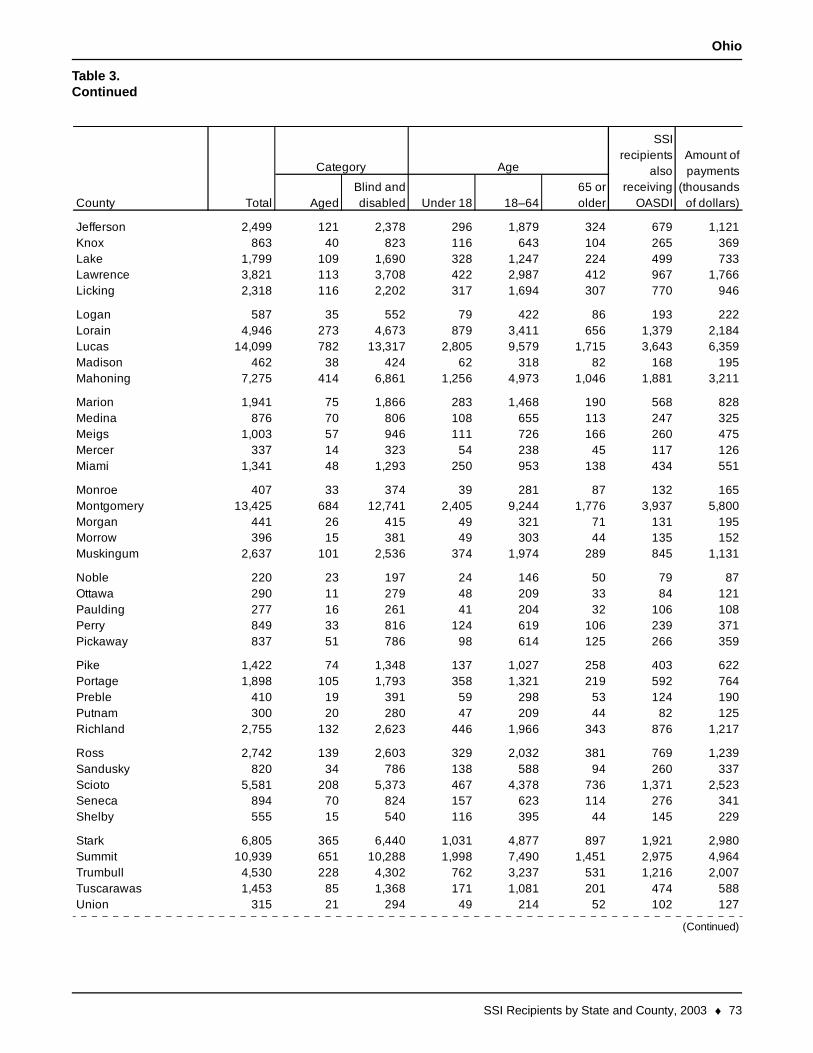
SSI Recipients by State and County, 2003 ♦ 73
Ohio
Table 3.Continued
AgedBlind anddisabled Under 18 18–64
65 orolder
2,499 121 2,378 296 1,879 324 679 1,121863 40 823 116 643 104 265 369
1,799 109 1,690 328 1,247 224 499 7333,821 113 3,708 422 2,987 412 967 1,7662,318 116 2,202 317 1,694 307 770 946
587 35 552 79 422 86 193 2224,946 273 4,673 879 3,411 656 1,379 2,184
14,099 782 13,317 2,805 9,579 1,715 3,643 6,359462 38 424 62 318 82 168 195
7,275 414 6,861 1,256 4,973 1,046 1,881 3,211
1,941 75 1,866 283 1,468 190 568 828876 70 806 108 655 113 247 325
1,003 57 946 111 726 166 260 475337 14 323 54 238 45 117 126
1,341 48 1,293 250 953 138 434 551
407 33 374 39 281 87 132 16513,425 684 12,741 2,405 9,244 1,776 3,937 5,800
441 26 415 49 321 71 131 195396 15 381 49 303 44 135 152
2,637 101 2,536 374 1,974 289 845 1,131
220 23 197 24 146 50 79 87290 11 279 48 209 33 84 121277 16 261 41 204 32 106 108849 33 816 124 619 106 239 371837 51 786 98 614 125 266 359
1,422 74 1,348 137 1,027 258 403 6221,898 105 1,793 358 1,321 219 592 764
410 19 391 59 298 53 124 190300 20 280 47 209 44 82 125
2,755 132 2,623 446 1,966 343 876 1,217
2,742 139 2,603 329 2,032 381 769 1,239820 34 786 138 588 94 260 337
5,581 208 5,373 467 4,378 736 1,371 2,523894 70 824 157 623 114 276 341555 15 540 116 395 44 145 229
6,805 365 6,440 1,031 4,877 897 1,921 2,98010,939 651 10,288 1,998 7,490 1,451 2,975 4,964
4,530 228 4,302 762 3,237 531 1,216 2,0071,453 85 1,368 171 1,081 201 474 588
315 21 294 49 214 52 102 127
SummitTrumbullTuscarawasUnion
(Continued)
SciotoSenecaShelby
Stark
PutnamRichland
RossSandusky
Pickaway
PikePortagePreble
NobleOttawaPauldingPerry
MontgomeryMorganMorrowMuskingum
MeigsMercerMiami
Monroe
MadisonMahoning
MarionMedina
Licking
LoganLorainLucas
JeffersonKnoxLake
County Total
Category Age
SSIrecipients
alsoreceiving
OASDI
Amount ofpayments
(thousandsof dollars)
Lawrence

74 ♦ SSI Recipients by State and County, 2003
Ohio
Table 3.Continued
AgedBlind anddisabled Under 18 18–64
65 orolder
310 23 287 42 227 41 111 113470 26 444 58 337 75 143 191
1,167 56 1,111 162 850 155 386 4341,694 93 1,601 221 1,214 259 554 6891,420 81 1,339 178 1,071 171 468 641
403 13 390 72 293 38 114 166956 57 899 193 648 115 295 381234 23 211 33 158 43 87 84
231 12 219 27 159 45 68 94Unknown
SOURCE: Social Security Administration, Supplemental Security Record (Characteristic Extract Record format), 100 percent data.
Wayne
WilliamsWoodWyandot
Van WertVintonWarrenWashington
County Total
Category Age
SSIrecipients
alsoreceiving
OASDI
Amount ofpayments
(thousandsof dollars)
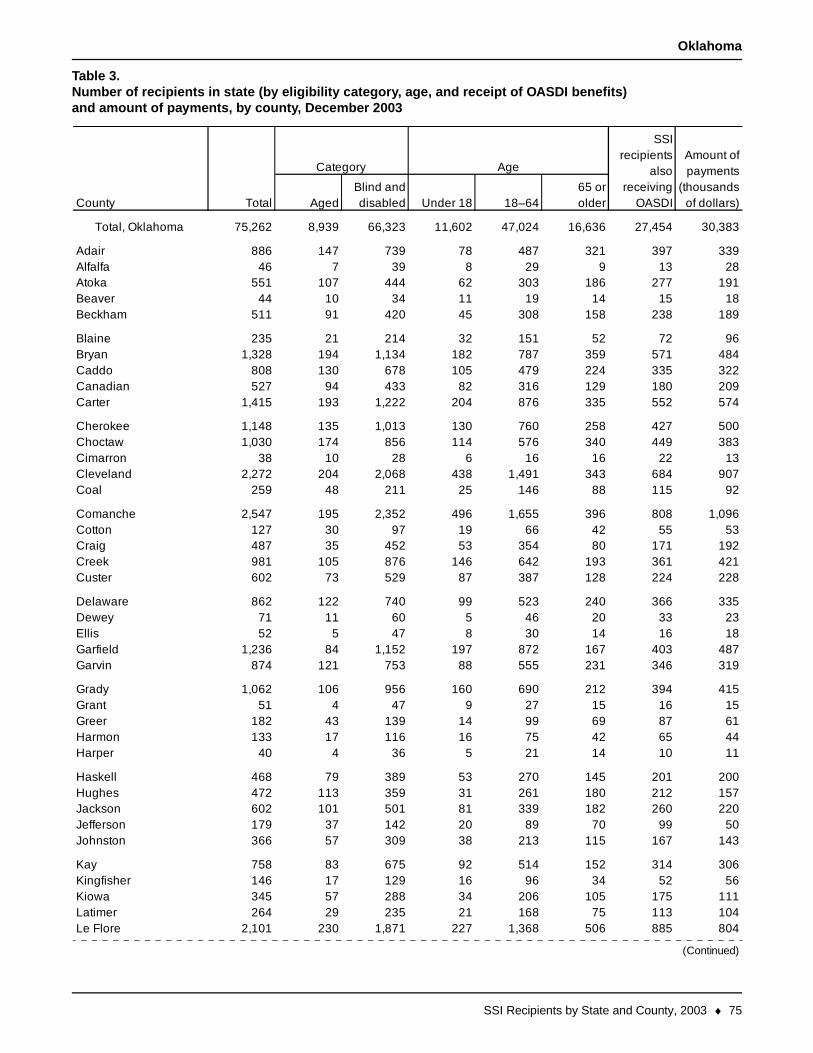
SSI Recipients by State and County, 2003 ♦ 75
Oklahoma
Table 3.Number of recipients in state (by eligibility category, age, and receipt of OASDI benefits)and amount of payments, by county, December 2003
AgedBlind anddisabled Under 18 18–64
65 orolder
Total, Oklahoma 75,262 8,939 66,323 11,602 47,024 16,636 27,454 30,383
886 147 739 78 487 321 397 33946 7 39 8 29 9 13 28
551 107 444 62 303 186 277 19144 10 34 11 19 14 15 18
511 91 420 45 308 158 238 189
235 21 214 32 151 52 72 961,328 194 1,134 182 787 359 571 484
808 130 678 105 479 224 335 322527 94 433 82 316 129 180 209
1,415 193 1,222 204 876 335 552 574
1,148 135 1,013 130 760 258 427 5001,030 174 856 114 576 340 449 383
38 10 28 6 16 16 22 132,272 204 2,068 438 1,491 343 684 907
259 48 211 25 146 88 115 92
2,547 195 2,352 496 1,655 396 808 1,096127 30 97 19 66 42 55 53487 35 452 53 354 80 171 192981 105 876 146 642 193 361 421602 73 529 87 387 128 224 228
862 122 740 99 523 240 366 33571 11 60 5 46 20 33 2352 5 47 8 30 14 16 18
1,236 84 1,152 197 872 167 403 487874 121 753 88 555 231 346 319
1,062 106 956 160 690 212 394 41551 4 47 9 27 15 16 15
182 43 139 14 99 69 87 61133 17 116 16 75 42 65 44
40 4 36 5 21 14 10 11
468 79 389 53 270 145 201 200472 113 359 31 261 180 212 157602 101 501 81 339 182 260 220179 37 142 20 89 70 99 50366 57 309 38 213 115 167 143
758 83 675 92 514 152 314 306146 17 129 16 96 34 52 56345 57 288 34 206 105 175 111264 29 235 21 168 75 113 104
2,101 230 1,871 227 1,368 506 885 804Le Flore
(Continued)
KayKingfisherKiowaLatimer
HughesJacksonJeffersonJohnston
GreerHarmonHarper
Haskell
GarfieldGarvin
GradyGrant
Custer
DelawareDeweyEllis
ComancheCottonCraigCreek
ChoctawCimarronClevelandCoal
CaddoCanadianCarter
Cherokee
BeaverBeckham
BlaineBryan
County
AdairAlfalfaAtoka
Total
Amount ofpayments
(thousandsof dollars)
Category Age
SSIrecipients
alsoreceiving
OASDI
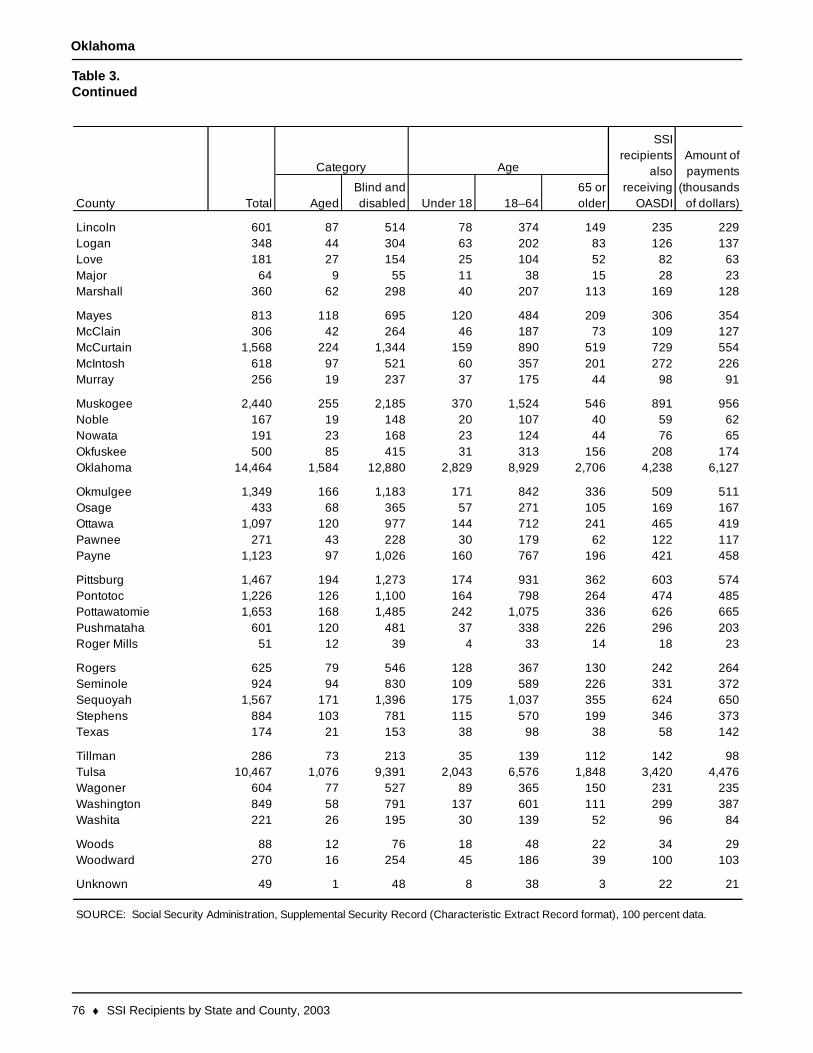
76 ♦ SSI Recipients by State and County, 2003
Oklahoma
Table 3.Continued
AgedBlind anddisabled Under 18 18–64
65 orolder
601 87 514 78 374 149 235 229348 44 304 63 202 83 126 137181 27 154 25 104 52 82 63
64 9 55 11 38 15 28 23360 62 298 40 207 113 169 128
813 118 695 120 484 209 306 354306 42 264 46 187 73 109 127
1,568 224 1,344 159 890 519 729 554618 97 521 60 357 201 272 226256 19 237 37 175 44 98 91
2,440 255 2,185 370 1,524 546 891 956167 19 148 20 107 40 59 62191 23 168 23 124 44 76 65500 85 415 31 313 156 208 174
14,464 1,584 12,880 2,829 8,929 2,706 4,238 6,127
1,349 166 1,183 171 842 336 509 511433 68 365 57 271 105 169 167
1,097 120 977 144 712 241 465 419271 43 228 30 179 62 122 117
1,123 97 1,026 160 767 196 421 458
1,467 194 1,273 174 931 362 603 5741,226 126 1,100 164 798 264 474 4851,653 168 1,485 242 1,075 336 626 665
601 120 481 37 338 226 296 20351 12 39 4 33 14 18 23
625 79 546 128 367 130 242 264924 94 830 109 589 226 331 372
1,567 171 1,396 175 1,037 355 624 650884 103 781 115 570 199 346 373174 21 153 38 98 38 58 142
286 73 213 35 139 112 142 9810,467 1,076 9,391 2,043 6,576 1,848 3,420 4,476
604 77 527 89 365 150 231 235849 58 791 137 601 111 299 387221 26 195 30 139 52 96 84
88 12 76 18 48 22 34 29270 16 254 45 186 39 100 103
49 1 48 8 38 3 22 21
Woodward
Unknown
SOURCE: Social Security Administration, Supplemental Security Record (Characteristic Extract Record format), 100 percent data.
WagonerWashingtonWashita
Woods
StephensTexas
Pushmataha
TillmanTulsa
Roger Mills
RogersSeminoleSequoyah
Payne
PittsburgPontotocPottawatomie
OkmulgeeOsageOttawaPawnee
NobleNowataOkfuskeeOklahoma
McCurtainMcIntoshMurray
Muskogee
MajorMarshall
MayesMcClain
LincolnLoganLove
County Total
Category Age
SSIrecipients
alsoreceiving
OASDI
Amount ofpayments
(thousandsof dollars)
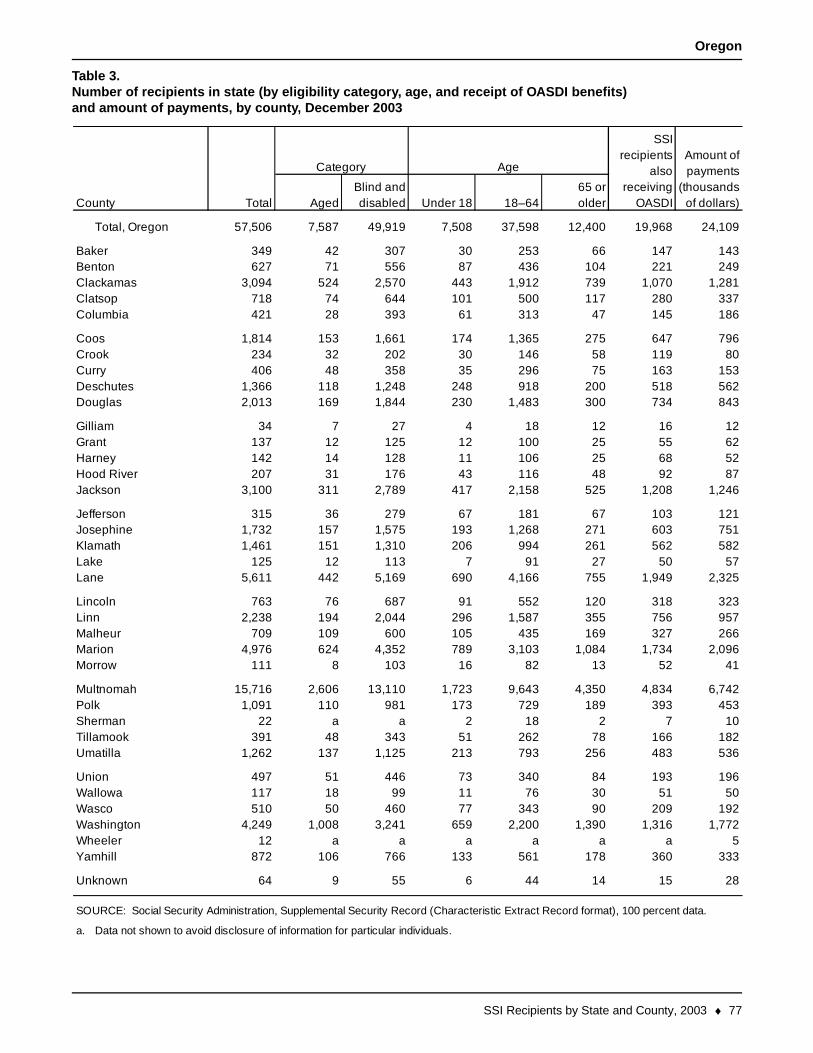
SSI Recipients by State and County, 2003 ♦ 77
Oregon
Table 3.Number of recipients in state (by eligibility category, age, and receipt of OASDI benefits)and amount of payments, by county, December 2003
AgedBlind anddisabled Under 18 18–64
65 orolder
Total, Oregon 57,506 7,587 49,919 7,508 37,598 12,400 19,968 24,109
349 42 307 30 253 66 147 143627 71 556 87 436 104 221 249
3,094 524 2,570 443 1,912 739 1,070 1,281718 74 644 101 500 117 280 337421 28 393 61 313 47 145 186
1,814 153 1,661 174 1,365 275 647 796234 32 202 30 146 58 119 80406 48 358 35 296 75 163 153
1,366 118 1,248 248 918 200 518 5622,013 169 1,844 230 1,483 300 734 843
34 7 27 4 18 12 16 12137 12 125 12 100 25 55 62142 14 128 11 106 25 68 52207 31 176 43 116 48 92 87
3,100 311 2,789 417 2,158 525 1,208 1,246
315 36 279 67 181 67 103 1211,732 157 1,575 193 1,268 271 603 7511,461 151 1,310 206 994 261 562 582
125 12 113 7 91 27 50 575,611 442 5,169 690 4,166 755 1,949 2,325
763 76 687 91 552 120 318 3232,238 194 2,044 296 1,587 355 756 957
709 109 600 105 435 169 327 2664,976 624 4,352 789 3,103 1,084 1,734 2,096
111 8 103 16 82 13 52 41
15,716 2,606 13,110 1,723 9,643 4,350 4,834 6,7421,091 110 981 173 729 189 393 453
22 a a 2 18 2 7 10391 48 343 51 262 78 166 182
1,262 137 1,125 213 793 256 483 536
497 51 446 73 340 84 193 196117 18 99 11 76 30 51 50510 50 460 77 343 90 209 192
4,249 1,008 3,241 659 2,200 1,390 1,316 1,77212 a a a a a a 5
872 106 766 133 561 178 360 333
64 9 55 6 44 14 15 28
a.
County Total
Amount ofpayments
(thousandsof dollars)
Category Age
SSIrecipients
alsoreceiving
OASDI
BakerBentonClackamasClatsopColumbia
CoosCrookCurryDeschutesDouglas
GilliamGrantHarneyHood RiverJackson
JeffersonJosephineKlamathLakeLane
LincolnLinnMalheurMarion
UnionWallowa
Morrow
MultnomahPolkSherman
Unknown
SOURCE: Social Security Administration, Supplemental Security Record (Characteristic Extract Record format), 100 percent data.
Data not shown to avoid disclosure of information for particular individuals.
WascoWashingtonWheelerYamhill
TillamookUmatilla
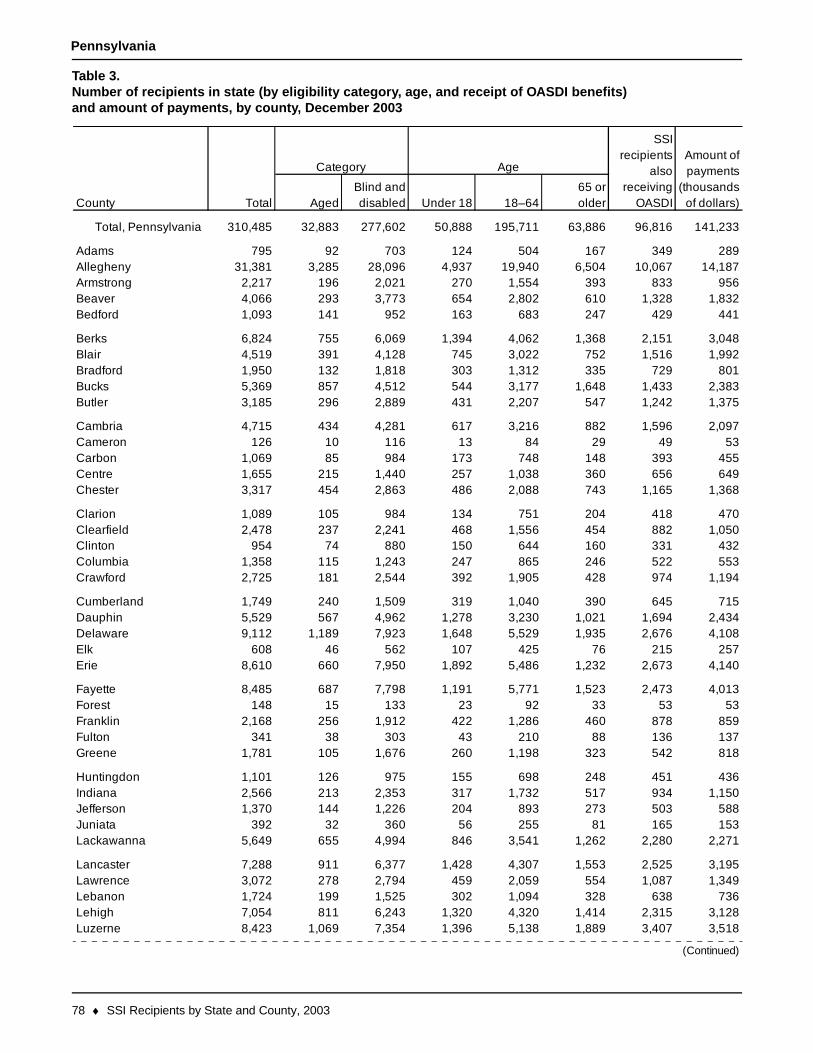
78 ♦ SSI Recipients by State and County, 2003
Pennsylvania
Table 3.Number of recipients in state (by eligibility category, age, and receipt of OASDI benefits)and amount of payments, by county, December 2003
AgedBlind anddisabled Under 18 18–64
65 orolder
Total, Pennsylvania 310,485 32,883 277,602 50,888 195,711 63,886 96,816 141,233
795 92 703 124 504 167 349 28931,381 3,285 28,096 4,937 19,940 6,504 10,067 14,187
2,217 196 2,021 270 1,554 393 833 9564,066 293 3,773 654 2,802 610 1,328 1,8321,093 141 952 163 683 247 429 441
6,824 755 6,069 1,394 4,062 1,368 2,151 3,0484,519 391 4,128 745 3,022 752 1,516 1,9921,950 132 1,818 303 1,312 335 729 8015,369 857 4,512 544 3,177 1,648 1,433 2,3833,185 296 2,889 431 2,207 547 1,242 1,375
4,715 434 4,281 617 3,216 882 1,596 2,097126 10 116 13 84 29 49 53
1,069 85 984 173 748 148 393 4551,655 215 1,440 257 1,038 360 656 6493,317 454 2,863 486 2,088 743 1,165 1,368
1,089 105 984 134 751 204 418 4702,478 237 2,241 468 1,556 454 882 1,050
954 74 880 150 644 160 331 4321,358 115 1,243 247 865 246 522 5532,725 181 2,544 392 1,905 428 974 1,194
1,749 240 1,509 319 1,040 390 645 7155,529 567 4,962 1,278 3,230 1,021 1,694 2,4349,112 1,189 7,923 1,648 5,529 1,935 2,676 4,108
608 46 562 107 425 76 215 2578,610 660 7,950 1,892 5,486 1,232 2,673 4,140
8,485 687 7,798 1,191 5,771 1,523 2,473 4,013148 15 133 23 92 33 53 53
2,168 256 1,912 422 1,286 460 878 859341 38 303 43 210 88 136 137
1,781 105 1,676 260 1,198 323 542 818
1,101 126 975 155 698 248 451 4362,566 213 2,353 317 1,732 517 934 1,1501,370 144 1,226 204 893 273 503 588
392 32 360 56 255 81 165 1535,649 655 4,994 846 3,541 1,262 2,280 2,271
7,288 911 6,377 1,428 4,307 1,553 2,525 3,1953,072 278 2,794 459 2,059 554 1,087 1,3491,724 199 1,525 302 1,094 328 638 7367,054 811 6,243 1,320 4,320 1,414 2,315 3,1288,423 1,069 7,354 1,396 5,138 1,889 3,407 3,518Luzerne
(Continued)
LancasterLawrenceLebanonLehigh
IndianaJeffersonJuniataLackawanna
FranklinFultonGreene
Huntingdon
ElkErie
FayetteForest
Crawford
CumberlandDauphinDelaware
ClarionClearfieldClintonColumbia
CameronCarbonCentreChester
BradfordBucksButler
Cambria
BeaverBedford
BerksBlair
County
AdamsAlleghenyArmstrong
Total
Amount ofpayments
(thousandsof dollars)
Category Age
SSIrecipients
alsoreceiving
OASDI

SSI Recipients by State and County, 2003 ♦ 79
Pennsylvania
Table 3.Continued
AgedBlind anddisabled Under 18 18–64
65 orolder
3,232 173 3,059 653 2,159 420 1,106 1,4231,552 89 1,463 250 1,085 217 516 7013,782 185 3,597 771 2,551 460 1,203 1,7431,363 104 1,259 188 915 260 478 5622,058 210 1,848 463 1,272 323 689 907
6,756 1,137 5,619 920 4,084 1,752 2,112 2,829467 120 347 74 249 144 223 179
4,363 472 3,891 711 2,770 882 1,651 1,8072,581 267 2,314 379 1,698 504 1,099 1,050
555 42 513 100 360 95 198 237
91,882 10,220 81,662 14,940 55,918 21,024 21,547 45,477574 50 524 121 376 77 187 248499 75 424 79 284 136 191 206
3,166 332 2,834 416 2,119 631 1,222 1,346502 47 455 82 320 100 185 179
2,250 247 2,003 311 1,406 533 929 927117 15 102 10 78 29 51 44893 126 767 139 555 199 355 419
1,207 141 1,066 147 790 270 481 526491 56 435 91 312 88 193 202
2,094 118 1,976 308 1,521 265 768 978875 61 814 204 547 124 319 379
5,404 482 4,922 735 3,645 1,024 1,883 2,387884 104 780 125 574 185 365 401
8,010 784 7,226 1,076 5,382 1,552 2,952 3,456
531 73 458 77 337 117 226 2216,037 528 5,509 1,318 3,740 979 2,238 2,585
305 36 269 32 202 71 96 130
Wayne
Union
SOURCE: Social Security Administration, Supplemental Security Record (Characteristic Extract Record format), 100 percent data.
Westmoreland
WyomingYork
Unknown
VenangoWarrenWashington
SomersetSullivanSusquehannaTioga
PikePotterSchuylkillSnyder
NorthamptonNorthumberlandPerry
Philadelphia
MifflinMonroe
MontgomeryMontour
LycomingMcKeanMercer
County Total
Category Age
SSIrecipients
alsoreceiving
OASDI
Amount ofpayments
(thousandsof dollars)
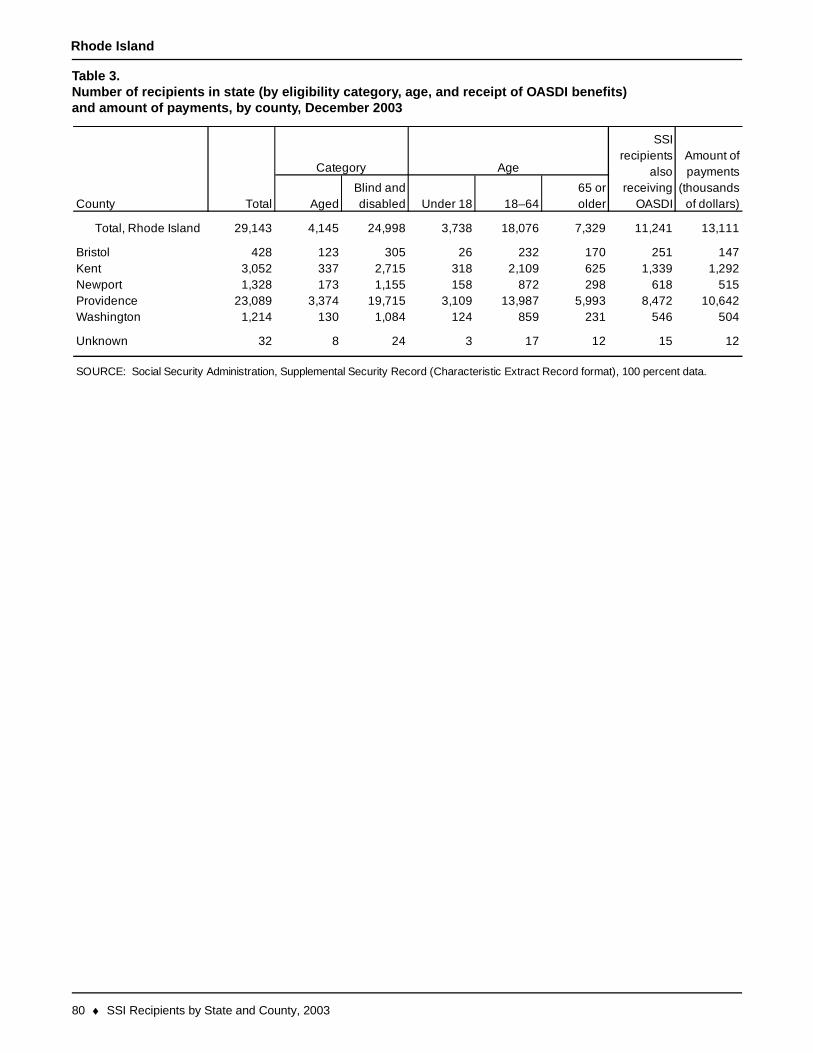
80 ♦ SSI Recipients by State and County, 2003
Rhode Island
Table 3.Number of recipients in state (by eligibility category, age, and receipt of OASDI benefits)and amount of payments, by county, December 2003
AgedBlind anddisabled Under 18 18–64
65 orolder
Total, Rhode Island 29,143 4,145 24,998 3,738 18,076 7,329 11,241 13,111
428 123 305 26 232 170 251 1473,052 337 2,715 318 2,109 625 1,339 1,2921,328 173 1,155 158 872 298 618 515
23,089 3,374 19,715 3,109 13,987 5,993 8,472 10,6421,214 130 1,084 124 859 231 546 504
32 8 24 3 17 12 15 12
Amount ofpayments
(thousandsof dollars)
Category Age
SSIrecipients
alsoreceiving
OASDI
Washington
Unknown
SOURCE: Social Security Administration, Supplemental Security Record (Characteristic Extract Record format), 100 percent data.
BristolKentNewportProvidence
TotalCounty
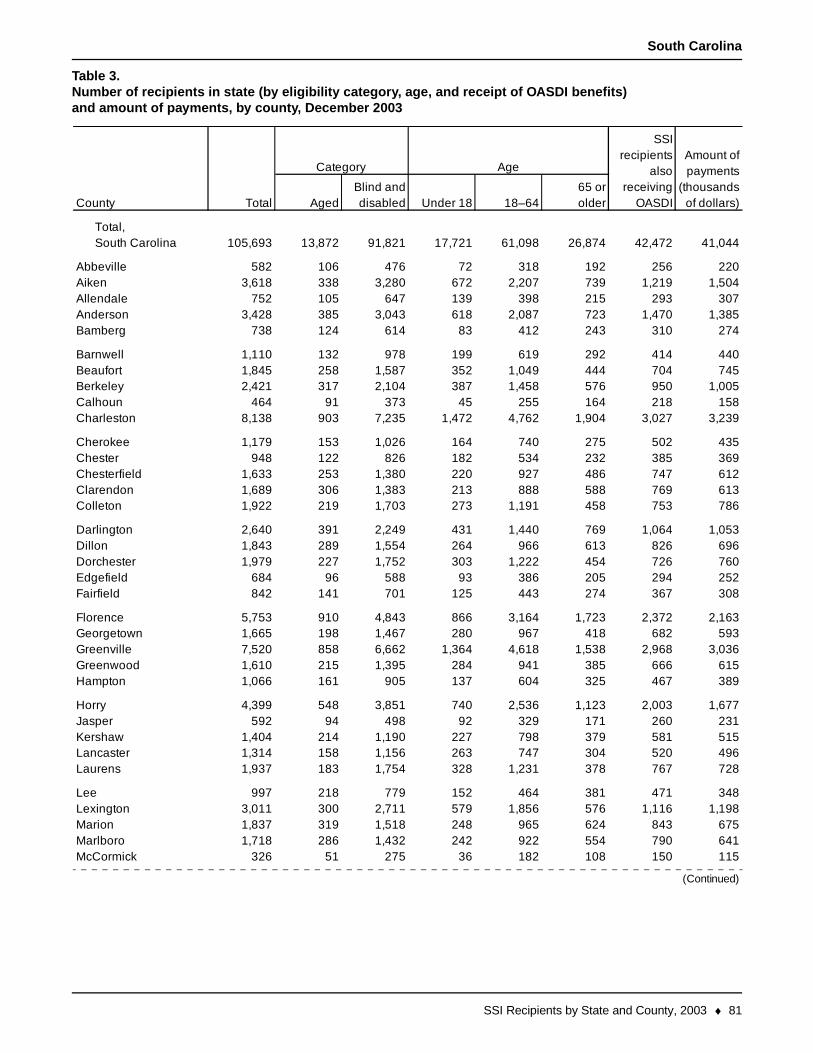
SSI Recipients by State and County, 2003 ♦ 81
South Carolina
Table 3.Number of recipients in state (by eligibility category, age, and receipt of OASDI benefits)and amount of payments, by county, December 2003
AgedBlind anddisabled Under 18 18–64
65 orolder
Total,South Carolina 105,693 13,872 91,821 17,721 61,098 26,874 42,472 41,044
582 106 476 72 318 192 256 2203,618 338 3,280 672 2,207 739 1,219 1,504
752 105 647 139 398 215 293 3073,428 385 3,043 618 2,087 723 1,470 1,385
738 124 614 83 412 243 310 274
1,110 132 978 199 619 292 414 4401,845 258 1,587 352 1,049 444 704 7452,421 317 2,104 387 1,458 576 950 1,005
464 91 373 45 255 164 218 1588,138 903 7,235 1,472 4,762 1,904 3,027 3,239
1,179 153 1,026 164 740 275 502 435948 122 826 182 534 232 385 369
1,633 253 1,380 220 927 486 747 6121,689 306 1,383 213 888 588 769 6131,922 219 1,703 273 1,191 458 753 786
2,640 391 2,249 431 1,440 769 1,064 1,0531,843 289 1,554 264 966 613 826 6961,979 227 1,752 303 1,222 454 726 760
684 96 588 93 386 205 294 252842 141 701 125 443 274 367 308
5,753 910 4,843 866 3,164 1,723 2,372 2,1631,665 198 1,467 280 967 418 682 5937,520 858 6,662 1,364 4,618 1,538 2,968 3,0361,610 215 1,395 284 941 385 666 6151,066 161 905 137 604 325 467 389
4,399 548 3,851 740 2,536 1,123 2,003 1,677592 94 498 92 329 171 260 231
1,404 214 1,190 227 798 379 581 5151,314 158 1,156 263 747 304 520 4961,937 183 1,754 328 1,231 378 767 728
997 218 779 152 464 381 471 3483,011 300 2,711 579 1,856 576 1,116 1,1981,837 319 1,518 248 965 624 843 6751,718 286 1,432 242 922 554 790 641
326 51 275 36 182 108 150 115
Total
Amount ofpayments
(thousandsof dollars)
Category Age
SSIrecipients
alsoreceiving
OASDICounty
AbbevilleAikenAllendaleAndersonBamberg
BarnwellBeaufortBerkeleyCalhounCharleston
CherokeeChesterChesterfieldClarendonColleton
DarlingtonDillonDorchesterEdgefieldFairfield
FlorenceGeorgetownGreenvilleGreenwoodHampton
HorryJasperKershawLancasterLaurens
LeeLexingtonMarionMarlboroMcCormick
(Continued)
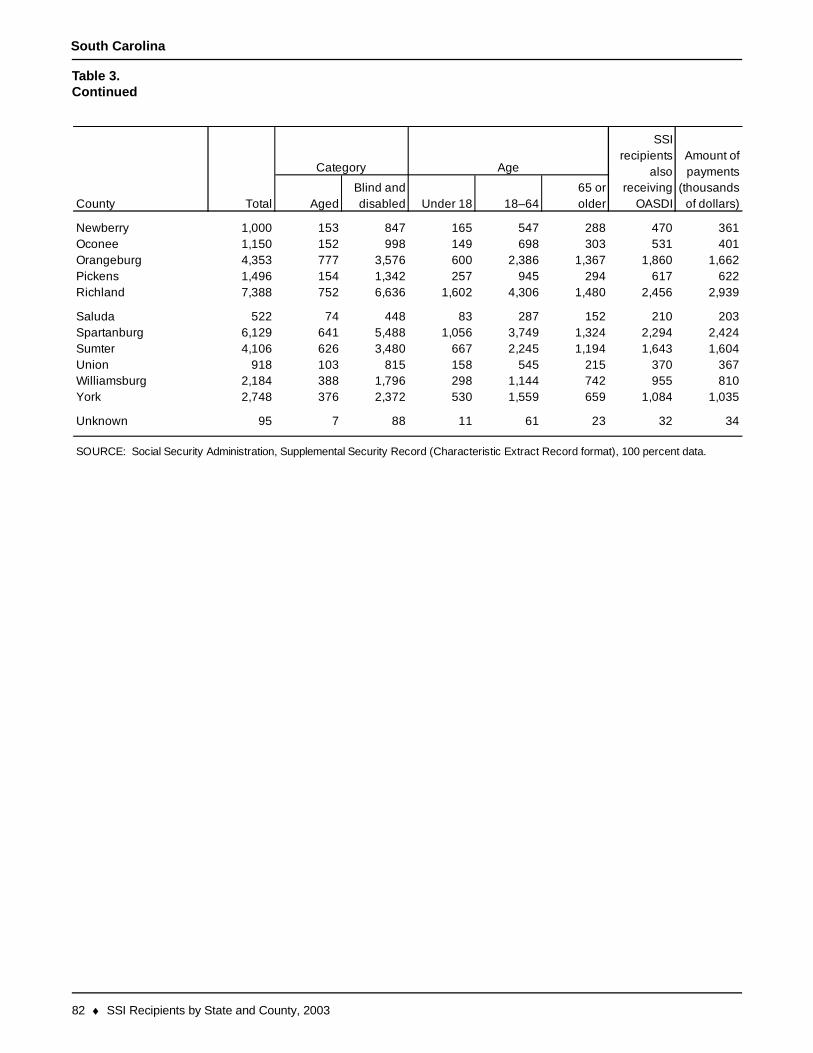
82 ♦ SSI Recipients by State and County, 2003
South Carolina
Table 3.Continued
AgedBlind anddisabled Under 18 18–64
65 orolder
1,000 153 847 165 547 288 470 3611,150 152 998 149 698 303 531 4014,353 777 3,576 600 2,386 1,367 1,860 1,6621,496 154 1,342 257 945 294 617 6227,388 752 6,636 1,602 4,306 1,480 2,456 2,939
522 74 448 83 287 152 210 2036,129 641 5,488 1,056 3,749 1,324 2,294 2,4244,106 626 3,480 667 2,245 1,194 1,643 1,604
918 103 815 158 545 215 370 3672,184 388 1,796 298 1,144 742 955 8102,748 376 2,372 530 1,559 659 1,084 1,035
95 7 88 11 61 23 32 34
Newberry
County Total
Category Age
SSIrecipients
alsoreceiving
OASDI
SOURCE: Social Security Administration, Supplemental Security Record (Characteristic Extract Record format), 100 percent data.
SaludaSpartanburgSumterUnion
Amount ofpayments
(thousandsof dollars)
WilliamsburgYork
Unknown
OconeeOrangeburgPickensRichland

SSI Recipients by State and County, 2003 ♦ 83
South Dakota
Table 3.Number of recipients in state (by eligibility category, age, and receipt of OASDI benefits)and amount of payments, by county, December 2003
AgedBlind anddisabled Under 18 18–64
65 orolder
Total, South Dakota 12,574 1,777 10,797 1,885 7,495 3,194 5,253 4,632
30 20 10 a a 21 22 7360 51 309 53 220 87 165 118145 7 138 27 96 22 48 59
73 23 50 8 34 31 41 20219 26 193 30 144 45 116 76
519 83 436 57 341 121 263 16789 13 76 18 54 17 42 2791 9 82 9 59 23 37 34
164 26 138 21 105 38 77 6824 10 14 2 9 13 15 8
256 64 192 28 130 98 106 8777 32 45 8 28 41 32 22
115 9 106 11 81 23 56 44368 42 326 41 255 72 213 118223 35 188 32 131 60 62 94
107 11 96 25 58 24 44 43365 76 289 44 205 116 202 108110 32 78 12 49 49 61 39
56 24 32 5 24 27 36 14311 31 280 65 173 73 97 136
56 31 25 3 22 31 27 1438 21 17 3 9 26 23 8
189 16 173 16 129 44 93 6842 25 17 3 12 27 8 1385 30 55 6 40 39 51 27
114 32 82 16 46 52 64 3918 2 16 0 13 5 11 849 19 30 10 14 25 20 1451 27 24 5 17 29 22 1325 11 14 4 9 12 10 7
7 a a a a a a 1261 25 236 48 168 45 94 91
82 36 46 6 33 43 37 2428 5 23 3 13 12 11 929 5 24 8 13 8 9 19
39 11 28 4 18 17 14 127 a a a a a a 2
71 31 40 11 20 40 36 19132 30 102 7 77 48 82 41291 20 271 29 204 58 139 99
County Total
Amount ofpayments
(thousandsof dollars)
Category Age
SSIrecipients
alsoreceiving
OASDI
AuroraBeadleBennettBon HommeBrookings
BrownBruleBuffaloButteCampbell
Charles MixClarkClayCodingtonCorson
CusterDavisonDayDeuelDewey
DouglasEdmundsFall RiverFaulkGrant
GregoryHaakonHamlinHandHanson
HardingHughesHutchinsonHydeJackson
JerauldJonesKingsburyLakeLawrence
(Continued)

84 ♦ SSI Recipients by State and County, 2003
South Dakota
Table 3.Continued
AgedBlind anddisabled Under 18 18–64
65 orolder
85 21 64 22 38 25 32 2870 5 65 12 44 14 16 3048 14 34 5 23 20 22 1763 20 43 9 21 33 33 1536 16 20 2 9 25 16 10
250 25 225 36 166 48 102 97104 8 96 11 51 42 34 41
29 7 22 3 14 12 10 102,014 195 1,819 349 1,306 359 788 758
55 18 37 11 18 26 30 21
1,622 105 1,517 255 1,122 245 671 63869 13 56 3 40 26 38 2328 6 22 7 12 9 17 10
227 56 171 27 109 91 98 9042 14 28 5 20 17 24 11
969 51 918 188 557 224 242 462159 34 125 31 84 44 48 33
8 a a a a a a 26 a a a a a a 1
486 30 456 105 261 120 135 215
134 21 113 16 77 41 73 4776 19 57 7 41 28 47 1988 18 70 18 46 24 42 27
119 23 96 8 62 49 44 4074 6 68 15 45 14 12 35
301 35 266 34 205 62 155 9488 9 79 23 39 26 24 38
8 1 7 0 7 1 1 4
a.
LincolnLymanMarshallMcCookMcPherson
MeadeMelletteMinerMinnehahaMoody
PenningtonPerkinsPotterRobertsSanborn
Shannon
Walworth
SpinkStanleySullyTodd
SOURCE: Social Security Administration, Supplemental Security Record (Characteristic Extract Record format), 100 percent data.
Data not shown to avoid disclosure of information for particular individuals.
Washabaugh
YanktonZiebach
Unknown
TrippTurnerUnion
County Total
Category Age
SSIrecipients
alsoreceiving
OASDI
Amount ofpayments
(thousandsof dollars)
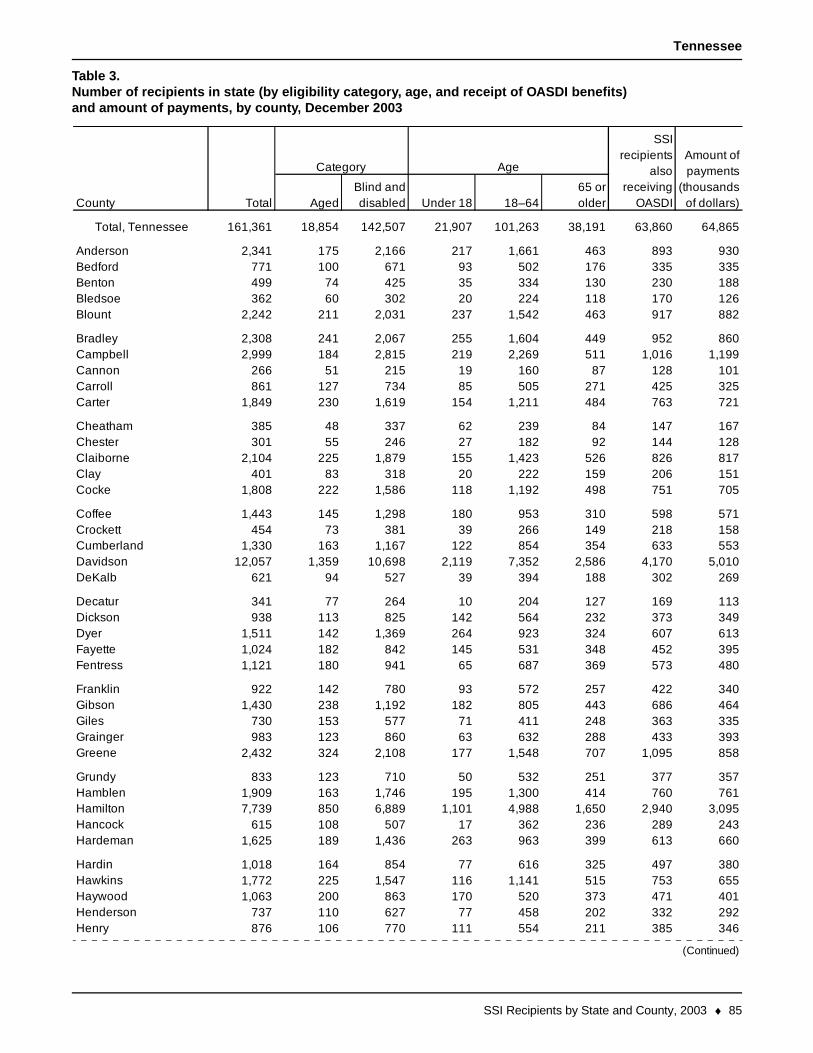
SSI Recipients by State and County, 2003 ♦ 85
Tennessee
Table 3.Number of recipients in state (by eligibility category, age, and receipt of OASDI benefits)and amount of payments, by county, December 2003
AgedBlind anddisabled Under 18 18–64
65 orolder
Total, Tennessee 161,361 18,854 142,507 21,907 101,263 38,191 63,860 64,865
2,341 175 2,166 217 1,661 463 893 930771 100 671 93 502 176 335 335499 74 425 35 334 130 230 188362 60 302 20 224 118 170 126
2,242 211 2,031 237 1,542 463 917 882
2,308 241 2,067 255 1,604 449 952 8602,999 184 2,815 219 2,269 511 1,016 1,199
266 51 215 19 160 87 128 101861 127 734 85 505 271 425 325
1,849 230 1,619 154 1,211 484 763 721
385 48 337 62 239 84 147 167301 55 246 27 182 92 144 128
2,104 225 1,879 155 1,423 526 826 817401 83 318 20 222 159 206 151
1,808 222 1,586 118 1,192 498 751 705
1,443 145 1,298 180 953 310 598 571454 73 381 39 266 149 218 158
1,330 163 1,167 122 854 354 633 55312,057 1,359 10,698 2,119 7,352 2,586 4,170 5,010
621 94 527 39 394 188 302 269
341 77 264 10 204 127 169 113938 113 825 142 564 232 373 349
1,511 142 1,369 264 923 324 607 6131,024 182 842 145 531 348 452 3951,121 180 941 65 687 369 573 480
922 142 780 93 572 257 422 3401,430 238 1,192 182 805 443 686 464
730 153 577 71 411 248 363 335983 123 860 63 632 288 433 393
2,432 324 2,108 177 1,548 707 1,095 858
833 123 710 50 532 251 377 3571,909 163 1,746 195 1,300 414 760 7617,739 850 6,889 1,101 4,988 1,650 2,940 3,095
615 108 507 17 362 236 289 2431,625 189 1,436 263 963 399 613 660
1,018 164 854 77 616 325 497 3801,772 225 1,547 116 1,141 515 753 6551,063 200 863 170 520 373 471 401
737 110 627 77 458 202 332 292876 106 770 111 554 211 385 346
County Total
Amount ofpayments
(thousandsof dollars)
Category Age
SSIrecipients
alsoreceiving
OASDI
AndersonBedfordBentonBledsoeBlount
BradleyCampbellCannonCarrollCarter
CheathamChesterClaiborneClayCocke
CoffeeCrockettCumberlandDavidsonDeKalb
DecaturDicksonDyerFayetteFentress
FranklinGibsonGilesGraingerGreene
GrundyHamblenHamiltonHancockHardeman
HardinHawkinsHaywoodHendersonHenry
(Continued)
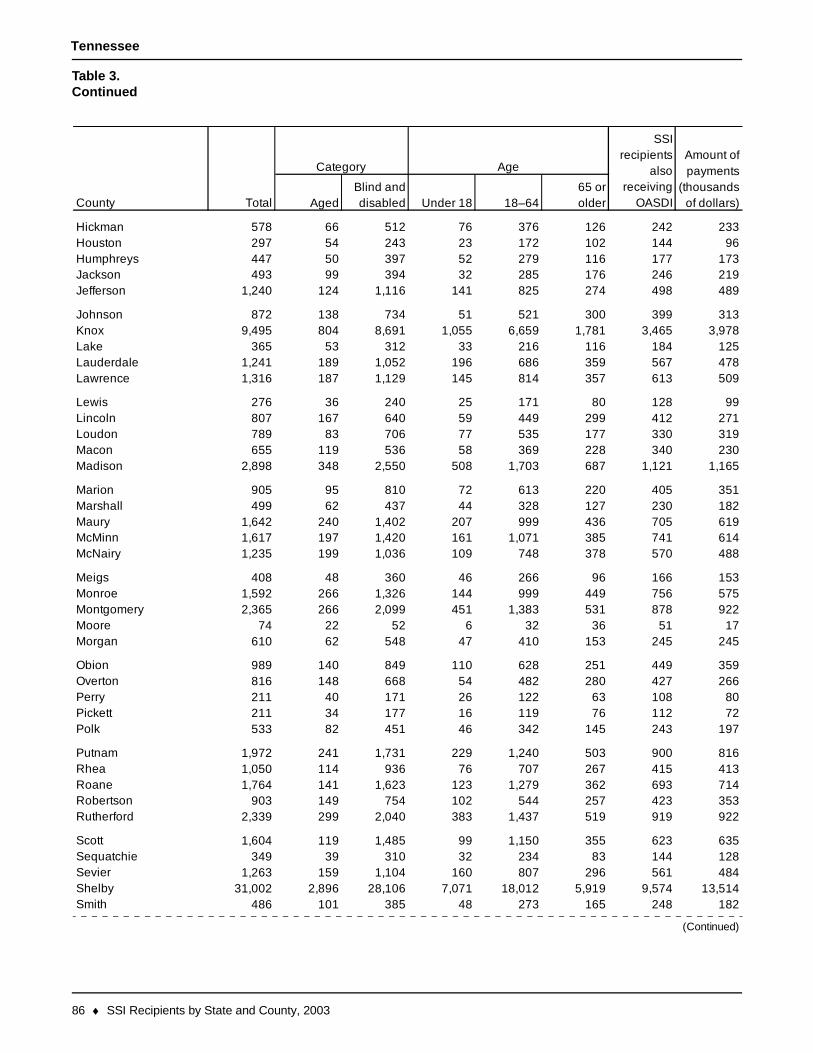
86 ♦ SSI Recipients by State and County, 2003
Tennessee
Table 3.Continued
AgedBlind anddisabled Under 18 18–64
65 orolder
578 66 512 76 376 126 242 233297 54 243 23 172 102 144 96447 50 397 52 279 116 177 173493 99 394 32 285 176 246 219
1,240 124 1,116 141 825 274 498 489
872 138 734 51 521 300 399 3139,495 804 8,691 1,055 6,659 1,781 3,465 3,978
365 53 312 33 216 116 184 1251,241 189 1,052 196 686 359 567 4781,316 187 1,129 145 814 357 613 509
276 36 240 25 171 80 128 99807 167 640 59 449 299 412 271789 83 706 77 535 177 330 319655 119 536 58 369 228 340 230
2,898 348 2,550 508 1,703 687 1,121 1,165
905 95 810 72 613 220 405 351499 62 437 44 328 127 230 182
1,642 240 1,402 207 999 436 705 6191,617 197 1,420 161 1,071 385 741 6141,235 199 1,036 109 748 378 570 488
408 48 360 46 266 96 166 1531,592 266 1,326 144 999 449 756 5752,365 266 2,099 451 1,383 531 878 922
74 22 52 6 32 36 51 17610 62 548 47 410 153 245 245
989 140 849 110 628 251 449 359816 148 668 54 482 280 427 266211 40 171 26 122 63 108 80211 34 177 16 119 76 112 72533 82 451 46 342 145 243 197
1,972 241 1,731 229 1,240 503 900 8161,050 114 936 76 707 267 415 4131,764 141 1,623 123 1,279 362 693 714
903 149 754 102 544 257 423 3532,339 299 2,040 383 1,437 519 919 922
1,604 119 1,485 99 1,150 355 623 635349 39 310 32 234 83 144 128
1,263 159 1,104 160 807 296 561 48431,002 2,896 28,106 7,071 18,012 5,919 9,574 13,514
486 101 385 48 273 165 248 182
HickmanHoustonHumphreysJacksonJefferson
JohnsonKnoxLakeLauderdaleLawrence
LewisLincolnLoudonMaconMadison
MarionMarshallMauryMcMinnMcNairy
MeigsMonroeMontgomeryMooreMorgan
ObionOvertonPerryPickettPolk
PutnamRheaRoaneRobertsonRutherford
ScottSequatchieSevierShelbySmith
County Total
Category Age
SSIrecipients
alsoreceiving
OASDI
Amount ofpayments
(thousandsof dollars)
(Continued)

SSI Recipients by State and County, 2003 ♦ 87
Tennessee
Table 3.Continued
AgedBlind anddisabled Under 18 18–64
65 orolder
362 71 291 33 213 116 176 1324,446 440 4,006 433 3,008 1,005 1,860 1,7442,235 283 1,952 316 1,389 530 1,027 8831,196 198 998 184 658 354 488 499
231 44 187 17 129 85 111 80
661 125 536 40 406 215 331 229641 56 585 56 441 144 233 271175 30 145 8 102 65 82 64
1,377 215 1,162 119 878 380 663 6312,929 357 2,572 277 1,949 703 1,301 1,096
490 62 428 28 317 145 230 178713 100 613 80 455 178 350 274830 116 714 76 510 244 398 345602 102 500 65 347 190 228 231
1,143 135 1,008 164 709 270 481 441
101 12 89 14 67 20 35 38
StewartSullivanSumnerTiptonTrousdale
UnicoiUnionVan Buren
SOURCE: Social Security Administration, Supplemental Security Record (Characteristic Extract Record format), 100 percent data.
WhiteWilliamsonWilson
Unknown
WarrenWashington
WayneWeakley
County Total
Category Age
SSIrecipients
alsoreceiving
OASDI
Amount ofpayments
(thousandsof dollars)

88 ♦ SSI Recipients by State and County, 2003
Texas
Table 3.Number of recipients in state (by eligibility category, age, and receipt of OASDI benefits)and amount of payments, by county, December 2003
AgedBlind anddisabled Under 18 18–64
65 orolder
Total, Texas 455,232 111,313 343,919 65,288 228,697 161,247 181,997 171,311
1,213 254 959 162 670 381 525 435268 66 202 29 134 105 104 104
2,596 304 2,292 402 1,641 553 992 1,001458 80 378 50 281 127 198 165100 17 83 16 56 28 43 37
20 3 17 3 13 4 7 8925 228 697 108 458 359 455 381364 109 255 40 163 161 195 112152 54 98 9 63 80 84 46249 44 205 40 152 57 102 89
927 147 780 135 526 266 384 372120 39 81 15 55 50 62 37930 226 704 143 429 358 462 346
4,366 624 3,742 1,001 2,388 977 1,484 1,71139,492 8,168 31,324 6,183 21,097 12,212 15,380 15,290
97 38 59 16 36 45 44 381 a a a a a a a
285 64 221 41 157 87 113 1112,832 348 2,484 525 1,664 643 1,095 1,0963,314 564 2,750 548 1,903 863 1,125 1,279
1,963 296 1,667 393 1,081 489 712 769195 64 131 19 89 87 102 75
45 19 26 2 15 28 31 11629 158 471 72 291 266 323 219
1,122 197 925 104 694 324 534 373
413 85 328 55 216 142 195 137472 79 393 50 289 133 205 177757 231 526 54 340 363 387 255384 84 300 43 212 129 192 123237 41 196 29 140 68 117 78
17,229 6,638 10,591 1,825 6,297 9,107 8,483 5,961394 66 328 51 234 109 166 158
65 19 46 7 32 26 34 221,007 185 822 111 596 300 442 364
165 63 102 16 64 85 95 50
334 66 268 42 193 99 156 1351,184 205 979 164 678 342 500 412
148 36 112 14 76 58 73 55124 16 108 16 86 22 47 45112 31 81 12 52 48 65 32
County Total
Amount ofpayments
(thousandsof dollars)
Category Age
SSIrecipients
alsoreceiving
OASDI
AndersonAndrewsAngelinaAransasArcher
ArmstrongAtascosaAustinBaileyBandera
BastropBaylorBeeBellBexar
BlancoBordenBosqueBowieBrazoria
BrazosBrewsterBriscoeBrooksBrown
BurlesonBurnetCaldwellCalhounCallahan
CameronCampCarsonCassCastro
ChambersCherokeeChildressClayCochran
(Continued)

SSI Recipients by State and County, 2003 ♦ 89
Texas
Table 3.Continued
AgedBlind anddisabled Under 18 18–64
65 orolder
49 21 28 7 17 25 26 13269 66 203 28 141 100 149 83
3,369 1,128 2,241 520 1,429 1,420 951 1,29093 27 66 10 40 43 51 26
404 108 296 44 202 158 210 136
860 144 716 113 541 206 326 338306 70 236 19 173 114 169 98
83 28 55 7 40 36 35 29455 83 372 57 285 113 199 170625 81 544 149 343 133 196 251
59 23 36 a a 33 41 1687 22 65 15 39 33 33 2893 40 53 8 36 49 56 25
186 38 148 21 100 65 91 6286 28 58 7 40 39 44 27
110 28 82 16 51 43 58 3336,792 7,446 29,346 6,154 19,864 10,774 11,678 15,049
496 125 371 38 236 222 275 159624 173 451 58 300 266 329 203493 132 361 56 238 199 256 174
173 37 136 16 95 62 92 522,596 432 2,164 409 1,580 607 766 885
76 30 46 3 26 47 59 16664 265 399 49 234 381 416 197
86 21 65 12 43 31 42 25
791 240 551 57 349 385 415 265484 96 388 57 267 160 221 173
3,388 769 2,619 457 1,761 1,170 1,316 1,33292 29 63 9 32 51 59 33
23,611 9,422 14,189 2,195 8,869 12,547 10,778 8,171
1,827 314 1,513 310 1,047 470 727 683433 74 359 55 264 114 170 161692 186 506 76 332 284 378 223696 133 563 75 400 221 331 233394 135 259 46 168 180 210 125
87 26 61 a 50 a 52 29182 63 119 24 76 82 101 52
47 13 34 5 25 17 20 143,311 1,223 2,088 443 1,364 1,504 889 1,220
140 25 115 21 79 40 59 45
CokeColemanCollinCollingsworthColorado
ComalComancheConchoCookeCoryell
CottleCraneCrockettCrosbyCulberson
DallamDallasDawsonDeWittDeaf Smith
DeltaDentonDickensDimmitDonley
DuvalEastlandEctorEdwardsEl Paso
EllisErathFallsFanninFayette
FisherFloydFoardFort BendFranklin
County Total
Category Age
SSIrecipients
alsoreceiving
OASDI
Amount ofpayments
(thousandsof dollars)
(Continued)
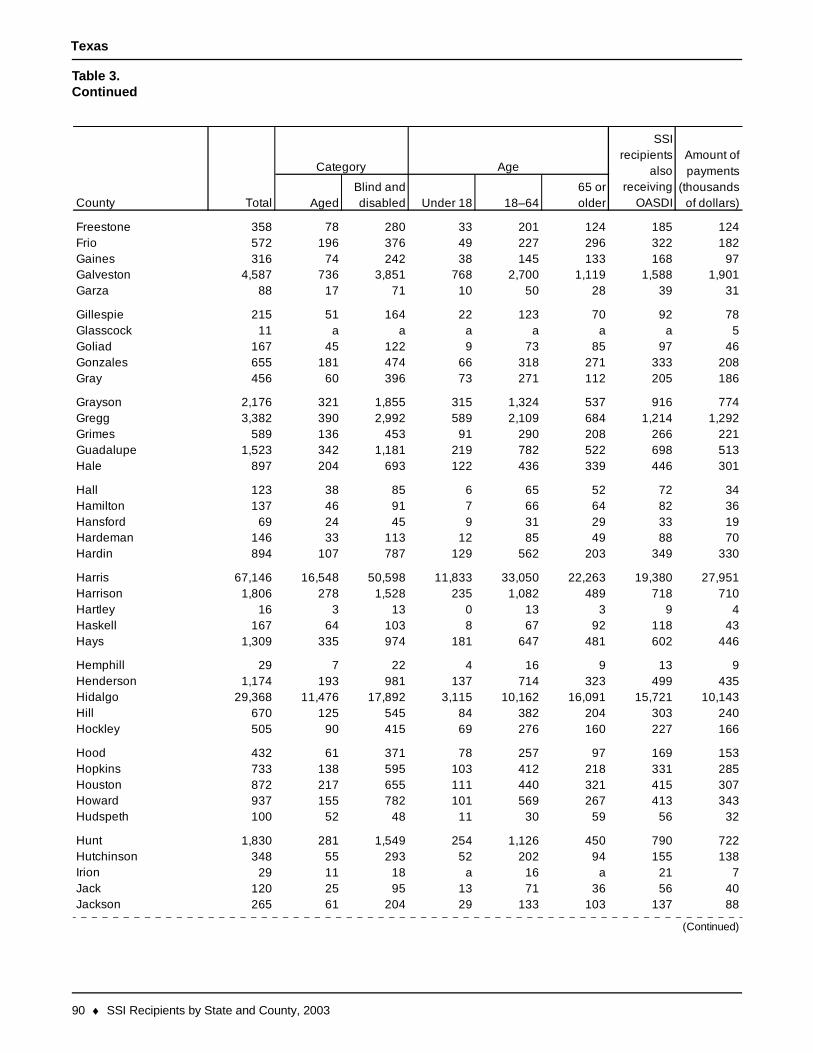
90 ♦ SSI Recipients by State and County, 2003
Texas
Table 3.Continued
AgedBlind anddisabled Under 18 18–64
65 orolder
358 78 280 33 201 124 185 124572 196 376 49 227 296 322 182316 74 242 38 145 133 168 97
4,587 736 3,851 768 2,700 1,119 1,588 1,90188 17 71 10 50 28 39 31
215 51 164 22 123 70 92 7811 a a a a a a 5
167 45 122 9 73 85 97 46655 181 474 66 318 271 333 208456 60 396 73 271 112 205 186
2,176 321 1,855 315 1,324 537 916 7743,382 390 2,992 589 2,109 684 1,214 1,292
589 136 453 91 290 208 266 2211,523 342 1,181 219 782 522 698 513
897 204 693 122 436 339 446 301
123 38 85 6 65 52 72 34137 46 91 7 66 64 82 36
69 24 45 9 31 29 33 19146 33 113 12 85 49 88 70894 107 787 129 562 203 349 330
67,146 16,548 50,598 11,833 33,050 22,263 19,380 27,9511,806 278 1,528 235 1,082 489 718 710
16 3 13 0 13 3 9 4167 64 103 8 67 92 118 43
1,309 335 974 181 647 481 602 446
29 7 22 4 16 9 13 91,174 193 981 137 714 323 499 435
29,368 11,476 17,892 3,115 10,162 16,091 15,721 10,143670 125 545 84 382 204 303 240505 90 415 69 276 160 227 166
432 61 371 78 257 97 169 153733 138 595 103 412 218 331 285872 217 655 111 440 321 415 307937 155 782 101 569 267 413 343100 52 48 11 30 59 56 32
1,830 281 1,549 254 1,126 450 790 722348 55 293 52 202 94 155 138
29 11 18 a 16 a 21 7120 25 95 13 71 36 56 40265 61 204 29 133 103 137 88
FreestoneFrioGainesGalvestonGarza
GillespieGlasscockGoliadGonzalesGray
GraysonGreggGrimesGuadalupeHale
HallHamiltonHansfordHardemanHardin
HarrisHarrisonHartleyHaskellHays
HemphillHendersonHidalgoHillHockley
HoodHopkinsHoustonHowardHudspeth
HuntHutchinsonIrionJackJackson
County Total
Category Age
SSIrecipients
alsoreceiving
OASDI
Amount ofpayments
(thousandsof dollars)
(Continued)

SSI Recipients by State and County, 2003 ♦ 91
Texas
Table 3.Continued
AgedBlind anddisabled Under 18 18–64
65 orolder
1,156 196 960 158 684 314 501 43354 19 35 3 22 29 35 13
7,530 933 6,597 1,307 4,622 1,601 2,616 3,097243 104 139 21 79 143 159 65
1,998 451 1,547 269 942 787 957 686
1,773 238 1,535 273 1,125 375 649 631389 90 299 39 212 138 185 123606 236 370 24 230 352 353 185
1,578 260 1,318 193 988 397 639 555193 45 148 26 103 64 83 70
7 a a a a a a 214 a a a a a a 4
745 142 603 111 443 191 332 27489 27 62 8 38 43 51 25
136 66 70 5 45 86 95 35
915 236 679 117 434 364 437 330134 37 97 12 66 56 71 42291 112 179 26 104 161 165 108
1,707 314 1,393 214 976 517 803 627394 106 288 44 188 162 206 139
349 67 282 49 192 108 165 122495 162 333 39 217 239 265 152220 53 167 19 122 79 106 71425 124 301 25 219 181 231 134
1,694 230 1,464 211 1,090 393 638 708
701 100 601 113 403 185 258 20537 6 31 9 20 8 18 19
261 71 190 27 116 118 140 96224 54 170 23 116 85 129 75
4,994 789 4,205 719 2,973 1,302 2,072 1,737
174 36 138 13 89 72 92 57252 73 179 28 118 106 128 86383 81 302 20 215 148 181 149
84 24 60 8 41 35 42 2580 30 50 2 32 46 52 22
874 236 638 100 451 323 396 2983,597 1,704 1,893 216 1,088 2,293 2,070 1,121
264 77 187 22 127 115 147 775,278 736 4,542 955 3,020 1,303 2,143 2,017
13 a a a a a a 3
JasperJeff DavisJeffersonJim HoggJim Wells
JohnsonJonesKarnesKaufmanKendall
KenedyKentKerrKimbleKinney
KlebergKnoxLa SalleLamarLamb
LampasasLavacaLeeLeonLiberty
LimestoneLipscombLive OakLlanoLubbock
LynnMadisonMarionMartinMason
MatagordaMaverickMcCullochMcLennanMcMullen
County Total
Category Age
SSIrecipients
alsoreceiving
OASDI
Amount ofpayments
(thousandsof dollars)
(Continued)

92 ♦ SSI Recipients by State and County, 2003
Texas
Table 3.Continued
AgedBlind anddisabled Under 18 18–64
65 orolder
640 182 458 90 310 240 318 21477 24 53 5 27 45 54 21
2,102 443 1,659 299 1,133 670 887 757624 166 458 70 308 246 328 214144 30 114 17 85 42 85 48
216 57 159 25 98 93 104 65423 86 337 47 248 128 209 158
4,135 606 3,529 653 2,544 938 1,434 1,739198 55 143 34 91 73 70 70437 77 360 57 239 141 190 161
35 12 23 2 15 18 19 111,693 229 1,464 284 1,003 406 643 6861,416 232 1,184 194 833 389 625 493
492 91 401 71 260 161 226 197440 81 359 42 253 145 219 150
9,499 1,999 7,500 1,499 4,964 3,036 3,911 3,599108 22 86 18 57 33 34 55
24 8 16 a 14 a 13 131,797 180 1,617 316 1,170 311 640 703
433 73 360 65 253 115 180 155
574 130 444 49 314 211 290 206592 76 516 100 373 119 230 225155 39 116 20 72 63 69 61449 167 282 25 189 235 243 139
1,299 193 1,106 173 794 332 570 506
3,079 506 2,573 497 1,854 728 1,153 1,148672 385 287 12 137 523 361 226156 27 129 18 100 38 74 51495 65 430 79 315 101 188 188
37 15 22 3 17 17 18 12
112 32 80 5 57 50 49 44534 141 393 43 264 227 293 164554 188 366 38 243 273 290 178226 73 153 11 103 112 131 71
9 a a a a a a 3
620 143 477 86 298 236 273 226277 70 207 50 141 86 101 111291 79 212 27 154 110 159 86
1,000 175 825 124 579 297 401 375408 77 331 61 225 122 192 153
MedinaMenardMidlandMilamMills
MitchellMontagueMontgomeryMooreMorris
MotleyNacogdochesNavarroNewtonNolan
NuecesOchiltreeOldhamOrangePalo Pinto
PanolaParkerParmerPecosPolk
PotterPresidioRainsRandallReagan
RealRed RiverReevesRefugioRoberts
RobertsonRockwallRunnelsRuskSabine
County Total
Category Age
SSIrecipients
alsoreceiving
OASDI
Amount ofpayments
(thousandsof dollars)
(Continued)
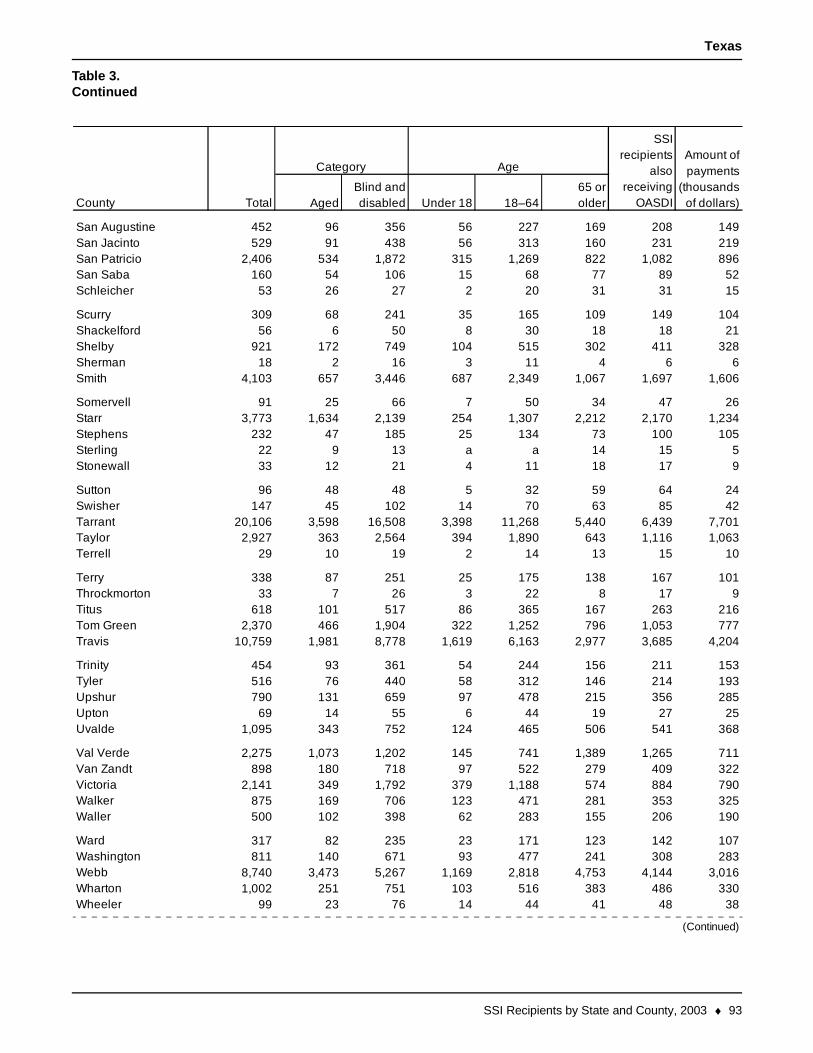
SSI Recipients by State and County, 2003 ♦ 93
Texas
Table 3.Continued
AgedBlind anddisabled Under 18 18–64
65 orolder
452 96 356 56 227 169 208 149529 91 438 56 313 160 231 219
2,406 534 1,872 315 1,269 822 1,082 896160 54 106 15 68 77 89 52
53 26 27 2 20 31 31 15
309 68 241 35 165 109 149 10456 6 50 8 30 18 18 21
921 172 749 104 515 302 411 32818 2 16 3 11 4 6 6
4,103 657 3,446 687 2,349 1,067 1,697 1,606
91 25 66 7 50 34 47 263,773 1,634 2,139 254 1,307 2,212 2,170 1,234
232 47 185 25 134 73 100 10522 9 13 a a 14 15 533 12 21 4 11 18 17 9
96 48 48 5 32 59 64 24147 45 102 14 70 63 85 42
20,106 3,598 16,508 3,398 11,268 5,440 6,439 7,7012,927 363 2,564 394 1,890 643 1,116 1,063
29 10 19 2 14 13 15 10
338 87 251 25 175 138 167 10133 7 26 3 22 8 17 9
618 101 517 86 365 167 263 2162,370 466 1,904 322 1,252 796 1,053 777
10,759 1,981 8,778 1,619 6,163 2,977 3,685 4,204
454 93 361 54 244 156 211 153516 76 440 58 312 146 214 193790 131 659 97 478 215 356 285
69 14 55 6 44 19 27 251,095 343 752 124 465 506 541 368
2,275 1,073 1,202 145 741 1,389 1,265 711898 180 718 97 522 279 409 322
2,141 349 1,792 379 1,188 574 884 790875 169 706 123 471 281 353 325500 102 398 62 283 155 206 190
317 82 235 23 171 123 142 107811 140 671 93 477 241 308 283
8,740 3,473 5,267 1,169 2,818 4,753 4,144 3,0161,002 251 751 103 516 383 486 330
99 23 76 14 44 41 48 38
San AugustineSan JacintoSan PatricioSan SabaSchleicher
ScurryShackelfordShelbyShermanSmith
SomervellStarrStephensSterlingStonewall
SuttonSwisherTarrantTaylorTerrell
TerryThrockmortonTitusTom GreenTravis
TrinityTylerUpshurUptonUvalde
Val VerdeVan ZandtVictoriaWalkerWaller
WardWashingtonWebbWhartonWheeler
County Total
Category Age
SSIrecipients
alsoreceiving
OASDI
Amount ofpayments
(thousandsof dollars)
(Continued)
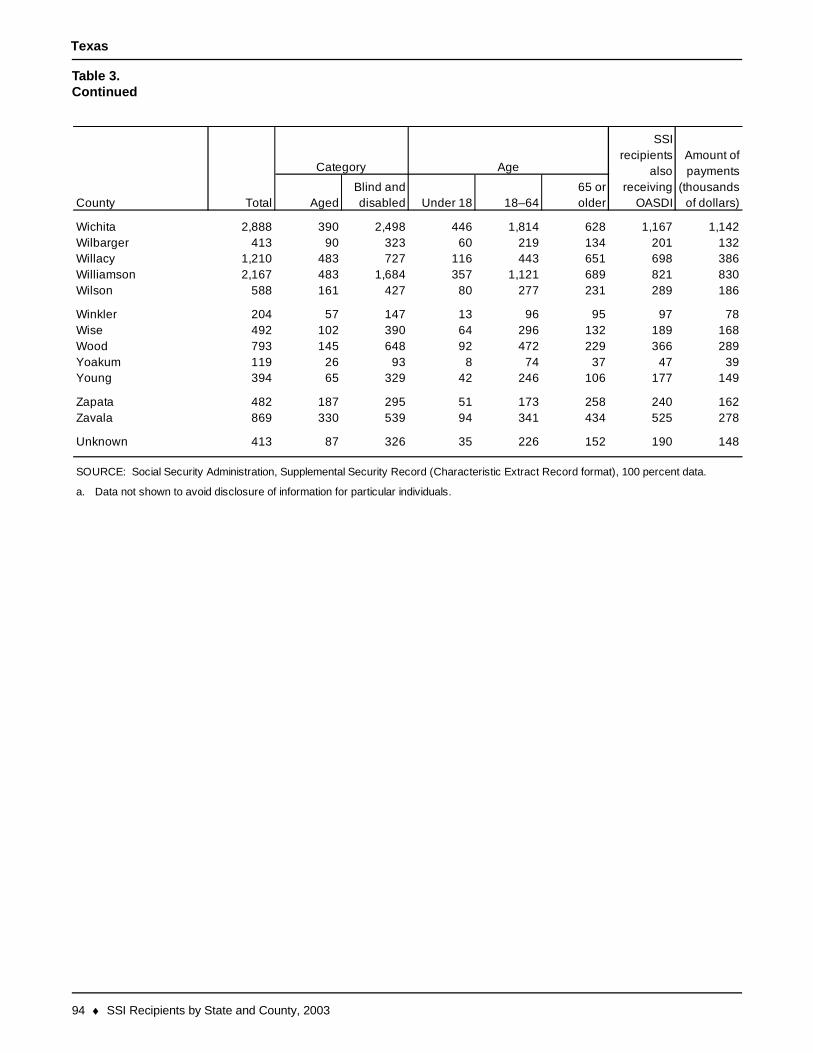
94 ♦ SSI Recipients by State and County, 2003
Texas
Table 3.Continued
AgedBlind anddisabled Under 18 18–64
65 orolder
2,888 390 2,498 446 1,814 628 1,167 1,142413 90 323 60 219 134 201 132
1,210 483 727 116 443 651 698 3862,167 483 1,684 357 1,121 689 821 830
588 161 427 80 277 231 289 186
204 57 147 13 96 95 97 78492 102 390 64 296 132 189 168793 145 648 92 472 229 366 289119 26 93 8 74 37 47 39394 65 329 42 246 106 177 149
482 187 295 51 173 258 240 162869 330 539 94 341 434 525 278
413 87 326 35 226 152 190 148
a.
WiseWood
WichitaWilbargerWillacyWilliamson
Unknown
SOURCE: Social Security Administration, Supplemental Security Record (Characteristic Extract Record format), 100 percent data.
Data not shown to avoid disclosure of information for particular individuals.
YoakumYoung
ZapataZavala
Wilson
Winkler
County Total
Category Age
SSIrecipients
alsoreceiving
OASDI
Amount ofpayments
(thousandsof dollars)
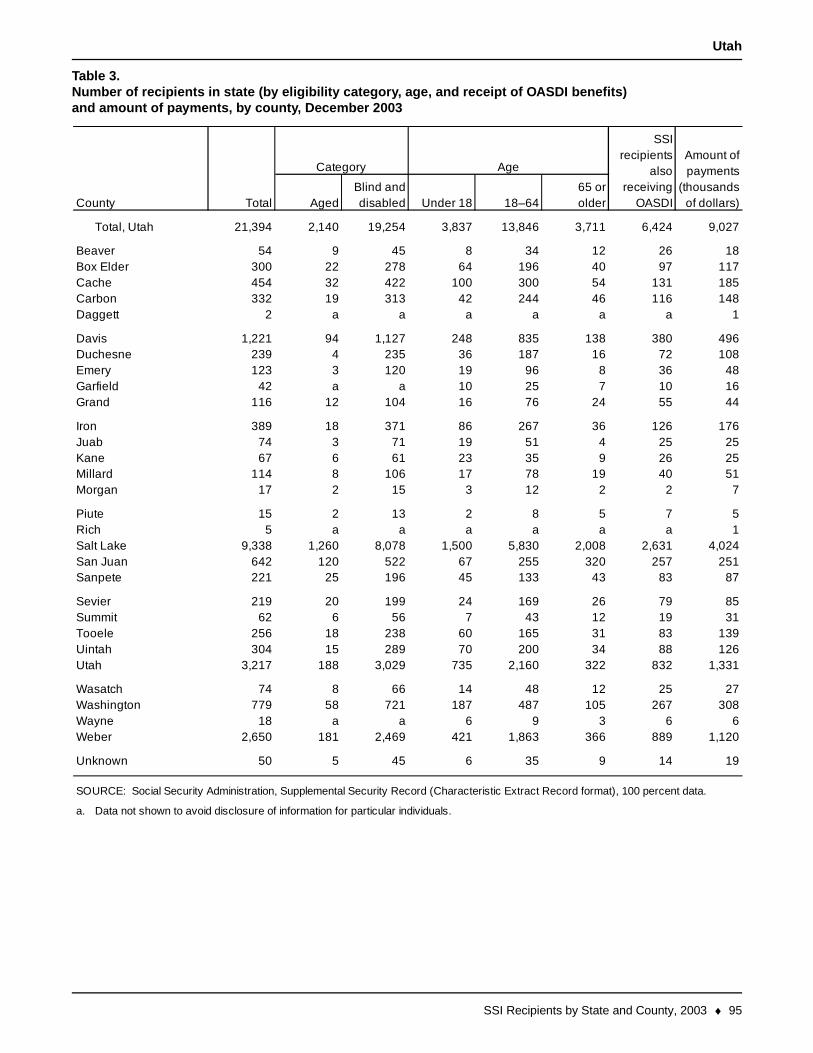
SSI Recipients by State and County, 2003 ♦ 95
Utah
Table 3.Number of recipients in state (by eligibility category, age, and receipt of OASDI benefits)and amount of payments, by county, December 2003
AgedBlind anddisabled Under 18 18–64
65 orolder
Total, Utah 21,394 2,140 19,254 3,837 13,846 3,711 6,424 9,027
54 9 45 8 34 12 26 18300 22 278 64 196 40 97 117454 32 422 100 300 54 131 185332 19 313 42 244 46 116 148
2 a a a a a a 1
1,221 94 1,127 248 835 138 380 496239 4 235 36 187 16 72 108123 3 120 19 96 8 36 48
42 a a 10 25 7 10 16116 12 104 16 76 24 55 44
389 18 371 86 267 36 126 17674 3 71 19 51 4 25 2567 6 61 23 35 9 26 25
114 8 106 17 78 19 40 5117 2 15 3 12 2 2 7
15 2 13 2 8 5 7 55 a a a a a a 1
9,338 1,260 8,078 1,500 5,830 2,008 2,631 4,024642 120 522 67 255 320 257 251221 25 196 45 133 43 83 87
219 20 199 24 169 26 79 8562 6 56 7 43 12 19 31
256 18 238 60 165 31 83 139304 15 289 70 200 34 88 126
3,217 188 3,029 735 2,160 322 832 1,331
74 8 66 14 48 12 25 27779 58 721 187 487 105 267 308
18 a a 6 9 3 6 62,650 181 2,469 421 1,863 366 889 1,120
50 5 45 6 35 9 14 19
a.
Total
Amount ofpayments
(thousandsof dollars)
Category Age
SSIrecipients
alsoreceiving
OASDICounty
BeaverBox ElderCacheCarbonDaggett
DavisDuchesneEmeryGarfieldGrand
IronJuabKaneMillardMorgan
PiuteRichSalt LakeSan JuanSanpete
SevierSummitTooeleUintahUtah
WasatchWashingtonWayneWeber
Unknown
SOURCE: Social Security Administration, Supplemental Security Record (Characteristic Extract Record format), 100 percent data.
Data not shown to avoid disclosure of information for particular individuals.
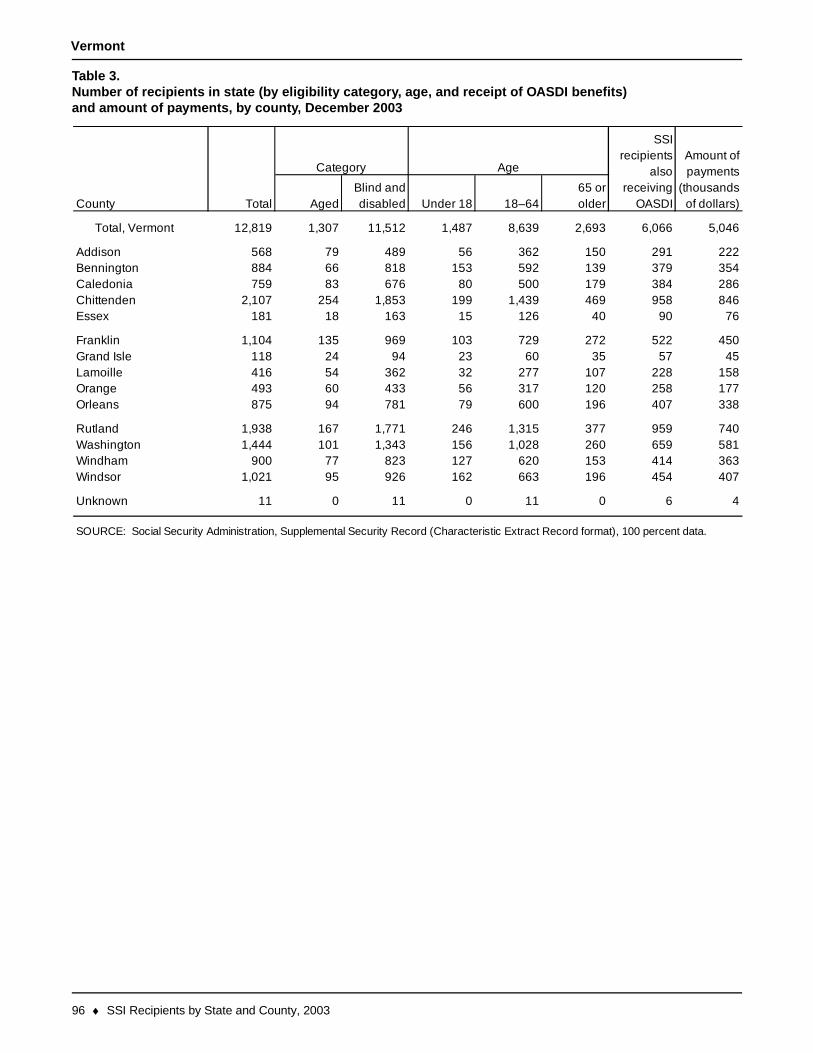
96 ♦ SSI Recipients by State and County, 2003
Vermont
Table 3.Number of recipients in state (by eligibility category, age, and receipt of OASDI benefits)and amount of payments, by county, December 2003
AgedBlind anddisabled Under 18 18–64
65 orolder
Total, Vermont 12,819 1,307 11,512 1,487 8,639 2,693 6,066 5,046
568 79 489 56 362 150 291 222884 66 818 153 592 139 379 354759 83 676 80 500 179 384 286
2,107 254 1,853 199 1,439 469 958 846181 18 163 15 126 40 90 76
1,104 135 969 103 729 272 522 450118 24 94 23 60 35 57 45416 54 362 32 277 107 228 158493 60 433 56 317 120 258 177875 94 781 79 600 196 407 338
1,938 167 1,771 246 1,315 377 959 7401,444 101 1,343 156 1,028 260 659 581
900 77 823 127 620 153 414 3631,021 95 926 162 663 196 454 407
11 0 11 0 11 0 6 4
WindhamWindsor
Unknown
SOURCE: Social Security Administration, Supplemental Security Record (Characteristic Extract Record format), 100 percent data.
OrangeOrleans
RutlandWashington
Essex
FranklinGrand IsleLamoille
AddisonBenningtonCaledoniaChittenden
Total
Amount ofpayments
(thousandsof dollars)
Category Age
SSIrecipients
alsoreceiving
OASDICounty

SSI Recipients by State and County, 2003 ♦ 97
Virginia
Table 3.Number of recipients in state (by eligibility category, age, and receipt of OASDI benefits)and amount of payments, by county, December 2003
AgedBlind anddisabled Under 18 18–64
65 orolder
Total, Virginia 133,731 22,183 111,548 20,351 76,567 36,813 49,948 52,201
1,280 290 990 240 598 442 614 445709 133 576 116 379 214 296 275
2,059 747 1,312 165 882 1,012 551 850249 21 228 23 174 52 112 91270 63 207 35 147 88 124 102
659 84 575 93 405 161 240 217366 56 310 44 215 107 158 143
1,884 814 1,070 105 728 1,051 463 757662 89 573 106 397 159 284 228
95 16 79 8 55 32 41 29
708 98 610 89 461 158 284 277283 35 248 45 177 61 134 95178 28 150 17 107 54 91 57254 45 209 27 160 67 111 93877 91 786 92 591 194 415 303
658 128 530 94 348 216 332 2371,763 51 1,712 126 1,442 195 585 756
444 112 332 49 237 158 237 160194 28 166 29 117 48 83 70
1,010 168 842 153 572 285 463 354
347 48 299 41 207 99 167 120809 133 676 54 483 272 411 254146 26 120 18 84 44 72 54572 139 433 63 281 228 308 195
1,120 116 1,004 178 722 220 481 416
2,664 280 2,384 587 1,579 498 810 1,0732,779 323 2,456 722 1,588 469 832 1,129
137 32 105 18 71 48 59 55186 29 157 23 115 48 79 70255 38 217 58 151 46 64 106
322 33 289 39 218 65 130 130106 13 93 14 66 26 50 37678 110 568 86 405 187 326 265251 53 198 54 107 90 121 101
2,326 320 2,006 399 1,335 592 1,045 867
1,025 45 980 55 805 165 350 421684 83 601 95 436 153 224 220438 81 357 81 208 149 199 164240 49 191 31 133 76 112 94
8,098 3,959 4,139 573 2,737 4,788 1,511 3,396
Total
Amount ofpayments
(thousandsof dollars)
Category Age
SSIrecipients
alsoreceiving
OASDICounty
AccomackAlbermarleAlexandria CityAlleghanyAmelia
AmherstAppomattoxArlingtonAugustaBath
BedfordBedford CityBlandBotetourtBristol City
BrunswickBuchananBuckinghamBuena Vista CityCampbell
CarolineCarrollCharles City CountyCharlotteCharlottesville City
Chesapeake CityChesterfieldClarkeClifton Forge CityColonial Heights City
Covington CityCraigCulpeperCumberlandDanville City
DickensonDinwiddieEmporia CityEssexFairfax
(Continued)

98 ♦ SSI Recipients by State and County, 2003
Virginia
Table 3.Continued
AgedBlind anddisabled Under 18 18–64
65 orolder
912 437 475 75 328 509 157 367248 125 123 6 78 164 56 104448 76 372 50 271 127 192 157243 46 197 26 148 69 129 75228 45 183 27 126 75 116 71
827 131 696 87 486 254 437 280557 69 488 110 291 156 226 198568 80 488 88 354 126 263 229658 66 592 121 406 131 227 270412 59 353 19 274 119 203 136
530 58 472 40 367 123 246 194503 62 441 73 326 104 195 192170 53 117 16 82 72 96 56528 118 410 31 285 212 313 150204 41 163 21 104 79 98 68
268 46 222 52 136 80 113 1041,277 274 1,003 182 618 477 656 4762,605 254 2,351 584 1,564 457 820 1,085
614 103 511 107 357 150 279 230510 83 427 54 323 133 184 192
2,300 444 1,856 512 1,188 600 684 9421,055 139 916 165 649 241 503 378
37 13 24 2 19 16 29 11802 62 740 224 464 114 226 346555 75 480 75 330 150 257 192
277 31 246 48 170 59 95 110144 32 112 17 79 48 76 47171 24 147 26 101 44 68 57183 43 140 22 87 74 97 58213 53 160 24 111 78 109 88
1,900 165 1,735 101 1,321 478 807 718194 26 168 18 112 64 104 62762 273 489 85 326 351 205 315572 85 487 68 339 165 257 201470 107 363 79 232 159 243 155
2,084 245 1,839 319 1,291 474 878 810222 44 178 15 122 85 122 76813 212 601 160 386 267 211 333644 64 580 88 423 133 294 246
97 14 83 12 58 27 46 32
Fairfax CityFalls Church CityFauquierFloydFluvanna
FranklinFranklin CityFrederickFredericksburg CityGalax City
GilesGloucesterGoochlandGraysonGreene
GreensvilleHalifaxHampton CityHanoverHarrisonburg City
HenricoHenryHighlandHopewell CityIsle of Wight
James City CountyKing and QueenKing GeorgeKing WilliamLancaster
LeeLexington CityLoudounLouisaLunenburg
Lynchburg CityMadisonManassasMartinsville CityMathews
County Total
Category Age
SSIrecipients
alsoreceiving
OASDI
Amount ofpayments
(thousandsof dollars)
(Continued)

SSI Recipients by State and County, 2003 ♦ 99
Virginia
Table 3.Continued
AgedBlind anddisabled Under 18 18–64
65 orolder
1,309 282 1,027 168 668 473 635 459215 42 173 31 123 61 99 71
1,027 93 934 121 699 207 419 391366 86 280 21 186 159 205 125124 21 103 25 68 31 53 45
4,307 454 3,853 982 2,467 858 1,386 1,8577,305 743 6,562 1,641 4,184 1,480 2,264 3,016
691 189 502 77 325 289 379 240196 50 146 22 106 68 101 62303 15 288 22 230 51 123 112
559 105 454 90 282 187 256 210506 65 441 66 289 151 232 202551 99 452 55 307 189 294 185483 103 380 44 275 164 245 178
2,093 174 1,919 423 1,274 396 694 862
1,645 345 1,300 186 849 610 850 5813,915 372 3,543 951 2,231 733 1,194 1,693
216 38 178 27 133 56 94 77892 138 754 146 511 235 399 331270 32 238 71 147 52 96 102
1,873 476 1,397 300 938 635 505 780970 116 854 81 670 219 425 338196 20 176 16 135 45 84 70
98 28 70 10 44 44 58 31182 29 153 16 99 67 95 53
8,741 894 7,847 1,886 5,083 1,772 2,990 3,682490 55 435 76 312 102 206 175
4,063 307 3,756 689 2,666 708 1,552 1,596280 45 235 28 168 84 133 97826 151 675 115 473 238 418 281
1,698 182 1,516 111 1,165 422 689 656364 47 317 44 231 89 153 125
1,485 222 1,263 89 914 482 660 544504 71 433 61 297 146 262 168
1,268 156 1,112 104 829 335 630 435
463 89 374 49 241 173 245 149482 123 359 67 226 189 263 159623 72 551 114 387 122 221 234522 72 450 99 309 114 140 223652 70 582 64 445 143 293 232
MecklenburgMiddlesexMontgomeryNelsonNew Kent
Newport News CityNorfolk CityNorthamptonNorthumberlandNorton City
NottowayOrangePagePatrickPetersburg City
PittsylvaniaPortsmouth CityPowhatanPrince EdwardPrince George
Prince WilliamPulaskiRadford CityRappahannockRichmond
Richmond CityRoanokeRoanoke CityRockbridgeRockingham
RussellSalem CityScottShenandoahSmyth
South Boston CitySouthamptonSpotsylvaniaStaffordStaunton City
County Total
Category Age
SSIrecipients
alsoreceiving
OASDI
Amount ofpayments
(thousandsof dollars)
(Continued)
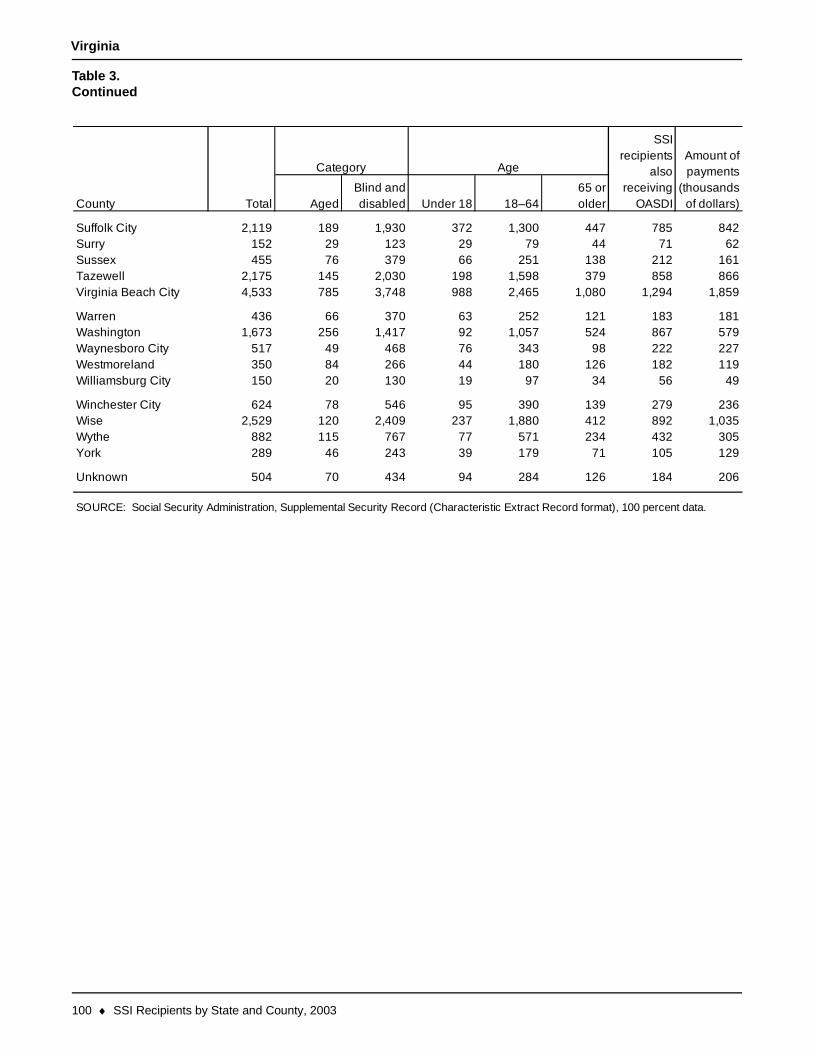
100 ♦ SSI Recipients by State and County, 2003
Virginia
Table 3.Continued
AgedBlind anddisabled Under 18 18–64
65 orolder
2,119 189 1,930 372 1,300 447 785 842152 29 123 29 79 44 71 62455 76 379 66 251 138 212 161
2,175 145 2,030 198 1,598 379 858 8664,533 785 3,748 988 2,465 1,080 1,294 1,859
436 66 370 63 252 121 183 1811,673 256 1,417 92 1,057 524 867 579
517 49 468 76 343 98 222 227350 84 266 44 180 126 182 119150 20 130 19 97 34 56 49
624 78 546 95 390 139 279 2362,529 120 2,409 237 1,880 412 892 1,035
882 115 767 77 571 234 432 305289 46 243 39 179 71 105 129
504 70 434 94 284 126 184 206
Suffolk CitySurrySussexTazewellVirginia Beach City
WarrenWashingtonWaynesboro CityWestmorelandWilliamsburg City
Winchester CityWiseWytheYork
Unknown
SOURCE: Social Security Administration, Supplemental Security Record (Characteristic Extract Record format), 100 percent data.
County Total
Category Age
SSIrecipients
alsoreceiving
OASDI
Amount ofpayments
(thousandsof dollars)
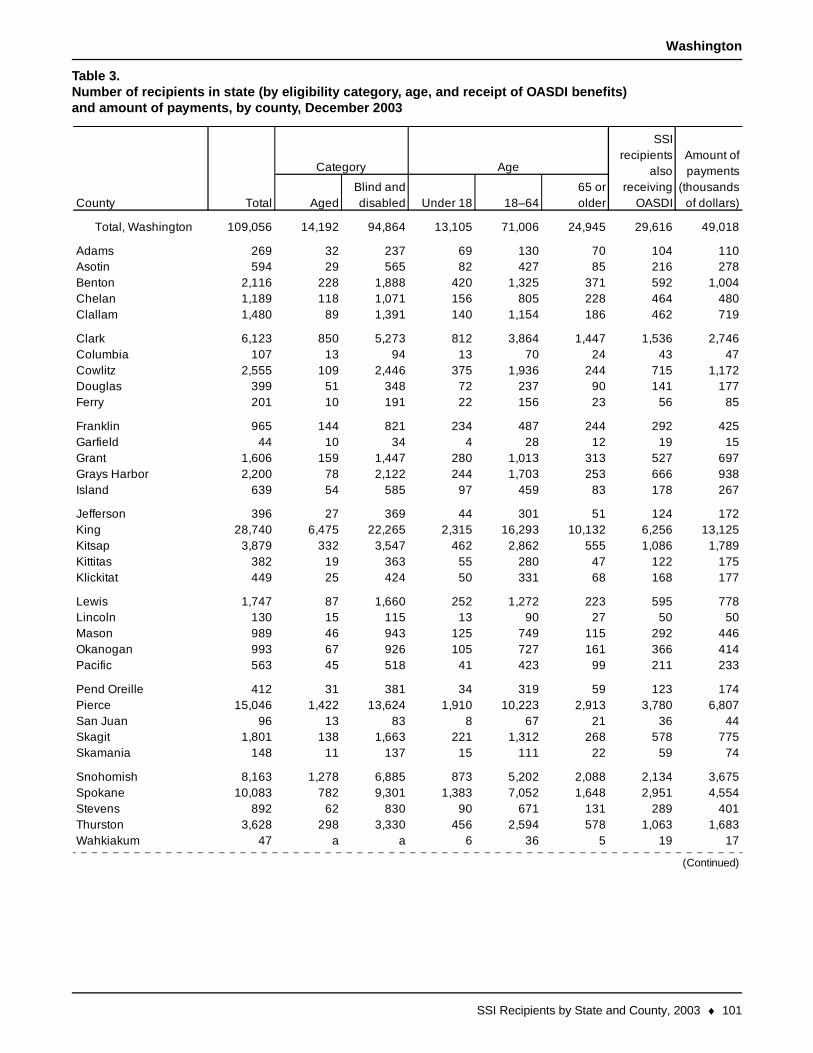
SSI Recipients by State and County, 2003 ♦ 101
Washington
Table 3.Number of recipients in state (by eligibility category, age, and receipt of OASDI benefits)and amount of payments, by county, December 2003
AgedBlind anddisabled Under 18 18–64
65 orolder
Total, Washington 109,056 14,192 94,864 13,105 71,006 24,945 29,616 49,018
269 32 237 69 130 70 104 110594 29 565 82 427 85 216 278
2,116 228 1,888 420 1,325 371 592 1,0041,189 118 1,071 156 805 228 464 4801,480 89 1,391 140 1,154 186 462 719
6,123 850 5,273 812 3,864 1,447 1,536 2,746107 13 94 13 70 24 43 47
2,555 109 2,446 375 1,936 244 715 1,172399 51 348 72 237 90 141 177201 10 191 22 156 23 56 85
965 144 821 234 487 244 292 42544 10 34 4 28 12 19 15
1,606 159 1,447 280 1,013 313 527 6972,200 78 2,122 244 1,703 253 666 938
639 54 585 97 459 83 178 267
396 27 369 44 301 51 124 17228,740 6,475 22,265 2,315 16,293 10,132 6,256 13,125
3,879 332 3,547 462 2,862 555 1,086 1,789382 19 363 55 280 47 122 175449 25 424 50 331 68 168 177
1,747 87 1,660 252 1,272 223 595 778130 15 115 13 90 27 50 50989 46 943 125 749 115 292 446993 67 926 105 727 161 366 414563 45 518 41 423 99 211 233
412 31 381 34 319 59 123 17415,046 1,422 13,624 1,910 10,223 2,913 3,780 6,807
96 13 83 8 67 21 36 441,801 138 1,663 221 1,312 268 578 775
148 11 137 15 111 22 59 74
8,163 1,278 6,885 873 5,202 2,088 2,134 3,67510,083 782 9,301 1,383 7,052 1,648 2,951 4,554
892 62 830 90 671 131 289 4013,628 298 3,330 456 2,594 578 1,063 1,683
47 a a 6 36 5 19 17
StevensThurstonWahkiakum
PierceSan JuanSkagitSkamania
SnohomishSpokane
(Continued)
MasonOkanoganPacific
Pend Oreille
KittitasKlickitat
LewisLincoln
Island
JeffersonKingKitsap
FranklinGarfieldGrantGrays Harbor
ColumbiaCowlitzDouglasFerry
BentonChelanClallam
Clark
County Total
Amount ofpayments
(thousandsof dollars)
Category Age
SSIrecipients
alsoreceiving
OASDI
AdamsAsotin

102 ♦ SSI Recipients by State and County, 2003
Washington
Table 3.Continued
AgedBlind anddisabled Under 18 18–64
65 orolder
1,005 83 922 158 674 173 362 4193,128 340 2,788 334 2,182 612 930 1,442
339 23 316 40 240 59 140 1295,469 594 4,875 1,090 3,170 1,209 1,853 2,288
44 a a 5 31 8 18 16
a.
WhatcomWhitmanYakima
Category Age
Data not shown to avoid disclosure of information for particular individuals.
SOURCE: Social Security Administration, Supplemental Security Record (Characteristic Extract Record format), 100 percent data.
Unknown
Walla Walla
County Total
SSIrecipients
alsoreceiving
OASDI
Amount ofpayments
(thousandsof dollars)

SSI Recipients by State and County, 2003 ♦ 103
West Virginia
Table 3.Number of recipients in state (by eligibility category, age, and receipt of OASDI benefits)and amount of payments, by county, December 2003
AgedBlind anddisabled Under 18 18–64
65 orolder
Total, West Virginia 75,257 4,700 70,557 8,207 54,468 12,582 24,057 31,467
829 62 767 66 614 149 287 3311,668 119 1,549 291 1,125 252 611 6841,310 41 1,269 109 1,017 184 323 579
801 61 740 69 548 184 269 337450 25 425 49 344 57 122 189
4,219 229 3,990 499 3,095 625 1,341 1,759601 57 544 46 402 153 210 264715 47 668 52 519 144 249 288262 34 228 28 171 63 107 98
2,498 120 2,378 259 1,822 417 731 1,073
378 42 336 23 260 95 138 146495 94 401 52 285 158 237 173
1,463 120 1,343 130 1,009 324 580 539707 83 624 119 420 168 289 264695 37 658 121 495 79 195 286
439 67 372 67 241 131 199 1662,859 166 2,693 408 2,069 382 960 1,1261,062 104 958 115 706 241 392 444
657 89 568 82 418 157 297 2366,984 443 6,541 813 5,044 1,127 2,392 2,968
968 68 900 100 679 189 335 3801,860 82 1,778 158 1,372 330 536 7652,426 93 2,333 174 1,889 363 632 1,0851,935 109 1,826 268 1,397 270 580 812
805 52 753 96 574 135 250 338
1,160 75 1,085 111 834 215 357 4803,559 73 3,486 286 2,902 371 810 1,6053,586 208 3,378 395 2,642 549 1,176 1,522
648 39 609 78 454 116 212 2702,776 67 2,709 221 2,208 347 630 1,328
1,597 97 1,500 270 1,108 219 441 680630 73 557 45 414 171 265 244300 41 259 36 195 69 120 112
1,205 80 1,125 112 882 211 388 5041,435 139 1,296 164 1,015 256 475 593
267 71 196 9 128 130 131 88234 19 215 26 152 56 73 101337 46 291 22 223 92 175 122
1,157 78 1,079 151 805 201 308 499943 60 883 123 671 149 312 383Putnam
(Continued)
PendletonPleasantsPocahontasPreston
MonroeMorganNicholasOhio
MercerMineralMingo
Monongalia
MarionMarshall
MasonMcDowell
Kanawha
LewisLincolnLogan
HardyHarrisonJacksonJefferson
GrantGreenbrierHampshireHancock
ClayDoddridgeFayette
Gilmer
BraxtonBrooke
CabellCalhoun
County
BarbourBerkeleyBoone
Total
Amount ofpayments
(thousandsof dollars)
Category Age
SSIrecipients
alsoreceiving
OASDI

104 ♦ SSI Recipients by State and County, 2003
West Virginia
Table 3.Continued
AgedBlind anddisabled Under 18 18–64
65 orolder
3,515 147 3,368 424 2,601 490 1,033 1,4991,403 126 1,277 158 955 290 546 529
487 49 438 53 335 99 180 183882 63 819 88 656 138 280 369863 80 783 57 583 223 303 333
604 45 559 56 420 128 228 238215 25 190 14 145 56 104 66251 23 228 21 181 49 82 100
1,020 87 933 131 705 184 370 3982,250 105 2,145 225 1,647 378 675 948
803 51 752 49 584 170 286 325794 59 735 72 566 156 247 333294 28 266 39 194 61 105 133
3,090 158 2,932 422 2,246 422 1,031 1,2851,794 41 1,753 151 1,446 197 427 836
72 3 69 4 56 12 25 29
Wetzel
Tyler
SOURCE: Social Security Administration, Supplemental Security Record (Characteristic Extract Record format), 100 percent data.
WirtWoodWyoming
Unknown
UpshurWayne
Webster
RoaneSummers
TaylorTucker
RaleighRandolphRitchie
County Total
Category Age
SSIrecipients
alsoreceiving
OASDI
Amount ofpayments
(thousandsof dollars)
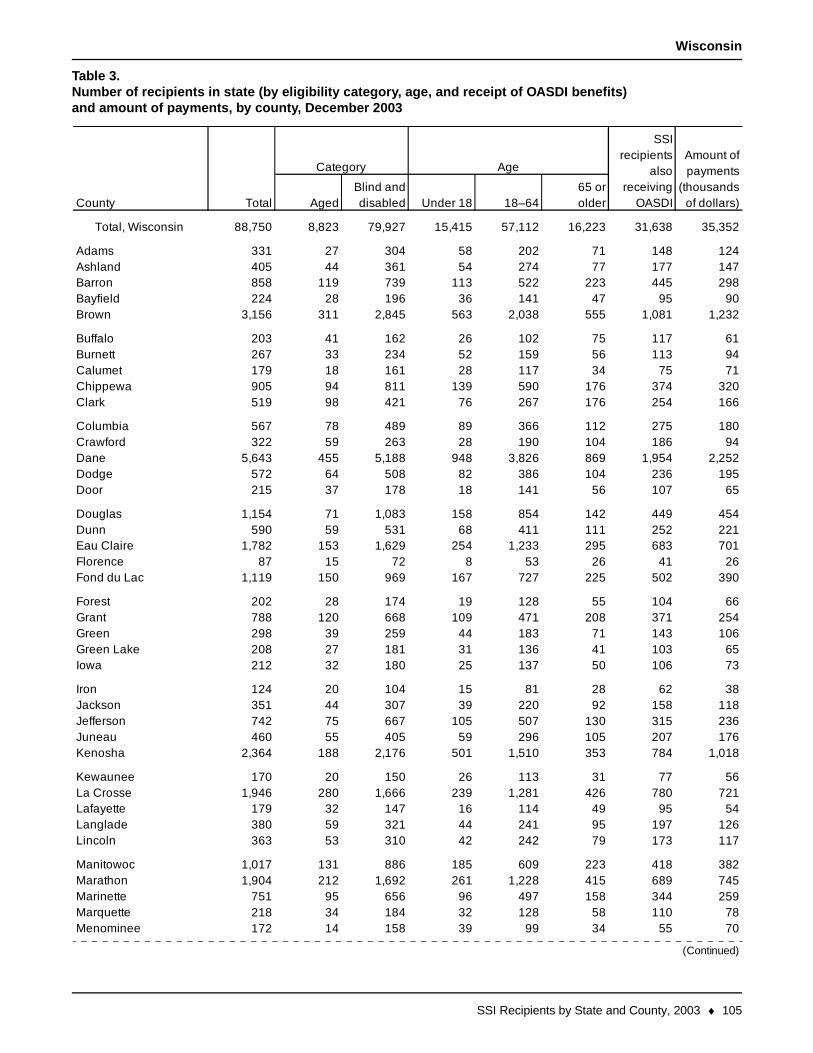
SSI Recipients by State and County, 2003 ♦ 105
Wisconsin
Table 3.Number of recipients in state (by eligibility category, age, and receipt of OASDI benefits)and amount of payments, by county, December 2003
AgedBlind anddisabled Under 18 18–64
65 orolder
Total, Wisconsin 88,750 8,823 79,927 15,415 57,112 16,223 31,638 35,352
331 27 304 58 202 71 148 124405 44 361 54 274 77 177 147858 119 739 113 522 223 445 298224 28 196 36 141 47 95 90
3,156 311 2,845 563 2,038 555 1,081 1,232
203 41 162 26 102 75 117 61267 33 234 52 159 56 113 94179 18 161 28 117 34 75 71905 94 811 139 590 176 374 320519 98 421 76 267 176 254 166
567 78 489 89 366 112 275 180322 59 263 28 190 104 186 94
5,643 455 5,188 948 3,826 869 1,954 2,252572 64 508 82 386 104 236 195215 37 178 18 141 56 107 65
1,154 71 1,083 158 854 142 449 454590 59 531 68 411 111 252 221
1,782 153 1,629 254 1,233 295 683 70187 15 72 8 53 26 41 26
1,119 150 969 167 727 225 502 390
202 28 174 19 128 55 104 66788 120 668 109 471 208 371 254298 39 259 44 183 71 143 106208 27 181 31 136 41 103 65212 32 180 25 137 50 106 73
124 20 104 15 81 28 62 38351 44 307 39 220 92 158 118742 75 667 105 507 130 315 236460 55 405 59 296 105 207 176
2,364 188 2,176 501 1,510 353 784 1,018
170 20 150 26 113 31 77 561,946 280 1,666 239 1,281 426 780 721
179 32 147 16 114 49 95 54380 59 321 44 241 95 197 126363 53 310 42 242 79 173 117
1,017 131 886 185 609 223 418 3821,904 212 1,692 261 1,228 415 689 745
751 95 656 96 497 158 344 259218 34 184 32 128 58 110 78172 14 158 39 99 34 55 70
County Total
Amount ofpayments
(thousandsof dollars)
Category Age
SSIrecipients
alsoreceiving
OASDI
AdamsAshlandBarronBayfieldBrown
BuffaloBurnettCalumetChippewaClark
ColumbiaCrawfordDaneDodgeDoor
DouglasDunnEau ClaireFlorenceFond du Lac
ForestGrantGreenGreen LakeIowa
IronJacksonJeffersonJuneauKenosha
KewauneeLa CrosseLafayetteLangladeLincoln
ManitowocMarathonMarinetteMarquetteMenominee
(Continued)

106 ♦ SSI Recipients by State and County, 2003
Wisconsin
Table 3.Continued
AgedBlind anddisabled Under 18 18–64
65 orolder
32,109 2,615 29,494 6,639 20,182 5,288 8,754 14,178658 71 587 110 411 137 284 234445 62 383 69 276 100 205 151548 54 494 84 368 96 275 176
1,635 198 1,437 239 1,072 324 574 667
293 59 234 33 184 76 104 101111 26 85 8 60 43 62 30259 25 234 34 177 48 122 97459 72 387 64 282 113 219 165737 113 624 93 447 197 340 270
276 57 219 26 159 91 162 873,644 180 3,464 874 2,370 400 1,137 1,526
338 63 275 32 208 98 171 1062,874 174 2,700 537 1,949 388 1,007 1,190
339 51 288 43 213 83 157 119
627 66 561 92 410 125 305 213338 36 302 47 224 67 154 142517 82 435 61 323 133 234 185
1,304 133 1,171 197 860 247 454 491387 45 342 46 260 81 186 146
238 46 192 18 144 76 135 80452 99 353 51 248 153 225 137507 109 398 53 290 164 263 159205 23 182 34 137 34 84 87731 85 646 83 504 144 315 266
368 57 311 35 240 93 187 124593 42 551 88 429 76 268 204
1,771 250 1,521 223 1,203 345 708 644625 90 535 77 387 161 294 207360 54 306 48 225 87 183 125
1,818 140 1,678 317 1,233 268 682 6831,166 128 1,038 154 768 244 511 393
71 6 65 14 49 8 22 29
MilwaukeeMonroeOcontoOneidaOutagamie
OzaukeePepinPiercePolkPortage
PriceRacineRichlandRockRusk
SaukSawyerShawanoSheboyganSt. Croix
Waukesha
TaylorTrempealeauVernonVilas
Unknown
SOURCE: Social Security Administration, Supplemental Security Record (Characteristic Extract Record format), 100 percent data.
WaupacaWaushara
WinnebagoWood
Walworth
WashburnWashington
County Total
Category Age
SSIrecipients
alsoreceiving
OASDI
Amount ofpayments
(thousandsof dollars)

SSI Recipients by State and County, 2003 ♦ 107
Wyoming
Table 3.Number of recipients in state (by eligibility category, age, and receipt of OASDI benefits)and amount of payments, by county, December 2003
AgedBlind anddisabled Under 18 18–64
65 orolder
Total, Wyoming 5,665 484 5,181 822 3,926 917 2,198 2,269
232 17 215 43 159 30 91 98158 14 144 21 101 36 76 50190 11 179 31 141 18 67 67136 11 125 18 95 23 50 52
95 20 75 21 44 30 36 33
35 5 30 4 22 9 19 10753 87 666 113 464 176 262 319182 24 158 24 114 44 89 62
80 10 70 9 54 17 34 3339 6 33 7 26 6 18 12
1,098 72 1,026 135 813 150 431 42984 10 74 10 60 14 32 35
1,143 77 1,066 181 809 153 406 49218 3 15 a 13 a 10 5
269 26 243 40 186 43 126 100
98 20 78 10 60 28 45 38322 34 288 38 229 55 148 113
20 4 16 4 11 5 7 7323 10 313 58 237 28 91 135
44 3 41 7 31 6 20 16
215 8 207 29 171 15 88 11068 4 64 11 46 11 22 3056 6 50 6 36 14 27 20
7 2 5 a 4 a 3 3
a. Data not shown to avoid disclosure of information for particular individuals.
SOURCE: Social Security Administration, Supplemental Security Record (Characteristic Extract Record format), 100 percent data.
UintaWashakieWeston
Unknown
SheridanSubletteSweetwater
Lincoln
Teton
NatronaNiobraraPark
Platte
GoshenHot SpringsJohnson
Laramie
CarbonConverse
CrookFremont
County
AlbanyBig HornCampbell
Total
Amount ofpayments
(thousandsof dollars)
Category Age
SSIrecipients
alsoreceiving
OASDI


