Download - Spectrum Expert 3.1 Users Guide

8/8/2019 Spectrum Expert 3.1 Users Guide
http://slidepdf.com/reader/full/spectrum-expert-31-users-guide 1/139
Spectrum Expert
Users GuideDocument Number: 60008-001
Revision 3.1

8/8/2019 Spectrum Expert 3.1 Users Guide
http://slidepdf.com/reader/full/spectrum-expert-31-users-guide 2/139
Spectrum Expert 3.1 Users Guide
Cognio Document Number 60008-001
Cognio, Inc.
20400 Observation Drive, Suite 206
Germantown, MD 20876
Telephone: 301-540-4900Facsimile: 240-686-3411
Information contained herein is of a highly sensitive nature and is confidential and proprietary to
Cognio, Inc. (Cognio). It shall not be distributed, reproduced, or disclosed orally or in written
form or electronic form, in whole or in part, to any party other than the direct recipients without
the express written consent of Cognio. Your use of the System is subject to the terms of the End
User License Agreement on the product CD.
Multiple Patents Pending. Spectrum Expert includes technology developed by Cognio that issubject to several U.S. and international patent applications owned by Cognio, Inc. Except for
your limited right to use Spectrum Expert per your purchased license or evaluation agreement,
no other right, title or license is granted to you.
With respect to all Cognio software contained in Spectrum Expert and related documentation,
the following additional notices apply.
THIRD PARTY SOFTWARE: The required notices for third party software included in the Spectrum
Expert system are included in a ReadMe file on the Spectrum Expert CD.
Cognio, the Cognio Logo, and Spectrum Expert are trademarks of Cognio, Inc.
Copyright © 2004-2007, Cognio, Inc. All Rights Reserved.

8/8/2019 Spectrum Expert 3.1 Users Guide
http://slidepdf.com/reader/full/spectrum-expert-31-users-guide 3/139
8/8/2019 Spectrum Expert 3.1 Users Guide
http://slidepdf.com/reader/full/spectrum-expert-31-users-guide 4/139
Spectrum Expert Users Guide (Version 3.1)
Cautions and Advisories
Cognio’s Spectrum Expert technology has been designed as a safe, reliable, user-friendly tool for
advanced spectrum monitoring. There are, however, a handful of actions which can inadvertentlycause difficulties with using Spectrum Expert technology. There are also environmental factors,
beyond your control, which can cause unexpected behaviors. We call your attention to them here,
up front, so you can be aware of these issues; read the appropriate sections of this Users Guide in
advance; and make most the most effective (and trouble-free) use of the technology.
Installation – Be sure to install the Spectrum Expert software on your PC before
inserting the CardBus Sensor into your PC’s PCMCIA slot.
See Section 3, Spectrum Expert Setup on page 19 for more information.
Disconnecting the External Antenna From the CardBus Sensor – You can
achieve increased reception sensitivity for RF signals by attaching an external antenna to the
CardBus Sensor. However, the connector on the Sensor is relatively fragile. Therefore, caremust be taken when disconnecting the antenna, in order to avoid physical damage both to the
Sensor and the antenna.
Removing the External Antenna on page 24.
Using 802.11 Broadcast Technology With Spectrum Expert For Wi-Fi – Spectrum
Expert comes in several different editions for monitoring different parts of the RF spectrum.
One edition, Spectrum Expert For Wi-Fi is designed specifically to monitor the RF spectrum in
the bands used by 802.11 technology – the broadcast technology used for wireless computer
networks.
If you are using Spectrum Expert For Wi-Fi, the technology will not function correctly if the PC
which hosts Spectrum Expert — that is, the PC where you have installed Spectrum Expert, andinserted the CardBus Sensor — is also broadcasting its own signals in the Wi-Fi bands.
This means, in practice, that your Spectrum Expert For Wi-Fi PC cannot itself be part of a Wi-Fi
network – that is, it cannot be connected to a Wi-Fi AP or Ad-Hoc network, while you are
running Spectrum Expert For Wi-Fi. There are also limitations on using certain other network
monitoring technologies on the same PC which hosts Spectrum Expert For Wi-Fi. (Note that if the
CardBus Sensor is installed, but you are not actually running Spectrum Expert For Wi-Fi, it is okay
to allow the PC to participate in a network.)
See Section 1.4.1, Using Spectrum Expert With Other Onboard PC Technologies on page 4 of
this Users Guide for more information.
If You Are Not Seeing Any Data, or Not Seeing Expected Data – Certainpeculiarities of the RF behavior can sometimes result in Spectrum Expert not showing any
data, or not showing expected data (such as not displaying any device information for a
device which you know is out there). Failure to see data can also result from Spectrum Expert
hardware not being installed correctly. These issues — and ways to work around them — are
explained in Section 4.9, What If I ’ m Not Seeing Any Data?, on page 42.

8/8/2019 Spectrum Expert 3.1 Users Guide
http://slidepdf.com/reader/full/spectrum-expert-31-users-guide 5/139
Page ii
Spectrum Expert Users Guide (Version 3.1)
This page left intentionally blank.
8/8/2019 Spectrum Expert 3.1 Users Guide
http://slidepdf.com/reader/full/spectrum-expert-31-users-guide 6/139
Page iii
Spectrum Expert Users Guide (Version 3.1)
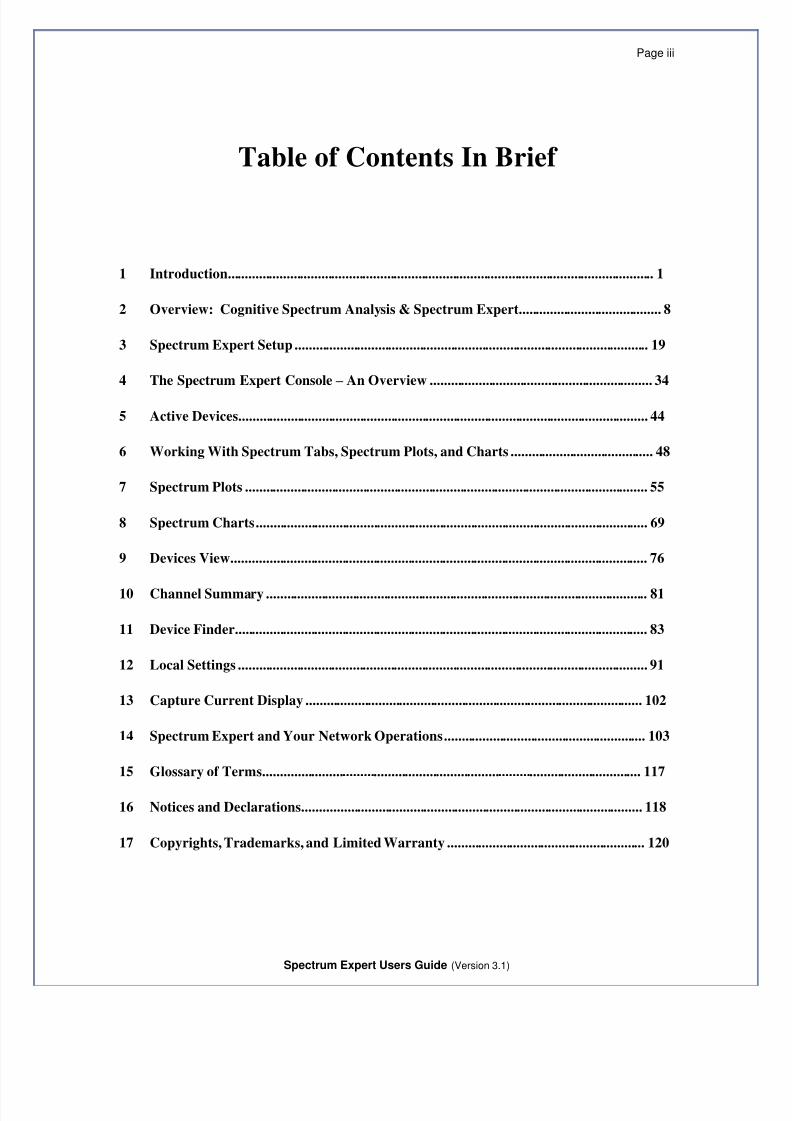
Table of Contents In Brief
1 Introduction........................................................................................................................... 1
2 Overview: Cognitive Spectrum Analysis & Spectrum Expert......................................... 8
3 Spectrum Expert Setup ...................................................................................................... 19
4 The Spectrum Expert Console – An Overview ................................................................ 34
5 Active Devices...................................................................................................................... 44
6 Working With Spectrum Tabs, Spectrum Plots, and Charts ......................................... 48
7 Spectrum Plots .................................................................................................................... 55
8 Spectrum Charts................................................................................................................. 69
9 Devices View........................................................................................................................ 76
10 Channel Summary .............................................................................................................. 81
11 Device Finder....................................................................................................................... 83
12 Local Settings ...................................................................................................................... 91
13 Capture Current Display ................................................................................................. 102
14 Spectrum Expert and Your Network Operations.......................................................... 103
15 Glossary of Terms............................................................................................................. 117
16 Notices and Declarations.................................................................................................. 118
17 Copyrights, Trademarks, and Limited Warranty ......................................................... 120

8/8/2019 Spectrum Expert 3.1 Users Guide
http://slidepdf.com/reader/full/spectrum-expert-31-users-guide 7/139
Page iv
Spectrum Expert Users Guide (Version 3.1)
This page left intentionally blank.

8/8/2019 Spectrum Expert 3.1 Users Guide
http://slidepdf.com/reader/full/spectrum-expert-31-users-guide 8/139
Page v
Spectrum Expert Users Guide (Version 3.1)
Table of Contents
1 Introduction........................................................................................................................... 1 1.1 Purpose........................................................................................................................... 1 1.2 Spectrum Expert Editions .............................................................................................. 1 1.3 Spectrum Expert, Mobile Edition .................................................................................. 2
1.3.1 The Cardbus Sensor................................................................................................... 2 1.3.1.1 LEDs .......................................................................................................................2
1.3.2 Wi-Fi Vs. RFID Applications.................................................................................... 2 1.3.3 Spectrum Bands......................................................................................................... 3 1.3.4 The Users Guide and Console Online Help............................................................... 3 1.3.5 Product Bundles......................................................................................................... 3
1.3.5.1 Spectrum Expert for Wi-Fi Bundle.......................................................................3
1.3.5.2 Spectrum Expert for RFID Bundle .......................................................................4 1.4 System Requirements..................................................................................................... 4 1.4.1 Using Spectrum Expert With Other Onboard PC Technologies ............................... 4
1.4.1.1 Other Monitoring Technologies............................................................................4 1.4.1.2 Concurrent 802.11 (Wi-Fi) Protocol Support ......................................................5 1.4.1.3 Concurrent Spectrum Expert, Enterprise Edition Support .................................. 5
1.5 Conventions in This Manual.......................................................................................... 5 1.5.1 Keywords, Key Concepts, and Definitions................................................................ 5 1.5.2 Screen Text................................................................................................................ 5
1.5.2.1 Keyword vs. Screen Text Usage ...........................................................................6 1.5.3 Menu Selections ........................................................................................................ 6 1.5.4 Screen Buttons........................................................................................................... 6
1.5.5 Keyboard Buttons ...................................................................................................... 6 1.5.6 Wi-Fi vs. RFID Features............................................................................................ 6
2 Overview: Cognitive Spectrum Analysis & Spectrum Expert......................................... 8
2.1 Cognitive Spectrum Analysis......................................................................................... 8 2.1.1 RF Visibility and Unlicensed Bands.......................................................................... 8
2.1.1.1 Discovery ............................................................................................................... 8 2.1.1.2 Performance ...........................................................................................................8 2.1.1.3 Troubleshooting..................................................................................................... 9 2.1.1.4 Summary ................................................................................................................ 9
2.1.2 Spectrum Expert: Mitigation and Performance Enhancement.................................. 9
2.1.2.1 Clean Channels ...................................................................................................... 9 2.1.2.2 Identifying, Locating, and Removing Interferers .............................................. 10 2.1.2.3 Device Specific Solutions ...................................................................................10
2.2 The Spectrum Expert Solution..................................................................................... 10 2.2.1 Spectrum Sensors..................................................................................................... 11 2.2.2 The Spectrum Expert Application ........................................................................... 11 2.2.3 Spectrum Expert Online Help.................................................................................. 12
2.3 Spectrum Expert Operating Scenarios ......................................................................... 12 2.3.1 Firefighting Mode.................................................................................................... 12

8/8/2019 Spectrum Expert 3.1 Users Guide
http://slidepdf.com/reader/full/spectrum-expert-31-users-guide 9/139
Page vi
Spectrum Expert Users Guide (Version 3.1)
2.3.2 RF Expert................................................................................................................. 13 2.3.3 Site Survey / Network Install and Initial Configuration.......................................... 14
2.4 Technical Concepts...................................................................................................... 15 2.4.1 Duty Cycle............................................................................................................... 15 2.4.2 Device Classifiers .................................................................................................... 15
2.4.2.1 Wi-Fi Classifiers ..................................................................................................15
2.4.2.2 RFID Classifiers ..................................................................................................16 2.4.2.3 Generic Device Classifiers ..................................................................................16
2.4.3 Interferers: Classified (Named), Generic, and Unclassified................................... 17 2.4.3.1 Classified Named Interferers .............................................................................. 17 2.4.3.2 Classified Generic Interferers .............................................................................17 2.4.3.3 Unclassified Interferers .......................................................................................18
3 Spectrum Expert Setup ...................................................................................................... 19
3.1 Application Installation / Setup.................................................................................... 19 3.2 CardBus Sensor Installation......................................................................................... 21 3.3 Attaching an External Antenna.................................................................................... 22
3.3.1 Use the Correct Antenna.......................................................................................... 23
3.3.2 Attaching the Omnidirectional Antenna.................................................................. 23 3.3.3 Attaching the Directional Antenna .......................................................................... 24 3.3.4 Removing the External Antenna.............................................................................. 24 3.3.5 Using the Directional Antenna ................................................................................ 26 3.3.6 Swapping or Removing the CardBus Sensors ......................................................... 27
3.4 Starting the Mobile Console for the First Time ........................................................... 28 3.5 Repairing a “Backwards” Installation.......................................................................... 29
3.5.1 Automatic Hardware Recognition By Windows XP Or Vista................................. 30 3.5.2 Manual Driver Installation....................................................................................... 30
3.6 You will now be able to use the Application. Spectrum Expert and Your PC ............ 32 3.6.1 PC Resource Utilization .......................................................................................... 32
3.6.2 Spurious Signal Detection ....................................................................................... 32 3.6.3 Enabling Your PC’s 802.11 Receive Operability (But Not Transmit)..................... 32
3.6.3.1 Spectrum Expert For RFID and Other 802.11 Devices..................................... 33 3.7 Upgrading The Spectrum Expert Software.................................................................. 33
4 The Spectrum Expert Console – An Overview ................................................................ 34
4.1 Status Bar..................................................................................................................... 34 4.2 Active Device Tree ...................................................................................................... 34 4.3 Console Tabs and Operational Features....................................................................... 35 4.4 Control Panel ............................................................................................................... 35 4.5 Hiding / Unhiding the Active Devices List & Control Panel....................................... 36
4.5.1 Close........................................................................................................................ 36 4.5.2 Auto-Hide ................................................................................................................ 36 4.5.3 Temporary Restore .................................................................................................. 36 4.5.4 Permanent Restore................................................................................................... 36
4.6 Menu Options............................................................................................................... 37 4.6.1 File Menu................................................................................................................. 37 4.6.2 View Menu .............................................................................................................. 37 4.6.3 Spectrum Menu........................................................................................................ 38 4.6.4 Tools Menu.............................................................................................................. 39
8/8/2019 Spectrum Expert 3.1 Users Guide
http://slidepdf.com/reader/full/spectrum-expert-31-users-guide 10/139
Page vii
Spectrum Expert Users Guide (Version 3.1)
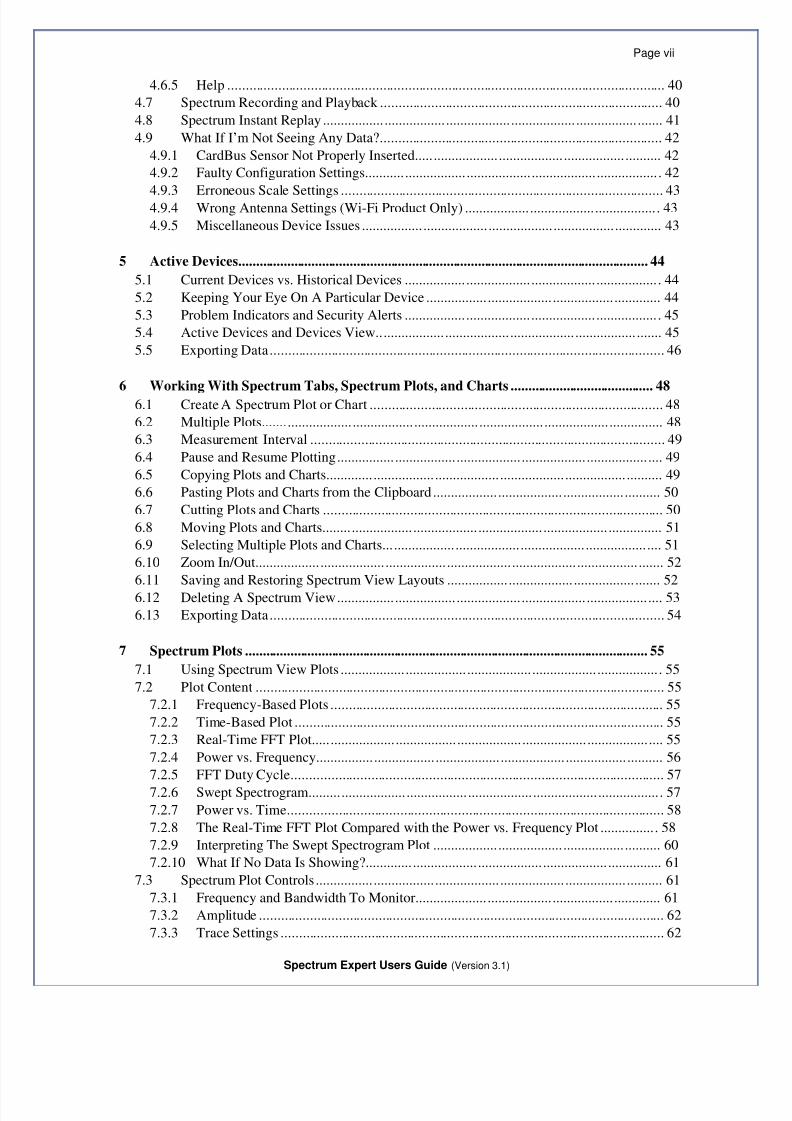
4.6.5 Help ......................................................................................................................... 40 4.7 Spectrum Recording and Playback .............................................................................. 40 4.8 Spectrum Instant Replay .............................................................................................. 41 4.9 What If I’m Not Seeing Any Data?.............................................................................. 42
4.9.1 CardBus Sensor Not Properly Inserted.................................................................... 42 4.9.2 Faulty Configuration Settings.................................................................................. 42
4.9.3 Erroneous Scale Settings ......................................................................................... 43 4.9.4 Wrong Antenna Settings (Wi-Fi Product Only) ...................................................... 43 4.9.5 Miscellaneous Device Issues ................................................................................... 43
5 Active Devices...................................................................................................................... 44
5.1 Current Devices vs. Historical Devices ....................................................................... 44 5.2 Keeping Your Eye On A Particular Device ................................................................. 44 5.3 Problem Indicators and Security Alerts ....................................................................... 45 5.4 Active Devices and Devices View............................................................................... 45 5.5 Exporting Data............................................................................................................. 46
6 Working With Spectrum Tabs, Spectrum Plots, and Charts ......................................... 48 6.1 Create A Spectrum Plot or Chart ................................................................................. 48 6.2 Multiple Plots............................................................................................................... 48 6.3 Measurement Interval .................................................................................................. 49 6.4 Pause and Resume Plotting.......................................................................................... 49 6.5 Copying Plots and Charts............................................................................................. 49 6.6 Pasting Plots and Charts from the Clipboard ............................................................... 50 6.7 Cutting Plots and Charts .............................................................................................. 50 6.8 Moving Plots and Charts.............................................................................................. 51 6.9 Selecting Multiple Plots and Charts............................................................................. 51 6.10 Zoom In/Out................................................................................................................. 52 6.11 Saving and Restoring Spectrum View Layouts ........................................................... 52 6.12 Deleting A Spectrum View.......................................................................................... 53 6.13 Exporting Data............................................................................................................. 54
7 Spectrum Plots .................................................................................................................... 55
7.1 Using Spectrum View Plots ......................................................................................... 55 7.2 Plot Content ................................................................................................................. 55
7.2.1 Frequency-Based Plots ............................................................................................ 55 7.2.2 Time-Based Plot ...................................................................................................... 55 7.2.3 Real-Time FFT Plot................................................................................................. 55 7.2.4 Power vs. Frequency................................................................................................ 56 7.2.5 FFT Duty Cycle....................................................................................................... 57 7.2.6 Swept Spectrogram.................................................................................................. 57 7.2.7 Power vs. Time........................................................................................................ 58 7.2.8 The Real-Time FFT Plot Compared with the Power vs. Frequency Plot ................ 58 7.2.9 Interpreting The Swept Spectrogram Plot ............................................................... 60 7.2.10 What If No Data Is Showing?.................................................................................. 61
7.3 Spectrum Plot Controls ................................................................................................ 61 7.3.1 Frequency and Bandwidth To Monitor.................................................................... 61 7.3.2 Amplitude ................................................................................................................ 62 7.3.3 Trace Settings .......................................................................................................... 62

8/8/2019 Spectrum Expert 3.1 Users Guide
http://slidepdf.com/reader/full/spectrum-expert-31-users-guide 11/139
Page viii
Spectrum Expert Users Guide (Version 3.1)
7.3.4 Markers.................................................................................................................... 63 7.3.4.1 Setting The X-Axis Position of Delta Markers ..................................................64
7.3.5 Channels .................................................................................................................. 64 7.3.6 Other Plot Control Panel Settings............................................................................ 65
7.3.6.1 Power vs. Time .................................................................................................... 65 7.3.6.2 Swept Spectrogram..............................................................................................67 7.3.6.3 FFT Duty Cycle Plot............................................................................................ 68
8 Spectrum Charts................................................................................................................. 69
8.1 Using Spectrum View Charts....................................................................................... 69 8.2 Chart Content............................................................................................................... 69
8.2.1 Active Devices......................................................................................................... 69 8.2.2 Devices vs. Channels............................................................................................... 69 8.2.3 Devices vs. Time ..................................................................................................... 69 8.2.4 Channel Utilization.................................................................................................. 70 8.2.5 Channel Utilization vs. Time................................................................................... 70 8.2.6 Interference Power................................................................................................... 70 8.2.7 SNR (Signal To Noise Ratio) .................................................................................. 71
8.3 Bar Indicators............................................................................................................... 72 8.3.1 Navigate to Other Views ......................................................................................... 72
8.4 Chart Controls.............................................................................................................. 72 8.4.1 Channel or Band Selection For Channel-Based Charts ........................................... 73 8.4.2 Selection Options for Time-Based Charts ............................................................... 73
9 Devices View........................................................................................................................ 76
9.1 Working With Devices View....................................................................................... 77 9.1.1 Devices View and the Active Devices Panel........................................................... 77 9.1.2 Adjusting The Column Display............................................................................... 77 9.1.3 Selecting The Display Type..................................................................................... 77 9.1.4 Setting The Time Range.......................................................................................... 78 9.1.5 Sorting The Display................................................................................................. 78
9.1.5.1 Ascending and Descending Sort Order ..............................................................79 9.1.6 Keeping Your Eye On A Particular Device............................................................. 79 9.1.7 Locating A Device................................................................................................... 79 9.1.8 Obtaining Detailed Information On A Device......................................................... 79
9.2 Miscellaneous Device Issues ....................................................................................... 79 9.2.1 Signal Bounce and Fading....................................................................................... 79 9.2.2 Near/Far Effect ........................................................................................................ 80 9.2.3 Device Detection Time............................................................................................ 80
10 Channel Summary .............................................................................................................. 81 10.1 Working with the Channel Summary........................................................................... 81
10.1.1 Sorting the Display .................................................................................................. 81 10.2 Channel Data................................................................................................................ 81 10.3 Miscellaneous Channel Summary Issues..................................................................... 82
10.3.1 802.11 Detection Sensitivity.................................................................................... 82 10.3.2 802.11 Device Types............................................................................................... 82
11 Device Finder....................................................................................................................... 83

8/8/2019 Spectrum Expert 3.1 Users Guide
http://slidepdf.com/reader/full/spectrum-expert-31-users-guide 12/139
Page ix
Spectrum Expert Users Guide (Version 3.1)
11.1 Overview...................................................................................................................... 83 11.2 Working With Device Finder....................................................................................... 84 11.3 Additional Device Finder Features .............................................................................. 85 11.4 “Divide And Conquer” Search Strategy ...................................................................... 86
11.4.1 Omnidirectional Antenna......................................................................................... 86 11.4.2 Directional Antenna................................................................................................. 88
11.4.3 Detecting Narrowband Devices............................................................................... 90
12 Local Settings ...................................................................................................................... 91
12.1 Sensors and Antennas .................................................................................................. 91 12.2 Console Settings........................................................................................................... 92 12.3 Band And Channel Settings ......................................................................................... 93
12.3.1 Regulatory Domain Options.................................................................................... 94 12.3.2 User Defined Option................................................................................................ 95 12.3.3 Monitoring............................................................................................................... 95
12.4 Alert Settings ............................................................................................................... 96 12.5 SNMP Option Settings................................................................................................. 99
12.5.1
IP Address................................................................................................................ 99 12.5.2 Trap Filters ............................................................................................................ 100
12.5.3 Modifying Trap Filters Default Settings................................................................ 100 12.5.4 Trap Filter Information Content ............................................................................ 100 12.5.5 Set SNMP Traps.................................................................................................... 101
13 Capture Current Display ................................................................................................. 102
13.1 Tips On Image Capture .............................................................................................. 102 13.2 Tips On Image File Naming....................................................................................... 102
14 Spectrum Expert and Your Network Operations.......................................................... 103
14.1
Site Survey ................................................................................................................. 103 14.1.1 The Physical Movement Of The PC...................................................................... 103
14.1.2 Spectrum Expert Survey Data ............................................................................... 104 14.1.3 Additional Notes On Site Survey and the Spectrum Plots..................................... 105
14.1.3.1 Monitoring Multiple Bands on Spectrum Plots ............................................... 105 14.1.3.2 Real Time Plots vs. Software-Based Plots .......................................................105
14.1.4 Conducting The Site Survey.................................................................................. 106 14.1.4.1 Save the RF Map................................................................................................107
14.1.5 Drawing Conclusions............................................................................................. 107 14.1.6 Antenna Options.................................................................................................... 107
14.2 Network Layout ......................................................................................................... 108 14.2.1 Placing the First AP............................................................................................... 108 14.2.2 Placing the Second AP........................................................................................... 109 14.2.3 Placing Successive APs......................................................................................... 110 14.2.4 After-Deployment Site Survey .............................................................................. 110
14.3 Long-Term Trend Analysis........................................................................................ 110 14.3.1 Trend Analysis Procedure...................................................................................... 110 14.3.2 Type Of Data To Record ....................................................................................... 111
14.4 Routine Network Monitoring and Trouble-Shooting................................................. 112 14.4.1 Routine Monitoring ............................................................................................... 112 14.4.2 Monitoring Points and Monitoring Rotation ......................................................... 113

8/8/2019 Spectrum Expert 3.1 Users Guide
http://slidepdf.com/reader/full/spectrum-expert-31-users-guide 13/139
Page x
Spectrum Expert Users Guide (Version 3.1)
14.4.3 RF and Device Monitoring.................................................................................... 115 14.4.4 Trouble-Shooting................................................................................................... 115 14.4.5 Problem Resolution ............................................................................................... 115
14.4.5.1 Device Finder..................................................................................................... 116
15 Glossary of Terms............................................................................................................. 117
16 Notices and Declarations.................................................................................................. 118
16.1 FCC Notices............................................................................................................... 118 16.2 Industry Canada's Interference Causing Equipment Standard for Digital Apparatus 118 16.3 Declaration of Conformity (Model 750T CardBus Sensor Only).............................. 119
17 Copyrights, Trademarks, and Limited Warranty ......................................................... 120

8/8/2019 Spectrum Expert 3.1 Users Guide
http://slidepdf.com/reader/full/spectrum-expert-31-users-guide 14/139
Page xi
Spectrum Expert Users Guide (Version 3.1)
This page left intentionally blank.

8/8/2019 Spectrum Expert 3.1 Users Guide
http://slidepdf.com/reader/full/spectrum-expert-31-users-guide 15/139
Page xii
Spectrum Expert Users Guide (Version 3.1)
List of FiguresFigure 2-1: Spectrum Expert In Action ........................................................................................ 10
Figure 2-2: CardBus Sensor .......................................................................................................... 11 Figure 2-3: The Spectrum Expert Application.............................................................................. 12
Figure 3-1: Wi-Fi and RFID Antennas.......................................................................................... 23
Figure 3-2: How NOT To Disconnect The CardBus Antenna ...................................................... 25
Figure 3-3: Antenna Plug and Jack ............................................................................................... 25
Figure 3-4: The Correct Way to Detach the External Antenna ..................................................... 26
Figure 3-5: Using the Directional Antenna ................................................................................... 26
Figure 3-6: Sensor Hardware Installation Error ........................................................................... 29
Figure 3-7: Successful Sensor Hardware Installation As Shown On Device Manager................ 30
Figure 3-8: Unsuccessful Sensor Hardware Installation As Shown On Device Manager............ 31
Figure 4-1: The Mobile Console ................................................................................................... 34
Figure 4-2: Control Panel .............................................................................................................. 35
Figure 4-3: Spectrum Recording and Playback Controls .............................................................. 41
Figure 4-4: Instant Replay............................................................................................................. 42
Figure 4-5: Instant Replay Settings ............................................................................................... 42
Figure 5-1: Active Devices............................................................................................................ 44
Figure 5-2: Security Alert Icons.................................................................................................... 45
Figure 6-1: Turning A Plot Trace On............................................................................................ 48
Figure 7-1: Power vs. Frequency, FFT, FFT Duty Cycle, and Swept Spectrogram...................... 57
Figure 7-2: Swept Spectrogram Color Mappings For RF Power (top) and Duty Cycle (bottom) 60
Figure 8-1: Spectrum Charts ......................................................................................................... 70
Figure 8-2: Interference Power Chart for Wi-Fi............................................................................ 71
Figure 8-3: Interference Power Chart for RFID ............................................................................ 71
Figure 9-1: Devices View.............................................................................................................. 76
Figure 9-2: Device Control Panel.................................................................................................. 78
Figure 10-1: Channel Summary .................................................................................................... 81
Figure 12-1: Settings – Sensors and Antennas.............................................................................. 92
Figure 12-2: Settings - Console Settings ...................................................................................... 93
Figure 12-3: Settings – Channel Settings (Wi-Fi Shown)............................................................. 94
Figure 12-4: Settings – Regulatory Domains ................................................................................ 95

8/8/2019 Spectrum Expert 3.1 Users Guide
http://slidepdf.com/reader/full/spectrum-expert-31-users-guide 16/139
Page xiii
Spectrum Expert Users Guide (Version 3.1)
Figure 12-5: Settings – Alert......................................................................................................... 97
Figure 12-6: Settings – Active Devices Alerts .............................................................................. 97
Figure 12-7: Settings – Spectrum Alerts ....................................................................................... 98
Figure 12-8: Settings – Channel Summary Alerts......................................................................... 99
Figure 12-9: Settings – SNMP Option ........................................................................................ 101
Figure 14-1: Spectrum Expert Set For Routine Network Monitoring......................................... 113

8/8/2019 Spectrum Expert 3.1 Users Guide
http://slidepdf.com/reader/full/spectrum-expert-31-users-guide 17/139
Page xiv
Spectrum Expert Users Guide (Version 3.1)
This page left intentionally blank.

8/8/2019 Spectrum Expert 3.1 Users Guide
http://slidepdf.com/reader/full/spectrum-expert-31-users-guide 18/139
Page 1
Spectrum Expert Users Guide (Version 3.1)
1 INTRODUCTION
1.1 Purpose
Cognio’s Spectrum Expert monitors the RF spectrum used by a variety of wireless network and
communications technologies, such as Wi-Fi (802.11) WLANs, and RFID Reader/Tag systems.
Spectrum Expert consists of hardware-based Spectrum Sensors and a GUI-based Spectrum Expert application; together, these provide complete visibility of the RF environment in which wireless
network technologies operates.
Other monitoring technologies typically focus on protocol-oriented network data, which only
provides a picture of RF devices that are part of the network (or, in some cases, rogue devices
which are attempting to penetrate network security, or jam the network). Spectrum Expert,
however, is designed to monitor and report on the underlying, physical-layer RF activity, which is
shared by numerous devices that do not share the network protocols. (See Section 2.1.1.2,
Performance on page 8 for a brief list of interfering devices.)
Spectrum Expert can identify nearly all sources of RF activity in the unlicensed bands that wirelessnetworks share with other devices (such as cordless phone and headsets, Bluetooth devices, and
microwave ovens). Based on this data, network engineers can take proactive steps to increase
network performance and security in the face of interferers, network congestion, and security
attacks.
1.2 Spectrum Expert Editions
Cognio’s Spectrum Expert has been released in several different editions:
Spectrum Expert, Enterprise Edition employs multiple stationary Spectrum Sensors, all of
which are connected to a centralized Spectrum Server. In turn, a central Spectrum Expert
Console reports on enterprise-wide spectrum activity.
Spectrum Expert, Mobile Edition is intended to be installed on a laptop computer, and
employs a single CardBus Sensor which is easily installed in the computer. This
portable version of Spectrum Expert is designed for localized, flexible support of network
deployment, monitoring, and trouble-shooting.
In addition, Spectrum Expert is designed to monitor a variety of RF bands, depending on the
application at hand.
Spectrum Expert for Wi-Fi monitors the 2.4 GHz and 5 GHz bands used by 802.11
networks in the Americas, Australia, the Asia/Pacific region, Japan, and Europe.
Spectrum Expert for RFID monitors the 800 MHz and 900 MHz bands used in the
Americas, Europe, and Asia by RFID Readers and Tags.

8/8/2019 Spectrum Expert 3.1 Users Guide
http://slidepdf.com/reader/full/spectrum-expert-31-users-guide 19/139
Page 2 Section 1. Introduction
Spectrum Expert Users Guide (Version 3.1)
1.3 Spectrum Expert, Mobile Edition
This manual documents the applications and operations of Spectrum Expert for Wi-Fi and Spectrum
Expert for RFID, but for the Mobile Edition only. (Cognio provides a separate manual for the
Enterprise Edition.)
Terminology: In this manual we refer, for brevity, simply to Cognio’s Spectrum
Expert. It should be understood that this refers only to the Mobile Edition. Differences between the
Wi-Fi and RFID versions are described in context.
1.3.1 The Cardbus Sensor
The mobile Spectrum Sensor used for the Mobile Edition is referred to as the CardBus Sensor , or
sometimes, in this manual and in the Online Help, simply as the Sensor. There are two versions of
the Sensor, one for Wi-Fi and one for RFID.
1.3.1.1 LEDs
The CardBus Sensor has two LEDS that provide an indication of its operational status. The right
LED is a Power indicator: when the CardBus Sensor is plugged in, the right LED should be solidgreen. The possible states for the other LED, which indicates RF activity (Rx only), are:
Solid Off – The LEDS is solid Off when the on-board software is not running.
Solid On or Blinks Green - It is solid on or blinks GREEN to indicate that the on-board
software is running and there is RF activity.
Occasional Red Blinking - It can blink RED occasionally: if this is constant (persistent) it may
indicate a HW problem but occasional blinks of RED can be expected.
Solid On RED – Solid On and RED can also occur when a CardBus Sensor is plugged in and isa persistent RED until the Driver loads (confirm the Driver has been successfully installed)
after which time it will turn GREEN.
1.3.2 Wi-Fi Vs. RFID Applications
There are significant differences between the Spectrum Expert for Wi-Fi and Spectrum Expert for
RFID applications, including differences in the Console’s graphical user interface (GUI). In terms
of physical RF monitoring capabilities, the difference between the Wi-Fi and RFID applications is
derived from hardware differences in the CardBus Sensor. Cognio distributes two different
Sensors, which are tuned to the 2.4 GHz and 5 GHz bands for Wi-Fi or to the 800 MHz and 900MHz bands for RFID.
Integrated Software and Hardware – Spectrum Expert combines a CardBus Sensor and
Spectrum Expert Application software within a single PC. (While Spectrum Expert can, in
fact, be installed in a desktop computer, it is typically used in a notebook PC.)
Auto-Sensor Detection – Spectrum Expert automatically detects the Sensor in use (Wi-Fi
or RFID), and the Console interface automatically adapts to reflect the application at
hand.

8/8/2019 Spectrum Expert 3.1 Users Guide
http://slidepdf.com/reader/full/spectrum-expert-31-users-guide 20/139
Page 3
Spectrum Expert Users Guide (Version 3.1)
Some features of Spectrum Expert — certain charts, various metrics — are specific to Wi-Fi. Wi-Fispecific charts, metrics, etc. are only supported when a Wi-Fi Sensor is inserted.
1.3.3 Spectrum Bands
Spectrum Expert supports various bands for spectrum monitoring.
Product Bundle Cardbus Sensor Abbreviated
Band Reference
Actual Bands
Supported
Wi-Fi Model 750T 2.4 GHz
5 GHz
2.4-2.5 GHz
4.9-5.9 GHz
RFID Model 750L 800 MHz
900 MHz
865-870 MHz
901.5-928.5 MHz
950-956 MHz
Spectrum Experts provides a detailed, default channelization scheme for each supported band.
In addition, you can define your own channelization scheme. Channelization is discussed further
in Section 12, Local Settings on page 91.
1.3.4 The Users Guide and Console Online Help
This manual is intended primarily to provide an overview of Spectrum Expert and its principalfeatures. While many detailed operating instructions are found in this manual, additional detail is
provided for some features in the Spectrum Expert Application Online Help system.
This document, along with the Cognio CardBus Sensor Quick Start Guide, does provide all
necessary information for network engineers to install Spectrum Expert, including information on
how to install the Spectrum Expert CardBus Sensor in your notebook PC. This manual also
describes how to operate Cognio’s Spectrum Expert Application software in order to configure
Spectrum Expert operations. Finally, the manual describes the comprehensive RF data displayed bythe Spectrum Expert Application.
1.3.5 Product Bundles
The following items are shipped with each product bundle:
1.3.5.1 Spectrum Expert for Wi-Fi Bundle
One Model 750 Cardbus Sensor
One Spectrum Expert software CD containing
Spectrum Expert Application
Spectrum Expert Users Guide
One Spectrum Expert Application software license
One 2.4-2.5, 4.9-5.9 GHz external omni-directional antenna and antenna clip
Quick-Start Guide

8/8/2019 Spectrum Expert 3.1 Users Guide
http://slidepdf.com/reader/full/spectrum-expert-31-users-guide 21/139
Page 4 Section 1. Introduction
Spectrum Expert Users Guide (Version 3.1)
1.3.5.2 Spectrum Expert for RFID Bundle
One Model 751 Cardbus Sensor
One Spectrum Expert software CD containing
Spectrum Expert Application
Spectrum Expert Users Guide
One Spectrum Expert Application software license
One 850-960 MHz external omni-directional antenna and antenna clip
Quick-Start Guide
Removing the External Antenna – For both the Wi-Fi and RFID version, the
external antenna attachment is a potentially sensitive component, which is easily damaged.
In particular, care must be taken when removing (disconnecting) the external antenna. See
Section 3.3 on page 22 for more information.
1.4 System Requirements
The following are the hardware requirements for installing and running Spectrum Expert:
Notebook computer with Pentium series processor running at 1 GHz or faster
Windows XP, Windows Vista or Windows 2000 (Service Pack 4 or higher) operating
systems
256 MB of RAM required (512 MB strongly recommended)
Display resolution of 800 x 600 or higher (1024 x 768 recommended)
30 MB free disk space
Available CardBus slot
For Spectrum Expert for Wi-Fi, an 802.11 card or onboard 802.11 capability in order to
monitor Wi-Fi devices.
1.4.1 Using Spectrum Expert With Other Onboard PC Technologies
If your computer has an 802.11 card, built-in 802.11 capability, or other RF
transmission technology, make sure it is not transmitting when you use Spectrum Expert For
Wi-Fi. The 802.11 capability should be enabled (in order to detect Wi-Fi devices), but should
not be actively transmitting to, or connected with, an AP or Ad-Hoc network. See Section 3.6
on page 32 for more information.
1.4.1.1 Other Monitoring Technologies
Spectrum Expert For Wi-Fi can share your notebook PC with some other passive monitoring
technologies. Spectrum Expert For Wi-Fi can run concurrently with WildPackets AeroPeek,
AirMagnet Laptop Analyzer, or AirMagnet Surveyor, without an inappropriate degradation in
product performance. (This assumes that your laptop can accommodate the required number of
CardBus cards.)

8/8/2019 Spectrum Expert 3.1 Users Guide
http://slidepdf.com/reader/full/spectrum-expert-31-users-guide 22/139
Page 5
Spectrum Expert Users Guide (Version 3.1)
Use In Passive Mode Only – Some of these other monitoring technologies (such as
AirMagnet Surveyor) also have “active” survey or monitoring modes, where they transmit packets
to nearby APs. Once again, if you have such a card installed in the same PC with Spectrum Expert
For Wi-Fi, it is important you do not use these active, transmission modes, since they will interfere
with the proper operation of Spectrum Expert For Wi-Fi.
Complementary Products – The products indicated above — AeroPeek, Laptop
Analyzer, and Surveyor — offering monitoring capabilities which are complementary to those
provided by Spectrum Expert. While these products offer more extensive 802.11 information thanthat provided by Cognio’s product, they do not offer anywhere near the depth of physical layer (RF
emissions data) provided by Spectrum Expert. In particular, they do not provide the identification
of interfering devices, nor do they provide anything comparable to Spectrum Expert’s spectrum
plotting and related data (such as duty cycle measurements and other measures of overall RF
activity).
1.4.1.2 Concurrent 802.11 (Wi-Fi) Protocol Support
The Spectrum Expert application detects if Wi-Fi support is present in the PC, either on the systemboard or as another CardBus card. If so, and if you are using Spectrum Expert for Wi-Fi, the
software will provide basic support for 802.11 protocol monitoring in the Devices View (Section 0
on page 72) and Device Finder (Section 11 on page 83).
1.4.1.3 Concurrent Spectrum Expert, Enterprise Edition Support
You can install, on the same PC, both Spectrum Expert, Mobile Edition, and Spectrum Expert,
Enterprise Edition. You can also run both programs at the same time.
1.5 Conventions in This Manual
The following text conventions are used in this manual.
1.5.1 Keywords, Key Concepts, and Definitions
Any important terms or key concepts we introduce in this manual are highlighted in boldface:
Network Devices – APs, IBSS, and Stations which are part of your network.
Rogue Devices – APs which are not part of your network, but which are attempting to
penetrate or participate in your network for “unfriendly” purposes.
Newly defined terms are introduced in italics.
1.5.2 Screen Text
Any text which is displayed as part of a Spectrum Expert Application display screen — including
menu selections, text for option buttons and check boxes, list column headers, etc. — is quoted in
this manual using a bold, sans-serif font. For example, a discussion of choices for different Sensor
options would be shown in this guide as:

8/8/2019 Spectrum Expert 3.1 Users Guide
http://slidepdf.com/reader/full/spectrum-expert-31-users-guide 23/139

8/8/2019 Spectrum Expert 3.1 Users Guide
http://slidepdf.com/reader/full/spectrum-expert-31-users-guide 24/139
Page 7
Spectrum Expert Users Guide (Version 3.1)
If you are using Spectrum Expert for RFID applications, you can expect that your Console displaywill vary slightly from some of the images shown here.
Depending on how you configure Spectrum Expert, you may also find that your menus
(for example, for the Spectrum Plots) display other band options than those illustrated.
See Section 12, Local Settings on page 91.
8/8/2019 Spectrum Expert 3.1 Users Guide
http://slidepdf.com/reader/full/spectrum-expert-31-users-guide 25/139
Page 8 Section 2. Overview: Cognitive Spectrum Analysis & Spectrum Expert
Spectrum Expert Users Guide (Version 3.1)
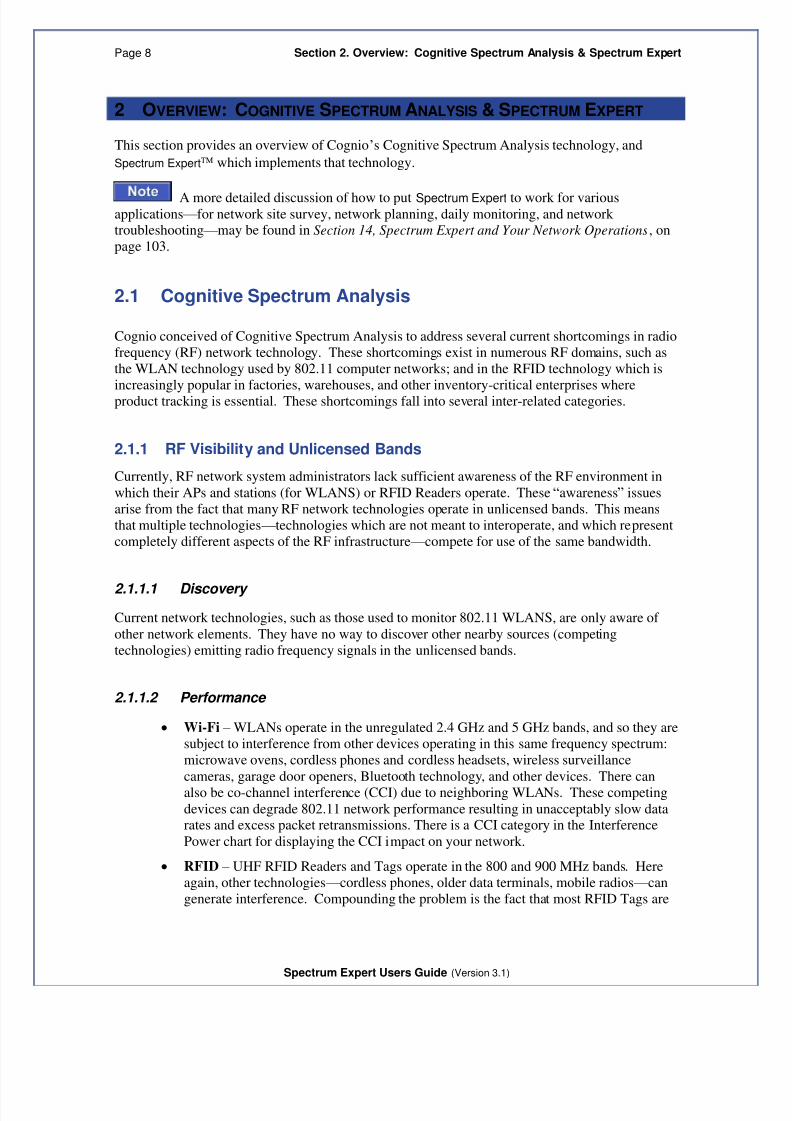
2 OVERVIEW: COGNITIVE SPECTRUM ANALYSIS & SPECTRUM EXPERT
This section provides an overview of Cognio’s Cognitive Spectrum Analysis technology, and
Spectrum Expert which implements that technology.
A more detailed discussion of how to put Spectrum Expert to work for variousapplications — for network site survey, network planning, daily monitoring, and network troubleshooting — may be found in Section 14, Spectrum Expert and Your Network Operations, on
page 103.
2.1 Cognitive Spectrum Analysis
Cognio conceived of Cognitive Spectrum Analysis to address several current shortcomings in radio
frequency (RF) network technology. These shortcomings exist in numerous RF domains, such as
the WLAN technology used by 802.11 computer networks; and in the RFID technology which is
increasingly popular in factories, warehouses, and other inventory-critical enterprises where
product tracking is essential. These shortcomings fall into several inter-related categories.
2.1.1 RF Visibility and Unlicensed Bands
Currently, RF network system administrators lack sufficient awareness of the RF environment in
which their APs and stations (for WLANS) or RFID Readers operate. These “awareness” issues
arise from the fact that many RF network technologies operate in unlicensed bands. This means
that multiple technologies — technologies which are not meant to interoperate, and which represent
completely different aspects of the RF infrastructure — compete for use of the same bandwidth.
2.1.1.1 Discovery
Current network technologies, such as those used to monitor 802.11 WLANS, are only aware of
other network elements. They have no way to discover other nearby sources (competing
technologies) emitting radio frequency signals in the unlicensed bands.
2.1.1.2 Performance
Wi-Fi – WLANs operate in the unregulated 2.4 GHz and 5 GHz bands, and so they are
subject to interference from other devices operating in this same frequency spectrum:
microwave ovens, cordless phones and cordless headsets, wireless surveillance
cameras, garage door openers, Bluetooth technology, and other devices. There can
also be co-channel interference (CCI) due to neighboring WLANs. These competing
devices can degrade 802.11 network performance resulting in unacceptably slow datarates and excess packet retransmissions. There is a CCI category in the Interference
Power chart for displaying the CCI impact on your network.
RFID – UHF RFID Readers and Tags operate in the 800 and 900 MHz bands. Here
again, other technologies — cordless phones, older data terminals, mobile radios — can
generate interference. Compounding the problem is the fact that most RFID Tags are

8/8/2019 Spectrum Expert 3.1 Users Guide
http://slidepdf.com/reader/full/spectrum-expert-31-users-guide 26/139
Page 9
Spectrum Expert Users Guide (Version 3.1)
passive devices – they have no built-in power source, and instead can only transmit byrelying on RF energy “borrowed” from nearby Readers.
As a result, there is essentially no transmit/receive error-checking. If a Tag is at a distance which
places it outside the RF range of a Reader — or if the signal from a Tag is buried under RF
interference from competing devices — then the Tag is effectively silent. While 802.11 WLAN
devices engage in an active dialog, and can retransmit failed packets, an RFID Reader has no wayto know that it failed to a read an RFID Tag. As a result, undiagnosed RF interference can have
mission-critical impact on the RFID system.
2.1.1.3 Troubleshooting
Wi-Fi – Current WLAN technologies are aware of network devices, so they can
determine if there is excess load on the network from network stations. But current
technologies cannot see the whole RF spectrum in the unlicensed band, and so cannot
identify sources of RF activity which can cause dropped network connections and
other problems.
RFID – In the RFID domain, there currently exist essentially no “sniffer” devices of
any kind. As a result, network engineers are not only blind to sources of interference;
they cannot even gauge the performance of RFID Readers!
2.1.1.4 Summary
In a nutshell, current 802.11 (Wi-Fi) technologies only offer protocol-level awareness, but not
physical layer (RF) awareness. Lacking full RF spectrum awareness, existing WLANs cannot
apply appropriate, adaptive responses to improve performance in the face of interferers and
competing networks.
In the RFID domain, there currently does not exist technology for either protocol or physical layer
monitoring of the network environment. This means the network engineer cannot evaluate theeffectiveness of the RFID Reader distribution in the network environment, and the network engineer is equally blind to the possible impact of RF interferers.
2.1.2 Spectrum Expert: Mitigation and Performance Enhancement
Cognio’s Spectrum Expert includes sophisticated technology to detect and classify sources of RF
activity. Using this data, network engineers can take a variety of actions to enhance both Wi-Fi
WLAN and RFID performance and reliability:
2.1.2.1 Clean Channels If a certain part of the frequency spectrum is in constant use by other devices, the network engineer
can program the network to not transmit over those channels. Conversely, by deliberately
searching for “clean” channels, the network devices can be set to broadcast over those channels.
8/8/2019 Spectrum Expert 3.1 Users Guide
http://slidepdf.com/reader/full/spectrum-expert-31-users-guide 27/139
Page 10 Section 2. Overview: Cognitive Spectrum Analysis & Spectrum Expert
Spectrum Expert Users Guide (Version 3.1)
2.1.2.2 Identifying, Locating, and Removing Interferers
Cognio’s Spectrum Expert can identify the types of devices which are introducing RF interference.
An interferer is any non-network RF device which broadcasts in the same frequency bands as
network devices, and which can cause disruption to your network. For example, in the 802.11
domain, typical interferers include microwave ovens, cordless headphones and headsets, 802.11 FH
devices, and Bluetooth devices. Again, the network engineer is alerted to the presence of thesedevices, and can take steps to address the problem (including relocating or shutting off such
devices).
With Spectrum Expert, the network engineer can not only identify interferers, but can also use
Spectrum Expert’s Device Finder mode, which makes the Spectrum Expert-enabled computer into a
lightweight homing device to track down the precise location of the signal source. (See Section 11,
Device Finder on page 83.)
The optional directional antenna, available from Cognio, can help with determining the
location of Wi-Fi devices.
2.1.2.3 Device Specific Solutions
By knowing the ID of specific interfering devices, custom solutions can also be tailored to specific
technologies, and even specific brands of specific technologies.
2.2 The Spectrum Expert Solution
Cognio’s Spectrum Expert is a combined hardware and software technology which implements
Cognio’s Cognitive Spectrum Analysis technology. Spectrum Expert makes the 802.11 WLAN andthe RFID system “spectrum savvy”, ensuring greatly increased reliability and performance.
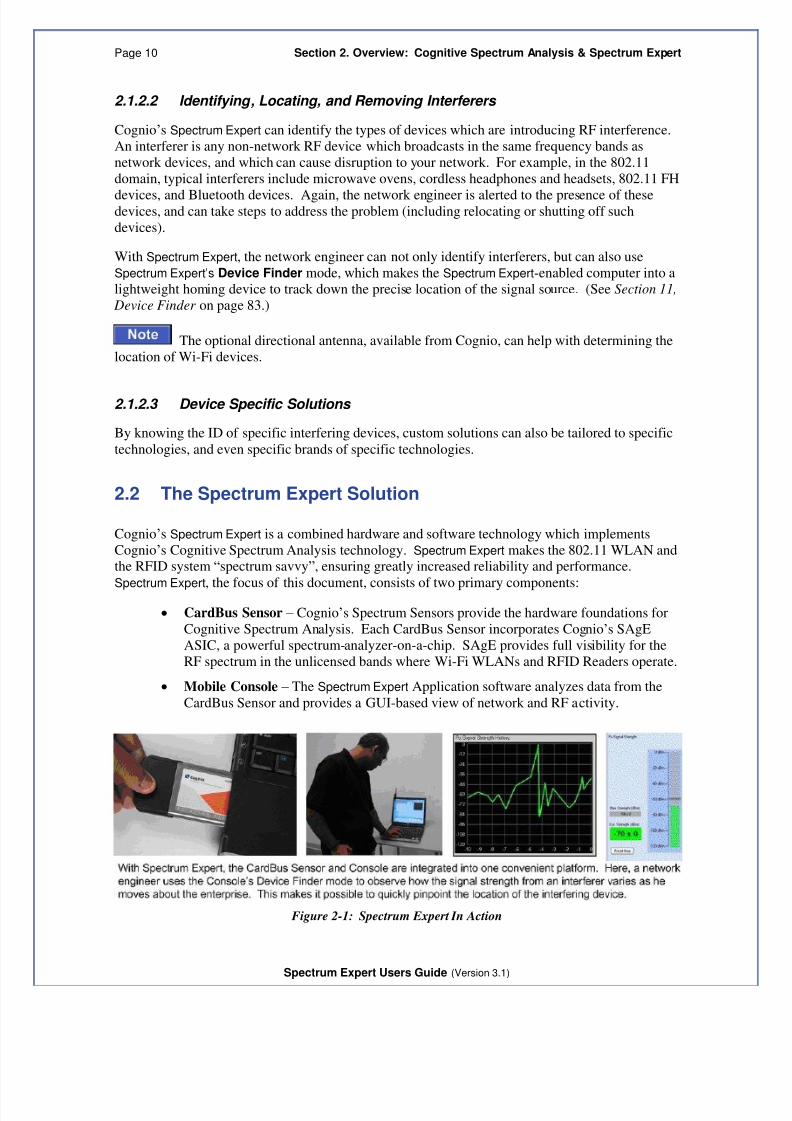
Spectrum Expert, the focus of this document, consists of two primary components:
CardBus Sensor – Cognio’s Spectrum Sensors provide the hardware foundations for
Cognitive Spectrum Analysis. Each CardBus Sensor incorporates Cognio’s SAgE
ASIC, a powerful spectrum-analyzer-on-a-chip. SAgE provides full visibility for the
RF spectrum in the unlicensed bands where Wi-Fi WLANs and RFID Readers operate.
Mobile Console – The Spectrum Expert Application software analyzes data from the
CardBus Sensor and provides a GUI-based view of network and RF activity.
Figure 2-1: Spectrum Expert In Action

8/8/2019 Spectrum Expert 3.1 Users Guide
http://slidepdf.com/reader/full/spectrum-expert-31-users-guide 28/139
Page 11
Spectrum Expert Users Guide (Version 3.1)
2.2.1 Spectrum Sensors
As a first step in the spectrum analysis process, the ambient RF
environment must be scanned and analyzed to determine the
sources of RF activity in the neighborhood of the network,
especially causes of interference or other problems.
The essential internal components of a Sensor include:
Radio – The radio transceiver detects the RF
spectrum and feeds this data to SAgE. Figure 2-2: CardBus Sensor
SAgE – Cognio’s Spectrum Analysis Engine, SAgE, performs a Fast Fourier
Transform (FFT) of the RF spectrum, and provides the feed of low-level data
concerning the behavior of the RF spectrum. Low-level data includes basic
information on the power vs. frequency in the spectrum at a given instant, and
information on individual pulses in the RF spectrum.
SAgE also performs on-board statistical analysis of the spectrum, and statistical analysis of RF
pulses (which relieves external MCUs or CPUs of this processor-intensive task).
CPU – To be fully useful, data from the CardBus Sensor requires further software
analysis from a microprocessor. The CardBus Sensor borrows some of the processing
power from the PC’s microprocessor (CPU) to perform these calculations. The CPU,running Cognio’s proprietary software, provides low-level analysis of the data stream.
The analysis engines include:Measurement Engine – Aggregates SAgE data, and normalizes it into meaningful units.
Classification Engine – Identifies specific types of interferers (Bluetooth devices, microwave
ovens, cordless phones and headsets, radar, etc.).
2.2.2 The Spectrum Expert Application
The Spectrum Expert Application runs under Windows XP (Service Pack 2 or later) or Windows
Vista operating systems. The Console provides the interface — the GUI — which connects thenetwork engineer with the resources available from the CardBus Spectrum Sensor:

8/8/2019 Spectrum Expert 3.1 Users Guide
http://slidepdf.com/reader/full/spectrum-expert-31-users-guide 29/139
Page 12 Section 2. Overview: Cognitive Spectrum Analysis & Spectrum Expert
Spectrum Expert Users Guide (Version 3.1)
Spectrum Views – Provides plots and charts that
offer a direct view into the RF spectrum, includingmeasurements of RF power and network device
activity. The plots are especially useful to trained
RF engineers; while the charts are informative for
the expert RF engineer, and the generalist network
engineer, alike. See Section 7 on page 55 andSection 8 on page 69.
Active Devices – Displays all currently active
devices in the network neighborhood, including both
network devices and interferers. See Section 5 on
page 44.
Figure 2-3: The Spectrum Expert
Application
Devices – Provides detailed information on both current and historical device activity.
See Section 0 on page 72.
Channel Summary – Provides a statistical overview of RF activity (such as power
levels and number of interferers present) on a per-channel basis. This view gives you
an instant picture of which channels are subject to excess interference, and whichchannels have the best potential for trouble-free network activity. See Section 10 on
page 81.
Device Finder – In Device Finder mode, Spectrum Expert is a convenient, user-
friendly RF “sniffer”, optimized for displaying RF power data in a way that quickly
enables the network engineer to track down interfering devices. See Section 11 on
page 83.
Tools – Supports configuration of Spectrum Expert. See Section 12 on page 91.
For brevity, we generally refer to the Spectrum Expert System Application as the
Spectrum Expert, or the CardBus Sensor simply as the Sensor.
2.2.3 Spectrum Expert Online Help
Detailed reference information is found in Spectrum Expert Online Help system, which can be
accessed by selecting <F1>, or selecting Help Help Topics.
2.3 Spectrum Expert Operating Scenarios
Spectrum Expert can be used in several different ways, as described here in summary form.
Detailed instructions on putting Spectrum Expert to use for real-world applications are
presented in Section 14, Spectrum Expert and Your Network Operations on page 103.
2.3.1 Firefighting Mode
Critical Tasks:
Identify problems in the RF environment
Diagnose the problem as quickly as possible

8/8/2019 Spectrum Expert 3.1 Users Guide
http://slidepdf.com/reader/full/spectrum-expert-31-users-guide 30/139
Page 13
Spectrum Expert Users Guide (Version 3.1)
Resolve the problem
Centerpiece Applications:
Spectrum Charts
Devices View
Device Finder
Channel Summary
Typically, the IT Administrator will have the Spectrum Expert Application up and running, with the
Channel Summary or one or more Spectrum Plots and Spectrum Charts in view. Spectrum
Charts, in particular, are an important resource for detecting problems that may stress the network.
The Channel Utilization chart can indicate when one or more channels are becoming
overloaded with devices.
The Channel Utilization chart can indicate when one or more channels have an overall
excess of RF activity, which may be due either to device overload, or interferers, or
both.
Once a problem occurs, the Administrator goes into action to determine the cause of the problem.Through a combination of the Devices View, Channel Summary, and the Device Finder, the
Administrator can pinpoint and isolate the source of the problem. If the solution is not obvious (for
example, remove an interfering device), he may turn to an RF expert to help him arrive at a
solution. (An RF expert can take further advantage of the more detailed information in the
Spectrum Plots.) The key point is that the Administrator is notified before the problem has
progressed too far, so he can take proactive measures. This eliminates frustrated calls from
management.
For example, in the Channel Summary the Administrator might notice two interfering devices
causing interference on channel 6. He might further observe a heavy Duty Cycle on channel 6, asseen on the Channel Utilization chart. The Administrator can then use the Device Finder to locate
the interfering devices, and then shut them off, relocate them, shield them, etc.
2.3.2 RF Expert
An RF expert is an individual with an advanced knowledge of radio frequency technology, and its
associated physics and electronics. He or she is an individual who is conversant with the use of
spectrum analyzers, as well as the inner workings of wireless network systems. Such an individual
is most likely to be at work at installations where the wireless system is considered mission critical.
The RF Expert uses Spectrum Expert as a 24 hour-per-day, 7-day-per-week spectrum analysis tool.
Critical Tasks:
Investigate reported spectrum events at the raw RF level. Review raw RF data for cases that are unclassified by Spectrum Expert.
Confirm that recommended solutions have alleviated the problem
Centerpiece Application: Spectrum Analyzer Plots

8/8/2019 Spectrum Expert 3.1 Users Guide
http://slidepdf.com/reader/full/spectrum-expert-31-users-guide 31/139
Page 14 Section 2. Overview: Cognitive Spectrum Analysis & Spectrum Expert
Spectrum Expert Users Guide (Version 3.1)
The RF Expert primarily uses the detailed Spectrum Analyzer plotting capabilities of Spectrum
Expert’s Spectrum Plots. When he is called in on a problem, he uses the Spectrum Plots to
confirm and/or supplement the intelligence capabilities built into Spectrum Expert.
For example, if Spectrum Expert reports that a video interference signal is occurring, the RF expert
may wish to view the Power Vs. Frequency and Real Time FFT plots to confirm that it is not
some other type of device. In addition, there will always be cases where Spectrum Expert does notrecognize the type of interference at work. In that case, the human intelligence of the RF expert
helps fill in the missing gaps.
Another critical use of the Spectrum Analyzer capabilities is to confirm when a problem has been
fixed by corrective action. When a fix has been attempted, the IT department can’t afford to wait
until the next day to see that no problems re-surface. The RF expert can use the Spectrum
Analyzer functions to perform before-and-after comparisons that confirm that a fix (for example,
shielding was placed around an interference device) has indeed fixed the problem. These
comparisons are enabled by Spectrum Expert’s record/playback capabilities. (See Section 4.7,
Spectrum Recording and Playback on page 40, and Section 4.8, Instant Replay on page 41.)
2.3.3 Site Survey / Network Install and Initial Configuration
Spectrum Expert is an invaluable tool for supporting pre-installation Wi-Fi and RFID site surveys,
and also for the initial installation and configuration of a WLAN or RFID system.
Critical Tasks:
Set channel usage for Wi-Fi APs
Deploy Wi-Fi APs for effective coverage
Deploy RFID Readers for effective coverage
Pre-emptive interference mitigation
Centerpiece Applications: Spectrum Plots and Charts
Device Finder
Channel Summary
Devices View
Spectrum Expert can be used prior to deployment of a Wi-Fi WLAN or RFID network, to obtain
information which is essential for planning an optimum deployment.
Band and Channel Allocations: Spectrum Expert can determine which bands and/or
channels have the most RF activity. Wi-Fi APs can then be programmed to use other
channels, resulting in higher speed transmissions, and reduced packet retransmissions.
Pre-emptive Interference Mitigation: Any interferers which are discovered to becontributing significant RF activity can be moved, de-activated, or shielded, before
putting the WLAN or RFID system into operation.
AP/Reader Placement: As a lightweight, mobile RF probe, Spectrum Expert can
determine which general areas have the highest level of RF activity — as determined by
the Devices View, the Device Finder, and the Spectrum Plots and Charts — and
therefore require the most APs or RFID Readers for adequate network coverage.

8/8/2019 Spectrum Expert 3.1 Users Guide
http://slidepdf.com/reader/full/spectrum-expert-31-users-guide 32/139
Page 15
Spectrum Expert Users Guide (Version 3.1)
In addition, for RFID systems, Spectrum Expert can be used to assess area coverage — checking,that is, that every location within the network ’s physical space is within RF range of at least
one AP or one RFID Reader.
2.4 Technical Concepts
Spectrum Expert is designed to make the RF spectrum accessible even to non-experts — people who
are not RF engineers or physicists — by performing a tremendous amount of high-level analysis on
behalf of the user. For example, Spectrum Expert can classify interfering devices, sparing the user
the necessity of interpreting a spectrum graph to determine which kinds of interfering devices are
present.
At the same time, Spectrum Expert does make a wealth of technical information available to the
user, and some familiarity with RF concepts is helpful. Neither this manual nor the online Help
system attempts to present a detailed discussion of radio frequency theory, but a few concepts are
worth some brief clarification.
2.4.1 Duty Cycle
Among the various measures of RF power, Spectrum Expert includes the ability to measure and
report on the RF duty cycle. Duty cycle is a general term which relates to how much RF energy is
present in the spectrum, as measured not by raw RF power (that is, not in watts or dBm); but rather
in terms which indicate how much RF power is present in some operational or functional sense.
The goal is to have a measure of RF power which suggests how much impact the RF power will
have on network performance. Spectrum Expert uses two different measures of duty cycle:
The percentage of the time that the RF signal is 20 dB above the noise floor.
The percentage of the time a transmission from a known device is present in the
channel or band.
Throughout this manual we indicate which measure of RF power is used by various Spectrum
Expert Console display modes. The Online Help also has a topic (Duty Cycle, in the Background
Information folder) which compares the usage of duty cycle in various contexts in the Spectrum
Expert application.
2.4.2 Device Classifiers
You, as the user, make the vital distinction between network devices (Wi-Fi or RFID) and
interferers. In addition, the Spectrum Expert Application supports this distinction, in terms of how
data is structured and classified on the Console display. However, the underlying technology used
to detect and classify both network devices and interferers is the same. Cognio has developedadvanced classifier algorithms, which run on the processor on your laptop PC. These classifier
algorithms use the spectrum data from SAgE (discussed above) to categorize devices which are
part of your network, or which can interfere with your network.
2.4.2.1 Wi-Fi Classifiers
The classifiers supported in Spectrum Expert For Wi-Fi 3.1 include:

8/8/2019 Spectrum Expert 3.1 Users Guide
http://slidepdf.com/reader/full/spectrum-expert-31-users-guide 33/139
Page 16 Section 2. Overview: Cognitive Spectrum Analysis & Spectrum Expert
Spectrum Expert Users Guide (Version 3.1)
Wi-Fi APs
In-Network
Known
Unknown
Ad Hocs
Wi-Fi Stations A wide variety of Bluetooth devices
A wide variety of cordless phones
Cordless Phone, 2.4/5.8 GHz, DECT1
Cordless Phone, 2.4/5.8 GHz, DECT2
Cordless Phone, 5.8 GHz, DECT3
Cordless Phone, 2.4 GHz, TDD/Fixed Channel variant 1
Cordless Phone, 900 MHz, FHSS variant 1
Microwave Ovens
Generic Fixed Frequency
Generic Frequency-Hopped Generic Continuous transmitters (e.g., FM Phones, NTSC, etc.)
RF Jamming devices
802.11FH devices
Analog Video
2.4.2.2 RFID Classifiers
The 900 MHz classifiers supported in Spectrum Expert For RFID 3.1 include:
Three of the most commonly used RFID Readers
Five of the most popular 900 MHz cordless phones
900 MHz analog video signals
Outdoor 900 MHz p2p, p2mp signals
2.4.2.3 Generic Device Classifiers
Spectrum Expert supports the ability to classify “generic” devices. Generic devices cannot be
linked to a specific device type, manufacturer or transmission protocol. They are identified by their
physical layer transmission characteristics. An example of such a device is a cordless phone that
uses an unrecognized transmission protocol to exchange data with its base station (i.e., a phone that
doesn’t use Bluetooth, 802.11FH, TDD or DECT).
The following list of generic signals recognized by Spectrum Expert 3.1 is subject to revision
without notice:
Pulse Type Analog orDigital
Modulation Type Output Parameters
Continuous Digital FSK RMS power, bandwidth, coarse and fine CF1
Continuous Digital OFDM RMS power, bandwidth

8/8/2019 Spectrum Expert 3.1 Users Guide
http://slidepdf.com/reader/full/spectrum-expert-31-users-guide 34/139
Page 17
Spectrum Expert Users Guide (Version 3.1)
Pulse Type Analog orDigital
Modulation Type Output Parameters
Continuous Analog FM RMS power, bandwidth, coarse and fine CF
Continuous Analog CW RMS power, coarse and fine CF
Burst Digital FSK RMS power, bandwidth, symbol rate, coarse and fineCF, burst period
Burst Digital OFDM RMS power, bandwidth, burst duration1CF = center frequency, PAP = peak-to-average power
In the Active Devices List, these devices will be identified via a hierarchical listing which will
indicate the pulse type, modulation type, and possibly the frequency. For example:
Generic Devices [5]Burst, Fixed Frequency [3]
Channel Group @ 2431.3 MHz [2]Device 1 (FSK)Device 2 (FSK)
Channel Group @ 2434.3 MHz [1]
Device 1 (FSK)Continuous [2]
Device 4 (CW) @ 2430.1 MHzDevice 7 (FSK) @ 2440.1 MHz
The bracketed numbers indicate the number of devices.
A similar naming scheme is used in the Devices View.
2.4.3 Interferers: Classified (Named), Generic, and Unclassified
As indicated in Section 2.4.2 on page 15 immediately above, Spectrum Expert classifies many
different interferers –
that is, devices which are not network devices, but which produce RF powerin frequency bands that affect your network. For purposes of Spectrum Expert operations, there are
three broad categories of interfering devices:
2.4.3.1 Classified Named Interferers
For many interfering devices, Spectrum Expert can detect and classify the type of device, in some
cases to the extent that it can name the specific model of device in question. So, for example,
Spectrum Expert will not only identify an interferer as being a Bluetooth device, it will also indicate
a brand name and model. However, for our purposes, a “named” device is one for which Spectrum
Expert can indicate the category of operation (Bluetooth, microwave oven, cordless phone, etc.).
The user interface displays a picture of a typical device that matches the RF signature when a user
double-clicks on a device in the Active Devices pane or Devices View.
2.4.3.2 Classified Generic Interferers
These are devices for which Spectrum Expert has a great deal of technical information about the
signal from the device, such that the general nature of the RF emitter can be identified. However,the Spectrum Expert system does not present a name (such as DECT2, or Bluetooth); and Spectrum
Expert does not present a list of devices (product names) that can be in this category.

8/8/2019 Spectrum Expert 3.1 Users Guide
http://slidepdf.com/reader/full/spectrum-expert-31-users-guide 35/139
Page 18 Section 2. Overview: Cognitive Spectrum Analysis & Spectrum Expert
Spectrum Expert Users Guide (Version 3.1)
For the generic devices, Spectrum Expert provides the kind of signal details indicated in the table in
Section 2.4.2.3 on page 16, above. In fact, what Spectrum Expert essentially provides are detailed
parameters about the RF signal from the device, rather than about the device per se.
Example: In the case of “Continuous Transmitter FSK”, “Continuous” means the device transmits
continually rather than in bursts; “FSK” refers to the signal modulation. (“FSK” stands for
Frequency Shift Keying.) Specific devices, such as DECT2 devices, are also “continuous FSK” transmitters; but if Spectrum Expert does not identify the interferer as, say, DECT2, it’s because
other expected transmission properties of DECT2 devices were not detected. Hence, Spectrum
Expert only provides the broader, generic classification based on the type of signal.
2.4.3.3 Unclassified Interferers
An “unclassified interferer” is literally one that Spectrum Expert does not classify. That means it is
not identified, as a device per se, anywhere on the screen (such as in the Devices View or the
Active Devices list). It also means the device is not included in counts of devices. On the
Channel Summary display, the Interferer Duty Cycle field does not include measurements of unclassified interferers.1 However, Spectrum Expert still does see RF energy from unclassified
interferers. See the following note.
The plots and charts which show RF power (Real Time FFT, Power vs. Frequency,
and the Swept Spectrogram) or duty cycle (FFT Duty Cycle, Channel Utilization, Channel
Utilization vs. Time, and Swept Spectrogram) do show all RF power / duty cycle detected by the
CardBus Sensor, regardless of the source. So, power/duty cycle from unclassified interferers is
also included.
Naturally, Cognio tries to minimize the number of interferers that Spectrum Expert cannot classify
at all.
1The Interferer Duty Cycle on the Channel Summary is an estimate of the percentage of the time that a
transmission is present in the channel or band. To be included in this estimate, the transmission must be
associated with a known, identified device. So, transmissions from unclassified interferers are automatically
excluded. In addition, it is possible that there may be some transmissions from generic interferers which
Spectrum Expert cannot actually identify as belonging to those devices. Those transmissions are also not
included in the Interferer Duty Cycle shown on the Channel Summary.
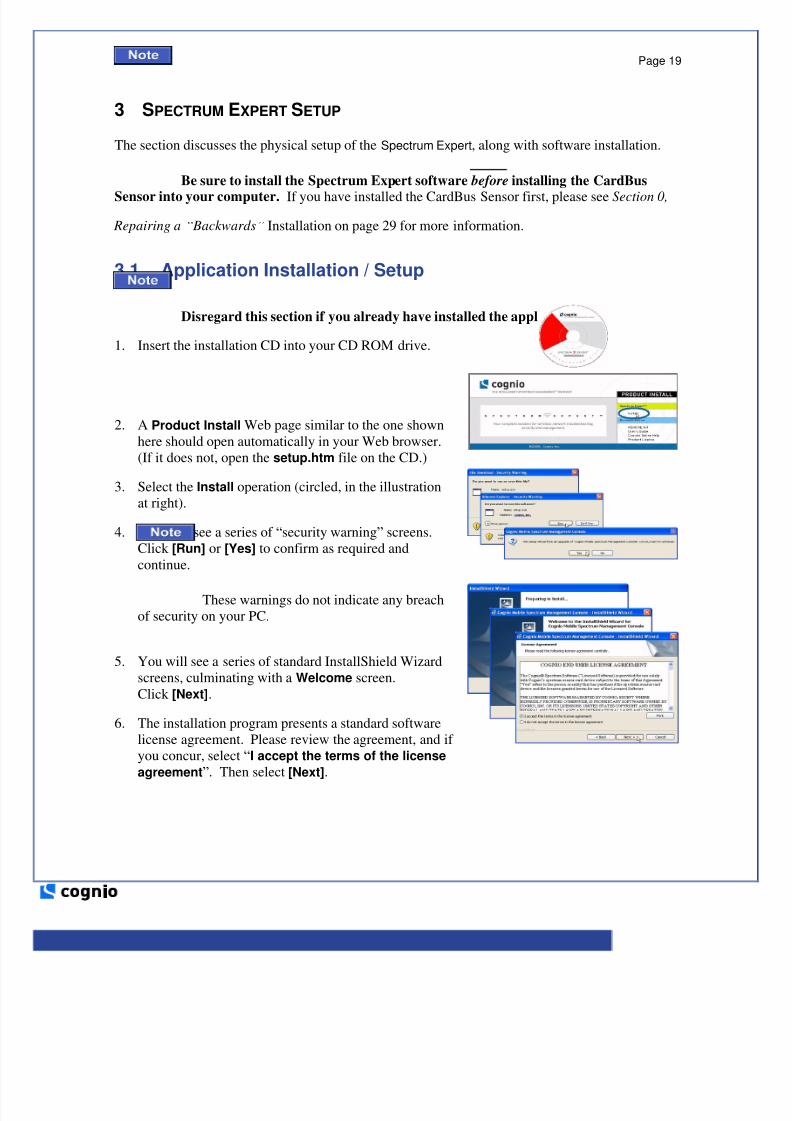
8/8/2019 Spectrum Expert 3.1 Users Guide
http://slidepdf.com/reader/full/spectrum-expert-31-users-guide 36/139
Page 19
Spectrum Expert Users Guide (Version 3.1)
3 SPECTRUM EXPERT SETUP
The section discusses the physical setup of the Spectrum Expert, along with software installation.
Be sure to install the Spectrum Expert software before installing the CardBus
Sensor into your computer. If you have installed the CardBus Sensor first, please see Section 0,
Repairing a “ Backwards” Installation on page 29 for more information.
3.1 Application Installation / Setup
Disregard this section if you already have installed the application.
1. Insert the installation CD into your CD ROM drive.
2. A Product Install Web page similar to the one shown
here should open automatically in your Web browser.
(If it does not, open the setup.htm file on the CD.)
3. Select the Install operation (circled, in the illustration
at right).
4. You may see a series of “security warning” screens.
Click [Run] or [Yes] to confirm as required and
continue.
These warnings do not indicate any breach
of security on your PC.
5. You will see a series of standard InstallShield Wizard
screens, culminating with a Welcome screen.
Click [Next].
6. The installation program presents a standard software
license agreement. Please review the agreement, and if
you concur, select “I accept the terms of the license
agreement”. Then select [Next].

8/8/2019 Spectrum Expert 3.1 Users Guide
http://slidepdf.com/reader/full/spectrum-expert-31-users-guide 37/139
Page 20 Section 3. Spectrum Expert Setup
Spectrum Expert Users Guide (Version 3.1)
7. Enter your User Name and Organization Name.
8. Select one of the radio buttons to indicate if Spectrum
Expert should be available to all users of the system, or
only the user running the installation program.
Select [Next].
9. The next display indicates the default installation
directory. (To choose a different location, select
[Change…], and use the dialog box to indicate a
different folder.) When you are satisfied with theinstallation location, select [Next].
10. On the Ready To Install The Program dialog box,
click [Install]. InstallShield installs Cognio’s SpectrumExpert software.
11. Another dialog box will appear with an indicator bar,
showing the progress of the installation.
12. On the final dialog box (InstallShield Wizard
Completed), you can select the Register Product
check box to obtain a Web-based product registration
window. Select [Finish] to complete the installation.
13. If you elected to register the product (which we
recommend!), the registration page should open
automatically in your Web browser.
Cognio can only provide product support if

8/8/2019 Spectrum Expert 3.1 Users Guide
http://slidepdf.com/reader/full/spectrum-expert-31-users-guide 38/139
Page 21
Spectrum Expert Users Guide (Version 3.1)
you register the software.
The installation automatically creates a
Spectrum Expert shortcut icon on your desktop.
3.2 CardBus Sensor Installation
Install the Spectrum Expert software before installing the CardBus-based
Sensor into your computer. (See instructions on previous page.)
The Spectrum Expert Spectrum Sensor contains Cognio’s custom hardware (the SAgE chip) for
detecting RF spectrum activity. To install the CardBus:
1. Identify an open CardBus slot (i.e., a PCMCIA slot) on your
computer.
2. Insert the Spectrum Expert Spectrum Sensor into the slot as
shown.
The pins should go in first, and the LEDs on the card should
be face up.

8/8/2019 Spectrum Expert 3.1 Users Guide
http://slidepdf.com/reader/full/spectrum-expert-31-users-guide 39/139
Page 22 Section 3. Spectrum Expert Setup
Spectrum Expert Users Guide (Version 3.1)
3. Press the card gently but firmly into place.
4. You may see a screen which asks if you want Windows Update to create a device driver. Of
the three available options, select [No, Not At This Time].
5. Windows XP or Vista will present a dialog box indicating
that new hardware has been found. (The reference to the
Cognio SAgE Controller refers to the custom Cognio chip
that performs spectrum detection.)
6. Normally, leave the default option (Install the software
automatically) selected, and select [Next].
7. Windows XP or Vista presents another dialog box,
indicating that driver installation is in progress.
8. A final dialog box will indicate when installation is
complete. You may select the Registration check box to
bring up an online registration page after installation is
complete. Select [Finish].
3.3 Attaching an External Antenna
The CardBus Sensor has an internal antenna; however, you can obtain improved detection
sensitivity by using an external antenna. You can use the omnidirectional antenna (included), or —
for Wi-Fi only — the directional antenna.
When you use an external antenna, the CardBus hardware for the RFID card automatically detectsthe presence of the antenna, and takes the signal from the external antenna. (So, you do not need to
do anything with the Spectrum Expert For RFID Console to choose between the antennas.)
The directional antenna is an optional feature which you can order from Cognio.
For both the Wi-Fi and RFID version, care must be taken when removing (disconnecting) the external antenna. See Section 0 on page 24 for more information.
Try to minimize the number of times the external antenna is connected and
disconnected; repeating these actions over 500 times may degrade the connector’s performance.
Cognio ships several different omnidirectional antennas. Your antenna may be slightly
different from the one shown here, and the clip may attach slightly differently to the display panel.
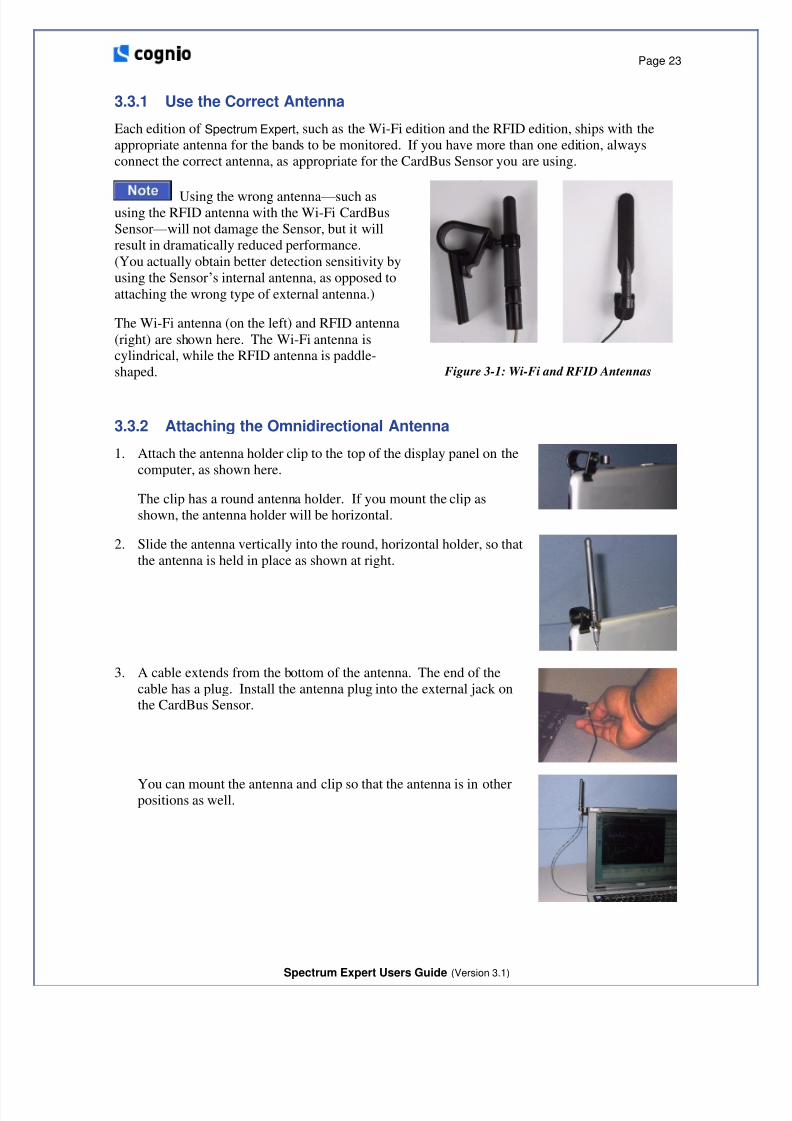
8/8/2019 Spectrum Expert 3.1 Users Guide
http://slidepdf.com/reader/full/spectrum-expert-31-users-guide 40/139
Page 23
Spectrum Expert Users Guide (Version 3.1)
3.3.1 Use the Correct Antenna
Each edition of Spectrum Expert, such as the Wi-Fi edition and the RFID edition, ships with the
appropriate antenna for the bands to be monitored. If you have more than one edition, always
connect the correct antenna, as appropriate for the CardBus Sensor you are using.
Using the wrong antenna — such asusing the RFID antenna with the Wi-Fi CardBus
Sensor — will not damage the Sensor, but it will
result in dramatically reduced performance.
(You actually obtain better detection sensitivity by
using the Sensor’s internal antenna, as opposed to
attaching the wrong type of external antenna.)
The Wi-Fi antenna (on the left) and RFID antenna
(right) are shown here. The Wi-Fi antenna iscylindrical, while the RFID antenna is paddle-
shaped. Figure 3-1: Wi-Fi and RFID Antennas
3.3.2 Attaching the Omnidirectional Antenna
1. Attach the antenna holder clip to the top of the display panel on the
computer, as shown here.
The clip has a round antenna holder. If you mount the clip as
shown, the antenna holder will be horizontal.
2. Slide the antenna vertically into the round, horizontal holder, so that
the antenna is held in place as shown at right.
3. A cable extends from the bottom of the antenna. The end of the
cable has a plug. Install the antenna plug into the external jack onthe CardBus Sensor.
You can mount the antenna and clip so that the antenna is in otherpositions as well.

8/8/2019 Spectrum Expert 3.1 Users Guide
http://slidepdf.com/reader/full/spectrum-expert-31-users-guide 41/139
Page 24 Section 3. Spectrum Expert Setup
Spectrum Expert Users Guide (Version 3.1)
3.3.3 Attaching the Directional Antenna
1. Mount the Velcro strip to the back of the PC. (The strip has
adhesive backing.)
2. Attach the plastic holder to the Velcro strip.
3. Slide the antenna’s support staff into the slot on the holder.
4. A cable extends from the bottom of the antenna support staff.
The end of the cable has a plug. Install the antenna plug into
the external jack on the CardBus Sensor.
3.3.4 Removing the External Antenna
For both the Wi-Fi and RFID version, care must be taken when removing
(disconnecting) the external antenna. If the plug is not removed carefully, either the MMCX
antenna jack on the Sensor, or the Sensor itself — or both — may be permanently damaged.
Why didn’t Cognio use a more robust connector for the antenna? Certain technical requirements
create limits on the connector that can be used. It must be thin enough to fit in a CardBus card.
Also, the extremely high frequencies involved demand a special connector which can carry these
frequencies across the connection with minimal signal loss. Very few connectors can meet these
stringent requirements, and we have selected what we believe is the best connector for the purpose
at hand. Unfortunately, it is relatively fragile, and requires careful handling to avoid damage.

8/8/2019 Spectrum Expert 3.1 Users Guide
http://slidepdf.com/reader/full/spectrum-expert-31-users-guide 42/139
Page 25
Spectrum Expert Users Guide (Version 3.1)
The antenna should NEVER be disconnected by pulling on the antenna lead (the wire connectingthe antenna to the CardBus)!! The graphic below illustrates what you should NOT do:
Figure 3-2: How NOT To Disconnect The CardBus Antenna
Doing the above will cause damage to the cable, connector, and CardBus card.
Failure of the user to follow the instructions below can cause the antenna or
CardBus card to become inoperable, and failure to properly disconnect the antenna may lead
to voiding the warranty.
Essentially, the requirements for removing the external antenna is to make sure you are pulling the
plug straight out of the jack.
Plug MMCX Jack
Figure 3-3: Antenna Plug and Jack
You may find it easier to detach the antenna if you first remove the CardBus card from
the CardBus slot. This way, you can hold the CardBus in one hand, while grasping the antenna
jack in the other. See Section 3.3.6 on page 27.
1. Grasp the plug — the part at the end of the antenna wire — at the end of the antenna lead where it
is mated to the CardBus card.
The best method is to “pinch” the connector with the thumb and forefinger, and with the nails,
or the tips of the fingers, under the shoulders of the connector.
2. Pull the connector firmly and PERPENDICULAR to the edge of the card.
In other words, you need to carefully get a grasp on the plug — we recommend you actually use
your fingernails, sliding them so as to create a gap between the plug and the jack — and gently but
firmly pull the plug in a direction that is directly at right angles to the Cardbus. (And perpendicular
to the PC, if the CardBus is still inserted in the PC.) To the extent possible, you should be gripping
the plug with equal, balanced pressure from opposing sides, using two or three fingers.

8/8/2019 Spectrum Expert 3.1 Users Guide
http://slidepdf.com/reader/full/spectrum-expert-31-users-guide 43/139
Page 26 Section 3. Spectrum Expert Setup
Spectrum Expert Users Guide (Version 3.1)
What you do not want to do is to apply any pressure to the left or right, or up or down.We recommend you avoid a twisting motion as well. The photo below illustrates the
recommended technique.
Figure 3-4: The Correct Way to Detach the External Antenna
3.3.5 Using the Directional Antenna
The purpose of the directional antenna is to focus RF detection activity in a given direction.
This can be useful with all Spectrum Expert features, but is especially useful with the Device
Finder (see Section 11 on page 83). The following diagram illustrates the directional sensitivity of
the directional antenna which you can order from Cognio.
Figure 3-5: Using the Directional Antenna

8/8/2019 Spectrum Expert 3.1 Users Guide
http://slidepdf.com/reader/full/spectrum-expert-31-users-guide 44/139
Page 27
Spectrum Expert Users Guide (Version 3.1)
3.3.6 Swapping or Removing the CardBus Sensors
Normally, you would not want to remove the CardBus Sensor while the Spectrum Expert
application is running. However, you can in fact remove the Sensor, and re-insert it, without
degrading system performance. You can also “hot-swap” between the RFID Sensor and the Wi-Fi
Sensor without impacting system performance.
If you do remove the Sensor while the application is running, a pop-up will appear directing you to
re-insert the card, and hit [OK] to continue.
You cannot run both the RFID Sensor and the Wi-Fi Sensor in the same PC at the sametime. (If you insert one card while the other is already inserted, the Application will either display
a warning message indicating that the product doesn’t currently support this configuration and that
one of the cards will be ignored, or simply ignore all but one of the cards arbitrarily.)

8/8/2019 Spectrum Expert 3.1 Users Guide
http://slidepdf.com/reader/full/spectrum-expert-31-users-guide 45/139
Page 28 Section 3. Spectrum Expert Setup
Spectrum Expert Users Guide (Version 3.1)
3.4 Starting the Mobile Console for the First Time
Once the Spectrum Expert software is installed, and the Mobile Sensor is installed, you can begin to
use Spectrum Expert to identify sources of interference in the neighborhood of your WLAN.
Your computer should have an active 802.11 card or built-in 802.11capabilities, in
order for Spectrum Expert for Wi-Fi to detect Wi-Fi devices. However, make sure the 802.11
hardware is not associated with an AP or Ad-Hoc network when you use Spectrum Expert For
Wi-Fi. See Section 3.6 on page 32 for more information.
1. From the desktop, select the Spectrum Expert Shortcut Icon.
2. When you first start the program — and depending on your Windows
XP or Vista security settings — you may see the security warning
shown at right. If you do, BE SURE TO SELECT THE [Unblock]
OPTION!
This warning does not represent a threat to, or breach of,
your PC’s security.
3. After seeing the Spectrum Expert splash screen, a dialog box allowsyou to choose the Sensor to use. Select Internal Cardbus Antenna,
or External Cardbus Antenna.
As noted on the dialog box, some Sensors (such as the
Sensor for the RFID product) automatically use the external antenna,
if one is connected, and so override any contrary setting here.
You may also select Spectrum Capture File: to playback a CognioCSC file. Select the [Browse…] button to locate the CSC file of
interest.
4. If you expect to use these settings in the future, check theAutomatically start sensor connection with these settings next time application is launched box.
5. Select [OK].
Upon starting Spectrum Expert for Wi-Fi, you may see a
dialog box indicating that there is no 802.11 capability in your PC.
Spectrum Expert will work, but will not detect 802.11 devices.See Section 3.6.3, Enabling Your PC ’ s 802.11 Receive Operability
(But Not Transmit) on page 32 for more information.

8/8/2019 Spectrum Expert 3.1 Users Guide
http://slidepdf.com/reader/full/spectrum-expert-31-users-guide 46/139
Page 29
Spectrum Expert Users Guide (Version 3.1)
You are now presented with the Spectrum Expert Mobile Console.
Depending on the country in which you are located, you
may need to change the Local Settings before you can make
effective use of Spectrum Expert. In particular, you may need to
select bands and channels to monitor.
6. Select Tools Settings….
7. Select the Channel Settings or Monitored Bands buttons at left.
For instructions on using the Settings dialog, see Section 12 on
page 91.
From here, you can use all the features of Spectrum Expert.
Section 4 on page 34 provides an overview of the Spectrum Expert Application and its features.
3.5 Repairing a “Backwards” Installation
As indicated above, the Application software should be installed before you insert the CardBus into
your PCMCIA slot. If you have installed the sensor hardware first, the software installation
process may not work correctly, and Spectrum Expert may not recognize the sensor in your PC.
This section contains instructions on how to fix this situation, should it arise.
A little background information is helpful. The
reason we ask you to install the Spectrum Expert
software first is because the installation process
automatically installs, on your PC, the software
drivers required by the CardBus Sensor. If you
install the Sensor first, the necessary devicedrivers are not present. You will then see a
message such as this:
If you see such a message, first uncheck the box
which says Don’t prompt me again to install
the software. Then select [Finish]. The next
step is simply to go ahead and install the
Spectrum Expert software, as per the instructions
above (Section 3.1 on page 19).
Figure 3-6: Sensor Hardware Installation Error
After installing the software, one of two things will happen: either Windows XP or Vista willautomatically recognize the Sensor hardware, or it will not. Both of these cases are covered below.

8/8/2019 Spectrum Expert 3.1 Users Guide
http://slidepdf.com/reader/full/spectrum-expert-31-users-guide 47/139
Page 30 Section 3. Spectrum Expert Setup
Spectrum Expert Users Guide (Version 3.1)
3.5.1 Automatic Hardware Recognition By Windows XP Or Vista
Windows XP or Vista may automatically recognize that the necessary drivers are now present to
support the Sensor. Windows XP or Vista will install the drivers for you, and you can go ahead
and use Spectrum Expert.
One way to find this out is simply to start the Application (Section 3.4 on page 28). If the program
starts successfully, this indicates it has found the CardBus Sensor, and you are all set.
Another way to check that the drivers are properly installed is to select:
Start Settings Control Panel
Double-click on the System icon.
Select the Hardware tab.
On the Hardware tab, select [Device Manager].
If the CardBus Sensor — with supporting software drivers — is properly installed, then there will be
an icon for Spectrum analysis devices. Open that icon (double-click on it), and underneath you
will see listed the Cognio Mobile Spectrum Sensor Controller. (SAgE is the spectrum-analyzer-on-a-chip in the CardBus Sensor.)
Figure 3-7: Successful Sensor Hardware Installation As Shown On Device Manager
You can close the Device Manager, and get to work with the Spectrum Expert Application.
3.5.2 Manual Driver Installation
If you first installed the CardBus Sensor hardware; and then, installed the software; it is possible
that Windows XP or Vista may not automatically install the Sensor. You can check this by again
visiting the Device Manager. (Same instructions almost the same as those above: Select Start
Settings Control Panel. Double-click on the System icon. Select the Hardware tab.
On the Hardware tab, select [Device Manager]. Now double-click on Other Devices.)

8/8/2019 Spectrum Expert 3.1 Users Guide
http://slidepdf.com/reader/full/spectrum-expert-31-users-guide 48/139
Page 31
Spectrum Expert Users Guide (Version 3.1)
In the event the driver is not installed, you will see:
Figure 3-8: Unsuccessful Sensor Hardware Installation As Shown On Device Manager
This means that Windows XP and Vista knows the device is out there, but doesn’t have the
necessary drivers to fully support its functionality. To correct this problem:
1. Right-click on PCI Data Acquisition and Signal Processing Controller.
Select Install Driver….
On the Found New Hardware Wizard select No, Not This Time.
Select [Next].
2. On the next screen, select Install From A List Or A Specific Location.
Select [Next].
At this point, make sure your Spectrum Expert installation CD is installed in your CD drive.
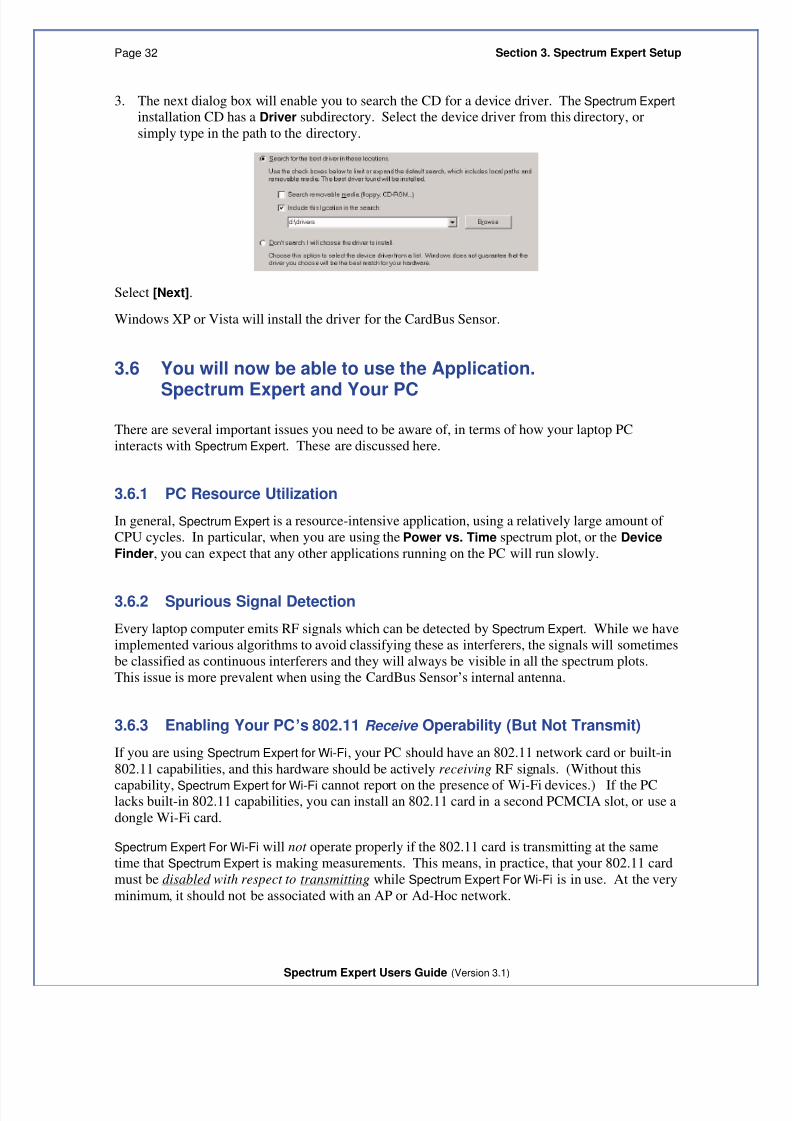
8/8/2019 Spectrum Expert 3.1 Users Guide
http://slidepdf.com/reader/full/spectrum-expert-31-users-guide 49/139
Page 32 Section 3. Spectrum Expert Setup
Spectrum Expert Users Guide (Version 3.1)
3. The next dialog box will enable you to search the CD for a device driver. The Spectrum Expert installation CD has a Driver subdirectory. Select the device driver from this directory, or
simply type in the path to the directory.
Select [Next].
Windows XP or Vista will install the driver for the CardBus Sensor.
3.6 You will now be able to use the Application.
Spectrum Expert and Your PC
There are several important issues you need to be aware of, in terms of how your laptop PC
interacts with Spectrum Expert. These are discussed here.
3.6.1 PC Resource Utilization
In general, Spectrum Expert is a resource-intensive application, using a relatively large amount of
CPU cycles. In particular, when you are using the Power vs. Time spectrum plot, or the Device
Finder, you can expect that any other applications running on the PC will run slowly.
3.6.2 Spurious Signal Detection
Every laptop computer emits RF signals which can be detected by Spectrum Expert. While we have
implemented various algorithms to avoid classifying these as interferers, the signals will sometimes
be classified as continuous interferers and they will always be visible in all the spectrum plots.
This issue is more prevalent when using the CardBus Sensor’s internal antenna.
3.6.3 Enabling Your PC’s 802.11 Receive Operability (But Not Transmit)
If you are using Spectrum Expert for Wi-Fi, your PC should have an 802.11 network card or built-in
802.11 capabilities, and this hardware should be actively receiving RF signals. (Without this
capability, Spectrum Expert for Wi-Fi cannot report on the presence of Wi-Fi devices.) If the PClacks built-in 802.11 capabilities, you can install an 802.11 card in a second PCMCIA slot, or use a
dongle Wi-Fi card.
Spectrum Expert For Wi-Fi will not operate properly if the 802.11 card is transmitting at the same
time that Spectrum Expert is making measurements. This means, in practice, that your 802.11 card
must be disabled with respect to transmitting while Spectrum Expert For Wi-Fi is in use. At the very
minimum, it should not be associated with an AP or Ad-Hoc network.

8/8/2019 Spectrum Expert 3.1 Users Guide
http://slidepdf.com/reader/full/spectrum-expert-31-users-guide 50/139
Page 33
Spectrum Expert Users Guide (Version 3.1)
However, it is desirable for your 802.11 card to be receiving data while Spectrum Expert is inoperation at the same time. So the 802.11 technology should be enabled for receiving data. This
allows you to use software which is designed for protocol-oriented monitoring of the 802.11
environment at the same time you use Spectrum Expert to observe the RF spectrum. It also enables
Spectrum Expert to provide enhanced spectrum monitoring with some limited protocol-related data.
Because the software associated with your 802.11 card can vary depending on the particularhardware in use, we can’t provide step-by-step instructions. In general, however, you need to make
sure of the following:
Your PC/802.11 hardware is enabled.
Your PC/802.11 hardware is not associated with an AP.
Your PC/802.11 hardware is not associated with an ad-hoc network.
You can generally check your network associations — and change them, if necessary — using the
Network Connections settings on the Windows Control Panel (Start Settings Control
Panel Network Connections).
If your on-board 802.11 technology is enabled, but is not associated with an AP or ad-hoc network,
it may occasionally still transmit some RF power. This is not ideal, but is still much better than if itis broadcasting nonstop because it is associated with an AP.
In some cases, your 802.11 hardware may specifically include software tools which enable you toset the 802.11 device for Rx mode only, with no Tx. See your 802.11 hardware documentation for
more information.
3.6.3.1 Spectrum Expert For RFID and Other 802.11 Devices
It is acceptable to use an active 802.11 device (such as a CardBus Wi-Fi network card, which may
both receive and transmit), in the same PC where you are running Spectrum Expert For RFID.
3.7 Upgrading The Spectrum Expert Software
An upgrade to Spectrum Expert 3.1 is considered a major upgrade in that during installation any
previous versions of Spectrum Expert are automatically uninstalled, after which, Spectrum Expert
3.1 installs as a “fresh” installation. All generated files, such as Spectrum View configurations,
CCF files, screen captures and data exports will be preserved by the upgrade process. However,
local settings such as Bands/Channels selection, default views and alerts configurations will not be
preserved.

8/8/2019 Spectrum Expert 3.1 Users Guide
http://slidepdf.com/reader/full/spectrum-expert-31-users-guide 51/139

8/8/2019 Spectrum Expert 3.1 Users Guide
http://slidepdf.com/reader/full/spectrum-expert-31-users-guide 52/139
Page 35
Spectrum Expert Users Guide (Version 3.1)
4.3 Console Tabs and Operational Features
The Spectrum Expert Application has five primary operational features, four of which involvemainly the display of data; the fifth, the Device Finder, is an active operational mode which
enables you to quickly “hunt down” interfering devices.
These five modes of operation are accessed by selecting any of the five tabs running across the top
of the Console display: Spectrum, Spectrum (2), Devices, Channel Summary, and Device
Finder. The following table shows the relationship between the display tabs, and the Console’s
operational capabilities:
Display Tab Reference Comments
Spectrum
Spectrum(2)
Section 6, Working With Spectrum Tabs,Spectrum Plots, and Charts – Page 48
Section 7, Spectrum Plots – Page 55
Section 8, Spectrum Charts – Page 69
Each Spectrum tab can display a mixture ofSpectrum Plots and Charts.
The Console provides two Spectrum tabs, allowingfor two different, user-configurable, defaultconfigurations of Plots and Charts.
Devices Section 9, Devices View –
Page 76 Detailed information on detected devices. Unlikethe Active Devices list, this will also show historicaldevices (i.e., devices which are no longer active).
Channel Summary Section 10, Channel Summary – Page 81 Summary of RF activity on all monitored channels.
Device Finder Section 11, Device Finder – Page 83 Cognio’s “sniffer” for locating unwanted RF devices.
4.4 Control Panel
Figure 4-2: Control Panel
Several of the viewing modes have specific controls which enable you to
fine-tune the features of the display. For example, one of the Spectrum
Plot Controls panel is shown at left. Normally, the Control Panel automatically comes into view when you select an appropriate mode, such
as Spectrum mode (Section 7 , page 55), Devices mode (Section 9, page
76 ), or Device Finder (Section 11, page 83).
If the Control Panel is not showing at all, select View
Control Panel. Select the same menu option to toggle the
Control Panel off.
In the Spectrum view, each plot and chart has its own unique
controls. If the Control Panel is showing, but the controls for
the plot/chart of interest are not on display, then simply click
on the plot or chart of interest. The appropriate controls will
then be shown on the Control Panel.
You can adjust the relative size
of the Control Panel and the
Active Devices view by
placing the cursor over the line
which divides them. Then
click and hold the mouse, and
drag up or down.

8/8/2019 Spectrum Expert 3.1 Users Guide
http://slidepdf.com/reader/full/spectrum-expert-31-users-guide 53/139
Page 36 Section 4. The Spectrum Expert Console – An Overview
Spectrum Expert Users Guide (Version 3.1)
4.5 Hiding / Unhiding the Active Devices List & Control Panel
As indicated below (Section 4.6.2, View Menu on page 37), you can use options on the View menu to hide or display the Active Devices tree and/or the Control Panel. However, you can also
use mouse techniques to control the display of the Active Devices tree and/or the Control Panel,
as illustrated here. (We illustrate with the Control Panel, but the techniques apply to the ActiveDevices tree as well.)
4.5.1 Close
You can always close the Control Panel or Active Devices tree by
clicking on the Close button.
4.5.2 Auto-Hide
You can instead hide the Control Panel or Active Devices list by
clicking on the Auto-Hide button, which has a small push-pin symbolon it.
Once you do this, the Control Panel is now hidden, allowing more
room for other display features (such as a larger view of the Spectrum
tab shown at right). However, a small vertical Control Panel tab isstill shown at left.
4.5.3 Temporary Restore
If you hover the mouse pointer (but don’t click ) over the vertical tab for
Control Panel, the Control Panel is temporarily restored to view. Itremains in view only as long as the mouse is somewhere over the tab,
or over the Control Panel itself. This lets you make changes in the
Control Panel (or make selections on the Active Devices tree).
Once the mouse is no longer hovering somewhere over the Control
Panel or Active Devices tree, the panel or tree will go away; only the
vertical tab at far left will remain on display.
4.5.4 Permanent Restore
To restore the Control Panel / Active Devices tree to permanent status
on the display, click again on the Auto-Hide (push-pin) button, this
acts as a toggle. The panel or tree will now remain on display, and the
small vertical tab on the side will no longer be shown.

8/8/2019 Spectrum Expert 3.1 Users Guide
http://slidepdf.com/reader/full/spectrum-expert-31-users-guide 54/139
Page 37
Spectrum Expert Users Guide (Version 3.1)
4.6 Menu Options
The Spectrum Expert Application has the following menu options:
4.6.1 File MenuThe File menu offers the following options:
Open Capture File – Use this operation to play back a previously recorded Cognio
Capture File. See Section 4.7, Spectrum Recording and Playback on page 40 for more
information.
Save Replay As… This operation captures Instant Replay spectrum data to a Cognio
Capture File for later playback. See Section 4.7, Spectrum Recording and Playback on
page 40 for more information.
Instant Replay - This operation enables a 1 to 60 minute replay of stored runningFIFO capture data.
Record Capture File – This operation captures spectrum data to a Cognio Capture File
for later playback. See Section 4.7, Spectrum Recording and Playback on page 40 for
more information.
Stop Capture File - This operation terminates the recording of spectrum data.
Connect To Sensor – Opens a dialog box, similar to the one seen when first logging
in to the application, which enables you to select a different Sensor, or to open a CSC
file.
Select the [Browse] button to locate the CSC file of interest.
As noted on the dialog box, some Sensors (such as the
one for the RFID product) automatically use the external antenna,if one is connected, and so override any contrary setting here.
If you expect to use these settings in the future, check the
Automatically Use These Settings Next Time box.
Exit – Closes the Spectrum Expert Application.
4.6.2 View Menu
This menu provides access to most of the main Spectrum Expert Application features.
Spectrum – Enables you to create a variety of plots and charts which provide real-time
views of RF activity. You can save your configuration of plots and charts. See Section
7 on page 55.
Spectrum (2) – The same as with Spectrum; you can create a variety of plots and
charts, and save your configuration.

8/8/2019 Spectrum Expert 3.1 Users Guide
http://slidepdf.com/reader/full/spectrum-expert-31-users-guide 55/139

8/8/2019 Spectrum Expert 3.1 Users Guide
http://slidepdf.com/reader/full/spectrum-expert-31-users-guide 56/139
Page 39
Spectrum Expert Users Guide (Version 3.1)
Select All Items – Selects all spectrum plots and charts currently displayed on the
spectrum tab.
Open Spectrum View Configuration… – Once you have configured plots and charts
on one of the two Spectrum tabs, you can save the plot/chart configuration. This
enables you to easily restore the same configuration at a later time. See Section 6.11,Saving and Restoring Spectrum View Layouts on page 52 for more information.
Save Spectrum View Configuration… – See Section 6.11, Saving and Restoring
Spectrum View Layouts on page 52 for more information.
New Spectrum View Configuration… – See Section 6.11, Saving and Restoring
Spectrum View Layouts on page 52 for more information.
See Section 7 on page 55 for more information on all other spectrum operations.
4.6.4 Tools Menu
This menu provides access to the Settings dialog. The Settings dialog, in turn, has four panels:
Sensors and Antennas – Selects which Spectrum Sensor (and, in some cases, which
antenna) the Spectrum Expert Application uses for spectrum data acquisition.
Console Settings – Modifies date and time presentation on the Spectrum Expert
Application, the Spectrum view configuration to use for playback, enables the InstantReplay feature, selects the Default AP Category (In-Network or Unknown), and the
color of the plot’s background.
Band and Channel Settings – This panel determines, by Regulatory Domain (USA,
Japan, etc.), which RF bands and channels are monitored for RF activity and reported
on by Spectrum Expert. The default setting is to monitor the channels indicated on the
802.11b/g Channel Settings panel. However, there are also options for other pre-defined 802.11a bands, including the US Public Safety Band and user-selected
channels in middle and upper bands as well.
Alert Settings – Used to enable or disable security and performance alerts for an
interferer type or category.
SNMP Option – Spectrum Expert has an ability to send SNMP traps when it detects
interfering devices. This screen is used to configure the trap filters and threshold levels
that will trigger the sending of an SNMP trap. The Settings – SNMP screen is used to
configure the trap filters and threshold levels that will trigger the sending of an SNMP
trap.
See Section 12 on page 91 for more information.
This menu also includes the Capture Current Display… command which creates a snapshot image
of the information reported within the main window of the Spectrum Expert Application. See
Section 13, Capture Current Display on page 102.

8/8/2019 Spectrum Expert 3.1 Users Guide
http://slidepdf.com/reader/full/spectrum-expert-31-users-guide 57/139
Page 40 Section 4. The Spectrum Expert Console – An Overview
Spectrum Expert Users Guide (Version 3.1)
4.6.5 Help
Help Topics – Provides access to the Spectrum Expert Application Help system.
About Spectrum Expert Application… – Provides copyright and version information
for the Spectrum Expert Application software.
About Spectrum Sensor… – Provides technical data for the sensor currently in use.
Capture File Properties… - This option is active when a CCF file is playing and will
display file information when invoked.
4.7 Spectrum Recording and Playback
The Mobile Application enables you to record spectrum data in Cognio Spectrum Capture (CSC)
files. You can then play these files back at a later time. Each CSC stores the following
information to disk:
Cognio Spectrum Capture files are subject to a size limitation of 512 MB. You shouldestimate CCF file size growth at a rate of 6MB per hour/per band selected when considering the
512 MB size limitation.
Active Devices – A list of active devices vs. time, plus all information needed to
reproduce the Devices View and any of its sub views and columns for all monitored
bands during playback. (During playback you will be able to change columns and see
meaningful information that changes with time, just as with live mode.)
Spectrum Plot Data – All information needed to reproduce any of the Spectrum
Analyzer plots (except Power vs. Time and Power vs. Frequency – these plots will
not be available during playback). You can adjust the settings for the other plots and
charts during playback.
Spectrum Chart Data – All information needed to reproduce any of the spectrum
charts during playback.
Reference Information – This includes the date and time of capture, the Windows
user/login name, and the CardBus card revision and serial number.
The diagram at right shows the controlsused for spectrum recording and playback:
The controls are described briefly below.
Detailed instructions on recording and
playback can be found in the Online Help.
Record – Opens a dialog box where
you can define the name and file
location of a CSC file. Upon closing
the dialog box, recording begins
automatically. You can also initiate
this operation by selecting File
Record Capture File.

8/8/2019 Spectrum Expert 3.1 Users Guide
http://slidepdf.com/reader/full/spectrum-expert-31-users-guide 58/139
Page 41
Spectrum Expert Users Guide (Version 3.1)
Open – Opens a previously captured
CCF file for playback. You can alsoselect File Open Capture File. Use
the Open Capture File dialog box to
select the recording of interest.
Playback – Once you have opened a
CSC file, select this to start playback.
Figure 4-3: Spectrum Recording and Playback Controls
Stop – Stops the recording process, and also stops the in-progress playback of a CSC
file.
Go Live – Returns you to live mode. Any playback or recording that was in progress
is halted.
Slider Control – You can use this control to move to any particular time during the
playback interval.
You may select any combination of Spectrum Analyzer plots or charts during playback.
Just as in a live spectrum session, you can right-click within the display area to get pop-up menus
used to navigate to specific information. Additionally, you can use all other plot icons and features,
such as adding, moving, zooming, and removing a plot or chart during playback.
The Power Vs. Time and Power Vs. Frequency plots are not supported during
playback.
4.8 Spectrum Instant Replay
The Instant Replay feature allows you to review the most recent spectrum information up to the
past 60 minutes, without having to record it in a CCF file, and play it back much as if it were being
viewed live for the first time without interrupting receipt of current spectrum information.Spectrum information of interest viewed as an Instant Replay may then be saved as Cognio
Spectrum Capture (CCF) files to share information on what is happening in the spectrum.
The screens at right show the two access
methods used for Instant Replay.

8/8/2019 Spectrum Expert 3.1 Users Guide
http://slidepdf.com/reader/full/spectrum-expert-31-users-guide 59/139
Page 42 Section 4. The Spectrum Expert Console – An Overview
Spectrum Expert Users Guide (Version 3.1)
Navigate from Tools→ Settings→
Console Settings to display the Instant
Replay settings options as shown at right.The controls are described briefly below
and detailed instructions on Instant Replay
Settings, Initiating an Instant Replay and
Converting an Instant Replay to a CCF
can be found in the Online Help.
Enable Instant Replay of the last – when
checked, this checkbox enables the Instant
Replay function.
minutes – selectable number of minutes
setting for length of Instant Replay (range
1 to 60).
Figure 4-4: Instant Replay
Figure 4-5: Instant Replay Settings
4.9 What If I’m Not Seeing Any Data?
It may happen that you are viewing one of the Spectrum Expert Application displays, such as a
spectrum plot, but you are not seeing any data; or data is missing for part of a plot. (For example,
some of the channels on the plot have spectrum data, and others do not.) Or, you may know
perfectly well that some kind of interfering device is present in the environment, but the Devices
List and/or Device Finder are not detecting it.
4.9.1 CardBus Sensor Not Properly Inserted
One possible cause of this problem could be a complete lack of communication between the
CardBus Sensor and the Spectrum Expert Application software. Normally, however, if
communication is lost with the Sensor, the Spectrum Expert Application will present a warning
message, and then shut down.
To resolve such problems, check to ensure the CardBus Sensor remains properly seated in theCardBus slot.
4.9.2 Faulty Configuration Settings
Another possibility is that, while you have set your spectrum plots to display certain channels or
bands, your configuration settings for Spectrum Expert as a whole do not include those
channels/bands.

8/8/2019 Spectrum Expert 3.1 Users Guide
http://slidepdf.com/reader/full/spectrum-expert-31-users-guide 60/139
Page 43
Spectrum Expert Users Guide (Version 3.1)
To determine if this is the problem — and to rectify if — you need to check your Channel Settings and Monitored Bands under the Spectrum Expert Application’s Settings panel. See Section 12.3
on page 93 and Section 12.3.3 on page 95.
4.9.3 Erroneous Scale Settings
With the spectrum plots (Section 7 on page 55), it is possible you may fail to see any data if you
have an amplitude setting that is inappropriate for the actual data being monitored. For example,
suppose you are monitoring the RF duty cycle, and have the vertical axis amplitude set to range
from 0% to 100% (the default setting). If in fact the actual duty cycle values are very low (say,
ranging from 0% to 1% or 2%), you may not see any data.
This can be a particular problem with the Swept Spectrogram plot, where RF power values and
duty cycle values are mapped to colors. If all the measured data falls in a very narrow range
compared with the Color Scale, you may see nothing but a solid block of a single color – in fact,
you are seeing the correct data, but it seems as if you are seeing no data at all.
Selecting the [Auto Scale] option on these plots should normally correct this problem, but
sometimes it helps to manually adjust the measurement scale.
4.9.4 Wrong Antenna Settings (Wi-Fi Product Only)
Another possibility (Wi-Fi product only) is that you may have an internal CardBus Sensor, with an
external antenna, but you are in fact using the Sensor’s internal antenna. (This might account, for
instance, for why you might fail to see some interfering devices you expect to see.) You need to
check your Sensors and Antennas settings. See Section 12.1 on page 91.
4.9.5 Miscellaneous Device Issues
There are various RF effects that can prevent or partly hinder device detection. These are
discussed in detail in Section 9.2, Miscellaneous Device Issues on page 79.

8/8/2019 Spectrum Expert 3.1 Users Guide
http://slidepdf.com/reader/full/spectrum-expert-31-users-guide 61/139
Page 44 Section 5. Active Devices
Spectrum Expert Users Guide (Version 3.1)
5 ACTIVE DEVICES
The Active Device tree is normally on display on the left side of the Spectrum Expert Console.
It shows APs and Ad-Hocs (Wi-Fi edition), RFID Readers (RFID edition), and interfering devices,
provided these devices (APs, Readers, interferers) are currently live (transmitting). It uses a tree
structure to organize APs together, Ad-Hocs together, RFID devices together, and different typesof interfering devices together.
Figure 5-1: Active Devices
If the Device Tree is not showing, you can
toggle it into view by selecting View Device
Tree.
If you double-click on a device, a dialog box
will appear providing more detail on the device
including a picture of a typical device that
matches the RF signature. (You can also right-
click on the device and select What Is This
Device?)
Right-click on any interferer device and select
Find This Device to activate the Device
Finder. See Section 11, Device Finder on page83 for more information.
The Device Finder can only locate certain types of devices. If you right-click on a
device that can't be located, you will not be able to access the Find This Device option. Also, a
device must be currently active (transmitting) in order to find it. If, in Devices View, you click on
a device which is not currently transmitting, you will not be able to access the Find This Device
option..
5.1 Current Devices vs. Historical Devices
The Active Devices tree only shows devices which are currently active – that is, devices which
were detected as transmitting during the last measurement interval.
For an historical list of detected devices — which includes currently active devices, but also devices
which are no longer detected — use the Devices View. See Section 9, Devices View, on page 76 .
You can also see a pop-up list of active devices by mousing-over the trace area of a Spectrum
Expert plot.
5.2 Keeping Your Eye On A Particular Device
If there is a particular device that is of interest to you, you can keep an eye on the device simply byclicking on it. Your selected row will be highlighted.
As new devices are detected (or disappear from view), the Active Devices tree will auto-scroll and
auto-sort. However, the Mobile Console will make sure that your highlighted row always remains

8/8/2019 Spectrum Expert 3.1 Users Guide
http://slidepdf.com/reader/full/spectrum-expert-31-users-guide 62/139
Page 45
Spectrum Expert Users Guide (Version 3.1)
in view; in other words, auto-scrolling and auto-sorting will be adjusted so that your highlightedrow always remains visible on the Mobile Console.
5.3 Problem Indicators and Security Alerts
Problematic devices shown in the Active Devices pane are highlighted in yellow or red. The colors
indicate the interference level of active devices. Yellow means the duty cycle of the interferer is
greater than 25% and it affects at least one channel with a BSS device. Red means the duty cycle
of the interferer is greater than 50% and it affects at least one channel with a BSS device.
Security and alert settings are available and can be configured using the Settings – Alert window.Once configured, security alert icons display in the Active Devices tree when the predefined
triggers occur.
Figure 5-2: Security Alert Icons
5.4 Active Devices and Devices View
Normally, you do not need to see the Active Devices tree at the same time that you are in Spectrum
Expert’s Devices mode (see Section 9 on page 76), since in Devices mode you can see all RF
devices — both those which are currently active, and historical devices.
If you select the Devices tab in the main
Spectrum Expert workspace, and select
the push-pin on the Active Devices tree
Spectrum Expert hides the Active
Devices tree. However, a small ActiveDevices tab remains visible at the left
side of the display.

8/8/2019 Spectrum Expert 3.1 Users Guide
http://slidepdf.com/reader/full/spectrum-expert-31-users-guide 63/139
Page 46 Section 5. Active Devices
Spectrum Expert Users Guide (Version 3.1)
You can move the mouse over this tab tobring the Active Devices tree back into
view temporarily. The Devices Control
Panel is temporarily hidden behind the
Active Devices pane.
If you then click on the push-pin (circledin the illustration at right), on the Active
Devices pane, this puts the Active
Devices pane permanently on view.
The Devices Control Panel will then
still be on view, but lower down on theleft side of the display.
You might want Active Devices on view at the same time as Devices mode, as an easy way to
distinguish between currently active devices vs. the more extensive list of devices (active and
historical) shown in Devices mode.
See also Section 4.5, Hiding / Unhiding the Active Devices List & Control Panel on page 36.
5.5 Exporting Data
The Export Data feature provides additional functionality to the list of active devices in the Active
Devices tree. The Export Data feature allows you to export device information to a file for future
analysis. This option can be accessed by right-clicking on a device in the Active Device tree todisplay a pop-up menu.

8/8/2019 Spectrum Expert 3.1 Users Guide
http://slidepdf.com/reader/full/spectrum-expert-31-users-guide 64/139
Page 47
Spectrum Expert Users Guide (Version 3.1)
When Export Selected Data… is selected, a window appears providing a default file name andSave in location (Spectrum Captures folder). The window also allows user selection of the file
name and Save in location.

8/8/2019 Spectrum Expert 3.1 Users Guide
http://slidepdf.com/reader/full/spectrum-expert-31-users-guide 65/139
Page 48 Section 6. Working With Spectrum Tabs, Spectrum Plots, and Charts
Spectrum Expert Users Guide (Version 3.1)
6 WORKING WITH SPECTRUM TABS, SPECTRUM PLOTS, AND CHARTS
As indicated above, the Console provides two spectrum tabs, Spectrum and Spectrum (2). Each
tab operates identically. The Console has two tabs so that you can create, name, and save two
distinct configurations of plots and charts. (You can create and save more than two plot/chart
configurations; but you can have two of them as defaults that automatically appear on these tabs.)
Descriptions of the specific charts and plots — including the parameters for fine-tuning the
plot/chart content — may be found in the Online Help, and in Section 7, Spectrum Plots on page 55,and Section 8, Spectrum Charts on page 69 of this manual. Here we provide an overview of how to
use these tabs (Spectrum and Spectrum (2)) to create your custom plot/chart views.
6.1 Create A Spectrum Plot or Chart
To add a spectrum plot or chart:
1. Right-click in the workspace for the spectrum plots and selectAdd Plot <Plot Type> or Add Chart <Chart Type>.
You can also use the menu
Spectrum Add Plot <Plot Type> or Spectrum Add Chart <Chart Type>.
2. Use the Plot Control panel at the left of the display to set the parameters for the plot or chart.
The particular parameters will vary depending on the type of plot. An overview of the Plot
Control panel is presented in Section 7.2, Plot Content on page 55. Detailed descriptions of
chart parameters are also contained in the Spectrum Expert Application Online Help system.
Of particular importance for the
spectrum plots, and for some of the charts – in
order to see any data displayed at all, you need toselect the On button for at least one Trace.
A “Trace” is the term we use to describe the line
of data shown on a plot. (By default, the Trace or
Traces for a plot are set to Off.) Figure 6-1: Turning A Plot Trace On
If you are in a Spectrum tab and the Controls are not visible, select View Control
Panel.
To access the plot Control Panel for a particular plot or chart, simply use the mouse to
click on that plot. (If you have more than one plot in view, then as you click on different
plots, the plot Control Panel will display the configuration options for the currently
selected plot.)
6.2 Multiple Plots
You can repeat the instructions immediately above to place more than one plot on display. You
can configure any combination of up to nine plots and charts (in 1024x768 mode or higher), or four
plots and charts (in 800x600 mode) per Spectrum View tab.

8/8/2019 Spectrum Expert 3.1 Users Guide
http://slidepdf.com/reader/full/spectrum-expert-31-users-guide 66/139
Page 49
Spectrum Expert Users Guide (Version 3.1)
6.3 Measurement Interval
Unless you have paused a plot (discussed below), the Spectrum Expert Application updates eachplot or chart once per measurement interval, which is typically once every second.
6.4 Pause and Resume Plotting
At times an event may occur in your network, such that you want to immediately capture the RF
environment at that moment for sustained study and review. You can pause and resume plots and
charts by right-clicking in the workspace, and selecting the appropriate menu options, or by
selecting these options from the Spectrum menu (e.g., Spectrum Select All Items Pause
Selected Items):
Select All Items – Selects all plots/charts displayed in the currently selected Spectrum
tab and enables the Spectrum menu options.
Pause Selected Items – Freezes the data displayed on the currently selected plot(s) or
chart(s). (Be sure to right-click on the appropriate plot/chart when you bring up thecontext menu.)
Resume Selected Items – Resumes real-time data display for the currently selected
plot/chart(s).
Pause Selected Items – Freezes data display on all plots/charts.
Resume Selected Items – Resumes the real-time update of data on all plots/charts.
6.5 Copying Plots and Charts
All plots and charts displayed in Spectrum View can be copied and pasted within the pane area of the window. You can copy and paste a plot or chart using on of the following three methods.
Method 1
Click on the top of the plot frame and hold down the <Ctrl> key. The cursor changes to indicate
copy mode.
Move the mouse to the desired location.
Release the mouse button to paste a copy of the plot or chart. The copied plot or chart is subject to
total count checking and PvT/PvF trace limit checking.
Method 2
1. Select a plot.
2. Press <Ctrl + C>. The selected plot is copied to the clipboard.
Method 3
1. Right-click on a plot or chart to display the pop-up menu. Or, select Spectrum from the Main
menu to display the drop-down menu.

8/8/2019 Spectrum Expert 3.1 Users Guide
http://slidepdf.com/reader/full/spectrum-expert-31-users-guide 67/139
Page 50 Section 6. Working With Spectrum Tabs, Spectrum Plots, and Charts
Spectrum Expert Users Guide (Version 3.1)
2. Select the Copy option. The selected plot is copied to the clipboard.
6.6 Pasting Plots and Charts from the Clipboard
Spectrum View plots and charts can be retrieved from the clipboard and pasted into your currentSpectrum View session, an additional Spectrum View session running on your machine, or a
different machine running Spectrum Expert with the same card type. The paste feature is subject to
total plot/chart count checking and PvT/PvF trace limit checking.
To paste a plot from the clipboard, do the following:
1. Open the clipboard and copy the desired plot.
2. Right-click within the View pane to display the pop-up menu.
3. Press <Ctrl + V>. The plot gets pasted to the end of the view.
Or, you can paste a plot from the clipboard using the Main menu as follows:
1. Open the clipboard and copy the desired plot.
2. Select Spectrum from the Main menu to display the drop-down menu.
3. Select the Paste option. The plot gets pasted to the end of the view.
6.7 Cutting Plots and Charts
Use any of the following methods to cut a plot or chart:
Method 1
1. Select a plot.
2. Press <Ctrl + X>. This removes the plot and copies it to the clipboard.
Method 2
1. Right-click a plot to display the pop-up menu.
2. Select the Cut option. This removes the plot from the display and copies it to the clipboard.
Method 3
1. Select a plot.
2. Select Spectrum from the Main menu to display the drop-down menu.
3. Select the Cut option. This removes the plot from the display and copies it to the clipboard.
Method 4
1. Left-click on the plot or chart of interest.

8/8/2019 Spectrum Expert 3.1 Users Guide
http://slidepdf.com/reader/full/spectrum-expert-31-users-guide 68/139
Page 51
Spectrum Expert Users Guide (Version 3.1)
2. Press Delete.
Method 5
1. Left-click on the X icon located in the upper right-hand corner of the plot or chart.
Method 6
1. Left-click on the plot or chart of interest.
2. Select Spectrum Remove Selected Item... from the Main menu to display the drop-downmenu.
6.8 Moving Plots and Charts
All plots and charts displayed in Spectrum View can be moved within the pane area of the window.
Method 1
1. Left-click on the top banner of the plot frame.
2. Drag the plot to the desired location. A blinking vertical line indicates the new location.
3. Release the mouse button to drop the plot in the new location.
Method 2
1. Right-click on the top banner of the plot frame.
2. Drag the plot to the desired location. A blinking vertical line indicates the new location.
3. Release the mouse button to drop the plot in the new location. A pop-up menu displays.
4. Select on of the following options:
Copy Here – pastes a duplicate of the original plot in this location.
Move Here – relocates the original plot to this location.
Cancel – terminates the operation.
6.9 Selecting Multiple Plots and Charts
In cases where you need to perform the same operation on more than one plot or chart, multipleplots and charts can be selected. For example, you may want to remove, pause, or resume more
than one plot at the same time.
When multiple plots and charts are selected, the control panel displays a message
indicating that Multiple items are selected and no controls are available for configuring plots and
charts.

8/8/2019 Spectrum Expert 3.1 Users Guide
http://slidepdf.com/reader/full/spectrum-expert-31-users-guide 69/139
Page 52 Section 6. Working With Spectrum Tabs, Spectrum Plots, and Charts
Spectrum Expert Users Guide (Version 3.1)
Multiple plots and charts can be selected as follows:
1. Hold down the <Ctrl> key.
2. Left-click each plot to select it.
6.10 Zoom In/Out
For optimal viewing, a plot or chart can be maximized (zoom in) and minimized (zoom out) to itsoriginal size. A plot or chart in Zoom In mode is indicated by an orange background. Additionally,
you can zoom in/out on up to two plots or charts at the same time.
To zoom in/out a single plot:
1. Double-click, or right-click, the frame or left click the magnifying glass icon of the plot tomaximize it. The orange background indicates Zoom In mode.
2. Double-click the frame or left-click the magnifying glass icon to minimize it.
Or, use the View menu to zoom in/out:
1. Select a plot.
2. Select Spectrum from the Main menu to display the drop-down menu. Or, right-click within
the View pane to display the pop-up menu.
3. Select the Zoom In option to maximize the plot. Or, select Zoom Out to minimize it.
To zoom in/out multiple (up to two) plots:
Hold down the <Ctrl> key.
Double-click the frame of each plot to maximize them. Or, double-click each frame to
minimize them.
Or, use the View menu to zoom in/out multiple plots:
1. Hold down the <Ctrl> key.
2. Select the plots.
3. Select Spectrum from the Main menu to display the drop-down menu. Or, right-click within
the View pane to display the pop-up menu.
4. Select the Zoom In option to maximize the plot. Or, select Zoom Out to minimize it.
6.11 Saving and Restoring Spectrum View Layouts
Other operations are available for working with plots and charts. The operations Open Spectrum
View Configuration…, Save Spectrum View Configuration…, and New Spectrum View

8/8/2019 Spectrum Expert 3.1 Users Guide
http://slidepdf.com/reader/full/spectrum-expert-31-users-guide 70/139
Page 53
Spectrum Expert Users Guide (Version 3.1)
Configuration can all be selected from the Spectrum menu. Remove Selected Items… can beselected from the Spectrum menu.
All these operations can also be selected by right-clicking on the frame of a plot or
chart, and selecting from the context menu that appears.
Save Spectrum View Configuration – Enables you to save the current configuration of open plots and charts, including their specific display parameters. (The current data,
however, is not saved.)
1. In the Save Spectrum View Configuration dialog, type in the name for your
configuration, or select the name of a previously defined configuration.
.
The name you type here will also appear on the Spectrum and Spectrum(2)
tabs, so we suggest you use something short but descriptive, for example, “Plots Only”,
“Charts Only”, “Duty Cycle Charts and Plot”, “Devices and RF Power”, etc.
2. To make the current configuration be the default configuration, be sure to first selectthe Set as startup default for this view check box. If you select this, the current
configuration will appear every time you log into the Spectrum Expert Application, and
select the current tab.
.
You can save a separate default view for each Spectrum tab.
Select [OK] to save or Cancel to exit without saving changes..
Open Spectrum View Configuration… – The dialog box for this operation will list all of
your currently saved spectrum views. Select one view, and then select [OK].
New Spectrum View Configuration – This operation clears all currently displayed plots.
Remove Selected Items… – This operation will close only the currently selected plot.
6.12 Deleting A Spectrum View
To delete a saved spectrum view:
1. Right-click on the Plots workspace and select Save Spectrum View Configuration…, or –
Select File Save Spectrum View Configuration.
2. In the Save Spectrum View Configuration dialog, select an existing view.
3. Then select [Remove Saved Configuration].
4. Select [OK] on the confirmation dialog box.

8/8/2019 Spectrum Expert 3.1 Users Guide
http://slidepdf.com/reader/full/spectrum-expert-31-users-guide 71/139
Page 54 Section 6. Working With Spectrum Tabs, Spectrum Plots, and Charts
Spectrum Expert Users Guide (Version 3.1)
6.13 Exporting Data
The Export Data feature provides additional functionality to all Spectrum plots and charts, as wellas the active devices listed in the Active Devices tree. This feature allows you to export device
information to a file for future analysis. This option can be accessed by right-clicking on a device
name, on any plot or chart, or anywhere in the display pane to display a pop-up menu.
When Export Selected Data… is selected, a window appears providing a default file name and
Save in location (Spectrum Captures folder). The window also allows user selection of the file
name and Save in location. A sample exported data file for an Interference Power chart is as
follows:
Interference Power
Vertical Scale: 10 dBm /
Channel In-Network Wi-Fi AP Max Interference Cordless Phones Wi-Fi CCI Wi-Fi ACI
WiFi Ch. 1 -85 -78.6 -81.2 -85
WiFi Ch. 2 -78.6 -81.2 -82.4
WiFi Ch. 3 -90 -78.6 -81.2 -80.1
WiFi Ch. 4 -78.6 -81.2 -74.9
WiFi Ch. 5 -78.6 -81.2 -70.9
WiFi Ch. 6 -71 -78.6 -81.2 -83 -88
WiFi Ch. 7 -78.6 -81.2 -70.7
WiFi Ch. 8 -84 -78.6 -81.2 -70.2
WiFi Ch. 9 -78.6 -81.2 -65.8
WiFi Ch. 10 -78.6 -81.2 -62
WiFi Ch. 11 -62 -78.6 -81.2 -87

8/8/2019 Spectrum Expert 3.1 Users Guide
http://slidepdf.com/reader/full/spectrum-expert-31-users-guide 72/139
Page 55
Spectrum Expert Users Guide (Version 3.1)
7 SPECTRUM PLOTS
The Spectrum Plots use graphical displays to provide detailed, low-level views of the RF
spectrum. The plots are based on data from the SAgE chip embedded in the sensor. (SAgE is
Cognio’s spectrum analyzer on-a-chip, containing advanced, on-board support for real-time
processing of spectrum data.) In this section we explain the information displayed in each plot.
Spectrum Charts are discussed in Section 8, Spectrum Charts on page 69.
7.1 Using Spectrum View Plots
For a discussion of creating spectrum plots, pausing and resuming the display, and saving plot
configurations, see Section 6, Working With Spectrum Tabs, Spectrum Plots, and Charts on
page 48. For a discussion of how to fine-tune the display of data for each plot, see Section 7.3,
Spectrum Plot Controls on page 61.
7.2 Plot Content
Spectrum View offers five different types of plots. We list all five plots here, and provide more
detailed discussion in the following pages. You can view a tooltip list of active devices by
mousing-over the trace area of a Spectrum Expert plot. Further information is available in the
Online Help.
7.2.1 Frequency-Based Plots
There are four plots which offer different views of RF power as a function of frequency. For these
plots, the entire plot is updated once per measurement interval (approximately once per second):
Real Time FFT Plot
Power vs. Frequency
FFT Duty Cycle
Swept Spectrogram – Combines a time- and frequency-based view of the RF spectrum.
7.2.2 Time-Based Plot
This plot shows the variation of an RF metric over time.
Power vs. Time – Plots data based on short time intervals (milliseconds). Mainly used
for pulse detection.
7.2.3 Real-Time FFT Plot
A Real-Time FFT plot displays RF power as a function of frequency, or in technical terms, a
Fourier transform of the RF spectrum. The data is direct data from SAgE. The plot can providethree different views: the average power (Avg) read during the most recent measurement interval;
the maximum power (Max); or the maximum power detected at any time since the plot began
running (Max Hold, meaning the plot holds onto the maximum power up to now). This plot can
also display the integrated channel power for each RF channel in RTFFT plots on a trace-by-trace

8/8/2019 Spectrum Expert 3.1 Users Guide
http://slidepdf.com/reader/full/spectrum-expert-31-users-guide 73/139
Page 56 Section 7. Spectrum Plots
Spectrum Expert Users Guide (Version 3.1)
basis by selecting the Channels On radio button in the Control Panel and use the Show Power drop-down combo box to select which channel trace should display the Integrated Channel Power.
Integrated Channel Power is the sum of all the signals present in an RF channel. Signals
are added in the mw domain and the sum is converted to dBm for display. Integrated Channel
Power is disabled when user selects “None” from the combo box. By default, the channel power of
Trace 1 is displayed. The text color of Integrated Channel Power is the same as the color of thecorresponding trace data. Integrated Channel Power is viewable only when RF channel bars are
displayed.
See Section 7.2.8, The Real-Time FFT Plot Compared with the Power vs. Frequency Plot on page
58 for more information.
7.2.4 Power vs. Frequency
The Power vs. Frequency plot is also a Fourier transform of the RF spectrum, showing the
amount of RF power detected at various frequencies. The difference between this plot and the
Real-Time FFT plot is that the Power vs. Frequency plot is generated based on an analysis of
SAgE data. This means that data can be aggregated and combined in various ways that are notpossible with direct SAgE data, the basis for the Real-Time FFT plot (above). This plot can also
display the integrated channel power for each RF channel in RTFFT plots on a trace-by-trace basis
by selecting the Channels On radio button in the Control Panel and use the Show Power drop-
down combo box to select which channel trace should display the Integrated Channel Power.
Section 7.2.8 on page 58 compares the Real-Time FFT plot with the Power vs. Frequency plot.

8/8/2019 Spectrum Expert 3.1 Users Guide
http://slidepdf.com/reader/full/spectrum-expert-31-users-guide 74/139
Page 57
Spectrum Expert Users Guide (Version 3.1)
Figure 7-1: Power vs. Frequency, FFT, FFT Duty Cycle, and Swept Spectrogram
Four of the five spectrumplots are shown at left.The highlighted plot (FFTDuty Cycle, which has apale orange background
color, rather than pale blue),is the currently selected plot.(You select a plot simply byclicking on it.)
So, for example, if youselected Spectrum PauseSelected Items from themain menu, it is the FFTDuty Cycle plot which wouldbe paused.
7.2.5 FFT Duty Cycle
The FFT Duty Cycle plot displays the percentage of the time that the ambient RF signal is 20 dB
above the noise floor. (This is represented on a per-frequency bin basis.) The Duty Cycle for the
FFT Duty Cycle plot includes all RF energy, both from 802.11 devices and interferers.
7.2.6 Swept Spectrogram
The Swept Spectrogram is a different presentation of the data shown in the Real Time FFT and
FFT Duty Cycle plots. Each colored horizontal line in the Swept Spectrogram plot displays the
RF power or duty cycle as a function of frequency, as measured over the time period of one sweep
in time (typically one second). The power or duty cycle values in each sweep are mapped to a
range of colors, and displayed in a scrolling or "waterfall" display. This allows you to observe the
FFT signals over historical time, and easily see signals with shifting frequencies and various
durations. (You select between the power or duty cycle metrics using the Control Panel.)
See Section 7.2.9, Interpreting The Swept Spectrogram Plot on page 60 for more information.
The color legend for the Swept Spectrogram is only displayed if there is enough room
on screen. Depending on your display resolution, and on how many plots you have open at once,
you may need to close some other plots in order to see the mapping of colors to power levels.

8/8/2019 Spectrum Expert 3.1 Users Guide
http://slidepdf.com/reader/full/spectrum-expert-31-users-guide 75/139
Page 58 Section 7. Spectrum Plots
Spectrum Expert Users Guide (Version 3.1)
7.2.7 Power vs. Time
The Power vs. Time plot displays RF power as a function of time. The time scales involved are
very brief — microseconds or milliseconds — so the plot is mainly used to observe RF pulse activity.
7.2.8 The Real-Time FFT Plot Compared with the Power vs. Frequency Plot
Both the Real-Time FFT plot and the Power vs. Frequency plot show RF power as a function of
frequency, at a given moment in time. However, the two plots differ in important respects:
Property Real-Time FFT Plot Power vs. Frequency Plot
Data Source SAgE Hardware: Raw spectrum data iscollected on the SAgE chip inside theSensor, and statistical analysis is alsoperformed directly by SAgE’s onboardhardware. This enables very fast analysisof large quantities of spectrum data, butwith the limitation that the parameters of
the analysis are hard-coded into the designof the SAgE chip.
SAgE plus Microprocessor Software:Raw spectrum data is provided by the SAgE chipin the Sensors, and is then analyzed by softwarerunning on the CPU inside the laptop PC.This software analysis of the spectrum dataprovides greater flexibility in the analysis, but withthe trade-off that less data can be analyzed in a
given time frame.
Dwells For both the Real-Time FFT and the Power vs. Frequency plots, the FFT analysis is performedon only 20 MHz of the band at one time. Each 20 MHz span is referred to as a “dwell.” Bymeasuring several successive, adjacent dwells, it is possible to construct a plot which isessentially similar to a Fourier transform of the entire band (2.4 GHz, 5 GHz, 900 MHz, etc.).
Bins and BinSizes
Each 20 MHz dwell is divided into 128 bins,where each bin is 156 KHz wide. A powermeasurement is provided for each bin.The number of bins, and the bandwidth ofeach bin, is fixed.
With advanced software analysis, the number ofbins, and the bandwidth of each bin, is user-defined, so you can achieve much finergranularity in your power measurements.For example, a single bin can be as narrow asabout 9.7 KHz. To get the number of bins (datapoints on the plot); divide the span being
measured by the RBW. For example, a 20 MHzspan, with an RBW of about 20 KHz, will haveabout 1000 points (bins) on the plot.

8/8/2019 Spectrum Expert 3.1 Users Guide
http://slidepdf.com/reader/full/spectrum-expert-31-users-guide 76/139
Page 59
Spectrum Expert Users Guide (Version 3.1)
Property Real-Time FFT Plot Power vs. Frequency Plot
Number of FFTsPer Plot
The Real-Time FFT Plot is updated onceper second. Each plot is actually anaverage over the 5000 FFTs performed bySAgE during each dwell.
The software-based Power vs. Frequency calculations generate only one FFT per second.That one FFT is shown in the Power vs.Frequency plot (which is updated once per
second, to reflect the new FFT).If you have set the plot to show an Average overall FFTs, the calculation is based on an averageof several preceding FFTs that were plotted;but each successive second in real time onlycontributes one new FFT to that average.
2
Max Mode? One of the plotting options is to display themaximum RF power seen during themeasurement interval. This is possiblebecause the maximum power can beselected from among the 5000 FFTs.
A maximum power plot cannot be created,because actual data is available for only one FFTper second (rather than having data for 5000FFTs, as with the real-time plot).
Advantage of
Using This Plot
Because the plot shows an average of all
5000 FFT measurements made by SAgE ina second, you are more likely to seespectrum results from devices that arefrequency hoppers, or bursty transmitters.
You can achieve much finer control over the
granularity of the spectra that you see.
Disadvantageof Using ThisPlot
You cannot control the granularity of thespectrum.
Since you only see one FFT for the entire one-second measurement interval, you are less likelyto see either frequency hoppers or bursty devices.
PlaybackMode?
This plot can be played back historically, aswell as viewed in real time.
This plot can only be viewed in real time, nothistorically.
PrimaryApplication
The primary use of this plot is for looking atbroad RF spectrum activity, covering an
entire band. This is useful for tasks likesite surveys and initial networkdeployment.
The primary use of this plot is for trouble-shooting, particularly for identifying and analyzing
the spectrum behavior of an unknown interferer.It is often most effective when looking at less thana full band.
2This footnote applies to Power vs. Frequency plots only, and not to the Real-Time FFTs. When you create the
Power vs. Frequency plot, the very first plot shows a single FFT. And — again, assuming the plot is set to be
in “Averaging” mode — the second plot adds one new FFT, and averages that with the FFT from the first plot.
Each second, one more FFT is added to the average. However – the average is not performed over all
preceding FFTs, but only for a more limited number, those included in a process known as “video
averaging.”

8/8/2019 Spectrum Expert 3.1 Users Guide
http://slidepdf.com/reader/full/spectrum-expert-31-users-guide 77/139
Page 60 Section 7. Spectrum Plots
Spectrum Expert Users Guide (Version 3.1)
7.2.9 Interpreting The Swept Spectrogram Plot
This section provides an illustrated discussion of interpreting the visual display in the Swept
Spectrogram plot. Color coding is used to indicate intensity of either RF power or RF duty cycle
(depending on which you choose to plot, using the Spectrum Plot Controls panel).
Figure 7-2: Swept Spectrogram Color Mappings For RF Power (top) and Duty Cycle (bottom)
Shown here is a comparison of how the same RF powermeasurements might look if plotted using a standard linegraph—with the height of the graph indicating RFpower—compared to using colors on a straight line as ameans to indicate power levels. (Here, blue is lesspower, yellow is more power, red is the most power.)
Time T = 1 This is the very first sweep you would see onstarting the plot. It represents the RF power (averagepower, or maximum power, or duty cycle power, per yourselection), as a function of frequency — and at thepresent moment.
The amount of power at each frequency is representedthrough the color coding scheme.
Time T = 2 In the next measurement interval (typically
one second later), the previous measurement“slides up
”
one level, becoming sweep –1.
A new sweep, representing “now”, replaces it at thebottom, becoming the new sweep 0.
Time T = n We continue, measurement interval aftermeasurement interval, with older measurements of RFpower sliding up, and the latest “now” appearing at thebottom. By mentally visualizing a vertical “slice” of thegraph, you can see how the power levels have changed
at a selected frequency going back in time. (The UParrow points from the present to the past.)

8/8/2019 Spectrum Expert 3.1 Users Guide
http://slidepdf.com/reader/full/spectrum-expert-31-users-guide 78/139
Page 61
Spectrum Expert Users Guide (Version 3.1)
7.2.10 What If No Data Is Showing?
Section 4.9 on page 42 discusses several potential reasons that you may see no data, or appear to be
seeing no data, in Spectrum Expert. We repeat here, in summary form, one particular issue unique
to the spectrum plots: incorrect amplitude settings.
With spectrum plots, you may fail to see any data if the range of the amplitude setting, the lowestand highest power values shown on the plot, is inappropriate for the actual data being monitored.
This can be a problem with any of the plots, but particularly with the Swept Spectrogram, where
RF power values and duty cycle values are mapped to colors. If all the measured data falls in a
very narrow range compared with the Color Scale, you may see nothing but a solid block of a
single color – in fact, you are seeing the correct data, but it seems as if you are seeing no data at all.
Selecting the [Auto Scale] option on these plots should normally correct this problem, but
sometimes it helps to play manually with the measurement scale. See Section 7.3.2, Amplitude on
page 62.
7.3 Spectrum Plot ControlsThe plot Control Panel lets you fine-tune the data presented by the plots. Each plot has its own
plot-appropriate controls. However, many of these controls are common to more than one plot.
We discuss the typical controls here. The Online Help fills in additional plot-specific details.
7.3.1 Frequency and Bandwidth To Monitor
Several plots provide measurements of RF power (average power, maximum power, etc.) as a
function of frequency. The RF frequencies are presented as a range across the horizontal axis.
Frequency settings enable you to establish the range of X-axis. Even for the time-based plots,
however, you can still set the band and/or channel that Spectrum Expert will monitor.
You can select the frequency to be monitored based on a Center Frequency and Span, or based ona Start/Stop frequency, or based on specific Channels. You then use the Band/Channel drop-
down menu to select a particular Band or Channel to monitor.
Once you have made a selection, the console automatically fills in default values for the Center
frequency and Span, or the Start and Stop frequency. However, you can edit these default values.
If you change the default Center frequency and frequency Span, or the Start and Stop frequencies, you may no longer be plotting entirely “in channel” or “in band.” However,
Spectrum Expert will NOT permit you to set frequencies that are outside the hardware
capabilities of the sensor technology. In this sense, the technology is “error proof ”.
You can change the bands available here — that is, the bands shown on the Frequency
menus — by changing the Monitored Bands settings (Tools Settings Monitored
Bands). See Section 12.3.3, Monitoring on page 95 for more information.
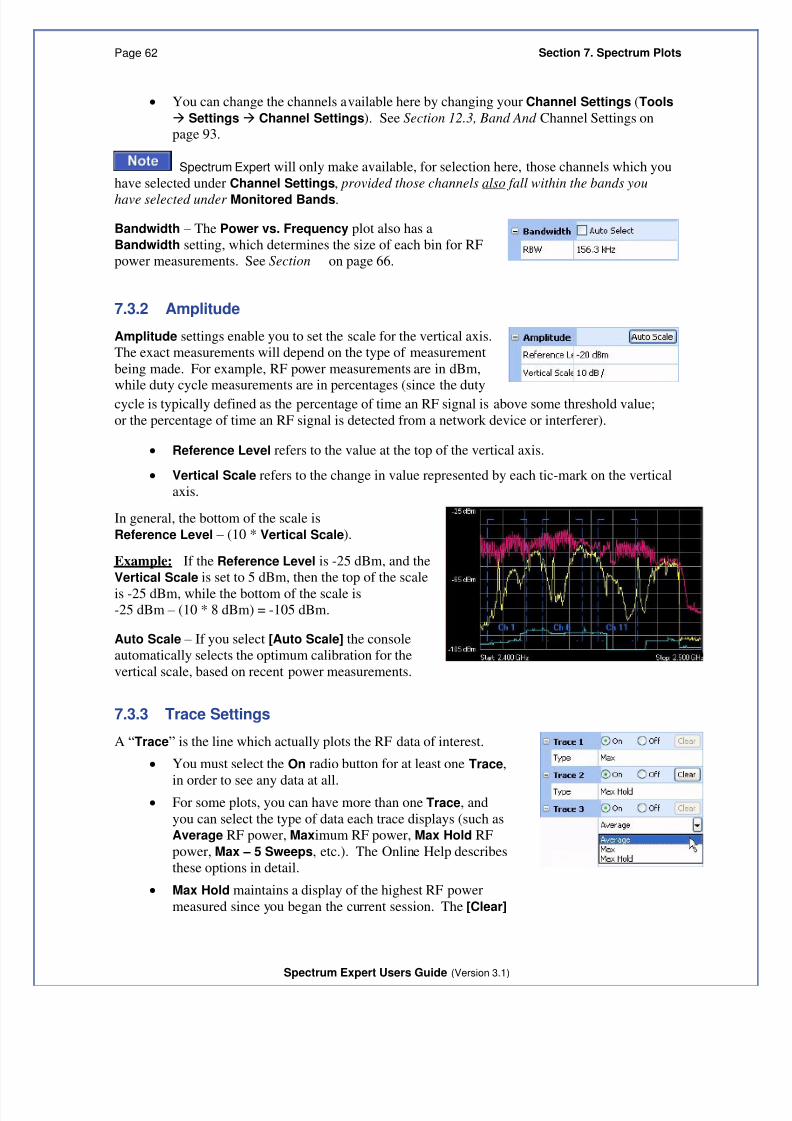
8/8/2019 Spectrum Expert 3.1 Users Guide
http://slidepdf.com/reader/full/spectrum-expert-31-users-guide 79/139
Page 62 Section 7. Spectrum Plots
Spectrum Expert Users Guide (Version 3.1)
You can change the channels available here by changing your Channel Settings (Tools
Settings Channel Settings). See Section 12.3, Band And Channel Settings onpage 93.
Spectrum Expert will only make available, for selection here, those channels which you
have selected under Channel Settings, provided those channels also fall within the bands you
have selected under Monitored Bands.
Bandwidth – The Power vs. Frequency plot also has a
Bandwidth setting, which determines the size of each bin for RF
power measurements. See Section on page 66.
7.3.2 Amplitude
Amplitude settings enable you to set the scale for the vertical axis.
The exact measurements will depend on the type of measurement
being made. For example, RF power measurements are in dBm,while duty cycle measurements are in percentages (since the duty
cycle is typically defined as the percentage of time an RF signal is above some threshold value;
or the percentage of time an RF signal is detected from a network device or interferer).
Reference Level refers to the value at the top of the vertical axis.
Vertical Scale refers to the change in value represented by each tic-mark on the vertical
axis.
In general, the bottom of the scale is
Reference Level – (10 * Vertical Scale).
Example: If the Reference Level is -25 dBm, and the
Vertical Scale is set to 5 dBm, then the top of the scale
is -25 dBm, while the bottom of the scale is-25 dBm – (10 * 8 dBm) = -105 dBm.
Auto Scale – If you select [Auto Scale] the console
automatically selects the optimum calibration for the
vertical scale, based on recent power measurements.
7.3.3 Trace Settings
A “Trace” is the line which actually plots the RF data of interest.
You must select the On radio button for at least one Trace,
in order to see any data at all. For some plots, you can have more than one Trace, and
you can select the type of data each trace displays (such as
Average RF power, Maximum RF power, Max Hold RF
power, Max – 5 Sweeps, etc.). The Online Help describes
these options in detail.
Max Hold maintains a display of the highest RF power
measured since you began the current session. The [Clear]

8/8/2019 Spectrum Expert 3.1 Users Guide
http://slidepdf.com/reader/full/spectrum-expert-31-users-guide 80/139
Page 63
Spectrum Expert Users Guide (Version 3.1)
button deletes the Max Hold Trace, and starts a newmaximum power trace, starting from the moment when
[Clear] is selected.
7.3.4 Markers
A marker is a small icon on the plot which “rides” the graph at a particular point along the X-axis,
in other words, at a particular frequency. The marker moves up and down according to the
movement of the graph at that fixed point. The marker is the small red box riding the bottom trace
in the plot shown here:
On / Off – Indicates whether the markeris on or off, that is, in use at all.
Type – A Single marker is just that,
one marker that “rides” the trace. If
you select Delta, you will initially still
see a single marker on the plot.
However — with a quick “mouse
hand”— you can grab the marker with
your mouse pointer (click and hold on
the marker), and slide the marker to a
second location on the plot. You now
have two markers riding the trace, so
that you can see the difference inbehavior between two different
frequencies.
Trace – For plots that allow more than
one trace, use the drop-down list box to
select which of the traces the marker
will ride.
Value – Indicates where along the X-
axis (the frequency or time axis) themarker should ride the plot.
Moving The Marker With The Mouse:
You can indicate the frequency value usingthe Value text box. However, once the
marker is visible on screen, you can grab the
marker (click and hold the left mouse
button), and drag the marker to a new
location (a new frequency or time).
Peak Search – With the marker Peak
Search mode, the plot is continually
Highest Peak
Next Peak Up
Next Peak Down
Next Peak Left
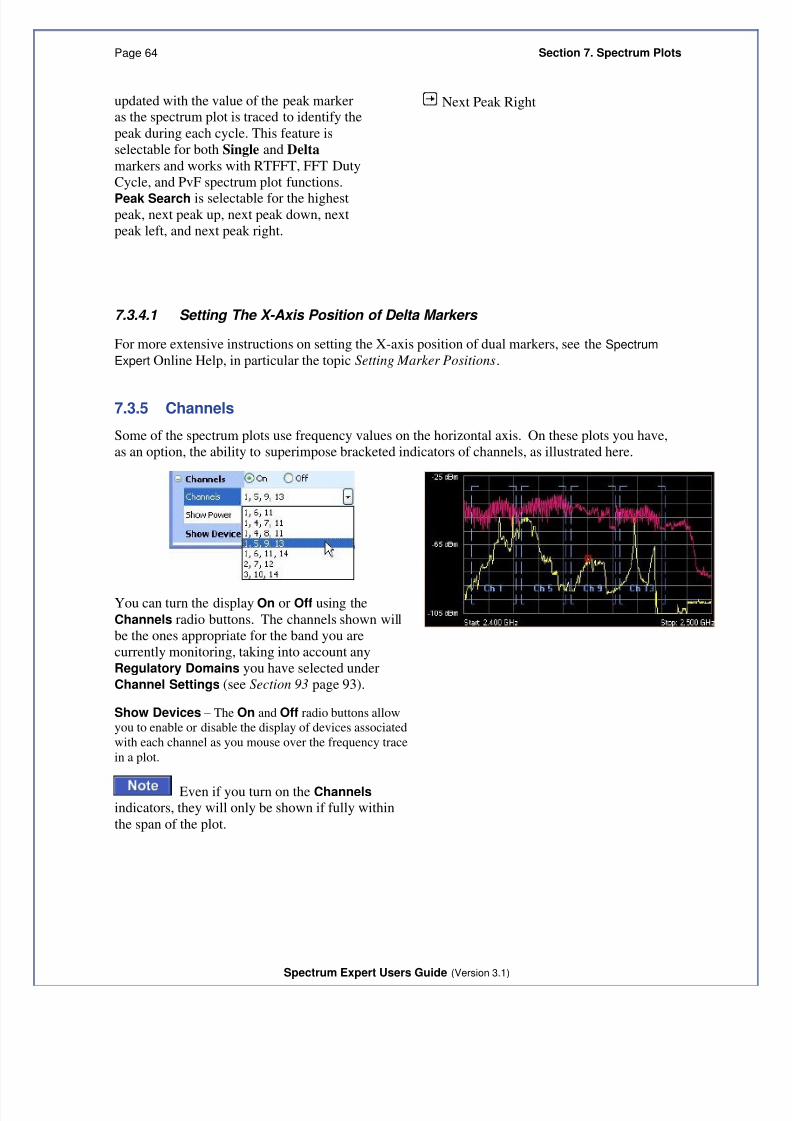
8/8/2019 Spectrum Expert 3.1 Users Guide
http://slidepdf.com/reader/full/spectrum-expert-31-users-guide 81/139
Page 64 Section 7. Spectrum Plots
Spectrum Expert Users Guide (Version 3.1)
updated with the value of the peak markeras the spectrum plot is traced to identify the
peak during each cycle. This feature is
selectable for both Single and Delta
markers and works with RTFFT, FFT Duty
Cycle, and PvF spectrum plot functions.
Peak Search is selectable for the highestpeak, next peak up, next peak down, next
peak left, and next peak right.
Next Peak Right
7.3.4.1 Setting The X-Axis Position of Delta Markers
For more extensive instructions on setting the X-axis position of dual markers, see the Spectrum
Expert Online Help, in particular the topic Setting Marker Positions.
7.3.5 Channels
Some of the spectrum plots use frequency values on the horizontal axis. On these plots you have,
as an option, the ability to superimpose bracketed indicators of channels, as illustrated here.
You can turn the display On or Off using the
Channels radio buttons. The channels shown will
be the ones appropriate for the band you are
currently monitoring, taking into account any
Regulatory Domains you have selected under
Channel Settings (see Section 93 page 93).
Show Devices – The On and Off radio buttons allow
you to enable or disable the display of devices associated
with each channel as you mouse over the frequency trace
in a plot.
Even if you turn on the Channels indicators, they will only be shown if fully within
the span of the plot.

8/8/2019 Spectrum Expert 3.1 Users Guide
http://slidepdf.com/reader/full/spectrum-expert-31-users-guide 82/139
Page 65
Spectrum Expert Users Guide (Version 3.1)
7.3.6 Other Plot Control Panel Settings
7.3.6.1 Power vs. Time
The Power Vs. Time plot is used to display short burst of RF activity, known as “pulses”.
Sweep Time – This sets the time scale over which pulse activity is measured.Specifically, it sets the range of the X-axis, which will run from a low value of –Sweep
Time up to the present. You can use the spin control to change the setting, or type in a
value directly. Type “ms” for microseconds and “us” for milliseconds. For example:
150 us.
The plot also has a specialized Bandwidth setting:
RBW – Determines the span of the spectrum monitored for power. This works in
conjunction with the Center Frequency setting for the same plot. The low end of the
monitored band is Center Frequency – RBW/2, and the high end is Center Frequency
+ RBW/2.
This is not the same definition for RBW that applies for the Power vs. Frequency plot(discussed below), where RBW sets the bin size for the X-axis.
The Power vs. Time plot also has a series of Trigger settings. Trigger criteria determine both
what kinds of RF pulses are displayed, and when the display is updated.
Trigger Type – This determines when the plot is updated.
Free Run – RF energy (in your selected bandwidth) is sampled on a continuous basis,
and data is “dumped” to the screen as it is available. This means the display is updated
on a nearly constant basis, and data is shown whether or not any RF pulses are
detected.
Single – This catches a single pulse only. The display is only updated when an RFpulse is detected which matches your Trigger Threshold criteria (discussed below). If
you select Single, you must then click on [Arm] (discussed below).
Once such a pulse event is detected, it is displayed on the plot, and the plot is then
frozen – no further activity is displayed. To catch any further pulses, you click again on
[Arm].
Continuous – The plot is only updated when Spectrum Expert detects RF pulses which
match your Trigger Threshold criteria. However, after detecting a pulse, the plot
automatically “re-arms” itself, meaning every time a new pulse comes along, the plot is
updated with new data. (Once again, of course, the pulses are only shown if they also
fall within the bandwidth you have indicated, using the options above.)
[Arm] – If you have selected a Trigger Type of Single, select [Arm] to tell the Spectrum
Expert Application to be on the lookout for the next pulse that comes along.
Trigger Threshold – This indicates the minimum power that an RF pulse must attain in
order to register as a pulse, for purposes of this plot. Put another way: In order to be
counted as a pulse at all, for purposes of this plot, an RF pulse must exceed the amount of
power you indicate here. Units are in dBm, where 0 dBm is equivalent to 1 milliwatt.
8/8/2019 Spectrum Expert 3.1 Users Guide
http://slidepdf.com/reader/full/spectrum-expert-31-users-guide 83/139
Page 66 Section 7. Spectrum Plots
Spectrum Expert Users Guide (Version 3.1)
For example, if you indicate -10 dBm, then a pulse which reaches -5 dBm will be displayed,while a pulse whose maximum power is only -12 dBm will not be displayed.
Using The Mouse: Once the trigger line is shown on screen (as a white horizontal
line), you can also change the setting by clicking-and-holding on the line with the mouse, and
dragging it up or down. The current Threshold is displayed on the plot, just above the line.
Trigger Delay – This adjusts the centering of a pulse on your display. The default value
is 0, and with this setting the beginning of an RF pulse is always centered on the midline
of the time axis. If you set this to a positive value, the beginning of the RF pulse is offsetto the left. If you set this to a negative value, the beginning of the pulse is offset to the
right.
Power Vs. Frequency Plot Bandwidth – The Power vs. Frequency plot has a
Bandwidth setting, which determines the size of each bin for RF power measurements.
A "bin" is the smallest span of spectrum for which power measurements are displayed.
Auto Select – If you select this check box, Spectrum Expert automatically picks the
optimum bin size. The value selected by the Console will vary depending on the total
bandwidth you choose to measure (using the Frequency settings).
RBW – RBW stands for "resolution bandwidth". Effectively, the bin sizes for RF power
measurements will be just slightly larger than the value that you enter here. (So, for
example, if you enter 60 kHz, your bins will be roughly 70 to 90 kHz wide.) You can
only enter a value here if you first de-select the Auto Select check box.
This is not the same definition for RBW that applies for the Power vs. Time plot
(discussed above), where RBW sets the size of the total bandwidth being monitored.
When you enter a value for RBW for the Power vs. Frequency plot, Spectrum Expert may
"auto-adjust" your entry to the nearest valid value. The formal definition of RBW is the 3 dB
bandwidth of the spectrum analyzer detection filter. The RBW determines the minimumfrequency spacing that is allowed between two pure frequencies, in order for the frequencies to
actually be distinguished as separate signals.
Example: If RBW is set to 70 kHz, then two signals which are separated by only 60 kHz in
frequency will appear as one signal, with a combined power measurement for both signals.
Total Number of Bins – The total number of bins is approximately the Span being
monitored divided by the RBW.
For example, if a 100 MHz span of the spectrum is being viewed — and if that span is
divided into bins of 2 MHz in size — then the plot displays 50 separate power readings,
indicating the power detected in each separate 2 MHz bin.
The minimum number of bins is never less than 16, and the maximum number
of bins on the plot is at most 1024. If you try to establish settings for the Span and RBW
which would cause higher or lower bin values, Spectrum Expert will auto-adjust the RBW
or Span setting to bring the number of bins within the allowed range.
The Power Vs. Frequency plot also has a series of Trigger settings, similar to those for Power Vs.
Time:

8/8/2019 Spectrum Expert 3.1 Users Guide
http://slidepdf.com/reader/full/spectrum-expert-31-users-guide 84/139
Page 67
Spectrum Expert Users Guide (Version 3.1)
Trigger Type – This determines when the plot is updated. Use the drop-down list box to
select one of the three options.
Free Run – RF energy (in your selected bandwidth) is sampled on a continuous basis,
and data is “dumped” to the screen as it is available.
Single – The display is only updated when RF energy is detected which matches your
Trigger Threshold criteria (discussed below). If you select Single, you must thenclick on [Arm] (discussed below).
Once such RF energy is detected, it is displayed on the plot, and the plot is then frozen
– no further activity is displayed. To catch any further activity, you click again on
[Arm].
Continuous – The plot is only updated when Spectrum Expert detects RF energy
which matches your Trigger Threshold criteria. However, the plot automatically “re-
arms” itself, meaning every time a RF energy comes along which exceeds the Trigger
Threshold, the plot is updated with new data.
[Arm] – If you have selected a Trigger Type of Single, select [Arm] to tell the Spectrum
Expert Application to be on the lookout for the RF energy which exceeds your TriggerThreshold.
Trigger Threshold – This indicates the minimum RF power must be seen in order to
update the plot. Units are in dBm, where 0 dBm is equivalent to 1 milliwatt.
For example, if you indicate -10 dBm, then RF energy which reaches -5 dBm will cause the
display to be updated, while RF energy below -10 dBm does not result in any update.
7.3.6.2 Using The Mouse: Once the trigger line is shown on screen (as a white horizontal line), you can also change the setting by clicking-and- holding on the line with the mouse, and dragging it up or down. The
current Threshold is displayed on the plot, just above the line. Swept Spectrogram
The Swept Spectrogram plot uses colors to represent RF power levels. The Color Scale options
enable you to map the “highest color” and “lowest color” to specific power levels.
Here, the color Blue has been mapped to -110 dBm, while Red has
been mapped to -30 dBm.
Values below the minimum value (-110 dBm, in this case) are
automatically mapped to Purple, while values above the maximum
value (-30 dBm here) are automatically mapped to White .
Color Scale Visibility: For the Swept Spectrogram, the color scale is only visible
when there is enough room to display it on screen. Depending on how many plots you have open,
and on your display monitor resolution, you may need to close some plots to see the color scale.
[Auto Scale] serves the same purpose as elsewhere – it chooses appropriate upper- and lower-
values based on recent power measurements.

8/8/2019 Spectrum Expert 3.1 Users Guide
http://slidepdf.com/reader/full/spectrum-expert-31-users-guide 85/139
Page 68 Section 7. Spectrum Plots
Spectrum Expert Users Guide (Version 3.1)
7.3.6.3 FFT Duty Cycle Plot
For the FFT Duty Cycle plot, the scale of the Y-axis is based on a Maximum and Minimum, where(typically) the Maximum would be 100%, and the Minimum would be 0%.
8/8/2019 Spectrum Expert 3.1 Users Guide
http://slidepdf.com/reader/full/spectrum-expert-31-users-guide 86/139
Page 69
Spectrum Expert Users Guide (Version 3.1)
8 SPECTRUM CHARTS
The Spectrum Expert Spectrum Charts use bar, line, and pie charts to provide broad summary
information about activity in the RF spectrum. Like the spectrum plots, the spectrum charts are
based on data from the SAgE chip embedded in the sensor. In this section we explain the kinds of
information displayed in each graph.
8.1 Using Spectrum View Charts
For a discussion of creating charts, pausing/resuming the display, and saving chart configurations,
see Section 6, Working With Spectrum Tabs, Spectrum Plots, and Charts on page 48.
Spectrum Plots are discussed in Section 7, Spectrum Plots on page 55.
8.2 Chart Content
Spectrum View offers seven different types of charts. We list all charts here, and provide more
detailed discussion in the following pages.
Active Devices
Devices vs. Channels
Devices vs. Time
Channel Utilization
Channel Utilization vs. Time
Interference Power
SNR
8.2.1 Active Devices
A pie chart which indicates — via different sized “slices” of the pie — what percentage of your RFactivity is coming from different kinds of RF sources. You select which channel / band to monitor.
8.2.2 Devices vs. Channels
A bar chart displays the number of devices detected on different channels. You can select which
frequency bands or channels will be monitored.
8.2.3 Devices vs. Time
A line chart displays the number of devices detected at different times. You can select the time
interval of interest (ranging from ten minutes up to 24 hours), the channel or band to monitor, and
the types of devices which will be tracked on the plot.

8/8/2019 Spectrum Expert 3.1 Users Guide
http://slidepdf.com/reader/full/spectrum-expert-31-users-guide 87/139
Page 70 Section 8. Spectrum Charts
Spectrum Expert Users Guide (Version 3.1)
8.2.4 Channel Utilization
A bar chart displays RF duty cycle as a function of channel activity. You can select which
frequency bands or channels will be plotted.
8.2.5 Channel Utilization vs. Time
A line chart displays RF duty cycle as a function of time. You can select the time interval of
interest (ranging from ten minutes up to 24 hours), and the channel or band to monitor.
For longer time intervals, you can also select how data is aggregated – that is, you can track the
average duty cycle, the maximum duty cycle, or the minimum duty cycle.
Figure 8-1: Spectrum Charts
8.2.6 Interference Power
A bar chart that shows the power for each selected channel. The height of the bar shows the
maximum power of all interference signals. Each bar consists of several lines representing the
signal strength of a specific device type. The receive signal strength of the strongest In-Network
Wi-Fi AP on each channel is shown by a + (plus) sign. The Wi-Fi noise floor is represented by a
horizontal line across the grid background.
In RFID mode, the power of the RFID readers is represented by a horizontal line. Everything else
is the same as in Wi-Fi mode.

8/8/2019 Spectrum Expert 3.1 Users Guide
http://slidepdf.com/reader/full/spectrum-expert-31-users-guide 88/139
Page 71
Spectrum Expert Users Guide (Version 3.1)
Figure 8-2: Interference Power Chart for Wi-Fi Figure 8-3: Interference Power Chart for RFID
The X-axis shows the channels, and the Y-axis shows the signal strength (from -100 dBm to 0
dBm). The height of the bar indicates the cumulative power (in dBm) for all devices in this
category that affect a given channel.
To view channel and power information:
Place the mouse to hover over a stacked bar to view pop-up information about the
channel, maximum power, and the signal strength of each interfering device. Or, place
the mouse to hover over a + sign to view pop-up information about the channel and the
signal strength of the strongest In-Network Wi-Fi AP.
Right-click either a stacked bar or + sign to view the same pop-up menu available on the
Devices vs. Channel chart.
8.2.7 SNR (Signal To Noise Ratio)
A color coded bar chart that displays the SNR for each channel having APs. The SNR chart also
displays signal degradation using green, yellow, and red zones. SNR is the ratio of a given
transmitted signal to the background noise on the channel.
SNR is not supported in RFID mode.
Grey zone – SNR’s of above 20 dB
indicating a good SNR
Yellow zone - SNR’s between 10
and 20 dB indicating a less thangood but better than critical SNR
Red zone – SNR’s less than 10 dBindicating a critically low SNR

8/8/2019 Spectrum Expert 3.1 Users Guide
http://slidepdf.com/reader/full/spectrum-expert-31-users-guide 89/139
Page 72 Section 8. Spectrum Charts
Spectrum Expert Users Guide (Version 3.1)
The X-axis shows the channels and the Y-axis shows the SNR power level (from -50 dB to 50 dB).The height of the bar above or depth of the bar below the 0 dB line indicates the SNR (in dB) for a
given channel.
8.3 Bar Indicators
On the Channel Utilization, Devices vs. Channel, and Interference Power charts the
colored bars indicate the power level for each channel. Each interfering device is
represented by a different color. A legend showing the devices and their associated
colors is located at the top of the screen. Consequently, each colored section of the
graphed bars map to the device legend.
The height of the bar shows the maximum power of all interference signals. Each color
segment shows the contribution of a specific device type to the maximum power.
On the Interference Power chart, the receive signal strength of the strongest In-Network Wi-Fi AP
of each channel is represented by a + (plus) sign.
8.3.1 Navigate to Other Views
The bars and graphs on certain charts allow you to obtain additional information on a particular
channel. You can navigate from Spectrum View to Devices or Channel Summary View. On the
following plots/charts: Channel Utilization, Devices vs. Channel, Real Time FFT, FFT Duty
Cycle, Swept Spectrogram, and Power vs. Frequency right-click on a channel bar (or anywhere
in the workspace of the plot) to display the pop-up menu. Select Show Devices Affecting
<channel ID> to display the active devices in Devices View. Select Show Channel <channel ID>
to display related data on this channel (highlighted in blue) in Channel Summary View. The Real
Time FFT can also display the integrated channel power for each RF channel.
8.4 Chart Controls
The chart Control Panel lets you fine-tune the data presented by the charts.
Concerning band and channel selections, first note the following:
You can change the bands available here — that is, the bands shown on the Channel
menus — by changing the Monitored Bands settings (Tools Settings Monitored
Bands). See Section 12.3.3, Monitoring on page 95 for more information.
You can change the channels available here by changing your Channel Settings
(Tools Settings Channel Settings). See Section 12.3, Band And Channel Settings
on page 93.
Spectrum Expert will only make available, for selection here, those channels which
you have selected under Channel Settings, provided those channels also fall within the bands
you have selected under Monitored Bands. (In other words, the available channels are
determined by the intersection of your Channel Settings and Monitored Bands.)
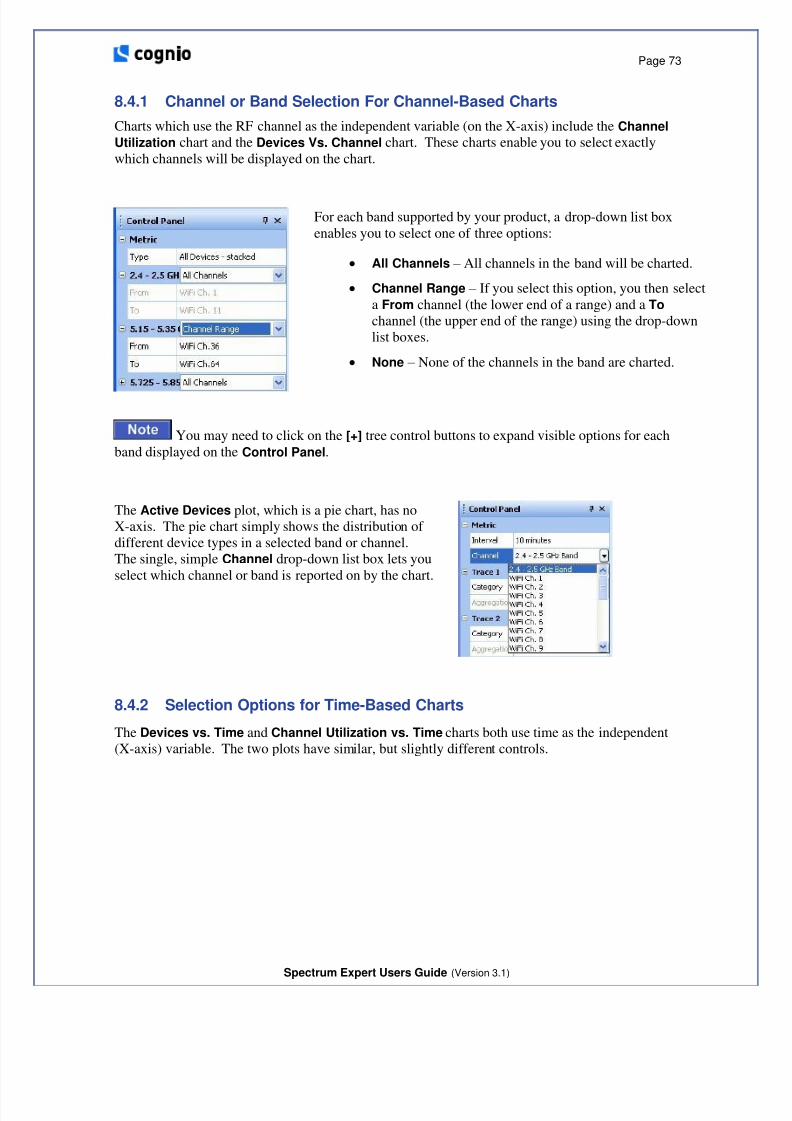
8/8/2019 Spectrum Expert 3.1 Users Guide
http://slidepdf.com/reader/full/spectrum-expert-31-users-guide 90/139
Page 73
Spectrum Expert Users Guide (Version 3.1)
8.4.1 Channel or Band Selection For Channel-Based Charts
Charts which use the RF channel as the independent variable (on the X-axis) include the Channel
Utilization chart and the Devices Vs. Channel chart. These charts enable you to select exactly
which channels will be displayed on the chart.
For each band supported by your product, a drop-down list box
enables you to select one of three options:
All Channels – All channels in the band will be charted.
Channel Range – If you select this option, you then select
a From channel (the lower end of a range) and a To
channel (the upper end of the range) using the drop-down
list boxes.
None – None of the channels in the band are charted.
You may need to click on the [+] tree control buttons to expand visible options for each
band displayed on the Control Panel.
The Active Devices plot, which is a pie chart, has no
X-axis. The pie chart simply shows the distribution of
different device types in a selected band or channel.
The single, simple Channel drop-down list box lets you
select which channel or band is reported on by the chart.
8.4.2 Selection Options for Time-Based Charts
The Devices vs. Time and Channel Utilization vs. Time charts both use time as the independent
(X-axis) variable. The two plots have similar, but slightly different controls.
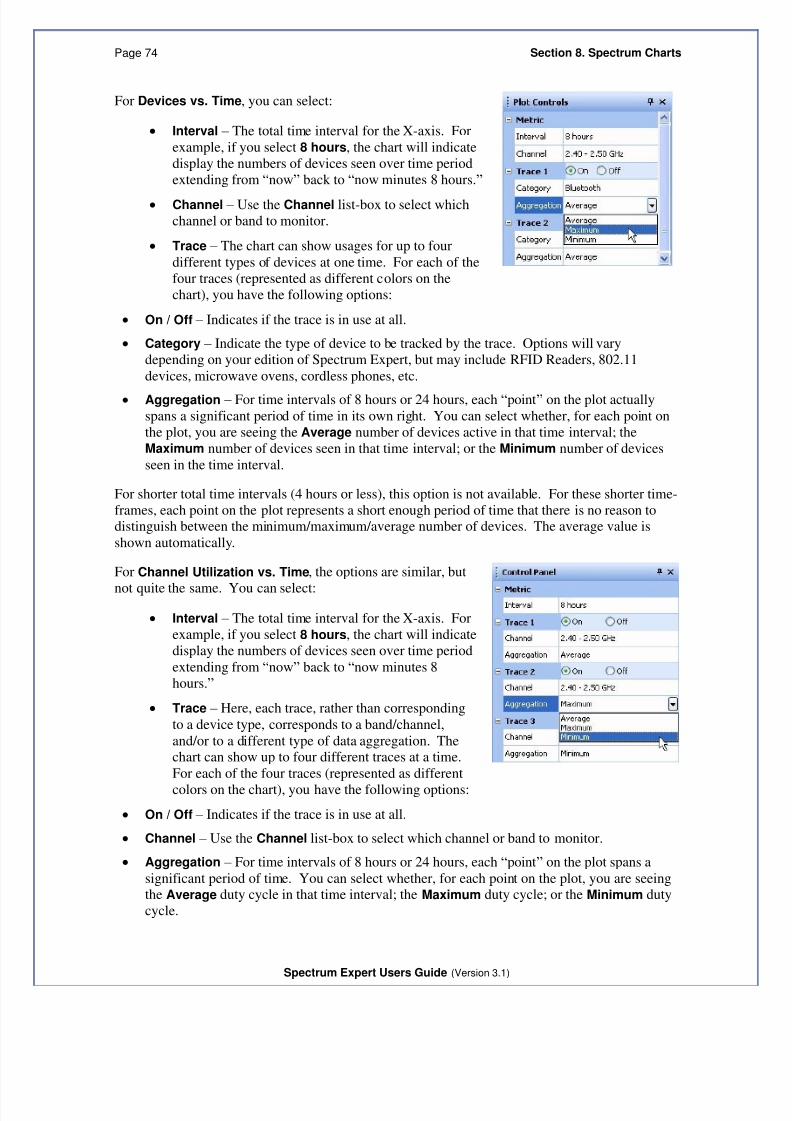
8/8/2019 Spectrum Expert 3.1 Users Guide
http://slidepdf.com/reader/full/spectrum-expert-31-users-guide 91/139
Page 74 Section 8. Spectrum Charts
Spectrum Expert Users Guide (Version 3.1)
For Devices vs. Time, you can select:
Interval – The total time interval for the X-axis. For
example, if you select 8 hours, the chart will indicate
display the numbers of devices seen over time period
extending from “now” back to “now minutes 8 hours.”
Channel – Use the Channel list-box to select which
channel or band to monitor.
Trace – The chart can show usages for up to four
different types of devices at one time. For each of the
four traces (represented as different colors on the
chart), you have the following options:
On / Off – Indicates if the trace is in use at all.
Category – Indicate the type of device to be tracked by the trace. Options will vary
depending on your edition of Spectrum Expert, but may include RFID Readers, 802.11
devices, microwave ovens, cordless phones, etc.
Aggregation – For time intervals of 8 hours or 24 hours, each “point” on the plot actually
spans a significant period of time in its own right. You can select whether, for each point on
the plot, you are seeing the Average number of devices active in that time interval; the
Maximum number of devices seen in that time interval; or the Minimum number of devices
seen in the time interval.
For shorter total time intervals (4 hours or less), this option is not available. For these shorter time-
frames, each point on the plot represents a short enough period of time that there is no reason todistinguish between the minimum/maximum/average number of devices. The average value is
shown automatically.
For Channel Utilization vs. Time, the options are similar, but
not quite the same. You can select:
Interval – The total time interval for the X-axis. For
example, if you select 8 hours, the chart will indicate
display the numbers of devices seen over time period
extending from “now” back to “now minutes 8
hours.”
Trace – Here, each trace, rather than corresponding
to a device type, corresponds to a band/channel,
and/or to a different type of data aggregation. Thechart can show up to four different traces at a time.
For each of the four traces (represented as different
colors on the chart), you have the following options:
On / Off – Indicates if the trace is in use at all.
Channel – Use the Channel list-box to select which channel or band to monitor.
Aggregation – For time intervals of 8 hours or 24 hours, each “point” on the plot spans a
significant period of time. You can select whether, for each point on the plot, you are seeingthe Average duty cycle in that time interval; the Maximum duty cycle; or the Minimum duty
cycle.

8/8/2019 Spectrum Expert 3.1 Users Guide
http://slidepdf.com/reader/full/spectrum-expert-31-users-guide 92/139
Page 75
Spectrum Expert Users Guide (Version 3.1)
For shorter total time intervals (4 hours or less), this option is not available. For these shorter time-frames, each point on the plot represents a short enough period of time that there is no reason to
distinguish between the minimum/maximum/average duty cycle. The average value is shown
automatically.

8/8/2019 Spectrum Expert 3.1 Users Guide
http://slidepdf.com/reader/full/spectrum-expert-31-users-guide 93/139
Page 76 Section 9. Devices View
Spectrum Expert Users Guide (Version 3.1)
9 DEVICES VIEW
The Devices View shows detailed statistics for each device, including both currently active devices
and historical devices. Devices listed here include both network devices and interferers.
You access this view by selecting the Devices tab. The data in Devices View is organized in
tabular form. (The following list of fields is provisional, and subject to change without notice.)
Device – The name of the interfering device.
Signal Strength (dBm) – Average received signal strength (log average) for pulses from
the device.
Duty Cycle (%) – Measured duty cycle for this device
Discovery Time – When the device was first detected
On Time – Amount of time the device has been on since it was detected
Channels Affected – Channels affected by transmissions from this device
Network ID – Network address for this device, if available (for example, the BSSID
for 802.11 device, or the piconet address for Bluetooth devices)
Device ID – The device address for the device, if available. Examples would be the
MAC address for 802.11 APs, the device address for Bluetooth devices, etc.
If there is more than one instances of a device type, the number of instances will be indicated in
brackets (for example, [5]) in the Device Name field.
Figure 9-1: Devices View
In the default view, not all the fields are shown. You can add or delete columns, as
discussed in Section 9.1.2 on page 77.

8/8/2019 Spectrum Expert 3.1 Users Guide
http://slidepdf.com/reader/full/spectrum-expert-31-users-guide 94/139
Page 77
Spectrum Expert Users Guide (Version 3.1)
9.1 Working With Devices View
9.1.1 Devices View and the Active Devices Panel
Normally, when the Devices View is in the foreground, Spectrum Expert automatically hides theActive Devices panel. However, you can have both Devices View and the Active Devices panel
on display at the same time. See Section 5.4, Active Devices and Devices View on page 45.
9.1.2 Adjusting The Column Display
Resize Columns – You can resize the columns by using the mouse to select the dividing
line between columns, and sliding the line to the left or right.
Change Column Order – You can change the order of columns by left-clicking-and-
holding on a column heading, and dragging the column to the left or right. (This works
exactly the same as moving columns in the Windows Explorer.)
The Device Name column is always the first column when viewing in the Tree
View. You cannot switch the placement of this column.
Add or Delete Columns – Not all of the available columns needs be on display at one
time. In fact, in the default view, several columns are normally omitted.
You can add any of the available columns by right-clicking on the column headings.
From the pop-up menu, select Add Column <column name>.
You can delete a column by right-clicking on any column heading. From the pop-up
menu, select Remove Column.
Saving The Current Column Settings –
Your current column settings are automaticallysaved when you exit the Spectrum Expert Console application.
Restore The Default Column Settings – You can restore the default column
configuration by right-clicking on the column headings. From the pop-up menu, select
Use Default Column Settings.
Column Definitions – To obtain a definition for any column, hover the mouse pointer
over the column heading. A definition for that column heading appears in a tooltip
window.
9.1.3 Selecting The Display Type
There are two viewing modes available in Devices View.
Tree View – In this view, devices in column one (Device Name) are organized
hierarchically, first under a device type heading, then under a network master (for
example, AP, base station) heading. This is the default view after start-up. The
following device type headings apply for the tree view:
Wi-Fi APs (In Network) (Wi-Fi product only)
Wi-Fi APs (Known) (Wi-Fi product only)

8/8/2019 Spectrum Expert 3.1 Users Guide
http://slidepdf.com/reader/full/spectrum-expert-31-users-guide 95/139
Page 78 Section 9. Devices View
Spectrum Expert Users Guide (Version 3.1)
Wi-Fi APs (Unknown) (Wi-Fi product only)
Wi-Fi Ad-Hocs (Wi-Fi product only)
RFID Readers (RFID product only)
Bluetooth Piconets
Cordless Phones
Microwave Ovens Continuous Transmitters
Burst Transmitters
Chirp Transmitters
List View – In this view, there is no hierarchical organization for Device Name data.
In the default List View the Device Name column is not the first column, a new column,
Categories, appears first.
You can switch between these two viewing modes by selecting the Tree View or List View radio
buttons in the Device Controls panel at the left side of the Console. (If the Device Controls panel
is not showing, select View Control Panel.)
9.1.4 Setting The Time Range
You can set the time range and channel for which devices will be listedby using the drop-down list box on the Device Controls panel.
Figure 9-2: Device Control Panel
9.1.5 Sorting The Display
You can sort the data in the Devices View by any of the column headings.
Primary Sort Column – The primary sort is invoked by left-clicking on the column
heading. The primary sort column is indicated with a single tick-mark.
Secondary Sort Column – The secondary sort is invoked by shift-clicking on a column
heading. The secondary sort column is indicated with a double-tick mark.
The sorts do not affect the outline headings in the Device Name column (the first column) for the
hierarchical viewing mode; for this mode the sort is applied only to the data at the lowest level in
the hierarchy for each outline heading. The default sort order is:
Primary – Device (ascending)
Secondary – Duty Cycle (descending)

8/8/2019 Spectrum Expert 3.1 Users Guide
http://slidepdf.com/reader/full/spectrum-expert-31-users-guide 96/139
Page 79
Spectrum Expert Users Guide (Version 3.1)
9.1.5.1 Ascending and Descending Sort Order
For any given column, you can toggle between ascending sort order and descending order simply
by clicking on the column heading. (If the column is currently sorted in ascending order, clicking
once sets it to descending order; clicking again restores it to ascending order.)
This works exactly the same for the secondary sort column – repeated shift-clicking toggles
between ascending and descending order.
9.1.6 Keeping Your Eye On A Particular Device
If there is a particular device that is of interest to you, you can keep an eye on the device simply by
clicking on it. Your selected row will be highlighted. As new devices as detected (or disappearfrom view), the Device List will auto-scroll and auto-sort. However, the Mobile Console will
make sure your highlighted row always remains in view. (In other words, auto-scrolling and auto-
sorting will be adjusted so that the highlighted row always remains visible on the Mobile Console.)
9.1.7 Locating A DeviceThe Spectrum Expert Application’s Device Finder mode enables you to use your PC as a “sniffer”
to track down a specific interfering device. Device Finder is discussed in detail in Section 11 on
page 83.
HINT: To get started, you can right-click on any interfering device shown in the Devices View.
Assuming the device is currently transmitting, you can select Find This Device from the pop-up
menu. This starts the Device Finder mode. If the selected device is not currently active, the Find
This Device option will be grayed out.
The Device Finder can only locate certain types of devices. If you right-click on a
device that can't be located, you will not be able to access the Find This Device option. Also, a
device must be currently active (transmitting) in order to find it. If, in Devices View, you click on
a device which is not currently transmitting, you will not be able to access the Find This Device
option..
9.1.8 Obtaining Detailed Information On A Device
To obtain detailed information for any device, double-click on the device in the list. A pop-up
dialog box appears showing detailed information for that device.
9.2 Miscellaneous Device Issues
This section describes miscellaneous issues that affect data displayed in the Device View.
9.2.1 Signal Bounce and Fading
Narrowband signals — such as signals from analog FM cordless phones or analog video cameras —
are prone to “fading.” Signals naturally fade (grow weaker) with increased distance from an RF
signal source. But as a technical term, “fading” refers to the fact that as a signal travels; it bounces

8/8/2019 Spectrum Expert 3.1 Users Guide
http://slidepdf.com/reader/full/spectrum-expert-31-users-guide 97/139
Page 80 Section 9. Devices View
Spectrum Expert Users Guide (Version 3.1)
and reflects off of multiple surfaces. So, at some distance from a single source, that single sourceof RF power results in multiple signals (all from the same source) crisscrossing each other.
When a single RF signal — reflected from multiple directions — crosses paths with itself, the result
is signal interference. Signal interference can be constructive (resulting in a stronger signal at a
given point), or destructive (resulting in a weaker signal, or even no signal, at a distance not at all
far from the original source).
The result is that, at a given receiving antenna, the signal can vary greatly in power when the
antenna is moved just a few inches in any direction. To further complicate matters: As people and
other objects in the environment move, the source signal is reflected differently. So even if the
receiving antenna stays in one place, signal strength can vary unpredictably over time.
As a result, when Spectrum Expert is detecting a narrowband interferer, the detection status may
toggle on and off due to fading. Fading occurs in most indoor environments, and the fluctuations
in received signal level are typically correlated to the rate of motion for nearby people/objects.
9.2.2 Near/Far Effect
The presence of strong signals may further impair the ability of the classification software to detect
weaker signals. This is the so-called near/far effect, which is caused when the strong and weak signals use up the limited dynamic range of the receiver. (In other words, the receiver can only
handle so much signal strength, in total, at one time. So if the receiver is getting two signals, the
strong one can essentially swamp the weaker one.)
Example: When you walk near one cordless phone while you are simultaneously listening to
another cordless phone that’s far away (for example, at your next-door neighbor’s house), you may
find that you lose the weaker signal. When you turn off the near-by cordless phone, you may find
that you can detect the weaker signal again.
These effects cannot be removed by Spectrum Expert. The only thing we can do is make you aware
of them, so that you can understand why it is that certain interferers fade in and out of view attimes.
9.2.3 Device Detection Time
In general, the time required for Spectrum Expert to detect and classify devices, and reclassify their
status if they go from being On to Off, will vary depending on the RF environment and location of
devices relative to sensor. In general most devices (other than 802.11) should take on the order of
5 to 30 seconds. However, 802.11a/b/g devices and 802.11 frequency hoppers may take as long as
ten minutes to be detected.

8/8/2019 Spectrum Expert 3.1 Users Guide
http://slidepdf.com/reader/full/spectrum-expert-31-users-guide 98/139

8/8/2019 Spectrum Expert 3.1 Users Guide
http://slidepdf.com/reader/full/spectrum-expert-31-users-guide 99/139
Page 82 Section 10. Channel Summary
Spectrum Expert Users Guide (Version 3.1)
In-Network AP Max Power (dBm) – The maximum power level (in dBm) of the
strongest In-Network Wi-Fi (802.11) device on the channel.
Interference (dBm) – Power level (in dBm) of the maximum interference on the channel
(including Wi-Fi interference).
SNR (dB) – The signal to noise ratio’s, expressed in dB, for each channel having APs
present.
In-Network AP(s) – The number of Wi-Fi ACI’s identified as being in the network
transmitting on the channel.
Known APs – Network devices (APs) impacting your network, but which are not
actually part of your network (e.g., APs from neighboring Wi-Fi networks).
Unknown APs – APs designated as not belonging to the network and not belonging to a
nearby network. Unknown APs should be treated as potential rogues.
Interferers – The number of non-Wi-Fi devices transmitting on the channel.
Ad hocs – The number of APs, belonging to a temporary (Ad hoc) network, transmitting
on your network channel (not displayed by default).
Devices include WI-FI devices for WI-FI Product and RFID readers for the RFID
Spectrum Expert product.
10.3 Miscellaneous Channel Summary Issues
10.3.1 802.11 Detection Sensitivity
The threshold for Spectrum Expert to detect 802.11 devices is an RF power of approximately -80dBm. This detection sensitivity is commensurate to that of a reliable 54 Mbps connection, so the
detection range is less than 150ft at 2.4GHz and less than 100ft at 5GHz in an indoor environment.
In a large environment users should take detection measurements at several representative locations
to cover entire area 802.11. Please see the Spectrum Expert release notes for more information.
10.3.2 802.11 Device Types
When Spectrum Expert indicates that an 802.11 a/b/g signal is present on a channel, this may or
may not indicate an AP or network in use. It could also be a zero config client (a station not
currently affiliated with a network) which is transmitting probes, as it seeks out a network.

8/8/2019 Spectrum Expert 3.1 Users Guide
http://slidepdf.com/reader/full/spectrum-expert-31-users-guide 100/139

8/8/2019 Spectrum Expert 3.1 Users Guide
http://slidepdf.com/reader/full/spectrum-expert-31-users-guide 101/139
Page 84 Section 11. Device Finder
Spectrum Expert Users Guide (Version 3.1)
11.2 Working With Device Finder
To use the Device Finder:
1. In Devices View, or on the Active Devices tree, select
the device you wish to locate. Then right-click on thedevice name, and select Find This Device from the
pop-up menu.
2. The device is now listed in the Device Finder.
3. The Signal Strength History
graph shows a moving plot of the
signal strength. (The plot does not
automatically reset if the signal is
lost.) This plot makes it easy to
visualize when you are walking
towards or walking away from the
source of the signal.
The Rx Signal Strength meter also provides a real-time indicator of the signal strength from
the device of interest, and is an additional tool in determining whether you are “getting
warmer” or “getting colder” in terms of tracking down the interfering device.
At moments, you will record a signal of special interest. The signal may suddenly peak or drop
off; or you may be systematically recording the signal at carefully planned locations.
4. To maintain a record of the signal of interest, select the
[Record Signal] button, or press the <Spacebar>.
Spectrum Expert records the current signal strength and the
time in the Measurement Log. For a Description,
Spectrum Expert uses the device name as a default value.
5. Type in a description of where the measurement was
taken. Press the <Enter> key on your keyboard to
confirm your description.
6. You can also edit the location information in the Measurement Log at a later time.
Simply double-click on the description and then key in your new description; then press
<Enter>. (Pressing <Esc> cancels any changes you are making.)

8/8/2019 Spectrum Expert 3.1 Users Guide
http://slidepdf.com/reader/full/spectrum-expert-31-users-guide 102/139
Page 85
Spectrum Expert Users Guide (Version 3.1)
11.3 Additional Device Finder Features
The Device Finder has the following additional features and capabilities:
Stop Finding – You can stop tracking the interferer by selecting
the [Stop Finding] button. It is a good idea to do this after you
have found the interferer of interest, since it reduces the drain onsystem processing resources.
Reset Signal Averaging – If you select the [Reset Signal
Averaging] button, Spectrum Expert no long uses prior signal
values to calculate the average signal strength. Instead,
Spectrum Expert only calculates average signal strength from
"now" forward, where "now" is when you select [Reset Signal
Averaging].
If you are moving around — or changing the orientation of a directional antenna — this command
will cause the signal averaging measurement to restart, so you don’t display data that may be
representative of the prior position/orientation. A great deal of filtering is applied to provide
accurate measurements, and this can help Spectrum Expert to respond more quickly, and not bebiased from prior measurements.
Clear Signal Strength History – Select the [Clear] button
over the Rx Signal Strength History plot to clear the plot.
Clear Measurement Log – You can clear the Measurement
Log of all data by selecting the [Clear Log] button above the
log.
Delete A Single Log Entry – You can also delete an individual row from the
Measurement Log. Simply select the entry, and then press the <Del> key on your
keyboard. Then select [Yes] in the confirmation dialog box.
Reset Maximum Signal Strength – If you select [Reset Max],
Spectrum Expert deletes the current value for the maximum
signal strength; Spectrum Expert then ascertains, starting from
"now", the maximum interferer signal strength measured from
this time forward.
[Reset Max] only clears the Max Strength text box, and the black rectangular box in the vertical signal meter that indicates the highest
strength seen. Use the [Clear] button (above) to clear the plot.

8/8/2019 Spectrum Expert 3.1 Users Guide
http://slidepdf.com/reader/full/spectrum-expert-31-users-guide 103/139
Page 86 Section 11. Device Finder
Spectrum Expert Users Guide (Version 3.1)
11.4 “Divide And Conquer” Search Strategy
To minimize your effort, and maximize your chances of locating the interferer, we recommend thatyou use a “divide and conquer” search strategy (also known as “rectangular bisection”). We
illustrate the strategy, first with the omnidirectional antenna, and then using the directional antenna.
To use this process, you will greatly benefit from using a physical map of your network space.
11.4.1 Omnidirectional Antenna
It is possible to hit a “blind spot” when using Device Finder. This is a location —
typically a corner of a large building — where you may not get any measurements at all. If you find
you are spending more than 30 seconds at any one spot, without getting an updated device reading,
you should move away from that spot and try a different location.
For purposes of simplicity, assume that your interfering device is located somewhere within a largerectangular office space (which might measure, for example, 50’ by 150’).
1. Go to each of the far corners of the office space, and measure the signal strength from theinterfering device of interest. Take note of which corner of the office yields the highest signal
strength. (A printed map of your office space can be helpful for jotting down data.)
Each time you move the Spectrum Expert system to a new location, select the
[Reset Signal Averaging] button on the Device Finder. Then, at each test location, wait
for the confidence level to settle to a small value — ideally less than ±3 dBm, but certainly
less than ±5 dBm — before recording the signal strength.

8/8/2019 Spectrum Expert 3.1 Users Guide
http://slidepdf.com/reader/full/spectrum-expert-31-users-guide 104/139
Page 87
Spectrum Expert Users Guide (Version 3.1)
2. In the corner which has the largest signal strength, map out a rectangular sub-search areacomprising one quarter of the total office space.
3. Repeat this process, as necessary to localize your measurement.
4. By repeating this process, you will be able to home in on the location of the interfering device.
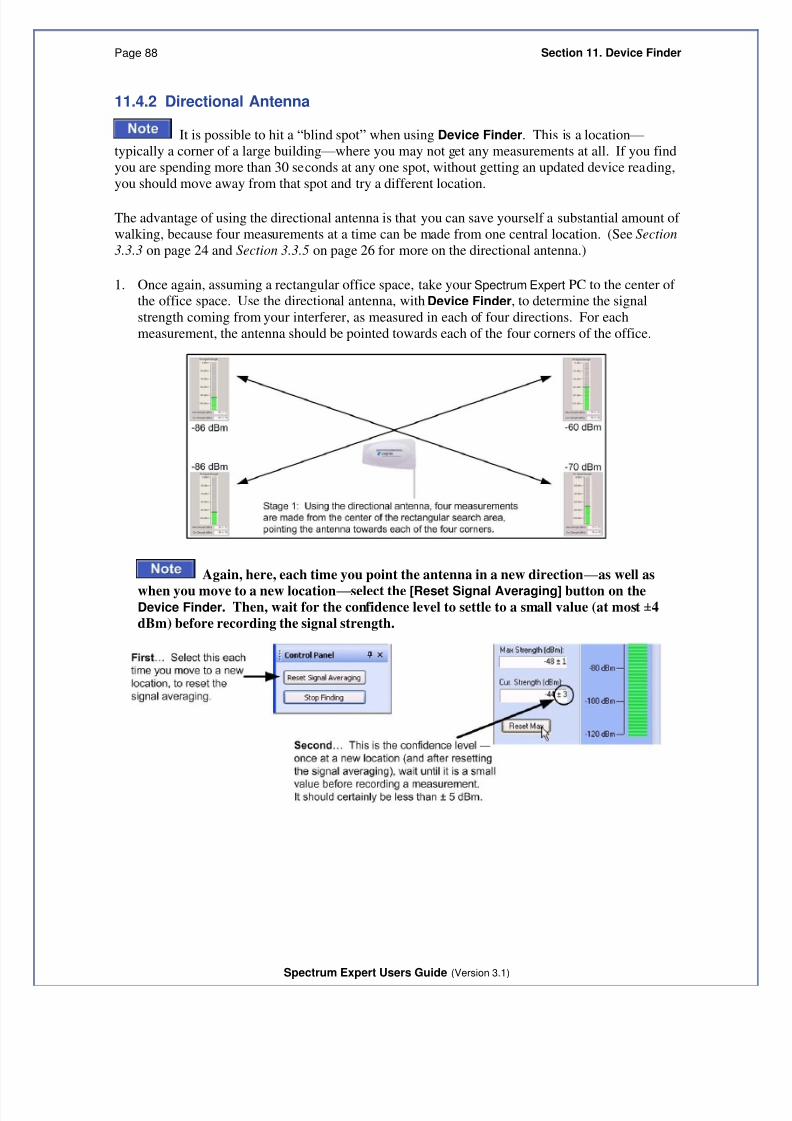
8/8/2019 Spectrum Expert 3.1 Users Guide
http://slidepdf.com/reader/full/spectrum-expert-31-users-guide 105/139
Page 88 Section 11. Device Finder
Spectrum Expert Users Guide (Version 3.1)
11.4.2 Directional Antenna
It is possible to hit a “blind spot” when using Device Finder. This is a location —
typically a corner of a large building — where you may not get any measurements at all. If you find
you are spending more than 30 seconds at any one spot, without getting an updated device reading,
you should move away from that spot and try a different location.
The advantage of using the directional antenna is that you can save yourself a substantial amount of
walking, because four measurements at a time can be made from one central location. (See Section
3.3.3 on page 24 and Section 3.3.5 on page 26 for more on the directional antenna.)
1. Once again, assuming a rectangular office space, take your Spectrum Expert PC to the center of the office space. Use the directional antenna, with Device Finder, to determine the signal
strength coming from your interferer, as measured in each of four directions. For each
measurement, the antenna should be pointed towards each of the four corners of the office.
Again, here, each time you point the antenna in a new direction — as well as
when you move to a new location — select the [Reset Signal Averaging] button on theDevice Finder. Then, wait for the confidence level to settle to a small value (at most±4
dBm) before recording the signal strength.

8/8/2019 Spectrum Expert 3.1 Users Guide
http://slidepdf.com/reader/full/spectrum-expert-31-users-guide 106/139
Page 89
Spectrum Expert Users Guide (Version 3.1)
2. Once again, map out a rectangular sub-search area comprising one quarter of the total officespace for the corner which has the largest signal strength.. Again, you only need to make
measurements from one spot, pointing the antenna towards four different directions.
3. Repeat, again making measurements in the quadrant with the highest power reading.
4. Once again, you will learn from experience whether the final measurements are best made by acontinued process of rectangular bisection, or whether the final measurements should be made
on a systematic grid of a local area.

8/8/2019 Spectrum Expert 3.1 Users Guide
http://slidepdf.com/reader/full/spectrum-expert-31-users-guide 107/139
Page 90 Section 11. Device Finder
Spectrum Expert Users Guide (Version 3.1)
11.4.3 Detecting Narrowband Devices
Interfering devices fall into two RF categories, narrowband and wideband. By the very nature of
wideband transmissions, the signal strength from a wideband device — as measured at any one
location — tends to be consistent. (If the directional antenna is in use, the signal strength from a
wideband device will tend to be consistent, at a given measurement location, and for a given
direction in which you point the antenna.)
By contrast, narrowband devices have certain signal peculiarities. Small changes in the physical
environment — changes which have nothing to do with the device emitting the signal — can cause
large fluctuations in the signal strength. For example, the simple movement of people or furniture
can change the way a narrowband signal is reflected throughout the enterprise space, resulting in
changes in signal strength as measured from some distance away.
Fortunately, most interferers are wideband, which makes life easier for users of Spectrum Expert.
However, there are some interferers, such as some FM phones and TDD phones, which are
narrowband devices. The signal from these devices can vary significantly over the space of just a
few inches. As a result, there are some simple antenna tricks to use when searching for such
devices:
Omnidirectional antenna: If you are using the omnidirectional antenna (including the
built-in antenna on the Spectrum Expert CardBus Sensor), it can be helpful to slowly,
physically sweep the Spectrum Expert PC in an arc along several inches, until you
achieve the maximum signal strength.
Directional antenna: If you are using the
directional antenna (Wi-Fi only), a similar trick
applies. With the PC resting in place (such as on
a cart), and with the antenna pointed in a desired
direction, you can slowly sweep the antenna
along an arc of roughly 30 degrees to 45 degrees,
centered on the primary direction of interest,until you achieve the maximum signal strength.

8/8/2019 Spectrum Expert 3.1 Users Guide
http://slidepdf.com/reader/full/spectrum-expert-31-users-guide 108/139
Page 91
Spectrum Expert Users Guide (Version 3.1)
12 LOCAL SETTINGS
There are a number of settings you can change to determine how Spectrum Expert operates and
presents data. The available settings are for:
Sensors and Antennas – Determine which Sensor the Spectrum Expert Console uses to
obtain data. For the internal CardBus-based Sensor, you can also indicate the type of antenna in use.
Console Settings – Use this to change the date formats seen on screen.
Band and Channel Settings – Determines which 802.11 channels and how wide a
bandwidth will be monitored by Spectrum Expert Sensor.
Alert Settings – Used to enable or disable security and performance alerts for an
interferer type or category.
SNMP Option - Spectrum Expert has an ability to send SNMP traps when it detects
interfering devices. This screen is used to configure the trap filters and threshold levels
that will trigger the sending of an SNMP trap. The Settings – SNMP screen is used toconfigure the trap filters and threshold levels that will trigger the sending of an SNMP
trap.
The following MIB files are installed with Spectrum Expert under [install
dir]\Cognio\Spectrum Expert\MIB and are used by the trap receiver:
File Description
COGNIO-SMI.mib Enterprise OID
COGNIO-TRAPS-MIB.mib Trap definition. Refer to this file for the complete trapOID information.
INET-ADDRESS.mib MIB file that traps are dependent on
SNMP-FRAMEWORK-MIB.mib MIB file that traps are dependent on
SNMPv2-CONF.mib MIB file that traps are dependent on
SNMPv2-SMI.mib MIB file that traps are dependent on
SNMPv2-TC.mib MIB file that traps are dependent on
12.1 Sensors and Antennas
To modify which Spectrum Sensor and/or antennas are used by Spectrum Expert:
1. Select Tools Settings….

8/8/2019 Spectrum Expert 3.1 Users Guide
http://slidepdf.com/reader/full/spectrum-expert-31-users-guide 109/139
Page 92 Section 12. Local Settings
Spectrum Expert Users Guide (Version 3.1)
The Sensor Setup panel should be displayed bydefault. If it is not, select the [Sensors and
Antennas] button on the tool bar at left.
2. Select the Sensor/antenna combination of interest.
Your choices are:
Cardbus Sensor With Internal Antenna – Tells
the Console to use data from the internal CardBus
Sensor. Also tells the Sensor to use its internal
antenna.
Cardbus Sensor With External Antenna – Tells
the Console to use data from the internal CardBus
Sensor. Also tells the Sensor to use its external
antenna.
Figure 12-1: Settings – Sensors and Antennas
RFID Sensor – The RFID CardBus Sensor automatically uses the external
antenna, if that antenna is attached. There is no software “override.” So, you can select
either of the above Sensor/antenna settings, and the RFID Sensor will still automaticallyuse the appropriate antenna (external, if attached, or internal otherwise.)
Spectrum Capture File – Enables you to select a CSC file for playback. Select the
[Browse…] button to browse for a particular CSC file. See Section 4.7, Spectrum Recording
and Playback on page 40 for more information.
3. Optionally, select the Automatically Use These Settings At Startup check box. If you select
this option, the Console will automatically use these settings each time the Console is started.
If left unchecked, the Spectrum Expert Application present a dialog box each time the program
starts, asking you which Sensor to use.
4. Select [OK] to confirm your changes and close the dialog box. You can also select [Apply] to
apply your changes while leaving the dialog box open for further work.
12.2 Console Settings
This enables you to fine-tune how the Spectrum Expert Application displays data.
1. Select Tools Settings…,
2. From the tool bar on the left side of the dialog box, select Console Settings

8/8/2019 Spectrum Expert 3.1 Users Guide
http://slidepdf.com/reader/full/spectrum-expert-31-users-guide 110/139
Page 93
Spectrum Expert Users Guide (Version 3.1)
Figure 12-2: Settings - Console Settings
3. You can change the following settings:
Spectrum View Configuration for Playback – Select whether during playback you will
view the Spectrum View saved in the capture file or using the Spectrum view currently in
use.
Date Formats Used Throughout the Application – Select from the drop-down list box.
This format is used wherever the date appears in the application.
Instant Replay – Enable the Instant Replay feature by checking the box and selecting the
number of minutes you want available for use as an instant replay. The range available is
from 1 to 60 minutes.
Default AP Category – Radio buttons allow setting the default AP category to In-Network or
Unknown.
Plot’s Background Color – Radio buttons allow selecting either Black or White as the
background color for Spectrum Expert Plots.
4. Select [OK] to confirm your changes and close the dialog box. You can also select [Apply] to
apply your changes while leaving the dialog box open for further work.
12.3 Band And Channel Settings
Here you can configure the bands and channels that Spectrum Expert will monitor and report on.
You can select band and channel settings by Regulatory Domain or define the bands and channels
individually by selecting the User Defined option.

8/8/2019 Spectrum Expert 3.1 Users Guide
http://slidepdf.com/reader/full/spectrum-expert-31-users-guide 111/139
Page 94 Section 12. Local Settings
Spectrum Expert Users Guide (Version 3.1)
12.3.1 Regulatory Domain Options
To use a Regulatory Domain option to select the bands and channels:
1. Select Tools Settings…
2. From the tool bar on the left side of the dialog box, select Band and Channel Settings.
Figure 12-3: Settings – Channel Settings (Wi-Fi Shown)
3. From the Regulatory Domain pane drop-down pick list select the regulatory domain tomonitor. You have the following options:
For Wi-Fi, the options include: Americas/Australia, EMEA/Asia/Pacific, Japan, All Wi-
Fi Channels. For Wi-Fi, it is further possible to select the Wi-Fi standard to be covered
(802.11 a, 802.11 b/g, or both) using the checkboxes. The single regulatory domain pick
will apply to both Wi-Fi standards.
For RFID, the options include: US/Canada, Europe, and Japan.
The controls in the Monitored Bands and Channels control pane also display the
bands and channels that will be monitored when a Regulatory Domain is picked.

8/8/2019 Spectrum Expert 3.1 Users Guide
http://slidepdf.com/reader/full/spectrum-expert-31-users-guide 112/139
Page 95
Spectrum Expert Users Guide (Version 3.1)
Figure 12-4: Settings –
Regulatory Domains
4. Select [OK] to confirm your changes and close the dialog box. You can also select [Apply] to
apply your changes while leaving the dialog box open for further work .
Regulatory Domains are subject to change without notice.
12.3.2 User Defined Option
To use the User Defined option to select the bands and channels:
1. Select Tools
Settings…
2. From the tool bar on the left side of the dialog box, select Band and Channel Settings.
3. From the Regulatory Domain pane drop-down pick list select the User Defined option.
4. When you selected User Defined the individual band and channel monitoring check boxes are
enabled and you can select the bands and corresponding channels to monitor.
5. Select one or more of the available bands from Monitored Bands and Channels control pane.
6. Select one or more of the available channels check boxes for each band selected.
7. Select [OK] to confirm your changes and close the dialog box. You can also select [Apply] to
apply your changes while leaving the dialog box open for further work .
12.3.3 Monitoring
The CardBus Sensor is capable of monitoring up to 1 GHz of RF bandwidth at a time. In practice,
however, monitoring this much of the spectrum can result in some performance issues for Spectrum
Expert. Moreover, for most practical applications, it is rarely necessary to monitor that much of the
spectrum at one time.

8/8/2019 Spectrum Expert 3.1 Users Guide
http://slidepdf.com/reader/full/spectrum-expert-31-users-guide 113/139
Page 96 Section 12. Local Settings
Spectrum Expert Users Guide (Version 3.1)
The Band and Channel settings enable you to determine how much bandwidth is actuallymonitored by the CardBus Sensor. Monitoring only the bandwidth you need to monitor — rather
than trying to have the CardBus Sensor scan its full potential range — will result in more effective
system performance.
If you change the settings for monitored bands and channels, the Spectrum Expert
Application automatically restarts, clearing all internal buffers. The display does notclose down, but you lose any data currently shown on the spectrum plots, Channel
Summary, Devices View, etc.
The bands and channels you define here determine which bands and channels are
available for selection on the spectrum plots. See Section 7.3.1, Frequency and
Bandwidth To Monitor , on page 61, for more information.
If you select two bands which are adjacent or which overlap (for example, 5.47 to 5.725
GHz, and 5.725 to 5.850 GHz), Spectrum Expert will automatically consolidate the two
bands into one band.
You can select one or more of the bands, such as the 2.4 to 2.5 GHz band, the 5.15 to 5.35 GHz
band (for Wi-Fi), 865 to 870 MHz (for RFID), etc. Selecting all or most of the bands shown may
result in reduced performance or data quality, so we suggest that you select only those bands thatare essential for your current monitoring and testing needs.
12.4 Alert Settings
The Settings - Alert screen is used to configure security and performance alerts. This screen
consists of three tabs:
Active Devices – This tab is used to enable or disable a security alert for an interferer type or
category. Security alerts can be enabled/disabled for one, multiple or all interferer categories.
Spectrum – This tab is use to enable or disable alerts
Channel Summary – This tab is used to enable or disable alerts for channels devices being
displayed on the Channel Summary view.
To enable performance alerts:
1. Select Tools Settings…
2. From the tool bar on the left side of the dialog box, select Alert Settings.

8/8/2019 Spectrum Expert 3.1 Users Guide
http://slidepdf.com/reader/full/spectrum-expert-31-users-guide 114/139
Page 97
Spectrum Expert Users Guide (Version 3.1)
Figure 12-5: Settings – Alert
To enable alerts for active devices:
1. Select the Active Devices tab.
2. Check Enable Performance Alerts.
3. Check Alert only if In-Network Wi-Fi AP exists.
4. Check Enable Security Alerts.
Figure 12-6: Settings – Active Devices Alerts

8/8/2019 Spectrum Expert 3.1 Users Guide
http://slidepdf.com/reader/full/spectrum-expert-31-users-guide 115/139
Page 98 Section 12. Local Settings
Spectrum Expert Users Guide (Version 3.1)
5. In the Category pane, check one or multiple device categories for performance monitoring andalerts.
The default settings are Jammers and Wi-Fi Ad Hocs boxes checked.
6. Select [Apply] or [OK].
When the Enable Performance Alerts and the Alert only if In-Network Wi-Fi AP exists fields are
checked (selected) on the Active Devices tab, and at least one In-Network Wi-Fi AP is present on
the same channel as the interferer, all active interferers display with or with out a security alert icon
in the Active Device pane on the Main window.
If the interferer duty cycle is greater than 50% (default critical threshold value), the
device displays in Red.
If the total duty cycle is greater than 25% (default warning threshold value), but less than 50, the
device displays in Yellow.
To enable Security Alerts for Spectrum:
1. Select the Spectrum tab.
Figure 12-7: Settings – Spectrum Alerts
2. Check the Enable Spectrum Alerts check box. The default settings are shown in the figure.
3. Select [Apply] or [OK].
To enable alerts for Channel Summary:
1. Select the Channel Summary tab.

8/8/2019 Spectrum Expert 3.1 Users Guide
http://slidepdf.com/reader/full/spectrum-expert-31-users-guide 116/139
Page 99
Spectrum Expert Users Guide (Version 3.1)
Figure 12-8: Settings – Channel Summary Alerts
2. Check the Enable Channel Summary Alerts check box. The default settings are shown in
the figure.
3. Check the Alert only if In-Network Wi-Fi AP exists check box if you want this condition
to be met before having Spectrum generate a Channel Summary alert.
4. Select [Apply] or [OK].
12.5 SNMP Option Settings
The Settings - SNMP screen is used to enable and configure the trap filters and threshold levels
that will trigger the sending of an SNMP trap for detected interferers to the designated IP Address.The screen consists of the following four areas:
IP Address
Trap Filters
Modifying Trap Filters Default Settings
Trap Filter Information Content
12.5.1 IP Address
The IP Address area provides a checkbox and IP Address fields to enable and control target
system for SNMP traps.
8/8/2019 Spectrum Expert 3.1 Users Guide
http://slidepdf.com/reader/full/spectrum-expert-31-users-guide 117/139
Page 100 Section 12. Local Settings
Spectrum Expert Users Guide (Version 3.1)
12.5.2 Trap Filters
The Trap Filters area provides three selectable channel affecting acceptance criteria an interferer
must meet to trigger sending a trap. The three selectable criteria are:
1. Active Channel Filter - is there an active In-Network Wi-Fi AP on one of the affected
channels? The default state is ENABLED.2. Interference Channel Utilization Filter - does an affected channel have an interferer utilizing
more than the user set channel utilization percentage? The default state is ENABLED and
default threshold value is 10%.
3. Interference Power Filter - does an affected channel have cumulative power of all interference
devices at a power level within or exceeding a user set level in dBm? The default state isENABLED. The default value for the within range is 16 dB and the exceeding default value
is -70 dBm.
12.5.3 Modifying Trap Filters Default Settings
All threshold values are editable, meaning they can be changed to reflect differing criteria. Modifythe SNMP Traps and trap filters settings as follows:
1. Left-click in the box adjacent to the trap criteria to apply.
2. Edit the existing value or enter a new value.
3. Left-click the box adjacent to the next trap criteria to apply.
4. Select <Apply>.
5. Select <OK>.
12.5.4 Trap Filter Information Content
The trap will include the following information:
Device Uptime
MAC Address and Power level of top five APs
Unique Instance ID of device
Type of Device (Numeric code)
Filter Parameters (when filter is enabled)
Channel Number, Interference Utilization
AP MAC Address, AP Power, Interference Power
Device Parameters (when appropriate – not all devices will have all parameters):
o Center Frequency
o Bandwidth
o Power in dBmo Duty Cycle
o Channels affected
o Network address
o Pulses per second
o Pulse duration
o Modulation Type: Tone, video, AM, FM, QAM, OFDM, Chirp (Numeric code)
o PLL offset

8/8/2019 Spectrum Expert 3.1 Users Guide
http://slidepdf.com/reader/full/spectrum-expert-31-users-guide 118/139
Page 101
Spectrum Expert Users Guide (Version 3.1)
o Frequency Deviation
o Symbol rate
o Bits per symbol
o Guard interval
o Peak to average power
o Period
o Phaseo Transmit type
12.5.5 Set SNMP Traps
To enable SNMP traps:
1. Select Tools Settings…
2. From the tool bar on the left side of the dialog box, select SNMP Option.
Figure 12-9: Settings – SNMP Option
3. Select the Send SNMP Traps for Detected Interferers to IP Address:checkbox to enable
sending SNMP traps to the IP address entered into the address field.
4. In the Trap Filters section select the trap filter parameters that will define a detected interferer.
5. Select [Apply] or [OK].
8/8/2019 Spectrum Expert 3.1 Users Guide
http://slidepdf.com/reader/full/spectrum-expert-31-users-guide 119/139
Page 102 Section 13. Capture Current Display
Spectrum Expert Users Guide (Version 3.1)
13 CAPTURE CURRENT DISPLAY
The Capture Current Display command creates and saves an image of the information displayed
in the main window of the console. Information reported by the console can be recorded, for
example, at various locations (as when performing a site survey) or at different times. The images
produced by this feature can be easily emailed, and can be viewed at any time using any favoriteimage display software for Bitmaps or JPEG images.
To capture the current Console display:
1. Select Tools Capture Current Display…, or select <Ctrl+S> on the keyboard.
The application will create a snapshot of the information visible within the main application
window at the moment the command is issued.
Once the snapshot has been created, a Save As… dialog box is displayed.
2. Select the file location, and enter a File Name (or use the default file name already shown).
3. Select the file format from the Save As Type list box.
Image file formats that are available include Bitmap (for larger file size with maximum clarity),
and JPEG (for smaller file size; useful for email and space savings).
4. Select [Save].
Example: If the Channel Summary tab is currently selected, the image will contain the current
channel information that is displayed on-screen. If the current active view is one of the Spectrum
tabs, the image will capture the plot data that is visible on-screen. The Active Devices list is also
preserved in the image, assuming it is currently on display.
13.1 Tips On Image Capture
If a view has scroll bars, be sure to scroll so that the information you want to capture is
displayed on screen.
For best results make sure the application window is fully on-screen. (If the application
is partially off-screen, the image captured will contain only the area of the main
application window that was visible on-screen.)
13.2 Tips On Image File Naming
It may be helpful to include the location and date as part of the image file name for future
reference, or to organize images into a clearly labeled folder with this information.
This feature automatically suggests a file name including a date/time stamp. If you
customize the text appearing before the date/time stamp, the console will preserve this
customization and automatically apply it to snapshots created later during the same
console session.

8/8/2019 Spectrum Expert 3.1 Users Guide
http://slidepdf.com/reader/full/spectrum-expert-31-users-guide 120/139
Page 103
Spectrum Expert Users Guide (Version 3.1)
14 SPECTRUM EXPERT AND YOUR NETWORK OPERATIONS
The preceding sections of this manual have been devoted to an overview of Spectrum Expert, and
then a detailed discussion of how to use specific features and operational modes. This section
explains how to put Spectrum Expert to work in the real world of network planning, maintenance,
and trouble shooting.
A key, general principle to keep in mind is that the RF environment, by its very nature, is highly
dynamic and unpredictable. The environment varies over time as both RF sources and RFreflectors move about or change in their activity. (And keep in mind that an “RF reflector” can be
virtually anything at all, obviously including metallic objects, but also other types of objects, and
even people.) Further, some RF sources, such as directional antennas, have a strong RF impact in
limited spaces or directions. We will see in the discussion below how the variability of the RF
environment must be taken into account when putting Spectrum Expert to work.
14.1 Site Survey
A site survey is a series of RF measurements conducted not only prior to network deployment, but
possibly even prior to deciding what type of network equipment to purchase. The site survey is
intended to provide a general picture of the RF environment, and particularly those aspects of the
RF environment which may influence purchase decisions. The information gained in a site survey
will also contribute to network planning (covered in the next subsection).
The primary goal of the site survey is to determine which channels/bands are acceptable for
network deployment. The survey can also suggest the number of network devices (APs, RFID
Readers, etc.) that may need to be purchased and deployed. This is particularly crucial for those
networks, such as Wi-Fi networks, where you have a choice of the type of network equipment to
purchase (802.11a, b, or g).
14.1.1 The Physical Movement Of The PC
The site survey entails physically moving your Spectrum Expert PC throughout the network space,monitoring changes in the readings as you go. You can carry the PC, but typically you place the
laptop computer on a cart and wheel the cart about. In offices you will want to at least walk around
the perimeter of each office, and perhaps up and down and side-to-side through the center of each
office. In a hallway or corridor, it may be sufficient to roll the PC down the center of the hallway.
In a large, open space you may want to walk up and down in lanes, much as if you were “mowing” the carpeting or floor tiles with the PC.
We can’t tell you the exact physical “granularity” of the survey – that is, we can’t say if you should
walk up and down your office in lanes spaced five feet apart or fifteen feet apart. Partly it dependson the size of the site you are covering – you are likely to have the time to follow a finer, more
closely spaced path in a 5,000 square foot office than in a 100,000 square foot warehouse. We can
say that the more fine-grained your site survey, the more accurate the information you will obtain.
Certainly, just taking measurements in four corners of a large space, and at the center of that same
space, is generally not sufficient.
Note that site surveys can be done not only for indoor areas, but also for outdoor deployments of
network equipment. For example, it is now common to set up network backhaul links on the
8/8/2019 Spectrum Expert 3.1 Users Guide
http://slidepdf.com/reader/full/spectrum-expert-31-users-guide 121/139
Page 104 Section 14. Spectrum Expert and Your Network Operations
Spectrum Expert Users Guide (Version 3.1)
rooftops of buildings. A site survey done on the rooftop can detect all kinds of interference activityfrom neighboring transmitters. Again, the more rooftop space that is covered in the survey, the
clearer and more accurate will be the picture of RF activity.
14.1.2 Spectrum Expert Survey Data
Typically, during the survey you will want to look at the Spectrum Expert Channel Summary, the
Devices View, and two or three of the spectrum plots: the Real Time FFT plot, the FFT Duty
Cycle plot, and very likely the Swept Spectrogram plot.
The Channel Summary tells you which channels are showing the most RF activity, and gives
a rough indication of how much of that activity is due to interferers, and how much is due to
other network devices.
If the activity is due to interferers — and if those devices are in your space and under your
control — you may be able to either remove or shield some of the interfering devices.
We are assuming that you have not deployed your own network yet. So, if you are picking
up activity from other network devices, these are likely to be devices in neighboringnetworks. If you do not own these networks (for example, they belong to a company in an
adjoining office), you may not be able to do anything to prevent this interference. In this
case, you may need to plan your own network to use other channels or bands which are notin use by that network.
The Devices View shows you specifically which devices are causing RF activity.
The information includes the channels on which these devices are operating. Based on this
specific information, you can start to determine whether you can mitigate or remove these
devices; or whether, instead, you’ll need to plan your network operations to work around this
device activity. (For example, if the devices cannot be removed or shielded — or just plain
turned off — you may need to operate your network on channels not affected by those
devices.) The plots — Real Time FFT, FFT Duty Cycle, and Swept Spectrogram — can be used to
obtain a more fine-grained view of spectrum activity. Note that the Swept Spectrogram can
be used to view either RF power or RF duty cycle. The combined time and frequency viewoffered by the Swept Spectrogram is also especially useful for viewing variation or stability
in spectrum activity over the time interval of a few minutes.
These plots can be particularly useful for evaluating channels that are borderline in the
Channel Summary, or in terms of the number of devices seen on a channel in the Devices
View.
Both the Channel Summary and Devices View present a summary of RF activity seen
over some extended period of time. It may be, however, that on some particular
channel(s), the RF activity is in fact bursty in nature, i.e., it is characterized by sporadicpulses of RF activity. Because network activity itself is also bursty, such a channel may in
fact acceptable for network purposes – RF activity from non-network devices will only
occasionally occur at the same time as network RF activity.
In other words, looking at the spectrum plots can help you determine if the interference is
constant or intermittent; and hence if the interference on a give channel is, in fact, tolerable
from a network standpoint.

8/8/2019 Spectrum Expert 3.1 Users Guide
http://slidepdf.com/reader/full/spectrum-expert-31-users-guide 122/139
Page 105
Spectrum Expert Users Guide (Version 3.1)
The spectrum plots are also useful for detecting interference which is created by devices that arecompletely unclassified by Spectrum Expert. While these devices will not show up in the Devices
View, and will not impact the measurements in the Channel Summary, you will see their RF
activity on the spectrum plots.
There are at least two conclusions you can generally draw from the data obtained in the above
manner:
You can determine which are your cleanest RF channels. This may determine which types of
network equipment you buy, or at least which bands or channels you set your network
equipment to use. For example, for Wi-Fi, if you find that the entire 5 GHz band is being
swamped by nearby RF activity, you can plan your network purchases and configuration to
operate in the 2.4 GHz band.
You may find that even your best channels or bands are only relatively clean; there may still
be substantial, unpreventable RF activity. This will generally indicate that you will need topurchase more network devices to obtain adequate network performance and coverage.
Of course, “more network devices” is a relative term. More than what? You would need to make
some kind of baseline decision for your particular network technology —
for example, how manyAPs would it take to provide adequate coverage for your Wi-Fi network, in a clean RF
environment? — based on the particular specifications of the network equipment. Then, if the
available channels are fairly congested with RF activity, you may need to scale that number by,
say, 50% or 100%, to ensure reliable and speedy network performance.
Rather than purchasing more network devices, another option — if significant RF interference will
be an ongoing issue — is to instead purchase more powerful network backbone devices, which can
overcome the local interference with a stronger signal.
Note, however, that boosting, say, the power of your Wi-Fi APs, does not boost the power of the
Wi-Fi stations which may be in use. (Your network environment may be a public one, where you
do not control the design or broadcast power of all the stations that may be in use.) In this case, a
higher density of backbone devices (e.g., APs for Wi-Fi) may be the only effective solution.
14.1.3 Additional Notes On Site Survey and the Spectrum Plots
14.1.3.1 Monitoring Multiple Bands on Spectrum Plots
A spectrum plot can only monitor one band at a time (such as 2.4 GHz or 5.15 to 5.35 GHz for Wi-
Fi, or 800 MHz for RFID). However, on a single spectrum tab, you can open more than one
instance of the same type of plot (such as the Real Time FFT). By setting each instance to monitor
a different band, you can monitor at the same time all, or almost all, of the bands of interest.
14.1.3.2 Real Time Plots vs. Software-Based Plots
The reader may note that we have not recommended the Power vs. Frequency or Power vs. Time
plots for site survey purposes. These two plots require extensive software analysis on your
Spectrum Expert PC, and are intended mainly for analyzing specific RF issues (typically, RF
problems related to some unknown device).
8/8/2019 Spectrum Expert 3.1 Users Guide
http://slidepdf.com/reader/full/spectrum-expert-31-users-guide 123/139
Page 106 Section 14. Spectrum Expert and Your Network Operations
Spectrum Expert Users Guide (Version 3.1)
The plots indicated above — Real Time FFT, FFT Duty Cycle, and Swept Spectrogram — offerdata directly from the CardBus Sensor hardware, and are designed to give a better, more accurate
picture of overall RF activity in a particular band. It’s that band-inclusive view which is most
applicable for site survey purposes.
14.1.4 Conducting The Site Survey
We indicated, above, both that Spectrum Expert needs to be wheeled about the anticipated network
environment, and that you will benefit from using multiple Spectrum Expert modes — Devices
View, Channel Summary, and several spectrum plots — to conduct an effective site survey.
So you need to wheel the PC about, while switching between viewing modes, in order to get the
job done.
On top of this, a physical map of your site, where you can record notes of key readings, may prove
helpful as well. For Spectrum Expert users who lack a third hand, all this may pose a challenge.
In fact, though, there is a way to get the job done with just the standard-issue two hands. There is
no one mandatory method of doing the site survey, but what follows is one possible approach.
1. Pick a location, typically one corner of the anticipated network space, in which to start thesurvey. Look at both the Devices View and the Channel Summary, to see which channels are
causing the most activity, and what devices are responsible for that activity. Make note of this
information on your map of the network space.
2. Switch to the spectrum view mode, and set up the plots you wish to view. Since there are two
spectrum tabs, you may want to use each tab for a different kind of plot. For example, on one
tab you may set up multiple instances of the Real Time FFT, with each instance set for a
different band. On the other tab, you might establish multiple instances of the Swept
Spectrogram (again, picking a different band for each instance), with the Trace Type set to
Duty Cycle.
3. Wheel the Spectrum Expert PC through the anticipated network environment. As you move,keep your eye on the spectrum plots — Real Time FFT or Duty Cycle, as you prefer — perhaps
pausing occasionally to switch from one spectrum tab to the other.
4. You of course will view all the bands you’ve set to display on the plots. However, mentally,
you probably want to keep an eye on those bands which encompassed both the most active and
least active channels seen on the Devices View and the Channel Summary. The goal is to see
if this activity remains fairly consistent throughout the network space, or varies significantly.
5. Any time you see a significant change in the spectrum plots — either a spike in RF activity at
some frequency, or a notable drop-off — you can switch back to Channel Summary or
Devices View. The Channel Summary will likely confirm what you’ve seen on the plots,
namely, that there is a notable increase or decrease in RF activity on particular channels. The
Devices View, of course, will help you identify the particular cause(s) of that activity.
6. Next, switch back to the spectrum plots, and continue your walk through the network space.
7. Again, at appropriate points, you will want to stop and make notes on your map of the network
space.
There are several possible variations on this procedure.

8/8/2019 Spectrum Expert 3.1 Users Guide
http://slidepdf.com/reader/full/spectrum-expert-31-users-guide 124/139
Page 107
Spectrum Expert Users Guide (Version 3.1)
In terms of how you set up your display during the survey, another option is to put two
Real Time FFT plots and two Duty Cycle plots on the same tab, covering two bands.Then put two more Real Time FFT plots, and two more Duty Cycle plots, on the other
tab, measuring two other bands. (And — not to confuse the reader — but you always have
the option of using the Swept Spectrogram, and setting it to display either duty cycle or
RF power.)
You could make an entire sweep through the network environment looking only at the
Channel Summary; then another sweep, along the same path, with the spectrum plots on
display. After determining those locations with the most RF activity, you may return to
those specific locations and use the Devices View to ascertain the particular RF sources
involved.
If you note a particularly high level of RF activity at some point, but the source is not
obvious, the Device Finder may help you track down the source. See Section 11 on
page 83.
14.1.4.1 Save the RF Map
We recommend that you save the RF map you create in the course of the site survey. It will come
in handy later, both for initial network device deployment, and for charting any changes in your RF
environment over time.
14.1.5 Drawing Conclusions
At the conclusion of this process — and with your marked up network map in hand — you should
have a very clear picture of which frequencies are relatively clear, and which frequencies are
relatively crowded with RF activity, throughout your network space. Ideally, it will be
immediately clear which channels or bands you wish to use for your network deployment.
Conceivably, you may find that certain bands would be best to use at some locations in yournetwork environment, while other bands would be better to use elsewhere. In the worst case, these
bands may be hardware incompatible (e.g., you’d want to use 802.11b/g in part of your network,
and 802.11a in another part). In this case, part of your network planning may entail removing or
shielding some current sources of RF activity, to free up a particular band in a particular location.
As indicated above, the general level of network activity will also help you determine the number
of network backbone devices (APs, RFID Readers, etc.) that you need.
14.1.6 Antenna Options
The Wi-Fi version of Spectrum Expert has an optional directional antenna. Normally though,
during the initial phase of a site survey, you will want to use the standard omnidirectional antenna,
so that at each location you can pick up RF activity from all possible sources in the vicinity.
In some cases, you may find RF activity that is highly localized, without the source being apparent.
(This can happen, for example, if there is a directional broadcast antenna at some distance. You
will only pick up a signal when you happen to cross the path of the antenna beam.) At these
locations, the directional antenna can be used to help determine the exact direction of the source of
RF activity. See Section 3.3.5, Using the Directional Antenna on page 26 for more information.

8/8/2019 Spectrum Expert 3.1 Users Guide
http://slidepdf.com/reader/full/spectrum-expert-31-users-guide 125/139
Page 108 Section 14. Spectrum Expert and Your Network Operations
Spectrum Expert Users Guide (Version 3.1)
14.2 Network Layout
Once you have purchased your network backbone equipment — such as APs for Wi-Fi, or RFIDReaders — Spectrum Expert can support a dynamic, real-time network layout process that results in
near-optimum placement of APs, RFID Readers, etc. Here again you will rely upon the
Devices View, the Channel Summary, and the spectrum plots (Real Time FFT, Duty Cycle,and/or Swept Spectrogram).
By way of example, we will assume you are laying out devices for a Wi-Fi network, but similar
principles would apply to RFID and other types of networks as well.
14.2.1 Placing the First AP
1. To start the process of deploying devices, select a location for placement of your initial AP.
Of course, you’ll need to select a location that is sufficiently close to an Ethernet connection
for your wired LAN.
In addition, you’ll want to select a location which you had determined, in the course of yoursite survey, to have low RF interference. (Again, we recommend that you save the RF map
that you created during your RF site survey.)
2. At the selected location, you’ll use to Spectrum Expert to double check that RF activity remains
at acceptably low levels in the channel you intend to use. (Depending on your overall
environment, the RF activity may or may not vary substantially over a relatively short timeframe. For example, a neighboring office may have rearranged or reconfigured their WLAN in
ways that will affect your network deployment.)
As with the site survey, you can use the Channel Summary and spectrum plots to check the
overall level of RF activity at the selected location. The Devices View can tell you about any
specific devices that are now causing interference, and which can possibly be removed or
shielded. If there is new, and uncontrollable, RF interference which had not been detected
during the site survey, you may need to select another location for initial AP deployment.
3. You have selected a location for the initial AP, set it in place, and probably wired it into the
WLAN. Before powering up the AP, you should set one of the Real Time FFT plots tomonitor the channel which will be used by the AP. When you turn on the AP, you should see
an immediate and dramatic gain in RF power in that channel. This tells you that the AP is
broadcasting RF on the appropriate channel.
4. You will now turn to the Devices View. Spectrum Expert should quickly detect and classify
the AP, so that it is shown in Devices View. Of the most interest is the Signal Strength field.
Normally, the signal strength near to the AP should be well above -70 dBm.
The expected, near-to-the-device signal strength will vary depending on the type of
network you are deploying. Similarly, the too-low-for-reliable-operations power level
(discussed below) will also vary depending on the network technology you are implementing.
The values described here, in the range of -70 to -80 dBm, are appropriate for Wi-Fi network
APs.

8/8/2019 Spectrum Expert 3.1 Users Guide
http://slidepdf.com/reader/full/spectrum-expert-31-users-guide 126/139
Page 109
Spectrum Expert Users Guide (Version 3.1)
14.2.2 Placing the Second AP
1. With Spectrum Expert once again in hard or on a rolling cart, you now want to move in some
direction away from the AP you have just placed. The direction you choose will depend on
your general plan of network deployment, as well as on the RF map created during the site
survey.
For simplicity of description here, we’ll assume you are laying out your network in some
relatively, wide open space, such as a warehouse or airport terminal. Naturally, if you are in a
more constrained space, such as an office, your movements will probably entail leaving one
room and entering the adjacent room, or possibly walking down a hallway outside the room.
2. In general, your goal for placing the next AP is to aim for location which is again structurallyconvenient — for example, you may want to remain close to a wall, so the AP is relatively out
of the way of other activity and movement — and of course, is close to another Ethernet
connection.
3. As you move Spectrum Expert in the general desired direction, keep an eye on the device
Signal Strength on the Devices View. When the Signal Strength falls to around -70 to -80
dBm it is an indication that the first AP can no longer reliable communicate with network devices at your current location.
Choosing the higher threshold value, -70 dBm, will provide greater network reliability, at the
price of placing APs closer together. That will mean purchasing more APs. The lowerthreshold, -80 dBm, may result in somewhat less network reliability and/or data rates, but also
involves deploying fewer APs.
4. At this point, where the AP signal strength has dropped to -70 dBm or -80 dBm, you will
probably want to deploy the next AP. You should set the new AP to a channel substantially
apart from the channel used for the first AP. (For example, you might vary your APs between
channels 2, 5, and 8, or 1, 6, and 11.)
However, before “committing” your AP to this new location, you should use Spectrum
Expert to double-check a few things:
Using the Channel Summary, make sure that the channel you have in mind is reasonably
free of local interference.
Check the spectrum plots to ensure that the location is fairly free from excessive RF
activity of all kinds.
As usual, if you encounter undesirable RF activity at the location of interest, you will either
need to take steps to mitigate the interference; you will need to deploy a more powerfulAP; or you will need to choose another location.
5. Set the second AP in place at the new location, and wire it into the WLAN. Set one of the Real
Time FFT plots to monitor the channel which will be used by the AP. When you turn on the
AP, you should see an immediate and dramatic gain in RF power in that channel. This tells
you that the AP is broadcasting RF on the appropriate channel.
6. Again turn to the Devices View. Spectrum Expert should quickly detect and classify the AP, so
that it is shown in Devices View.

8/8/2019 Spectrum Expert 3.1 Users Guide
http://slidepdf.com/reader/full/spectrum-expert-31-users-guide 127/139
Page 110 Section 14. Spectrum Expert and Your Network Operations
Spectrum Expert Users Guide (Version 3.1)
14.2.3 Placing Successive APs
From here, you will continue the deployment process in a similar manner, repeating steps 1 through
6 above. You may very likely need to go back to the first AP, and head off in a new direction — at
right angles to your first path, or directly opposite — to place the third AP. Depending where each
AP is placed in your overall network environment, you may need to place anywhere from one to
four APs that are adjacent to it at some distance. In each case, however, as you travel away from an AP, an indication that the AP no
longer provides adequate signal coverage is when the AP’s signal falls to around -70 to -
80 dBm.
Also, be sure that adjacent APs are not broadcasting on the same channel.
14.2.4 After-Deployment Site Survey
After deploying all your APs, you will want to conduct another site survey. This time, you do not
need to cover all the ground, as with the initial survey. However, you want to focus on areas
which, just by “eyeballing” your AP layout, you can see are relatively far from any one AP.
In those areas, you will want to move Spectrum Expert around a bit, and use Spectrum Expert’s
Devices View to ensure that at least one AP is clearly detectable, preferably, giving a Signal
Strength greater than -70 dBm. This ensures that any device in the area will be able tocommunicate with at least one AP.
In addition, you may want to activate some of the known interferer devices that operate within or
near the perimeter of your network — cordless phones, microwave ovens, etc. You can use both the
spectrum plots and the Channel Summary to see if any of these devices are swamping the RF
environment with so much energy that they are likely to impede RF communications. If that is the
case, you can deploy additional APs, or more powerful APs, to compensate for the interference.
14.3 Long-Term Trend Analysis
Your network ’s RF environment can change over time, requiring adaptive changes in your network
deployment. Quite typically, these changes will be for the worse — more RF activity, and more
interference — as your organization grows, and the number of wireless devices (both network
related, and interferers), increases as well. You may need to deploy more network backbone
devices (APs, Wi-Fi Readers, etc.), or more powerful devices, to compensate for the change.
Ideally, you would like to know about emerging RF trends before they impact your network.
Spectrum Expert can be used for systematic monitoring and recording of the RF environment,
enabling you to observe emerging trends. The key tools here are: the Devices View, the Channel
Summary, the spectrum charts, the screen capture feature, and the record/playback feature.
14.3.1 Trend Analysis Procedure
The general strategy is to pick a number of key locations in your network environment, and recordspectrum data at those locations at regular intervals. How frequent those intervals should be
depends on your own assessment of the pace of change in your network environment. At a small
but rapidly growing startup company, you may want to make measurements as often as every two

8/8/2019 Spectrum Expert 3.1 Users Guide
http://slidepdf.com/reader/full/spectrum-expert-31-users-guide 128/139

8/8/2019 Spectrum Expert 3.1 Users Guide
http://slidepdf.com/reader/full/spectrum-expert-31-users-guide 129/139
Page 112 Section 14. Spectrum Expert and Your Network Operations
Spectrum Expert Users Guide (Version 3.1)
As discussed above, the goal is to take screen captures of these charts at regular intervals in time(for example, every two weeks), noting both the location and date. After some extended time has
passed (typically several months), placing the charts from different dates side-by-side, in ascending
date order, will clearly indicate significant increases in the number of devices in use, or the RF duty
cycle, or both.
Channel-Oriented Charts – The Devices vs. Channel and Channel Utilization chartsprovide more specific information about RF usage. While they only cover a fixed, short
interval of time — they update approximately every twenty seconds — they provide a
clearer indication of specifically which channels are being impacted by RF activity. As
with the Channel Summary display, discussed above, we recommend that on your
“trend analysis days”, you take snapshots of the channel-oriented charts at several times
over the course of the day. This will help provide a combined time and channel-oriented
view of RF activity.
14.4 Routine Network Monitoring and Trouble-Shooting
Once you network is up and running, Spectrum Expert enables you to monitor the RF environmenton a daily basis, often detecting potential problems before they become apparent to users.
In addition, when users to flag problems, such as network slowdowns or lost connectivity,
Spectrum Expert enables you to quickly pinpoint the source of the problem.
14.4.1 Routine Monitoring
For routine monitoring, we suggest that you set one of the two spectrum tabs to display the
following plots and charts: Real Time FFT, FFT Duty Cycle, Swept Spectrogram, and all of the
spectrum charts (Active Devices, Channel Utilization, Channel Utilization vs. Time, Devices
vs. Channel/Time).

8/8/2019 Spectrum Expert 3.1 Users Guide
http://slidepdf.com/reader/full/spectrum-expert-31-users-guide 130/139
Page 113
Spectrum Expert Users Guide (Version 3.1)
Figure 14-1: Spectrum Expert Set For Routine Network Monitoring
Notice that more than one Devices vs. Time plot is in use (lower right of the picture). This is
because each such plot can track a maximum of four device types. To track more than four
devices, you need to put at least two such plots into use. Similarly, you have the option of using
more than one Real Time FFT plot, or FFT Duty Cycle plot, in order to monitor additional bands.
14.4.2 Monitoring Points and Monitoring Rotation
The general procedure for routine monitoring is to pick selected monitoring points throughout your
network environment.
Throughout the day, you move Spectrum Expert from one monitoring location to another,
holding your position at each location for some extended length of time (say, one hour,
or two hours).
In a large network environment — and depending on how many Spectrum Expert
computers you have, and the size of your network support staff — you may not be able tocover all of your monitoring points in a single day. Instead, you may have a rotation
among monitoring points that takes, say, a full week to complete, and then starts again,
covering the same points, the following week.
Vary The Sampling Times – If possible, each set monitoring point on your route should
NOT be always sampled at the same time of day. As a very simple example, and
supposing you had just five designated monitoring points (call them A, B, C, D, and E),

8/8/2019 Spectrum Expert 3.1 Users Guide
http://slidepdf.com/reader/full/spectrum-expert-31-users-guide 131/139
Page 114 Section 14. Spectrum Expert and Your Network Operations
Spectrum Expert Users Guide (Version 3.1)
and exactly one Spectrum Expert computer, you might employ a rotation similar to thefollowing:
Time Slot Monday Tuesday Wednesday Thursday Friday
8 a.m. to 10 a.m. A B C D E
10 a.m. to Noon B C D E ANoon to 2 p.m. C D E A B
2 p.m. to 4 p.m. D E A B C
4 p.m. to 6 p.m. E A B C D
The point is to make sure that each location is monitored at different times of day, because it ispossible that certain locations have low network utilization at one time of day, and higher
utilization at another time of day.
Selection of Monitoring Points – As for the selection of monitoring points, you will
typically seek a mix of locations, some of which are relatively near to your network
backbone devices (such as APs); while others are relatively from the network backbonedevices.
The goal is both to make sure that monitoring points far removed from the network backbone
have a healthy RF environment, so they can pick up signals from the backbone; and also to
ensure that the backbone devices themselves will be able to clearly receive signals from
network members.
Variation Analysis – In Section 14.3, Long-Term Trend Analysis on page 110 above, we
discussed capturing screen shots, or recording spectrum activity, as a tool for long-term
trend analysis. Conceivable, you could use this daily monitoring as the core of that long-
term trend analysis. However, in fact, recording and storing data from multiple locations
every single day is likely to result in an overwhelming amount of data; that’s why we
recommend measurements intended for long-term trend analysis be taken at longerintervals.
However, what you can do is make spectrum recordings or spectrum screen shots on a daily
basis during the week; and then compare the recordings/screen taken at the same location, but
on different days of the week, and at different times. This comparison will quickly reveal any
unexpected, dramatic changes in the RF and network environment:
You can quickly determine if a particular location has dramatically increased activity at different
times of day.
If you measure the same location, at the same time, at the beginning of a week, and again at the end
of the week, you can immediately detect any abrupt change in RF activity. This can occur, for
example, if a new RF device (say, a new microwave oven) was installed during the course of theweek, and is now introducing unacceptable levels of RF.
8/8/2019 Spectrum Expert 3.1 Users Guide
http://slidepdf.com/reader/full/spectrum-expert-31-users-guide 132/139

8/8/2019 Spectrum Expert 3.1 Users Guide
http://slidepdf.com/reader/full/spectrum-expert-31-users-guide 133/139
Page 116 Section 14. Spectrum Expert and Your Network Operations
Spectrum Expert Users Guide (Version 3.1)
14.4.5.1 Device Finder
In other cases, the general nature of the problem may be apparent, but the particular cause is not.
For example, the plots and charts may clearly show increased RF activity when some device is
coming into use — but the device itself is not known. (For example, it may be a generic device, and
the network administrator does not recognize what device is actually implicated, based solely on
the generic parameters.)
In this case, Spectrum Expert’s Device Finder feature becomes an essential tool for tracking down
the ill-behaving RF device. See Section 11, Device Finder on page 83 for more information.

8/8/2019 Spectrum Expert 3.1 Users Guide
http://slidepdf.com/reader/full/spectrum-expert-31-users-guide 134/139
Page 117
Spectrum Expert Users Guide (Version 3.1)
15 GLOSSARY OF TERMS
Term Meaning
Fast Fourier Transform (FFT) A Fourier Transforms is a mathematical operation which takes a
waveform (such as RF waves), and determines the magnitude of the
different frequency components (sine waves and cosine waves) thatcomprise the wave. The numbers which give the magnitudes of the
sine and cosine waves can be thought of as a kind of RF “fingerprint”
which distinctively identifies the wave. Waves which are very
similar to each other can be matched, because the numbers in their
Fourier Transforms will be very similar to each other.
A Fast Fourier Transform is a computational method which enables
Fourier Transforms to be performed very rapidly (on programmable
chips, for instance), with some very minor imprecision.
Cognitive Spectrum Analysis Cognio’s technology for enabling RF discovery services, and
supporting WLAN performance and interference mitigation services.
Spectrum Analysis Engine (SAgE) Cognio's low-level hardware which provides for basic analysis of the
RF spectrum. SAgE feeds data to the MCU.
Wireless Local Area Network (WLAN) A computer network which uses wireless communication, such as
802.11 technology, and central Access Points (APs), to allow
computers to communicate without physical connecting wires.

8/8/2019 Spectrum Expert 3.1 Users Guide
http://slidepdf.com/reader/full/spectrum-expert-31-users-guide 135/139
Page 118 Section 16. Notices and Declarations
Spectrum Expert Users Guide (Version 3.1)
16 NOTICES AND DECLARATIONS
Note that these products are covered by several categories of regulation in a number of countries.
Changes or modifications not expressly approved by the manufacturer could void the user's
authority to operate the equipment in these regions.
16.1 FCC Notices
This equipment has been tested and found to comply with the limits for a Class B digital device,
pursuant to Part 15 of the FCC rules. These limits are designed to provide reasonable protection
against harmful interference when the equipment is operated in a residential installation. This
equipment generates, uses, and can radiate radio frequency energy and if not installed and used in
accordance with the instruction manual may cause harmful interference to radio communications.
However, there is no guarantee that interference will not occur in a particular installation. If this
equipment does cause harmful interference to radio or television reception, which can be
determined by turning the equipment off and on, the user is encouraged to try to correct the
interference by one or more of the following measures:
Reorient or relocate the receiving antenna.
Increase the separation distance between the equipment and the receiver.
Connect the equipment into an outlet on a circuit different from that to which the receiver
is connected.
Consult the dealer or an experienced radio TV technician for help.
16.2 Industry Canada's Interference Causing EquipmentStandard for Digital Apparatus
This Class B digital apparatus complies with Canadian ICES-003.
Cet appareil numérique de la Classe B est conforme à la norme NMB-003 du Canada.

8/8/2019 Spectrum Expert 3.1 Users Guide
http://slidepdf.com/reader/full/spectrum-expert-31-users-guide 136/139
Page 119
Spectrum Expert Users Guide (Version 3.1)
16.3 Declaration of Conformity (Model 750T CardBus Sensor Only)
This equipment has been tested and conforms to the European Council Directive 89/336/EEC, Standard
EN61326-1:1997/A2:2001 relating to Electromagnetic Compatibility for Laboratory Test Equipment.

8/8/2019 Spectrum Expert 3.1 Users Guide
http://slidepdf.com/reader/full/spectrum-expert-31-users-guide 137/139
Page 120 Section 17. Copyrights, Trademarks, and Limited Warranty
Spectrum Expert Users Guide (Version 3.1)
17 COPYRIGHTS, TRADEMARKS, AND LIMITED WARRANTY
COPYRIGHT & TRADEMARKS
Copyright © 2004 - 2007. Cognio, Inc. All Rights Reserved. Cognio, the Cognio logo, and
Spectrum Expert are trademarks of Cognio, Inc. All other trademarks and brand names are theproperty of their respective owners.
LIMITED WARRANTY
1. Cognio does not warrant that the functions contained in Cognio Products will meet your
requirements or that Cognio Products are error-free. However, Cognio does warrant that Cognio
Products will operate substantially in accordance with its published user documentation for such
Cognio Products. All software associated with the Cognio Products is provided on an “AS IS”
basis and will contain bugs. COGNIO HEREBY DISCLAIMS ALL WARRANTIES OF ANY
NATURE, EXPRESS, IMPLIED OR OTHERWISE, OR ARISING FROM TRADE OR
CUSTOM, WITH RESPECT TO SOFTWARE ASSOCIATED WITH THE COGNIO
PRODUCTS, INCLUDING WARRANTIES OF MERCHANTABILITY, FITNESS FOR A
PARTICULAR PURPOSE, ACCURACY, OR SYSTEM INTEGRATION. COGNIOSPECIFICALLY DISCLAIMS ANY WARRANTY THAT THE USE OF THE SOFTWARE
WILL BE UNINTERRUPTED OR ERROR FREE. Cognio warrants to You that during the one (1)
year immediately following Your purchase of this Product, the storage media containing software
will be free from defects in materials and workmanship. In the event the storage media fail to
conform to such warranty, as Your sole and exclusive remedy for such failure Cognio will, at its
option and without charge to You, repair or replace the storage media, provided the nonconforming
item is returned to Cognio within the one (1) year warranty period. Cognio shall further make
reasonable efforts to correct any significant reproducible error in the software associated with
Cognio Products for which Cognio (care of: Cognio Technical Support) receives written notice
promptly after such error comes to your attention, provided that such error (a) relates to the proper
functioning of Cognio Products in accordance with the published user documentation, and
(b) has not been caused by negligence or misuse on your part or the part of any third party,computer malfunction or other causes external to the Cognio Products.
2. Excluding any software associated with the Cognio Products, Cognio warrants that the Cognio
Products will be free from defects in material and workmanship for a period of one (1) year
immediately following Your purchase (“Warranty Period”). During the Warranty Period, Cognio,
at its sole option, will repair or replace defective Cognio Products within a reasonable period of
time. Any third party hardware or equipment forming a part of the Cognio Products are covered by
the warranty of the applicable manufacturer.
3. The warranties set forth in paragraphs 1 and 2 shall also apply to any new versions of Cognio
Products which You may receive at a later date.
4. THE WARRANTIES CONTAINED IN PARAGRAPHS I, 2, AND 3 ARE IN LIEU OF ALLOTHER WARRANTIES OR CONDITIONS, EXPRESS OR IMPLIED, INCLUDING,WITHOUT LIMITATION, THOSE OF MERCHANTABILITY, NONINFRINGEMENT AND
FITNESS FOR A PARTICULAR PURPOSE. IN NO EVENT SHALL COGNIO BE LIABLE
FOR DAMAGES, DIRECT OR INDIRECT, INCLUDING INCIDENTAL OR
CONSEQUENTIAL DAMAGES SUFFERED BY YOU OR ANY THIRD PARTY, ARISING
FROM BREACH OF WARRANTY OR BREACH OF CONTRACT, NEGLIGENCE OR ANYOTHER LEGAL GROUND OF ACTION, EVEN IF COGNIO HAS BEEN ADVISED OF THE

8/8/2019 Spectrum Expert 3.1 Users Guide
http://slidepdf.com/reader/full/spectrum-expert-31-users-guide 138/139
Page 121
Spectrum Expert Users Guide (Version 3.1)
POSSIBILITY OF SUCH DAMAGES. IN NO EVENT SHALL COGNIO BE LIABLE FORANY DAMAGES RELATING TO OR RESULTING FROM THE USE OF COGNIO
PRODUCTS IN CONNECTION WITH AVIATION, MEDICAL, NUCLEAR OR ULTRA
HAZARDOUS PURPOSES.

8/8/2019 Spectrum Expert 3.1 Users Guide
http://slidepdf.com/reader/full/spectrum-expert-31-users-guide 139/139
Page 122 Section 17. Copyrights, Trademarks, and Limited Warranty
This page left intentionally blank.


