Soybean oil:•a primary
dietary fat
Economics & World Trade
605
therefrom, of protein-rich seed meal,and of dietary fiber.
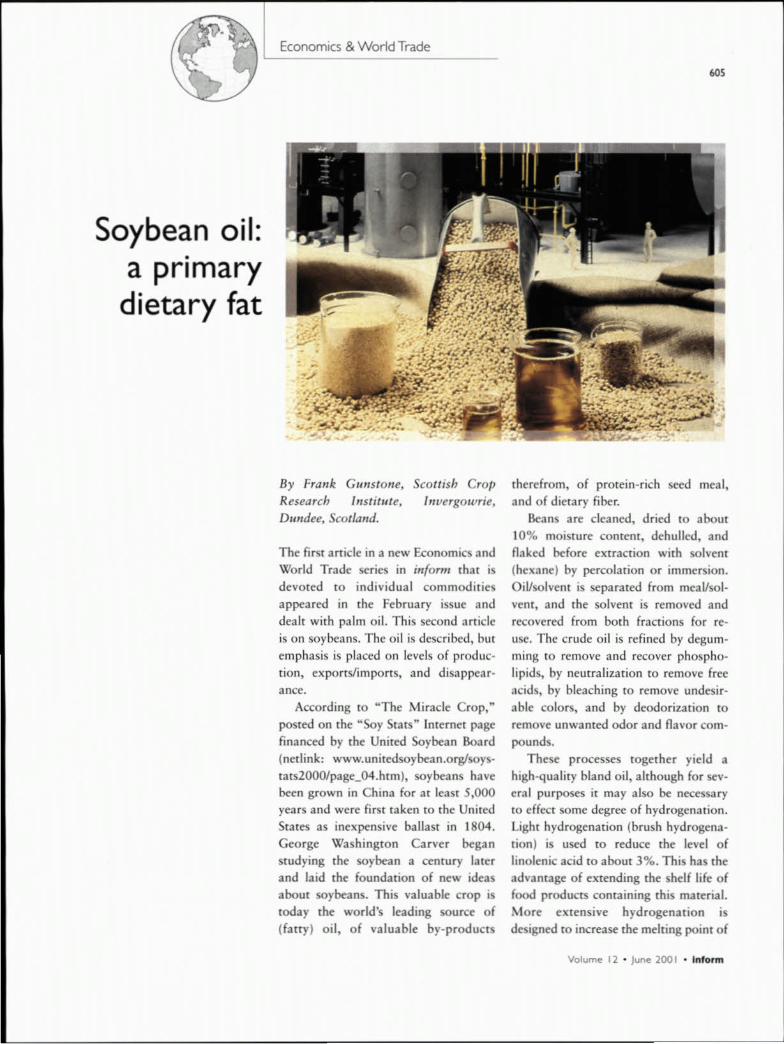
Beans are cleaned, dried to about10% moisture content, dchulled, andnaked before extraction with solvent(hexane) by percolation or immersion.Oil/solvent is separated from meal/sol-vent, and the solvent is removed andrecovered from both fractions for re-lise. The crude oil is refined by degum-ming to remove and recover phospho-lipids, by neutralization to remove freeacids, by bleaching to remove undesir-able colors, and by deodorization toremove unwanted odor and flavor com-pounds.
These processes together yield ahigh-quality bland oil, although for sev-eral purposes it may also be necessaryto effect some degree of hydrogenation.Light hydrogenation (brush hydrogena-tion) is used to reduce the level oflinolenic acid to about 3%. This has theadvantage of extending the shelf life offood products containing this material.More extensive hydrogenation IS
designed to increase the melting point of
Volume 11 • June 100 I • Inform
By Frank Gunstcne,Research Institute,Dundee, Scotland.
Scottish Croplnvergowrie,
The first article in a new Economics andWorld Trade series in i1lform that isdevoted to individual commoditiesappeared in the February issue anddealt with palm oil. This second articleis on soybeans. The oil is described, buremphasis is placed 011 levels of produc-tion, exports/imports, and disappear-ance.
According to "The Miracle Crop, H
posted on the "Soy Srars" Internet pagefinanced by the United Soybean Board(netlink: www.unitedsoybean.orglsoys-tats2000/page_04.htm), soybeans havebeen grown in China for at least 5,000years and were first taken to the UnitedStates as inexpensive ballast in 1804.George Washington Carver beganstudying the soybean a century laterand laid the foundation of new ideasabout soybeans. This valuable crop istoday the world's leading source of(fatty) oil, of valuable by-products
the oil so that it can be used to makeplastic semi solid fats. These changesalso have nutritional consequences.
The various refining procedures yieldseveral by-products of considerablevalue. These include the phospholipids(lecithin), tocopherols (vitamin E), andsterols. These are recognized as "natur-al products" and valued accordingly.
FATTY aero,TRIACTLGLTCEROL
COMPOSITION OF SOYBEAN OIL
Typical fatty acid composition data forsoybean oil are given as palmitic (11 %,Codex range 10-13%), stearic (4%,Codex range 2.0-5.4%), oleic (24%,
Omega-3 FortificationLCPUM
Heart Health
Broad Applications
Maintain Flavor Profile
Economics & World Trade
Codex range 18-25%), linoleic (54%,Codex range 50-57%), and linolenicacids (7%, Codex range 5-10%), withonly traces of acids of other chainlengths. Attempts are being pursued,both by traditional mutation seed-breeding methods and by genetic engi-neering, to produce soybeans with dif-ferent Farry acid compositions, includ-ing oil rich in lauric acid for use as analternative to coconut and palm kerneloils, oil with less palmitic and stearicacid on nutritional grounds, oil withmore palmitic and/or stearic acid for usein solid (plastic) fats without hydro-genation (which adds cost and produces
Good health and taste with Omega-3 food oil and powder.Introducing two new ways 10 make foods more appealing.So you can now put the heart healthy benefits of Omega-3into more of your products without altering the taste profile.
PutYou·1Ialso profit from our hands-on technical support andextensive consumer market research. That's more than foodfortification: it's a new way of thinking. designed to helpyour products and business become healthier. To learnmore. call Roche 8t 1-800-526-0189. or contact us viae-meu 81 [email protected].
VitaminsHealthier thinking':'
undesirable trans acids), oil with moreoleic acid on dietary grounds, and oilwith less linolenic acid to enhance shelflife without brush hydrogenation.Many such modified oils have beendescribed. Several of these are in anadvanced stage of development and it islikely that these, or materials akin tothem, will become available soon. It isexpected that they will carr)' a premiumprice but derails are nor yet known.
Soybean oil can be converted to asemisolid material by partial hydro-genation. For example, soybean oil,normally of iodine value -133, can beconverted to fat of iodine value -80
and melting point of 30-37°C, depend-ing on the conditions of hydrogena-tion. These marerials contain 18:08-12% compared with 4% in the orig-inal oil, 18:1 63-72% (24%), 18:29-13% (54%), and 18:3 0-0.3%(7%). But these numerical changes infatty acid composition do not fullyconvey the alterations that have takenplace, for the partially hydrogenatedoils contain 27-40% trans fany acidspositions which will be mainly 18: 1with the trans double-bond locationranging from 66 to .0.16but mainly A8to AU. The trans fatty acids havehigher melting points than their cis iso-
mers and thus contribute to the hard-enmg process.
In terms of molecular species, it is tobe expected, in view of the high level oflinoleic acid, that the dominant eriacyl-glycerol molecules will contain at leasttwo linoleic chains as in the followingtypical example: LLLn (7.9%), LLL(17.6%), LLO (15.3%), LLSt (4.2%),and LLP (10.2%), making a total forthis group of 55.2%. Other triacylglyc-erols include LnLnL (3.1 %), LnLO(4.8%), LnLP (3.7%), LOO (6.3%),LOP (6.9%), PLL (3.1%), 000(3.3%), LOS" (3.7%), OOP (3.4%),LP$t (3.1), and others (3.4%) (where Ln
607
= linolenic, L '" linoleic, 0 = oleic, St =stearic, and P = palmitic). These three-letter symbols indicate only the acidspresent and not their position on theglycerol backbone so that, for example,LLO represents three different isomers(LLO, LOL, and OLL) and LOP repre-sents the sum of six isomers, accordingto Reske and his colleagues.
The 1999 Aocs publication Physicaland Chemical Characteristics of Oils,Fats and Waxes reports that crude soy-bean oil contains 1.8-4.1 mg/kg ofsterols, which are mainly campesterol(16-24%), stigmasterol (16-19%). and~-sitostcrol (52-58%). Tocopherol levels
....,. ,
,\ \ (
'.,
,•,
13,........, .... '., .r .'
, • K
1
Economics & World Trade
608
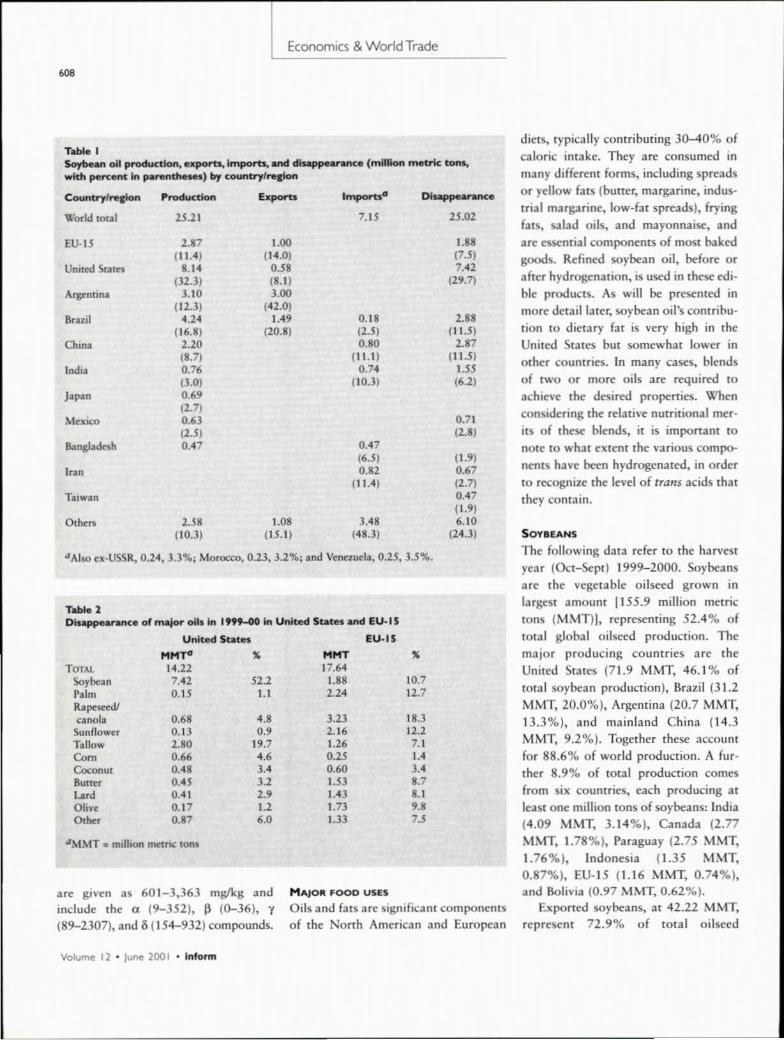
Table ISoybean 011production, elCporu,lmports. VJd disap~ViUlce (million metrlc tons,with peecent In parentheses) by countrylre,;on
Countrylrea:ion Production •• port> Imporuo Disappeannce
World 10t.1] 25.21 7.15 25.02
EU-t5 2.87 1.00 1.88(11.4) (14.0) (7.5)
United St.1les 8.14 0.58 7.42(32.3) (8.1) (29.7)
Argentina 3.10 3.00(12.3) (42.0)
B(;l~il 4.24 1.49 0.18 2.88(16.8) (20.8) (2.5) (11.5)
China 2.20 0.80 2.87(8.7) (11.1) (11.5)
India 0.76 0.74 1.55(3.0) (10.3) (6.2)
Japan 0.69(2.7)
Mexico 0.63 0.71(2.5) (2.8)
Bangladesh 0.47 0.47(6.5) (l.9)
Iran 0.82 0.67(11.4) (2.7)
Taiwan 0.47(1.9)
Others 2.58 1.08 3.48 6.10(10.3) (15.1) {48.3) (24.3)
QAlso ex-USSR, 0.24, 3.3%; Morocco, 0.23, 3.2%; and Venezuela, 0.25, 3.5%.
Table 2Disappearance of mAjor oils In 1999--00 in United States ..nd EU-I 5
United States EU-ISMMTo % MMT %
TOTAL 14.22 17.64Soybean 7.42 52.2 1.88 10.7Palm 0.15 1.1 2.24 12.7Rapeseed/canola 0.68 4.8 3.23 18.3Sunflower 0.13 0.' 2.16 12.2Tallow 2.80 19.7 1.26 7.1Com 0.66 4.6 0.25 1.4Coconut 0.48 3.4 0.60 3.4Burrer 0.45 3.2 1.53 '.7,-"d 0.4] 2.' 1.43 '.1Olive 0.17 1.2 1.73 , .sOther 0.87 6.0 1.33 7.5
Q,\oL\1T'" million melric Ions
are given as 601-3,363 mg/kg andinclude the (X (9-352), I} (0-36), Y(89-2307), and 0 (154-932) compounds.
MAJOR FOOD USES
Oils and fats arc significant componentsof the North American and European
Volume 12 • June 200I • Inform
diets, typically contributing 30-40% ofcaloric intake. They are consumed inm,IIlYdifferent forms, including spreadsor yellow Iars [butter; margarine, indus-trial margarine, low-fat spreads), fryingfats, salad oils, and mayonnaise, andare essential components of most bakedgoods. Refined soybean oil, before orafter hydrogenation, is used in these edi-ble products. As will be presented inmore deraillater; soybean oil's contribu-tion to dietary far is very high in theUnited States but somewhat lower inother countries. In many cases, blendsof two or more oils are required toachieve the desired properties. Whenconsidering the relative nutritional mer-its of these blends, it is important tonore to what extent the various compo-nents have been hydrogenated, in orderto recognize the level of trails acids thatthey contain.
SOYBEANS
The following data refer to the harvestyear (Oct-Sept) 1999-2000. Soybeansare the vegetable oilseed grown inlargest amount 1155.9 million metrictons (MMTII, representing 52.4% oftotal global oilseed production. Themajor producing countries are theUnited States (71.9 MMT, 46.1 % oftotal soybean production), Brazil (31.2MMT, 20.0%), Argentina (20.7 MMT,13.3%), and mainland China (14.3MMT, 9.2%). Together these accountfor 88.6% of world production. A fur-ther 8.9% of total production comesfrom six countries, each producing atleast one million tons of soybeans: India(4.09 MMT, 3.14%), Canada (2.77MMT, 1.78%), Paraguay (2.75 MMT,1.76%), Indonesia (1.35 MMT,0.87%), EU-15 (1.16 MMT, 0.74%),and Bolivia (0.97 MMT, 0.62%).
Exported soybeans, at 42.22 MMT,represent 72.9% of total oilseed
Serving the Process Industries Worldwide
exports. They come mainly from theUnited States (26.00 MMT, 61.6%),Argentina (8.60 MMT, 20.4%), Brazil(3.70 MMT, 8.8%), Paraguay (2.11MMT, 5.0%), and Canada (0.94 MMT,2.2%), Soybeans are imponed byalmost every trading nation, with thelargest amounts going to EU-IS (16.05MMT, 37.0%), China (5.80 MMT,13.7%), Japan (4.82 MMT, 11.4%),Mexico (3.72 MMT. 8.8%), Taiwan(2.35 MMT, 5.5%), South Korea (1.58MMT, 3.8%), Thailand (1.02 MMT,2.4%), and India (0.97 MMT, 2.4%).These eight coururies'regions, of whichsix are Asian, account for 86% of soy-
REPRESENTING:
ANDERSON INTERNATIONAL CORP.CROWN IRON WORKSFERRELL-ROSSGERSTENBERG & AGGERINDUSTRIAL FILTER & PUMPMARTIN SPROCKET & GEAROIL DRI CORPORATION
OILSEED PREPARATION &DEHULLING SYSTEMSMECHANICAL & SOLVENTEXTRACTION SYSTEMSREFINING, BLEACHING &DEODORIZINGCONVEYING. ELEVATING &POWER TRANSMISSIONEQUIPMENTMARGARINE & SHORTENINGUSED & RECONDITIONEDEQUIPMENTPROCESS EVALUATION &CONSULTING SERVICES
bean imports. The beans may be used assuch or may be crushed in the countryof origin or of importation. Oil yieldsare about 18% of the total bean.
SOYBEAN OIL
Soybean oil is produced by crushing,mainly in the countries that grow thebeans (United States, Argentina, Brazil,and China) bur also in those that importthem (China, EU-15, and Japan). Oil isexported by the United States,Argentina, Brazil, and EU-15 to almostevery country in the world, but particu-larly to China, India, and Iran.Disappearance (usage for both food and
RALPH ROMEROPresident
MAIN OFFICE2428 GRAVEL DRIVE
FORT WORTH, TEXAS76118--6938
TEL (817) 590-9396FAX (817) 590-9399
E-MAIL: romerorOflash.net
scs
nonfood purposes) is predominantly inthe United Stares, Brazil, and China fol-lowed by EU-IS and India. The modestfigure (or Argentina reflects the smallpopulation in that country. Full detailsare given in Table 1. Soybean oil con-sumed for food and nonfood purposesin the United States is 52% of the totalconsumption of oils and fats in thatcountry. The proportion consumed fordietary purposes is higher than this, and"Soy Stars" cites a figure of 82%, withno other oil or far exceeding 3%. InBrazil soybean oil is 69% of total con-sumption. These figures are very differ-ent from those in EU-15 where soybean
WE OFFER THE FINEST:
EXPELLERSEXPANDERSFLAKING &
CRACKING MILLSHAMMER MILLS
FILTERSCOOKERS &
CONDITIONERSDRYERS
MEXICO OFFICEING. HASKELL COOKE G.CHIHUAHUA NO. 222 NTE.
ENTRE ALLENDE Y NAINARIZONA CENTRO
CD. OBREGON, SON 85000MEXICO
TEL. Y FAX (6) 413-9232E-MAIL: hcookeOlnfosel.net.mx
Volume 12 • June 200 I • Inform
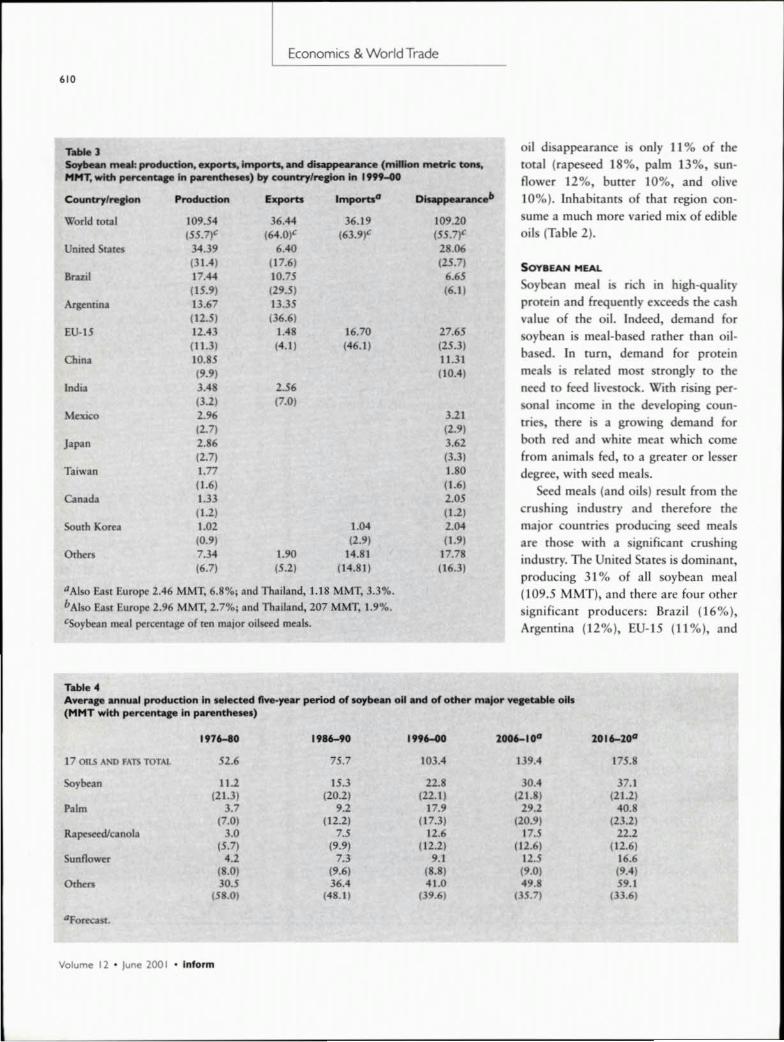
Table 4Averap annual producdon In .. Ieeted five-year period of soybean 011and of other major v.pc.ble oils(HHT with percentq:e In parenthe.e.)
1976-30 19~90 1996-00 l~IOO 101~100
17 0115ANDFATSTOTAL 52.6 75.7 103.4 1J9A 175.8
Soybean 11.2 15.3 22.8 30.'1 37.1(21.3) (20.2) (22.1) (21.8) (21.2)
Palm 3.7 9.2 17.9 29.2 40.8(7.0) (12.2) (17.3) (20.9) (23.2)
Rapeseedzcanole 3.0 7.5 12.6 17.5 22.2(5.7) (9.9) (12.2) (12.6) (12.6)
Sunflower 4.2 7.3 9.1 12.5 16.6(8.0) (9.6) (8.8) (9.0) (9.'1)
Others 30.5 36.4 41.0 49.8 59.1(58.0) (48.1) (39.6) (35.7) (33.6)
"Forec;!.st.
Volume 12 • June 2001 • Inform
Economics & World Trade
610
T.... 'Soybean meal: production, exports, imports, and d~e (million metric: ton ........ T, with peruntap in parentt.eMl:) by country/rqlon m 1999-40
Country/reslon Producdon bporu Imporuo Disappearanceb
World total 109.54 36.'14 36.19 109.20(55.7)': (64.0)': (63.9)': (55.7)'
United Statts 34.39 6.'10 28.06(31.4) (17.6) (25.7)
Brazil 17.44 10.75 6.65(15.9) (29.5) (6.1)
Argcntina 13.67 13.35(12.5) (36.6)
ru.u 12.'13 1.'18 16.70 27.65(11.3) (4.1) (46.1) (25.3)
China 10.85 1t.31(9.9) (lOA)
India 3.'18 2.56(3.2) (7.0)
Mexico 2.% 3.21(2.7) (2.9)
Japan 2.86 3.62(2.7) (3.3)
Taiwan 1.77 1.80(1.6) (1.6)
Canada 1.33 2.05(1.2) (1.2)
South Korea 1.02 1.04 2.04(0.9) (2.9) (1.9)
Others 7.34 1.90 14.81 17.78(6.7) (5.2) (14.81) (16.3)
"Also East Europe 2.46 MMT, 6.8%; and Thailand, U8 MMT, 3.3%.bAlso Easr Europe 2.96 MMT, 2.7%; and Thailand, 207 MMT, 1.9%.'Soybean meal percentage of ten major oilseed meals.
oil disappearance is only 11% of thetotal (rapeseed 18%, palm 13%, sun-flower 12%, butter 10%, and olive10%). Inhabitants of that region con-sume a much more varied mix of edibleoils (Table 2).
SOYBEAN HEALSoybean meal is rich in high-qualityprotein and frequently exceeds the cashvalue of the oil. Indeed, demand forsoybean is meal-based rather than oil-based. In turn, demand for proteinmeals is related most strongly to theneed to feed livestock. With rising per-sonal income in the developing coun-tries, there is a growing demand forboth red and white meat which comefrom animals fed, to a greater or lesserdegree, with seed meals.
Seed meals (and oils) result from thecrushing industry and therefore themajor countries producing seed mealsare those with a significant crushingindustry. The United States is dominant,producing 31 % of all soybean meal(109.5 MMT), and there are four OThersignificant producers: Brazil (16%),Argentina (12%), EU·15 (ll%), and
Crystallizers For Fatty Chemicals
China (10%), which together arcresponsible for 8'1% of world soybeanmeal production. Other countries pro-ducing onc million metric tons or moreare listed in Table 3. Exports of 36MMT are supplied mainly by Argentina(37%), Brazil (29%), and United States(18%), indicating the dominance ofSouth American suppliers. Soybeanmeal is imported by many countries, butalmost one half goes to EU-IS. In termsof disappearance the main users of the109 MMT are the United States (26%),EU-IS (25%), and China (II %). Fullerdetails are given in Table 3.
MARKET DATA OVER 40 YEARS
The figures in Table 4 relate to oil pro-duction over 40 years and include pre-dictions for future five-year periods.
The data show that the group of fourmajor oils (soybean, palm, rape/canola,and sunflower) has increased irs markershare in this period. Soybean and sun-flower oils have both increased in out-put, but only maintained market shareat about 22% and 8-10% of total pro-duction, respectively. Rapeseed/canolahas grown to about 12-13% at thepresent time and is expected to maintainthat share. Palm oil has grown in pro-duction level and continued increase ofproduction is predicted. Sometime dur-ing the decade 2011-2020 it shouldexceed the level for soybean oil.
BIBLIOGRAPHY
Gunsrone, ED., Modified Farry AcidComposirion of Oilseed Crops,t. Oleo Sci. 50, in press.
Typical Uses:
• Tallow and tall oil fatty acids fractionations
• Edible fats fractionation
• Winterization of marine and animal oils
• Crystallization of salts of sulfonated fatty acids
• Processing viscous and fouling fluids
'"
Reske, J., J. Siebrecht, andJ. Hazebroek, TriacylglycerolComposition and Structure inGenetically Modified Sunflower andSoybean Oils, l. Am. Oil Chem.Soc. 74:989- 998 (1997).
(Figl/res cited ill the text and ill Tables1-4 are from the annual and pericdi-ClJJ pl/bliCIJtions of Oil World (lSTAMielke GmbH of Hamburg,Gemu1nY·)
Readers may amtaa the author at theScottish Crop Research Institute,Inuergoume, Dundee DD2 5DA,Scotland (pho1le: 44-1382-562-731;fax:44-1382-562-426; e-mail: fgw,[email protected]@st-a"drellls.ac.llk).O
ArmstronglChemtec Pte. Ltd.'GuIA~_
'......R~blk of Sing.Jpor1'
62965]~:(65)86' 5417
f;u: (65) 861 5746
Pilot plant crysullizers available to rent to test newprocesses.
Arm5tronglChemtec B.V....,Willowyoud Road
Beilh, AyrJhi.,p,Scolland MIS IJQ
~: (44) 1505502106F,u: (<64) 1505502545
T..ln: 118141
Armstrong Engineering Associates, Inc.
P.O. IIOJr 5&6Wet Chesl~,~nsylwn'" 19381-05&6
~; 610 4366080F;u: 610 436 0374


