L. (1975) ind water kcompo- chembtry
rimer on . Depart- Division,
f'
Pergamon Soil Biol. Biochem. Vol. 26, NO. 2, pp. 287-295. 1994
Copyright 0 1994 Elsevier Science Ltd Printed in Great Britain. All rights reserved
0038-0717/94 $6.00 4- 0.00
SOIL ORGANIC CARBON DYNAMICS UNDER EUCALYPTUS AND PINUS PLANTED ON SAVANNAS IN
THE CONGO --c-
e
CLAIRE TROUVE,'* AND& MARIO'ITI,2 D O M I N I Q ~ SCHWARTZ3 -- and BERNARD GUILLET' ILaboratoire de Géochimie Organique, URA CNRS 724, BP 6759,45067 Orleans, France, *Laboratoire de Biogéochimie Isotopique, Université P. et M. Curie, INRA, 4 place Jussieu, 75252 Paris Cedex 05,
France and 30rstom, BP 1286, Pointe-Noire, Congo
(Accepted 30 July 1993)
Summary-In the Congo, Eucalyptus and Pinus have been planted commercially for 30 yr on savanna. Large differences in the abundance of carbon isotopes of the savanna Gramineae and the trees enabled a study to be made of the soil organic matter (SOM) turnover by means of its carbon isotope composition. The organic carbon content slightly increased with plantation age without any significant differences (90% confidence limit) between plantation types. The 6 I3C of SOM varies with the plantation age from -14.4966, in the savanna reference plot to values close to -26.5?& in the oldest tree plantations. The distribution of 6 I3C as a function of plantation age was modelled by an exponential function and exhibited no significant variation (90% confidence level) between plantation type. As the relative contribution of organic matter inherited from the savanna and that derived from the tree species was proportional to the 6 "C value, the fraction of each organic compartment was evaluated for plantations grouped together without distinguishing between the different tree species. With time, the SOM inherited from the savanna tended to disappear. The half-life was estimated to be 16.5 yr, clearly illustrating the rapid SOM turnover which characterizes the savanna ecosystems in psammitic ferrallitic soils. The fraction of organic C of tree origin progressively introduced into the soils was linearly related to time. The annual increment of organic C was found to be equal to 0.3 mg C g-i yr-l, but it was clear that the linear evolution of carbon with time could not be extrapolated over more than 30 yr. The various models predicted that after 30 yr there would remain in the soil, 1.8 and 0.8 mg C g-I of savanna origin and 9.4 mg C g-' of newly introduced organic C of tree origin respectively.
INTRODUCTION
The carbon isotope composition of terrestrial photo- synthetic plants differs from that found in the atmospheric reservoir of CO2 where the current 6 I3C value is approx. -7.8%0 (Nier and Gulbransen, 1939). This fractionation arises from the preferential incorporation of the lightest isotope .during the car- boxylation step of the photosynthetic cycle (Park and Epstein, 1961). However, photosynthetic patterns (C, and C,) produce different stable carbon isotdpe ratios in plants. The 6 13C values of C, plants such as trees and the majority of temperate herbaceous plants lie between -24 and -%%O, whereas 6 13C of C4 plants such as tropical Gramineae range from -9%0 to - 16%0 (Bender, 1968, 1971; Smith and Epstein, 1971; Deines, 1980). It is now well known that 6 I3C values of soil organic matter (SOM) reflect the vegetation cover (Deines, 1980; Cerri et al., 1985; Mariotti and Balesdent, 1990). Under C, vegetation, the decompo- sition processes of plant material yield slight vari- ations in the 613C in the top soil, even if SOM is enriched with "C (from 1 to 3%0) lower down the soil profile (O'Brien and Stout, 1978; Schleser and
*Author for correspondence.
Bertram, 1981; Balesdent et al., 1990). This enrich- ment can be explained in different ways: (i) atmos- pheric COz isotopic decrease during the last 100yr which is reflected in the vegetation (Marino and McElroy, 1991); (ii) differential mineralization of SOM components; (iii) isotope effects during micro- bial organic humification (Mariotti and Balesdent, 1990).
In previous studies, 13C:'2C ratios have been used as a means investigating paleoclimatic changes in subtropical areas where C3 forest has been substituted by C, savanna on podzols in the Congo (Schwartz et al., 1986) and changes from C, to C, gramineae under arid climatic conditions (Dzurec et al., 1985). In agrosystems under a temperate climate, Balesdent et al. (1987, 1988) have studied the SOM turnover in maize (C,) fields developed after previous continuous wheat cultivation. Under a tropical climate in Brasil, Cerri et al. (1985) studied the SOM turnover of Sugar Cane (C,) plantations on a recently cleared primary forest (C,).
In the Congo where Eucalyptus and Pinus have been planted on savanna during the last 30yr, an opportunity arose of studying the turnover of SOM on the basis of progressive changes in isotopic com- position of the SOM due to change of vegetation
287 8. R.S.T.0. M. fonds Documentair4
---
288 CLAIRE TROUVE et al.
from savanna (mainly C,) to forest (C,). With this intention soil samples were collected in plantation stands of known age and also from a reference plot of the initial savanna. 6 13C measurements allowed us to estimate the replacement of organic matter of the initial savanna by that of trees, so enabling an assessment of the decay rate of the organic matter of savanna origin.
MATERIALS AND METHODS
Study area The tree plantations were located in the coastal
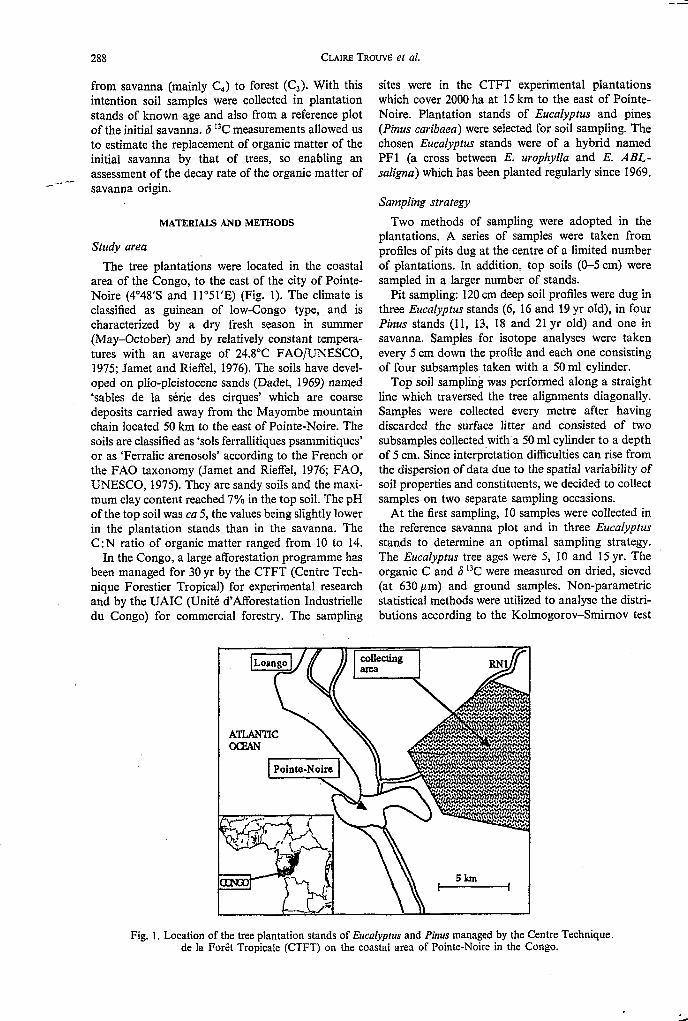
area of the Congo, to the east of the city of Pointe- Noire (4'48's and ll"51'E) (Fig. 1). The climate is classified as guinean of low-Congo type, and is characterized by a dry fresh season in summer (May-October) and by relatively constant tempera- tures with an average of 243°C FAOIUNESCO, 1975; Jamet and Rieffel, 1976). The soils have devel- oped on plio-Pleistocene sands (Dadet, 1969) named 'sables de la série des cirques' which are coarse deposits carried away from the Mayombe mountain chain Iocated 50 km to the east of Pointe-Noire. The soils are classified as 'sols ferrallitiques psammitiques' or as 'Ferralic arenosols' according to the French or the FAO taxonomy (Jamet and Rieffel, 1976; FAO, UNESCO, 1975). They are sandy soils and the maxi- mum clay content reached 7% in the top soil. The pH of the top soil was ca 5, the values being slightly lower in the plantation stands than in the savanna. The C:N ratio of organic matter ranged from 10 to 14.
In the Congo, a large afforestation programme has been managed for 30 yr by the CTFT (Centre Tech- nique Forestier Tropical) for experimental research and by the UAIC (Unité $Afforestation Industrielle du Congo) for commercial forestry. The sampling
sites were in the CTFT experimental plantations which cover 2000 ha at 15 km to the east of Pointe- Noire. Plantation stands of Eucalyptus and pines (Pinus caribaea) were selected for soil sampling. The chosen Eucalyptus stands were of a hybrid named PF1 (a cross between E. urophylla and E. ABL- saligna) which has been planted regularly since 1969.
Satnpling strategy Two methods of sampling were adopted in the
plantations. A series of samples were taken from profiles of pits dug at the centre of a limited number of plantations. In addition, top soils (0-5 cm) were sampled in a larger number of stands.
Pit sampling: 120 cm deep soil profiles were dug in three Eucalyptus stands (6, 16 and 19 yr old), in four Pinus stands (11, 13, 18 and 21 yr old) and one in savanna. Samples for isotope analyses were taken every 5 cm down the profile and each one consisting of four subsamples taken with a 50 ml cylinder.
Top soil sampling was performed along a straight line which traversed the tree alignments diagonally. Samples were collected every metre after having discarded the surface litter and consisted of two subsamples collected,with a 50 ml cylinder to a depth of 5 cm. Since interpretation difficulties can rise from the dispersion of data due to the spatial variability of soil properties and constituents, we decided to collect samples on two separate sampling occasions.
At the first sampling, IO samples were collected in the reference savanna plot and in three Eucalyptus stands to determine an optimal sampling strategy. The Eucalyptus tree ages were 5, 10 and I5 yr. The organic C and 6 13C were measured on dried, sieved (at 630 pm) and ground samples. Non-parametric statistical methods were utilized to analyse the distri- butions according to the Kolmogorov-Smirnov test
Fig. 1. Location of the tree plantation stands of Eucalyptus and Pinus managed by the Centre Technique de la Forêt Tropicale (CTFT) on the coastal area of Pointe-Noire in the Congo.
-
antations If Pointe- .nd pines iling. The d named
nce 1969. E. ABL-
// :d in the ten from i number cm) were
:re dug in i), in four id one in :re taken :onsisting Inder. a straight agonally. r having i of two o a depth rise from iability of to collect
lllected in hcalyptus strategy.
5yr. The :d, sieved arametric the distri- lrnov test
1s.
ie
SOM dynamics under plantations on savannas 289
and also to compare the means using the Student t-test (Scherrer, 1984).
Confidence intervals of the means determined by the t-test were found to be too large with 10 samples for each stand. From the t-test, we determined the optimal number of samples to be collected to reach the desired level of precision of 95%. For organic C, the desired precision was 5% about the mean value.
-,1Jsing the formulas of Scherrer (1984), we found that 25 samples had to be collected for each stand. As for the 6 I3C values, we decided that an acceptable level of precision would be about 50.36 about the mean, and, the estimated optimum number was 21 for each stand.
Therefore at the second sampling, in March 1990, 25 samples were collected in 10 Eucalyptus stands, 10 Pinus stands and in the savanna plot which is an enclave of the initial savanna conserved among the plantations. The samples from each site were air dried and mixed to obtain a representative bulk sample.
Carbon analyses Carbon contents were determined by conductivity
titration after combustion of ground soil samples in pure O, (Carmagraph Whöstoff).
The I3C natural abundance of samples was deter- mined by combustion at 850°C of organic carbon. The evolved CO, was analysed on a mass spec- trometer (Finnigan Delta E) fitted with a system equipped for rapid switching between samples and reference.
The results are expressed in 6 units (%O) vs PDB international standard as:
- 1)1000 (1) I3R sample I3R standard
6 13c =
where
Curve fitting of 6I3C as a function of the stand age The 6I3C values were fitted as a.function of the
plantation age using an exponential decay model as expressed by the following equation:
6nt = 6f+ (6s - 6 f ) ebkr (3)
where
6m = 6 I3C of organic matter of soil samples 6s = 6 I3C of soil organic matter derived from
6f = 6 13C of organic matter derived from trees k =the decay constant.
Before the introduction of the trees ( t = O), this soil organic C of savanna had an isotope composition 6s and 6m = 6s; for t -+ CO, 6m tends to 6$ With the increasing age of tree stands, the isotope composition changes from this initial value 6s to a final value Sf, which would reflect the establishment of a new forest ecosystem.
savanna
Equation (3) can be easily solved in two ways. The first consists of an iterative procedure using the least squares method (Scherrer, 1984). The second method consists in fixing the value of Sf, so that equation (3) can be transformed into a linear equation:
(4) Ln(6m - 6 f ) = Ln(6s - 6 f ) - kt
k and Ln (6s - 6 f ) are solved by a linear regression analysis. The confidence intervals of the 6s and k parameters have been computed at the probability level of 90% using Scherrer's method (Scherrer, 1984, pp. 650 and 656). The 6s and k values of the Pinus and Eucalyptus plantations were judged to be differ- ent or not at the 90% confidence limit on the basis of their confidence interval overlap.
Calculation of the fractions of organic carbon derived front the savanna and from trees
6 I3C of SOM was intermediate between those of the savanna and the trees. The fractions of organic C derived from savanna and from trees can be directly calculated from these 6 "C values if the isotope compositions of the two opposite sources (savanna and trees) are known.
Ct is the total organic C content of the sample, Cs and Cf are carbon contents derived respectively from the savanna and trees. am, 6s and 6f is 6I3C of organic matter of soil samples, of organic matter derived from savanna and of that derived from trees respectively. As '?C is not very different from the total C content (near 1%) the "C balance can be expressed as:
Ct Rm = CS RS + Cf Rf (5 ) where R is the isotope ratio 13C:1zC
As 6 I3C is linearly correlated to '3C:i2C:
Ct6m =Cs6s$Cf6f (6)
(7)
and the carbon content balance is:
Ct = c s + Cf
Then, the soil organic C contents derived from the savanna
6m -6f CS=- x Ct
6s -6f
RESULTS AND DISCUSSION
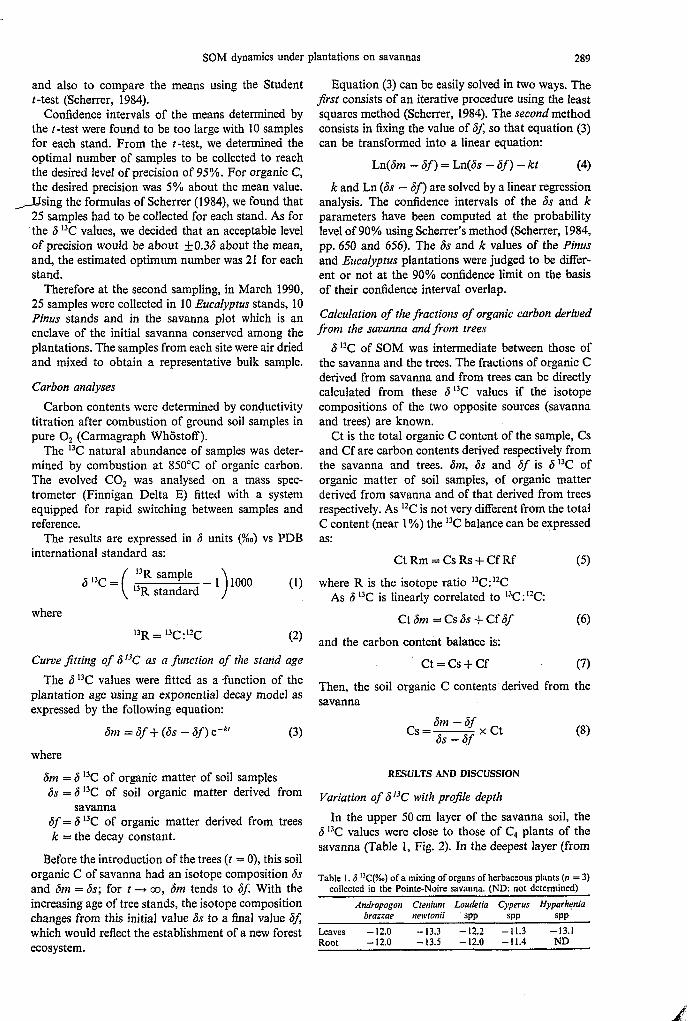
Variation of 6°C with profile depth In the upper 50 cm layer of the savanna soil, the
6°C values were close to those of C4 plants of the savanna (Table 1, Fig. 2). In the deepest layer (from
Table I . 6 '3C(?&.) of a mixing of organs of herbaceous plants (n = 3) collected in the Pointe-Noire savanna. (ND: not determined)
Andropogon Ctenium Loudelia Cyperus Hvparhenia brarzae newlonii SDD SOD SDD .. .. ..
Leaves -12.0 -13.3 -12.2 -11.3 -13.1 Root -12.0 -13.5 -12.0 -11.4 ND
Pinus
CLAIRE TROUVE et al.
613C (%*I -24 -22 -20 -18 -16 -14 -12
Eucalypfus 613C (%*) -24 -22 -20 -18 -16 . -14 -12
O
-20
30
Y -60 s 2
(y -80
-100
-120
-0- 6 p
-D 16 p
-0- 1 9 p
Fig. 2. Distribution of the 6% values down the profiles of Pinus and Eucalyptus plantations. Sav. = Savanna.
60 to 120cm) of the savanna soil, the 6°C had significantly decreased (Fig. 2). This had clearly resulted from mixing of old organic matter of tree origin with more recent organic matter derived from the present savanna plants. Similar curve patterns were obtained in Congo indicating transition from a forest landscape to a savanna (Schwartz et al., 1986). As shown in Fig. 2, the Pinus and Eucalyptus planta- tions had modified the 6 13C contents of the upper 50cm of the profile, particularly in the top soil (0-5cm). At a given depth, the influence of the plantation trees depended on the age of the planta- tion. The older the plantation, the lower was the 6 13C value of the SOM.
The 613C data for the subsoil (50-120cm) indi- cated a similar pattern in the savanna plot and in the two sampled plantations. The parallelism of the
curves indicated that the soils of the Pointe-Noire area had the same ecological history, with evidence of a forest landscape of unknown age. The non- alignment of the 6 I3C curves and their parallelism can be explained if we suppose that in any area of the savanna before afforestation, erosion processes could have been more or less severe. It is possible that at the site of a savanna pit, a soil layer of 20 cm had been eroded unlike areas now under 6yr old Eucalyptus and 11 yr old Pinus plantations.
Variation of organic carbon contents and dl'C values of the top soil
In Pinus and Eucalyptus stands, the organic C contents (Table 2) exhibited wide variation ranging from 4.5 mg g-' to 13.6 mg g', The linear relation between organic C and the Pinus stand ages
S.
ite-Noire evidence
The non- irallelism rea of the ,ses could hat at the had been kca Iyp tus
SC values
rganic C i ranging - relation md ages
SOM dynamics under plantations on savannas 29 1
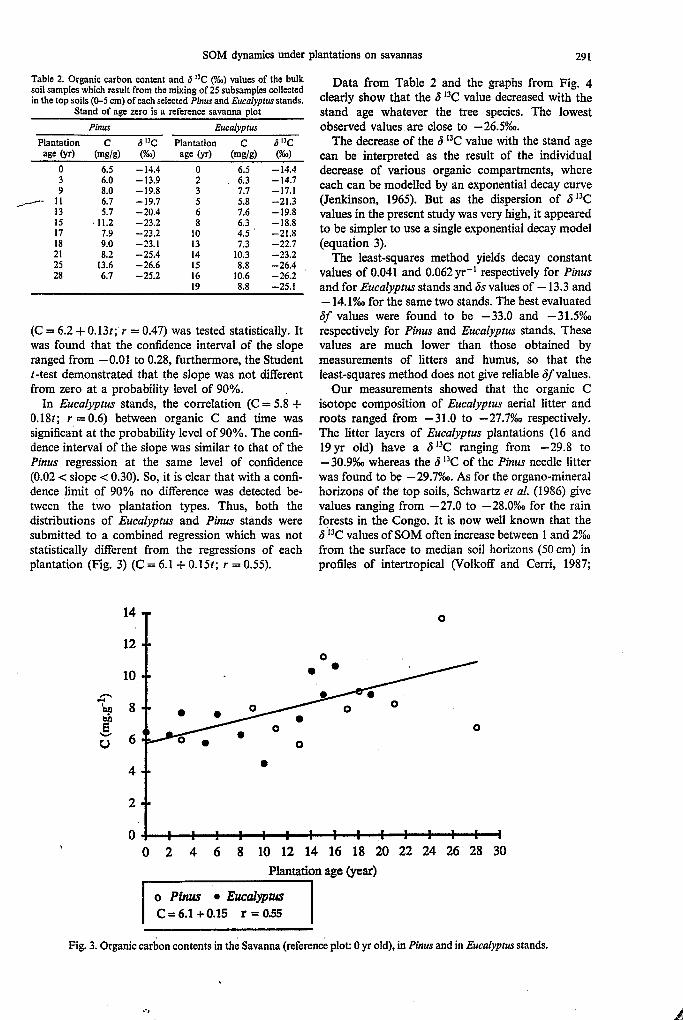
Table 2. Organic carbon content and S ')C (%) values of the bulk soil samples which result from the mixing of 25 subsampla collected in the top soils (0-5 an) of each selected Pinus and Eucalypfus stands.
Stand of age zero is a reference savanna plot Pinus Eucalyptus
Plantation C 6°C Plantation C 6°C age (yr) (mdg) (W age (yr) ( m d d (%.I
O 6.5 -14.4 O 6.5 -14.4 3 6.0 -13.9 2 . 6.3 -14.1 9 8.0 -19.8 3 1.7 -17.1
_.-Y 1 1 6.1 -19.1 5 5.8 -21.3 13 5.1 -20.4 6 1.6 -19.8 15 11.2 -23.2 8 6.3 -18.8 11 7.9 -23.2 10 4.5 -21.8 18 9.0 -23.1 13 1.3 -22.1 21 8.2 -25.4 14 10.3 -23.2 25 13.6 -26.6 15 8.8 -26.4 28 6.1 -25.2 16 10.6 -26.2
19 8.8 -25.1
(C = 6.2 + 0.13t; r = 0.47) was tested statistically. It was found that the confidence interval of the slope ranged from -0.01 to 0.28, furthermore, the Student t-test demonstrated that the slope was not different from zero at a probability level of 90%.
In Eucalyptus stands, the correlation (C = 5.8 + 0.18t; r = 0.6) between organic C and time was significant at the probability level of 90%. The confi- dence interval of the slope was similar to that of the Pinus regression at the same level of confidence (0.02 < slope < 0.30). So, it is clear that with a confi- dence limit of 90% no difference was detected be- tween the two plantation types. Thus, both the distributions of Eucalyptus and Pinus stands were submitted to a combined regression which was not statistically different from the regressions of each plantation (Fig. 3) (C = 6.1 + 0.151; r = 0.55).
12 l4 1
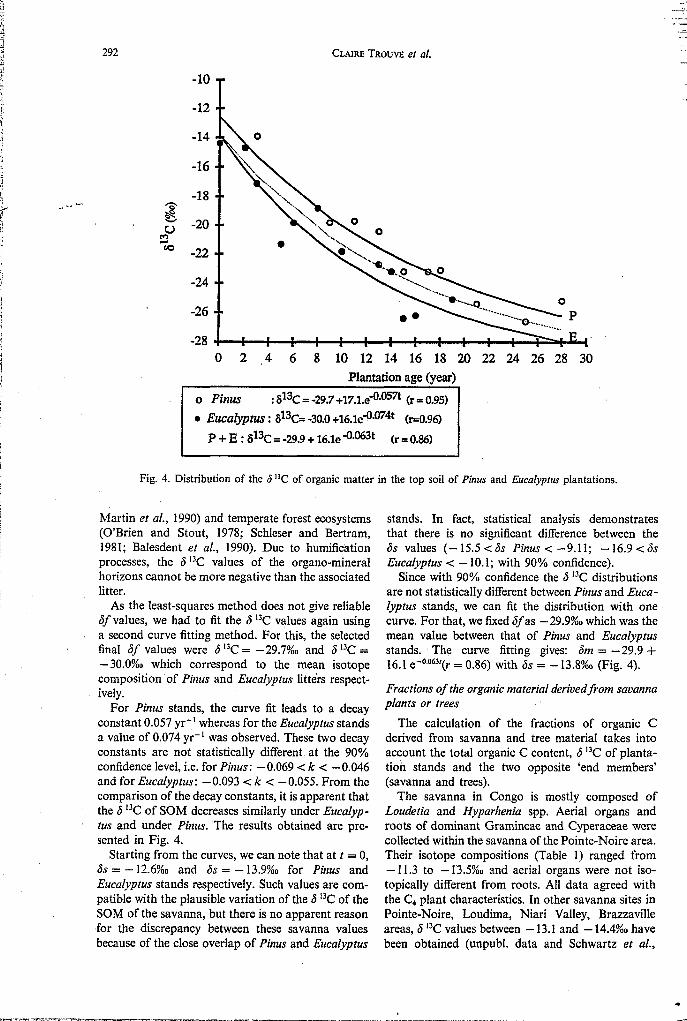
Data from Table 2 and the graphs from Fig. 4 clearly show that the 6 13C value decreased with the stand age whatever the tree species. The lowest observed vahes.are close to -26.5!??.
The decrease of the 6 "C value with the stand age can be interpreted as the result of the individual decrease of various organic compartments, where each can be modelled by an exponential decay curve (Jenkinson, 1965). But as the dispersion of 6I3C values in the present study was very high, it appeared to be simpler to use a single exponential decay model (equation 3).
The least-squares method yields decay constant values of 0.041 and 0.062 yr-' respectively for Pinus and for Eucalyptus stands and 6s values of - 13.3 and - 14.10~ for the same two stands. The best evaluated 6f values were found to be -33.0 and -31.5%' respectively for Pinus and Eucalyptus stands. These values are much lower than those obtained by measurements of litters and humus, so that the least-squares method does not give reliable 6f values.
Our measurements showed that the organic C isotope composition of Eucalyptus aerial litter and roots ranged from -31.0 to -27.7%' respectively. The litter layers of Eucalyptus plantations (16 and 19yr old) have a 6I3C ranging from -29.8 to -30.9% whereas the 6 "C of the Pinus needle litter was found to be -29.7OA. As for the organo-mineral horizons of the top soils, Schwartz et al. (1986) give values ranging from -27.0 to -28.0%~ for the rain forests in the Congo. It is now well known that the 6 I3C values of SOM often increase between 1 and 2% from the surface to median soil horizons (50cm) in profiles of intertropical (Volkoff and Cerri, 1987;
O
4l 2
O
0 4 : : : : : : ; : : , : : : : : I O 2 4 6 8 10 12 14 16 18 20 22 24 26 28 30
Plantation age (year) 1 C = 6.1 + 0.15 r = 0.55 o Pinus Eucalyptus
Fig. 3. Organic carbon contents in the Savanna (reference plot: O yr old), in Pinus and in Eucalyptus stands.
-I -
292
-12
-lo i CLAIRE TROUVE et al.
-14
-16
-18
-20
-22
-24
-26
-28 O 2 4 6 8 10 12 14 16 18 20 22 24 26 28 30
Plantation age (year)
0 Eucalypnss : 8I3C= -30.0 +16.1e4*074t (14.96)
P + E : 6I3C = -29.9 + 16.le (r = 0.86) ~~~~~ ~~
Fig. 4. Distribution of the S I3C of organic matter in the top soil of Pinus and Eucalyptus plantations.
Martin et al., 1990) and temperate forest ecosystems (O'Brien and Stout, 1978; Schleser and Bertram, 1981; Balesdent et al., 1990). Due to humification processes, the 6 I3C values of the organo-mineral horizons cannot be more negative than the associated litter.
As the least-squares method does not give reliable 6f values, we had to fit the 6 I3C values again using a second curve fitting method. For this, the selected final 6f values were 6I3C= -29.7% and SI3C = -30.0%0 which correspond to the mean isotope composition of Pinus and Eucatyptus litters respect- ively.
For Pinus stands, the curve fit leads to a decay constant 0.057 yr-' whereas for the Eucalyptus stands a value of 0.074 yr-I was observed. These two decay constants are not statistically different at the 90% confidence level, i.e. for Pinus: -0.069 < k c -0.046 and for Eucalyptus: -0.093 < k < -0.055. From the comparison of the decay constants, it is apparent that the 6 I3C of SOM decreases similarly under Eucalyp- ius and under Pinus. The results obtained are pre- sented in Fig. 4.
Starting from the curves, we can note that at t = O, 6s = - 12.6%0 and 6s = -13.9% for Pinus and Eucalyptus stands respectively. Such values are com- patible with the plausible variation of the S I3C of the SOM of the savanna, but there is no apparent reason for the discrepancy between these savanna values because of the close overlap of Pinus and Eucalyptus
stands. In fact, statistical analysis demonstrates that there is no significant difference between the 6s values (-15.5<6s Pinus< -9.11; -16.9<6s Eucalyptus < - 10.1; with 90% confidence).
Since with 90% confidence the 6 I3C distributions are not statistically different between Pinus and Euca- lyptus stands, we can fit the distribution with one curve. For that, we fixed Sf as -29.9%0 which was the mean value between that of Pinus and Eucalyptus stands. The curve fitting gives: 6 m = -29.9 + 16.1 e-0.063'(r = 0.86) with 6s = - 13.8%0 (Fig. 4).
Fractions of the organic material derived from savanna plants or trees
The calculation of the fractions of organic C derived from savanna and tree material takes into account the total organic C content, 6 13C of planta- tion stands and the two opposite 'end members' (savanna and trees).
The savanna in Congo is mostly composed of Loudetia and Hyparhenia spp. Aerial organs and roots of dominant Gramineae and Cyperaceae were collected within the savanna of the Pointe-Noire area. Their isotope compositions (Table 1) ranged from - 11.3 to - 13.5%0 and aerial organs were not iso- topically different from roots. All data agreed with the C, plant characteristics. In other savanna sites in Pointe-Noire, Loudima, Niari Valley, Brazzaville areas, 6 I3C values between - 13.1 and - 14.4%0 have been obtained (unpubl. data and Schwartz et al.,
Si
.
/---
ins.
monstrates ':tween the / 16.9 e 6s
stributions I and Euca- i with one ich was the Eucalyptus
Fig. 4).
wn savanna
organic C takes into
' of planta- members'
mposed of irgans and aceae were Noire area. nged from re not iso- greed with m a sites in Brazzaville 4.4%0 have artz et al.,
e).
= -29.9 +
SOM dynamics under plantations on savannas 293
1986). This range of values shows that the organic matter of savanna top soils was depleted in "C in comparison with the savanna C, grasses (Table 1). The variable depletion could be due to site to site variations of discrete and fugitive C3 herbaceous plants. As a reference for savanna end members, we used -13.7% which is the average value of the savanna soils of the Pointe-Noire area and which does not differ from the 6s obtained from the 6 I3C
c ,Aurve fitted for plantations taken together (- 13.8OA). As for the references of forest sources, the values
previouslyaelected, are used again, i.e. 6 I3C = -29.7 and -30.0Y~ respectively for Pinus and Eucalyptus stands. As expected, the organic material derived from savanna decreased with the age of the planta- tions whereas the organic matter of tree origin tended to increase. .
We have already concluded that the distribution of organic C between the two plantation types is simi- lar, and that (at 90% of confidence) the decay constants of the 6 I3C distributions are not statisti- cally different between Pinus and Eucalyptus stands. So, it appears highly improbable that any significant discrepancies (at 90% confidence) would result from the comparison of the fractions of organic matter of the same origin between both plantation types. Analyses of the fitted curves of Cs and Cf as a function of plantation age proved that this was so: no significant differences were found between the parameters of analogous curves. In view of these remarks, we decided to analyse and to present the
variations of Cs and Cf with time for tree plantations all together.
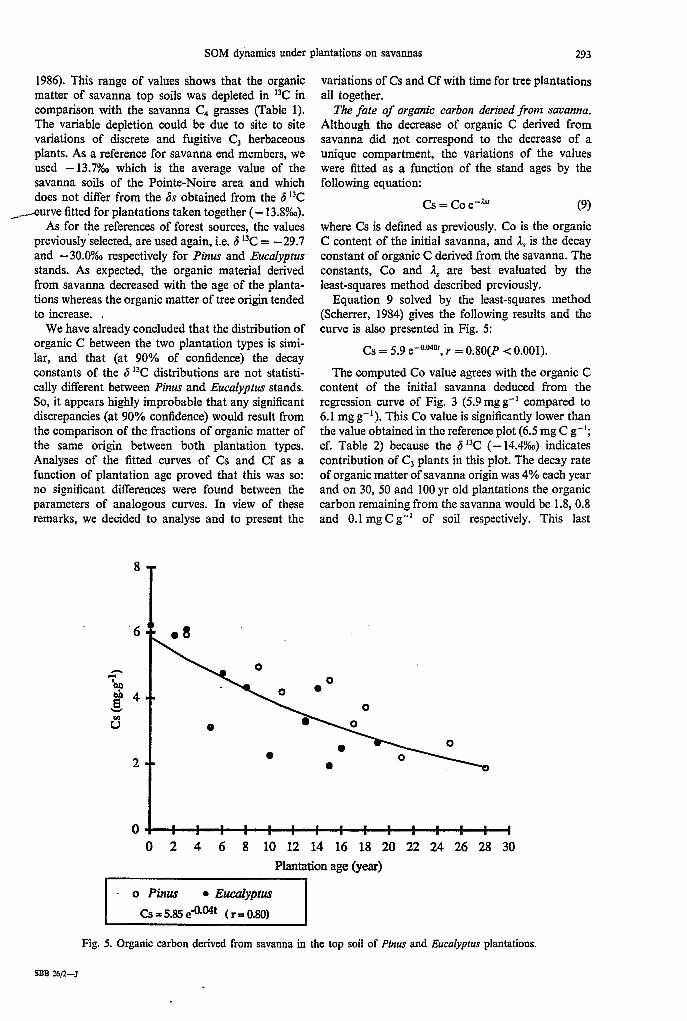
The fate of organic carbon derived from savanna. Although the decrease of organic C derived from savanna did not correspond to the decrease of a unique compartment, the variations of the values were fitted as a function of the stand ages by the following equation:
Cs = Co e-k' (9) where Cs is defined as previously. Co is the organic C content of the initial savanna, and 2, is the decay constant of organic C derived from the savanna. The constants, Co and As are best evaluated by the least-squares method described previously.
Equation 9 solved by the least-squares method (Scherrer, 1984) gives the following results and the curve is also presented in Fig. 5:
Cs = 5.9 r = 0.80(P < 0.001).
The computed Co value agrees with the organic C content of the initial savanna deduced from the regression curve of Fig. 3 (5.9 mg g-' compared to 6.1 mg g-I). This Co value is significantly lower than the value obtained in the reference plot (6.5 mg C g-l; cf. Table 2) because the 6 "C (- 14.4%) indicates contribution of C, plants in this plot. The decay rate of organic matter of savanna origin was 4% each year and on 30, 50 and 100 yr old plantations the organic carbon remaining from the savanna would be 1.8,O.g and 0.1 mgC g-' of soil respectively. This last
n - W
d
2 9 -
0 y : : : : : : : : : : : : : : i O 2 4 6 8 10 12 14 16 18 20 22 24 26 28 30
Plantation age (year)
Fig. 5. Organic carbon derived from savanna in the top soil of Pinus and Eucufypfus plantations.
SBB 26/2-J
. .
294 CLAIRE TROW et a[.
organiccarboncontentrangeof tmpical foresthmw (JAMETand "EL, 1976)
) 8 8 8 8 / 8 8 0 8 8 / 8 8 8 / / / 8 8 8 / 8 8 8 8 8 / 8 8 8 8 8 8 / 8 / / / 8
*....... .... 20 "'~"'"'"8''
*...*a
2 15
u 5
O O 20 40 60 80 100 120 140
Plantation age (year)
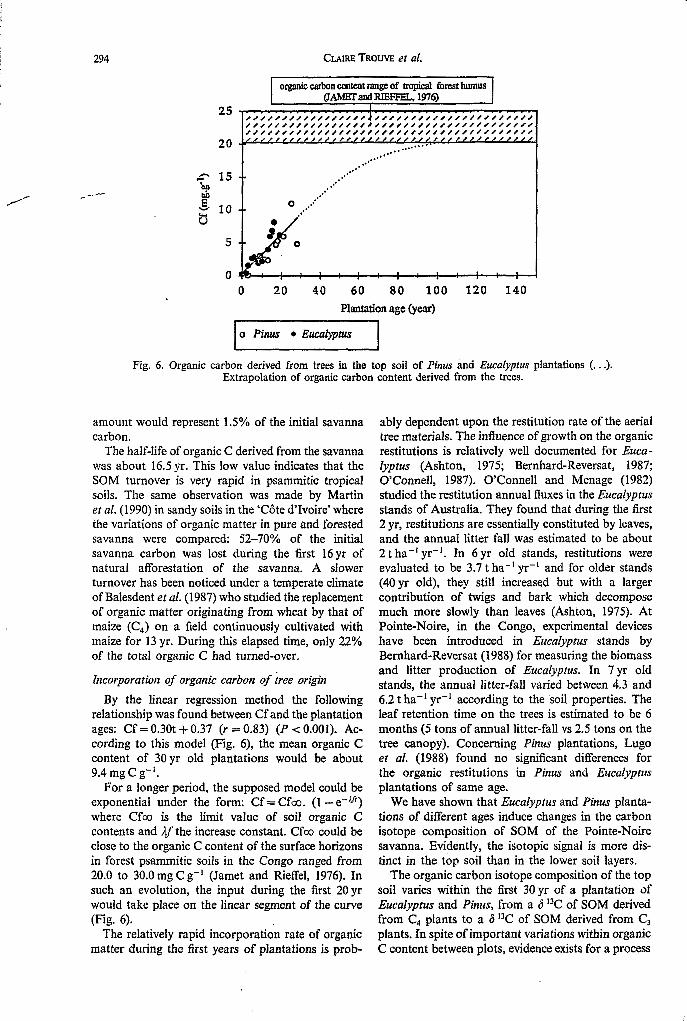
Fig. 6. Organic carbon derived from trees in the top soil of Pinus and Eucalypfus plantations (. . .). Extrapolation of organic carbon content derived from the trees.
amount would represent 1.5% of the initial savanna carbon.
The half-life of organic C derived from the savanna was about 16.5 yr. This low value indicates that the SOM turnover is very rapid in psammitic tropical soils. The same observation was made by Martin et al. (1990) in sandy soils in the 'Côte d'Ivoire' where the variations of organic matter in pure and forested savanna were compared: 52-70% of the initial savanna carbon was lost during the first 16yr of natural afforestation of the savanna. A slower turnover has been noticed under a temperate climate of Balesdent et al. (1987) who studied the replacement of organic matter originating from wheat by that of maize (C,) on a field continuously cultivated with maize for 13 yr. During this elapsed time, only 22% of the total organic C had turned-over.
Incorporation of organic carbon of tree origin By the linear regression method the following
relationship was found between Cf and the plantation ages: Cf = 0.30t + 0.37 (r = 0.83) ( P < 0.001). Ac- cording to this model (Fig. 6), the mean organic C content of 30yr old plantations would be about 9.4 mg C g-'.
For a longer period, the supposed model could be exponential under the form: Cf = Cfco. (1 - e-Afl) where Cfco is the limit value of soil organic C contents and J.. the increase constant. Cfco could be close to the organic C content of the surface horizons in forest psammitic soils in the Congo ranged from 20.0 to 30.0mgCg-' (Jamet and Rieffel, 1976). In such an evolution, the input during the first 20yr wouId take place on the linear segment of the curve (Fig. 6).
The relatively rapid incorporation rate of organic matter during the first years of piantations is prob-
ably dependent upon the restitution rate of the aerial tree materials. The influence of growth on the organic restitutions is relatively well documented for Euca- [yptus (Ashton, 1975; Bernhard-Reversat, 1987; O'ConnelI, 1987). O'Connel1 and Menage (1982) studied the restitution annual fluxes in the Eucalyptus stands of Australia. They found that during the first 2 yr, restitutions are essentially constituted by leaves, and the annual litter fall was estimated to be about 2 t ha-' yr-l. In 6 yr old stands, restitutions were evaluated to be 3.7 t ha-' yr-' and for older stands (40yr old), they still increased but with a larger contribution of twigs and bark which decompose much more slowly than leaves (Ashton, 1975). At Pointe-Noire, in the Congo, experimental devices have been introduced in Eucalyptus stands by Bernhard-Reversat (1988) for measuring the biomass and litter production of Eucalyptus. In 7yr old stands, the annual litter-fall varied between 4.3 and 6.2 t ha-' yr-' according to the soil properties. The leaf retention time on the trees is estimated to be 6 months (5 tons of annual litter-fall vs 2.5 tons on the tree canopy). Concerning Pinus plantations, Lugo et al. (1988) found no significant differences for the organic restitutions in Pinus and Eucalyptus plantations of same age.
We have shown that Eucalyptus and Pinus planta- tions of different ages induce changes in the carbon isotope composition of SOM of the Pointe-Noire savanna. Evidently, the isotopic signal is more dis- tinct in the top soil than in the lower soil layers.
The organic carbon isotope composition of the top soil varies within the first 30yr of a plantation of Eucalyprus and Pinus, from a 6 I3C of SOM derived from C, plants to a 6 "C of SOM derived from Co plants. In spite of important variations within organic C content between plots, evidence exists for a process
of.. the sigr we1 ma tio1 revc psa: inte org: that ent reac
Ack, tère ackr fruit mat: Gra'
Ash I J(
Bale of frt S(
Bale at d:
Bale
re SL
Ben1 1: 41
Beni
bc Ber1
or SL
Berr d i
N Cerr
P! tc Ir 1' 4-
Dac I:. 2 1
or
P!
(C
/--
I.
[he aerial e organic or Euca- t, 1987; ,e (1982) ucalyprus 5 the first )y leaves, be about m s were er stands a larger
:compose 1975). At 1 devices ands by ; biomass 7yr old
i 4.3 and ties. The 1 to be 6 ns on the ns, Lugo mces for ùcalyptus
rs planta- Le carbon ite-Noire nore dis- layers. 3f the top tation of 4 derived from C3
n organic a process
SOM dynamics under plantations on savannas 295
of substitution between organic matter inherited from the initial savanna and that derived from trees. No significant differences between the plantation types were found in the disappearance of savanna organic matter, probably by mineralization. In the planta- tions, the half-life of 16.5 yr of the original organic C reveals a fast turnover of the organic matter in psammitic ferrallitic soils. It is more difficult to interpret the apparent progressive incorporation of
--+organic matter derived from trees because it is clear that the steady-state equilibrium between the differ- ent components of the forest ecosystem has not been reached.
Acknowledgements-The financial support from the Minis- tère de la Recherche et de la Technologie is gratefully acknowledged. Thanks are extended to Mr J. Balesdent for fruitful discussion, to Mrs M. Pontier for discussion on mathematical models and to Mr C. Girardin and Mrs M. Grably for assistance with isotope measurements.
REFERENCES
Ashton D. H. (1975) Studies of litter in forests. Australian Journal of Botany 23, 413-433.
Balesdent J., Mariotti A. and Boisgontier D. (1990) Effect of tillage on soil organic matter mineralization estimated from 13C abundance in maize fields. Journal of Soil Science 41, 587-596.
Balesdent J., Mariotti A. and Guillet B. (1987) Natural 13C abundance as a tracer for studies of soil organic matter dynamics. Soil Biology & Biochemistry 19, 25-30.
Balesdent J., Wagner G. H. and Mariotti A. (1988) Soil organic matter turnover in longterm field experiments as revealed by the Carbon-I3 natural abundance. Soil Science Society of American Journal 52, 118-124.
Bender M. M. (1968) Mass spectrometric studies of carbon 13 variations in com and other grasses. Radiocarbon 10, 468-472.
Bender M. M. (1971) Variations in the I3C/l2C ratios of plants in relation to the pathway of photosynthetic car- bon dioxide fixation. Phytochemistry 10, 1239-1244.
Bernhard-Reversat F. (1987) Litter incorporation to soil organic matter in natural and planted tree stands in Senegal. Pedobiologia 30, 401-417.
Bernhard-Reversat F. (1988) La production de litibre et sa décomposition en plantation d'Eucalyptus sur sol sableux (CONGO). Rapport ORSTOM 10 pp. Centre de Pointe- Noire (R.P.C.).
Cerri C., Feller C., Balesdent J., Victoria R. and Plenecassagne A. (1985) Application du traçage iso- topique naturel en "C, à I'étude de la dynamique de la matière organique dans les sols. Compte Rendu de I'Académie des Sciences de Paris, t. 300, Série II 9, 423-426.
Dadet P. (1969) Notice explicative de la carte géologique de la republique populaire du Congo (1/500 000) (de latitude 2"s à 5"s). Mémoire No. 70, BRGM, Orléans 140pp. et 1 carte h.t.
Deines P. (1980) The isotopic composition of reduced organic carbon. In Handbook of Environmental Isotope Geochemistry (P. Fritz and J. C. Fontes, Eds), Vol. 1, pp. 329-406. Elsevier, Amsterdam.
Dzurec R. S., Boutton T. W., Caldwell M. M. and Smith B. N. (1985) Carbon isotope ratios of soil organic matter and their use in assessing community composition changes in Curlew Valley, Utah. Oecologia 66, 17-24.
FAO/UNESCO (1975) Carte Mondiale Des Sols. Vol. I; Légende, 62 pp. UNESCO, Paris.
Jamet A. and Rieffel J. M. (1976) Notice explicative No. 65. Carte pédologique du Congo. Feuille de Pointe-Noire, feuille de Loubomo à 1/200 000, 167 pp. + 2 cartes h.t. ORSTOM, Paris.
Jenkinson D. S. (1965) Studies on the decomposition of plant material in soil. I. Losses of carbon from I4C labeled rye-grass incubated with soil in the field. Journal of Soil Science 16, 104-115.
Lugo A. E., Brown S. and Chapman J. (1988) An analytical review of production rates and stemwood biomass of tropical forest plantations. Forest Ecology and Manage- ment 23, 179-200.
Marino B. D. and McElroy M. B. (1991) Isotopic compo- sition of atmospheric CO, inferred from carbon in C, plant cellulose. Nature 349, 127-131.
Mariotti A. and Balesdent J. (1990) "C natural abundance as a tracer of soil organic matter tumover and paleoenvi- ronment dynamics. Chemical Geology 84, 217-219.
Martin A., Mariotti A., Balesdent J., Lavelle P. and Vuattoux R. (1990) Estimate of organic matter turnover rate in a savanna soil by I3C natural abundance measure- ments. Soil Biology & Biochemistry 22, 517-523.
Nier A. O. and Gulbransen E. A. (1939) Variation in the relative abundance of the stable carbon isotopes. Journal of American Chemistry Society 61, 697698.
O'Brien B. J. and Stout J. D. (1978) Movement and turnover of soil organic matter as indicated by carbon isotope measurements. Soil Biology & Biochemistry 10,
O'Connel1 A. M. (1987) Litter decomposition, soil respir- ation and soil chemistry and biochemical properties at three contrasting sites in Karn (Eucalyptus diversicolor F. Muell.) forests of south-western Australia. Ausfralian Journal of Ecology 12, 31-40.
O'Connel1 A. M. and Menage P. M. A. (1982) Litter fall and nutrient cycling in Karri (F. Muell) forests in relation to stand age. Australian Journal of Ecology 7, 49-62.
Park R. and Epstein S. (1961) Metabolic fractionation of I3C and '*C in plants. Plant Physiology 36, 133-138.
Scherrer B. (1984) Biostatistique, Gaëtan Morin. Schleser G. H. and Bertram H. G. (1981) Investigation of
the organic carbon and 6 "C profile in a forest soil. In Recent Developments in Mass Spectrometry in Biochem- istry, Medicine and Environmental Research (A. Frigerio, Ed.), Vol. 7, pp. 201-204. Elsevier, Amsterdam.
Schwartz D., Mariotti A., Lanfranchi R. and Guillet B. (1986) 13C/12C ratios of soil organic matter as indicators of vegetation changes in the Congo. Geoderma 39,97-103.
Smith B. N. and Epstein S. (1971) Two categories of '3C/12C ratios for higher plants. Plant Physiology 47, 380-384.
Volkoff B. and Cerri C. C. (1987) Carbon isotopic fraction- ation in subtropical grassland soils. Comparison with tropical forest soils. Plant and Soil 102, 27-31.
309-317.


