http://econ.geog.uu.nl/peeg/peeg.html
Papers in Evolutionary Economic Geography
#18.04
Social capital, resilience and regional diversification in Italy
Roberto Antonietti and Ron Boschma
1
Social capital, resilience and regional diversification in Italy
Roberto Antonietti* and Ron Boschma$#
*“Marco Fanno” Department of Economics and Management University of Padova
Via del Santo 33 35123 Padova, Italy
$Urban and Regional Research Centre Utrecht (URU) Utrecht University
PO Box 115 3508 TC Utrecht, The Netherlands
#University of Stavanger
UiS Business School Stavanger Centre for Innovation Research
N-4036 Stavanger, Norway
Abstract
There is increasing interest in the question how institutions affect regional diversification, especially in times of economic crisis. This paper investigates the role of social capital for the entry of new industries and the exits of existing industries in Italian provinces during the 2004-2010 period. Our results show that bridging social capital in a region positively contributes to the entry of new industries, especially when they are unrelated to existing specializations in the region. Diversification in regions (especially more unrelated diversification) tends to rely on bridging, not on bonding social capital. We also find that bridging social capital loses its impact on regional diversification during the crisis. Bonding, not bridging social capital, appears to make regions resilient in times of crisis, by reducing the probability of exit, especially in industries unrelated to existing specializations in regions. While bridging social capital has a negative effect on exit in times of prosperity, it shows no such effect anymore during the crisis period. Our findings suggest that bridging social capital loses its supportive role in times of crisis. Keywords: bonding social capital, bridging social capital, regional diversification, resilience, economic crisis, Italy
JEL: R11, O14, D02
Acknowledgement: Funding support by JPI Urban Europe project ‘Resilient Cities: Industrial Network and Institutional perspectives on Economic Growth and Well-Being (grant 438-13-406)’ is acknowledged by Ron Boschma. Roberto Antonietti thanks participants to the XX Uddevalla Symposium in Trollhättan, the XXXVIII AISRE Conference in Cagliari, the 14th ENEF Meeting in Pisa, the BRICK lunch seminar at the University of Turin and the lunch seminar at the University of Florence for their useful advices.
2
1. Introduction In evolutionary economic geography, there has been a lot of attention for the role of
relatedness in the diversification process (Boschma 2017). Until very recently, this
literature did not investigate systematically the role of institutions for the process of
structural change and diversification of regions, despite their recognized relevance in
fostering knowledge creation, innovation and regional economic development
(MacKinnon et al. 2009; Acemoglu and Robinson 2012; Rodriguez-Pose 2013;
Rodriguez-Pose and Di Cataldo 2015; He et al. 2016). Institutions both at the national
and regional scale might play a crucial role in shaping regional diversification, as many
case studies (e.g. Saxenian 1994; Dawley 2015) on the role of institutions for regional
development have shown. Institutions may facilitate the coordination between many
agents with different capabilities and so enable crossovers and combinations across
different complementary activities that lay at the root of a successful diversification
process in countries (Boschma and Capone 2015) and regions (Cortinovis et al. 2017).
However, there is still little understanding of how institutions like social capital may
impact on regional diversification, and how that is affected by the economic crisis.
This paper has three objectives. The first objective is to investigate the role of social
capital for the entry of 5-digit industries in regions in Italy, a country which has been a
testing ground for the relationship between social capital and regional development (e.g.
Sabatini 2008; Echebarria and Barrutia 2010; Crescenzi et al. 2013) since the seminal
publication of Putnam (1993). Following Cortinovis et al (2017), who did the first study
on the effect of social capital on regional diversification, we investigate the impact of
bridging and bonding social capital on entry of industries in Italian NUTS 3 regions. As
expected, we find bridging social capital favors the entry of new industries, especially in
sectors that are less related to existing specializations in a region. By contrast, bonding
social capital has no effect or a negative effect on entry of new industries.
The second objective is to examine the role of social capital for the exit of industries in
regions in Italy. To our knowledge, no empirical study has yet systematically analyzed
the relationship between social capital and the exit probability of industries at the
regional scale. As expected, we found that bonding social capital lowers the exit
probability of an industry in a region, serving the status quo. The same negative effect
3
was found for bridging social capital. So, bridging social capital tends to increase the
probability of entry and to lower the probability of exit in a region, while bonding social
capital especially lowers the exit probability in a region.
The third objective is to assess the impact of social capital on regional diversification
before and after the 2008 crisis. We apply the evolutionary take on regional resilience
(Christopherson et al. 2010; Simmie and Martin 2010; Boschma 2015; Martin and
Sunley 2015; Liang 2017; Xiao et al. 2017) that focuses on the ability of regions to
absorb shocks in terms of entry and exit of industries. We compare the effects of bridging
and bonding social capital on entry and exit levels in Italian regions before (2004-2007)
and during the crisis period (2008-2010). During the crisis, we find that bridging social
capital has no positive effect anymore on entry of new industries, while bonding social
capital acts as an effective shock absorber, reducing the probability of exit.
The paper is organized as follows. Section 2 discusses the theoretical link between social
capital and regional diversification, and how social capital may affect diversification in
times of crisis, and thus impacts on resilience of regions. Section 3 describes the
empirical analysis and the data. Section 4 presents the econometric results and the
robustness tests. Section 5 provides some conclusive remarks.
2. Social capital, diversification and regional resilience
There is a huge literature that recognizes the role of institutions for innovation and
economic development in countries and regions (e.g. Saxenian 1994; Cooke and Morgan
1998; Beugelsdijk and Van Schaik 2005; Hauser et al. 2007; MacKinnon et al. 2009;
Acemoglu and Robinson 2012; Felice 2012; Malecki 2012; Camagni and Capello 2013;
Crescenzi et al. 2013; Rodriguez-Pose 2013; Charron et al. 2014; Forte et al. 2015; Peiró-
Palomino and Tortosa-Ausina 2015; Rodriguez-Pose and Di Cataldo 2015; Dawley 2015;
Ebner 2016). By contrast, the empirical literature on related diversification in countries
(Hidalgo et al. 2007) and regions (Neffke et al. 2011a) either ignored the role of
institutions in the diversification process altogether, or made institutions disappear under
the broad banner of capabilities (Tanner 2014; He et al. 2016). Boschma and Capone
(2015) introduced the role of institutions in this literature, focusing on how different
capitalist institutional systems affect the way through which countries specialize in new
4
products. Their results showed that so-called non-market coordinated institutional
systems increase the propensity of countries to develop new comparative advantages in
sectors that are related to existing specializations, while new specializations in more
unrelated domains are more likely to occur in countries with liberal more market-driven
institutions. However, their paper focused on national and formal institutions only.
Informal institutions like social norms, customs, traditions and codes of conduct, also
affect collective behavior of agents and shape economic development (North, 1990).
Storper (1995) suggested that ‘soft’ institutions, as ‘untraded interdependencies’, are
shaping the competitiveness of regions (Gertler 2010). Social capital has attracted a great
number of attention in this respect. Social capital has been extensively utilized to explain
economic phenomena (Westlund and Adams 2010), such as entrepreneurship (Westlund
and Bolton 2003; Levitte 2004), economic development (e.g. Knack and Keefer 1997;
Açkomak and Ter Weel 2009; Beugelsdijk and Smulders 2009; Pan and He 2010),
innovation (Crescenzi et al. 2013) and outsourcing (Antonietti et al. 2016).
This literature often makes a distinction between bonding and bridging social capital, as
these types of social capital may affect economic outcomes differently (Putnam 2000;
Sabatini 2008). The former refers to dense social structures and relationships among link-
minded people (strong ties) and exclusive networks of homogeneous agents (Granovetter
1973). According to Gittell and Vidal (1998), bonding social capital refers to close
relationships between people that are like one another, like family members, friends and
neighbors. This is often considered as the ‘dark side’ of social capital, since strong ties
“… replace exchange with external partners and filter information and perspectives
necessary for approaching problem solving and development creatively” (Levitte 2004,
p. 49). The risk associated to this form of social capital is that of ‘cognitive lock-in’, as it
tends to isolate people and firms from the outside world. This situation is well described
by Banfield (1958) with reference to a small village located in the South of Italy. In
contrast, bridging social capital refers to weak ties within inclusive networks of
heterogeneous agents, which facilitate the exchange of information and ideas and
contribute to trust-building among heterogeneous groups in society (Putnam et al. 1993).
Cortinovis et al. (2017) has applied these insights on social capital to the diversification
literature. This literature conceptualizes diversification as a Schumpeterian process in
5
which new activities are seen as new combinations of existing capabilities in regions (e.g.
Neffke et al. 2011a; Kogler et al. 2013; Boschma et al. 2015; Essletzbichler 2015; Rigby
2015; Guo and He 2017; Liang 2017). As mentioned, what this literature has been
reluctant to do is to be more precise on which capabilities other than knowledge and
skills are important (Tanner 2014; Boschma 2017). We argue that institutions like social
capital may be crucial in this respect, as these may bring together and coordinate agents
that posses different capabilities (Hidalgo 2015; Kemeny and Cooke 2017). In other
words, institutions may play a key role in enabling, or not, the formation of new
combinations across complementary activities that lay at the root of a successful
diversification process.
As in Cortinovis et al. (2017), we expect bridging social capital to be a type of informal
institution that eases the search for and the establishment of connections among diverse
agents, making coordination and knowledge diffusion easier (Crescenzi et al., 2013).
Regions with bridging social capital are also those where input-output relations are
favored (Burker and Minerva 2014; Antonietti et al. 2016). Therefore, the ‘bridging’
nature of this form of institution should favor the creation of new activities, especially in
areas that are not strictly related to existing specializations in the region. Cortinovis et al.
(2017) found evidence that new industries develop more likely in European regions with
a higher endowment of bridging social capital. Conversely, bonding social capital is
characterized by strong, inclusive relationships that reduce the probability for regions to
mobilize and re-combine internal resources to generate new activities and ideas. When
powerful special-interest organizations take over regional economies, they tend to slow
down their capacity to reallocate resources to new activities (Olson 1982). As Westlund
and Bolton (2003) put it, “tight bonds between individuals may well stifle
entrepreneurship – that is, may stifle “matching to a different pipe” or “coloring outside
the lines” – rather than encourage it” (p. 80). So, bonding social capital increases the risk
of cognitive lock-in and reduces the chances to develop new specializations, particularly
those unrelated to existing specializations in the region. Cortinovis et al. (2017) indeed
found that bonding social capital had a negative effect on diversification in European
regions, especially when the quality of government in a region is low.
Based on these considerations, we derive the first set of hypotheses:
6
H1a: the probability of entry is positively related to bridging social capital in a region
H1b: this positive effect is stronger for entry of new activities unrelated to existing
specializations in a region
H1c: the probability of entry is negatively related to bonding social capital in a region
H1d: this negative effect is stronger for entry of new activities unrelated to existing
specializations in a region.
The related diversification literature has looked not only at entries but also exits. Studies
have provided substantial evidence that industries are more likely to exit a region when
unrelated to existing industries (Neffke et al. 2011a, 2017; Balland et al. 2015). To our
knowledge, no empirical study has yet systematically analyzed the relationship between
social capital and the exit probability of industries at the regional scale. Though bonding
social capital may lead to lock-in because of closed and tight network relationships in the
region (Grabher 1993), this may also favor the sharing of business risks and the
establishment of collective arrangements that shield or protect regional industries from
negative external events (Westlund and Bolton, 2003; Echeberria and Barrutia, 2013).
Therefore, industry exit is less likely to occur as these institutions with strong community
ties favor the status quo in regions. This is in contrast to bridging social capital, which
may increase the exit probability in a region. Lock-in is less likely to occur in such a
social context, as resources flow more freely across diverse activities, meaning these will
also move away more easily from industries in decline. The socio-political system is also
less inclined to support declining sectors in such a distributed social structure, as there
are many competing interests and demands, although such collective support is still better
than in a fragmented social structure with no bridging social capital (Boschma 2015).
Based on these considerations, we formulate a second set of hypotheses:
H2a: the probability of exit is positively related to bridging social capital in a region
H2b: this positive effect is stronger for exit of new activities unrelated to existing
specializations in a region
7
H2c: the probability of exit is negatively related to bonding social capital in a region
H2d: this negative effect is stronger for exit of new activities related to existing
specializations in a region.
Another important question is whether the effects of social capital on entry and exit in
regions is affected by the economic crisis of 2008. Many papers have been published on
the resilience of regions to the 2008 economic shock, analyzing the sensitivity of regions
to a shock and their capacity to bounce back and recover from it. The resilience literature
often adopts an equilibrium perspective on regional resilience, but, in doing so, it tends to
neglect the role of structural change (Christopherson et al. 2010; Simmie and Martin
2010; Pike et al. 2010). This critique has led to the foundation of an evolutionary
perspective on regional resilience (Boschma 2015; Martin and Sunley 2015; Liang 2017).
To account for structural change, resilience of regions needs to be redefined as the ability
of regions to absorb shocks in terms of entry and exit of industries. Xiao et al. (2017)
adopted such an evolutionary approach in a study on the resilience of European regions,
but did not investigate the effect of institutions like social capital on regional resilience.
So, no study has yet focused on whether the impact of institutions on regional
diversification varies with the business cycle. We hypothesize the expected effects of
bridging and bonding social capital on entry and exit (as formulated in hypotheses 1-2) to
increase during the crisis period (2008-2010), compared to the pre-crisis period (2004-
2007). Therefore, in times of crisis, we expect stronger positive effects of bridging social
capital on entry and exit, especially for unrelated industries. This is because in times of
crisis, despite high uncertainty, there is a stronger need felt by at least some agents
(firms, banks, policy makers) to take higher risks and to develop new activities, to
compensate for losses in existing activities (Kleinknecht 1987; OECD 2009; Filippetti
and Archibugi 2011). This counter-cyclical behavior might be easier to implement in
regions with high endowment of bridging social capital. Likewise, we expect stronger
negative effects of bonding social capital on entry (especially for unrelated industries)
and exit (especially for related industries), as compared to the pre-crisis period, because a
crisis makes local agents in such a regional social context even more conservative
(dampening entry and exit levels).

8
3. Empirical analysis
3.1. Data and variables To test our hypotheses, we use data from the Statistical Archive on Active Firms
(Archivio Statistico Imprese Attive – ASIA) provided by the Italian Statistical Institute
(ISTAT). These data provide information on number of plants and employees, by sector
(up to the five-digit level) and region (at NUTS3 level which corresponds to Italian
administrative provinces). The unit of observation is the five-digit industry i in the
NUTS3 region r. Data are available from 2004 to 2010. We consider 2004-07 as the
period before the arrival of the economic crisis, and 2008-10 as the crisis period.
Table 1 shows the distribution of 5-digit industries by 1-digit sector in 2004-07 and
2008-10. We note that the number of industries has increased in all sectors but
manufacturing, following the process of de-industrialization in advanced economies1.
Table 1. Distribution of 5-digit industries by 1-digit sectors 2004-07 2008-10 Industry N. of 5-dgt industries % N. of 5-dgt industries % Building 1,849 2.91 2,192 3.25 Energy 674 1.06 793 1.18 Manufacturing 24,666 38.88 22,943 34.00 Services 36,260 57.15 41,557 61.58 Total 63,449 100.0 67,485 100.0
We use these data to compute our measures of entry and exit, and to identify whether
entries or exits are related or unrelated to existing specializations in each region. In
particular, we classify an entry as a dummy that equals 1 if a 5-digit industry is absent in
2004 (2008) but present in 2007 (2010). To avoid spurious entries, we consider only new
5-digit industries with at least 5 employees (Neffke et al. 2016). Accordingly, we identify 1 A note of caution is worth when interpreting these data. In 2008, ISTAT revised the classification system of
industries, from ATECO 2002 to ATECO 2007, following a more general revision of classification systems provided
by EUROSTAT from NACE 1.1 to NACE 2. Since some sectors changed industry, for example passing from
manufacturing to services and vicervesa, the industry distribution in the two sub-periods is not perfectly comparable.
This is also the reason why we chose to split the sample in these two sub-periods.

9
an exit through a dummy that equals 1 when a 5-digit industry is present in 2004 (2008)
but not in 2007 (2010). As before, we consider as ‘true’ only those exits involving at
least 5 employees2.
We use a similar measure of relatedness as in Frenken et al. (2007): a 5-digit industry is
related with another 5-digit industry when they share the same 3-digit class. We consider
an entry to be (un)related to an existing specialization when a newly created 5-digit
industry belongs to a 3-digit industry in which the region is (un)specialized. We use the
location quotient to establish whether a region is specialized in a specific industry. For
each NUTS3 region r, and for each 3-digit industry j, we first compute the location
quotient (in years 2004 and 2008 respectively) as follows:
(2) ***
*
empempempemp
LQj
rjrjr =
where empjr is employment of industry j in region r, emp*r is total employment of all
industries in region r, empj* is total employment of all industries all regions, and emp** is
total employment in all industries and all regions of Italy. The higher LQ, the higher the
specialization of the region in that particular 3-digit industry. As stressed by some
scholars (O’Donoghue and Gleave 2004), there is no widely accepted value of the
location quotient that unambiguously identifies the specialization of a region in an
industry. While some algorithms have been proposed to extract a cut-off value from the
actual distribution of industry employment in the data at hand (see Cortinovis et al.
2017), to keep the analysis as simple as possible, we identify two values that should
delimit a high and a low specialization of the region in an industry. Specifically, we
classify a region r to be fully specialized in a 3-digit industry j if LQjr≥1.5, while we
consider region r to be fully unspecialized in industry j if LQjr≤0.5.
Accordingly, we define an exit to be related to an existing activity when a 5-digit sector
(with at least 5 employees) disappears in 2007 (2010) and this occurs in a 3-digit industry
2 This means that we only consider as entries those industries where employment passed from zero in 2004
(2008) to a value higher than 5 in 2007 (2010).
10
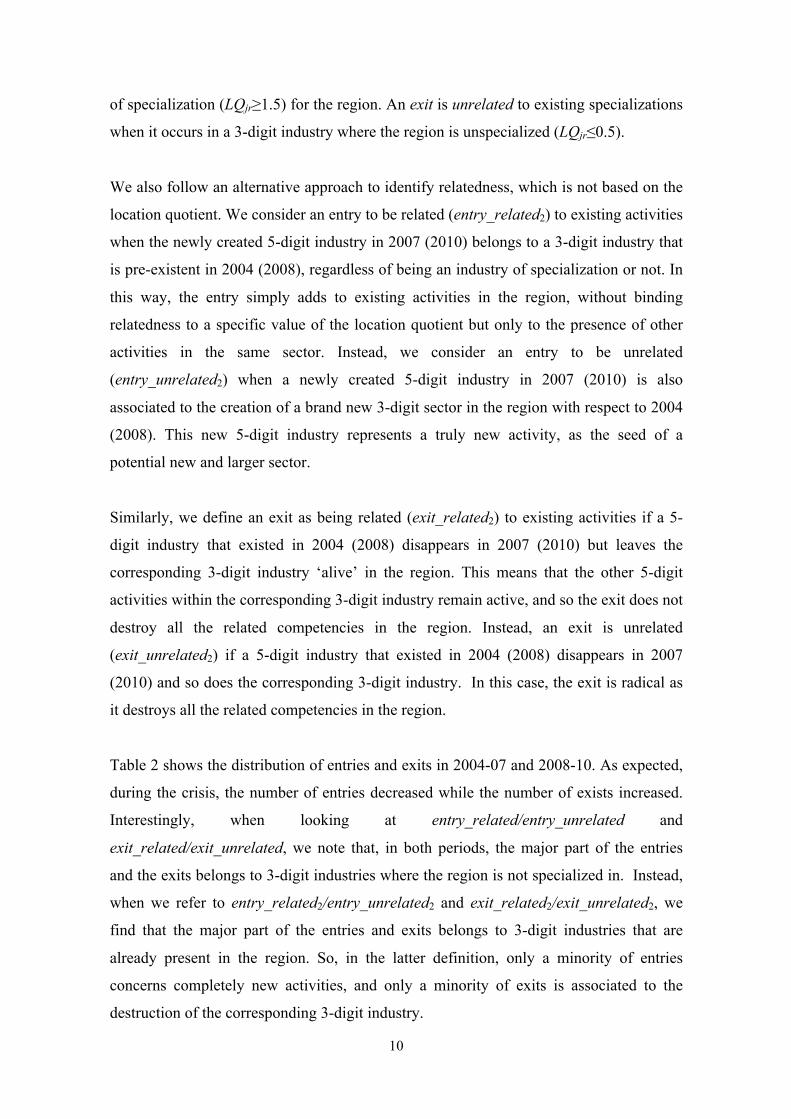
of specialization (LQjr≥1.5) for the region. An exit is unrelated to existing specializations
when it occurs in a 3-digit industry where the region is unspecialized (LQjr≤0.5).
We also follow an alternative approach to identify relatedness, which is not based on the
location quotient. We consider an entry to be related (entry_related2) to existing activities
when the newly created 5-digit industry in 2007 (2010) belongs to a 3-digit industry that
is pre-existent in 2004 (2008), regardless of being an industry of specialization or not. In
this way, the entry simply adds to existing activities in the region, without binding
relatedness to a specific value of the location quotient but only to the presence of other
activities in the same sector. Instead, we consider an entry to be unrelated
(entry_unrelated2) when a newly created 5-digit industry in 2007 (2010) is also
associated to the creation of a brand new 3-digit sector in the region with respect to 2004
(2008). This new 5-digit industry represents a truly new activity, as the seed of a
potential new and larger sector.
Similarly, we define an exit as being related (exit_related2) to existing activities if a 5-
digit industry that existed in 2004 (2008) disappears in 2007 (2010) but leaves the
corresponding 3-digit industry ‘alive’ in the region. This means that the other 5-digit
activities within the corresponding 3-digit industry remain active, and so the exit does not
destroy all the related competencies in the region. Instead, an exit is unrelated
(exit_unrelated2) if a 5-digit industry that existed in 2004 (2008) disappears in 2007
(2010) and so does the corresponding 3-digit industry. In this case, the exit is radical as
it destroys all the related competencies in the region.
Table 2 shows the distribution of entries and exits in 2004-07 and 2008-10. As expected,
during the crisis, the number of entries decreased while the number of exists increased.
Interestingly, when looking at entry_related/entry_unrelated and
exit_related/exit_unrelated, we note that, in both periods, the major part of the entries
and the exits belongs to 3-digit industries where the region is not specialized in. Instead,
when we refer to entry_related2/entry_unrelated2 and exit_related2/exit_unrelated2, we
find that the major part of the entries and exits belongs to 3-digit industries that are
already present in the region. So, in the latter definition, only a minority of entries
concerns completely new activities, and only a minority of exits is associated to the
destruction of the corresponding 3-digit industry.
11
Table 2. Entries and exits before and during the 2008 recession 2004-07 2008-10
N. of 5-dgt industries
% N. of 5-dgt industries
%
entry 1,225 1.93 666 0.99
entry related|entry=1 (LQ≥1.5) 90 7.35 68 10.21
entry unrelated|entry=1 (LQ≤0.5)
1,135 92.65 383 57.51
entry related2|entry=1 904 73.80 500 75.08
entry unrelated2|entry=1 321 26.20 166 24.92
exit 592 0.93 778 1.15
exit related|entry=1 (LQ≥1.5) 98 16.55 129 16.58
exit unrelated|entry=1 (LQ≤0.5) 494 83.45 649 83.42
exit related2|entry=1 514 86.82 647 83.16
exit unrelated2|entry=1 78 13.18 131 16.84
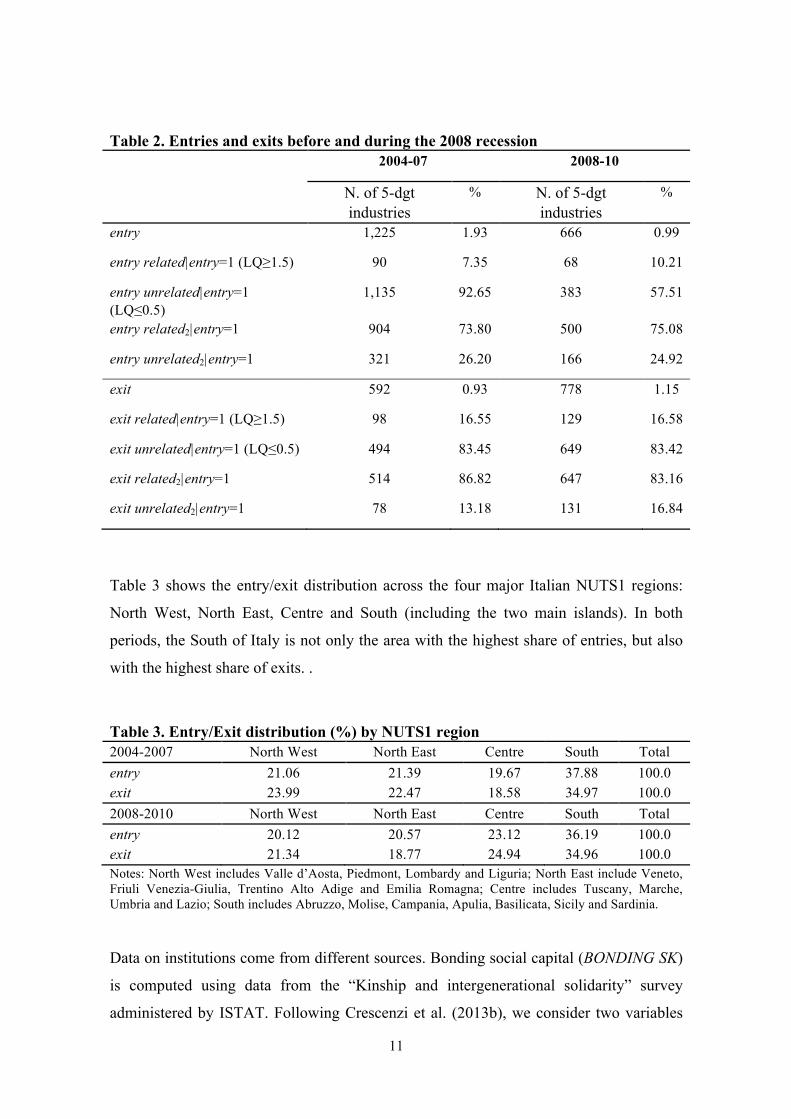
Table 3 shows the entry/exit distribution across the four major Italian NUTS1 regions:
North West, North East, Centre and South (including the two main islands). In both
periods, the South of Italy is not only the area with the highest share of entries, but also
with the highest share of exits. .
Table 3. Entry/Exit distribution (%) by NUTS1 region 2004-2007 North West North East Centre South Total entry 21.06 21.39 19.67 37.88 100.0 exit 23.99 22.47 18.58 34.97 100.0 2008-2010 North West North East Centre South Total entry 20.12 20.57 23.12 36.19 100.0 exit 21.34 18.77 24.94 34.96 100.0 Notes: North West includes Valle d’Aosta, Piedmont, Lombardy and Liguria; North East include Veneto, Friuli Venezia-Giulia, Trentino Alto Adige and Emilia Romagna; Centre includes Tuscany, Marche, Umbria and Lazio; South includes Abruzzo, Molise, Campania, Apulia, Basilicata, Sicily and Sardinia. Data on institutions come from different sources. Bonding social capital (BONDING SK)
is computed using data from the “Kinship and intergenerational solidarity” survey
administered by ISTAT. Following Crescenzi et al. (2013b), we consider two variables
12
(both refer to year 2003): (i) the number of families having lunch at least once per week
with relatives and close friends; (ii) the number of young adults who live with their
parents. The former is used as a proxy for the frequency of interactions, while the latter
should capture the social proximity among individuals (Sabatini 2008, 2009). Using
Crescenzi et al. (2013a, b) approach, we normalize these variables x as follows: (x-
min)/(max-min), so to make x range between 0 and 1. Since these variables are recorded
only at NUTS2 regional level, we consider a third element that, instead, is made available
at the NUTS3 regional level: the number of resident family units in the NUTS3 region, as
provided by the 2001 Census of population. We divide this number by the total number
of resident family units in the corresponding NUTS2 region so to obtain the share of
resident family units for each Italian province. Then we compute the weighted mean of
the previous two normalized components, using the share of resident family units as a
weight. In this way, our measure of bonding social capital varies at the NUTS3 regional
level and a higher weight is assigned to provinces with a larger share of family units3.
In line with recent studies on social capital and economic development (Guiso et al.
2004; Crescenzi et al. 2013a,b; Burker and Minerva 2014), bridging social capital
(BRIDGING SK) is based on information concerning the number of blood donations per
1,000 inhabitants (in 2002) and the number of voluntary associations per km2 in 2001-02.
Information is taken from Cartocci (2007) and available at the NUTS3 level. As before,
we normalize each variable and then we compute the mean of the two normalized
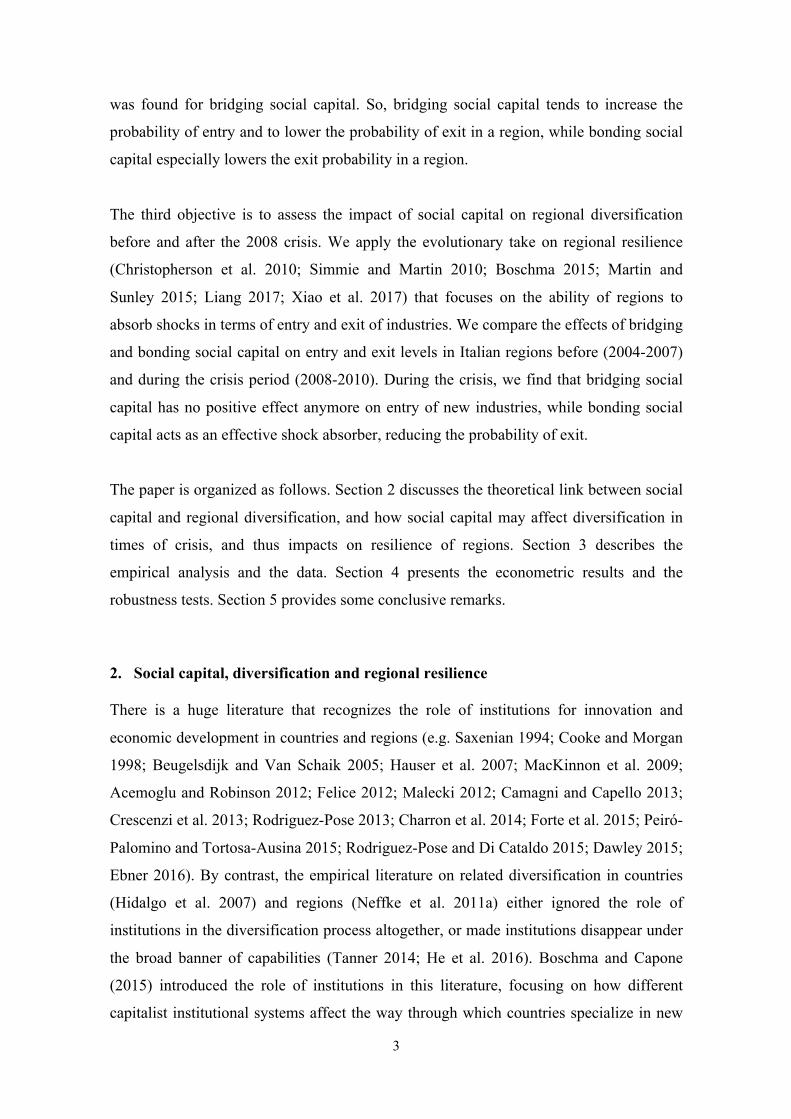
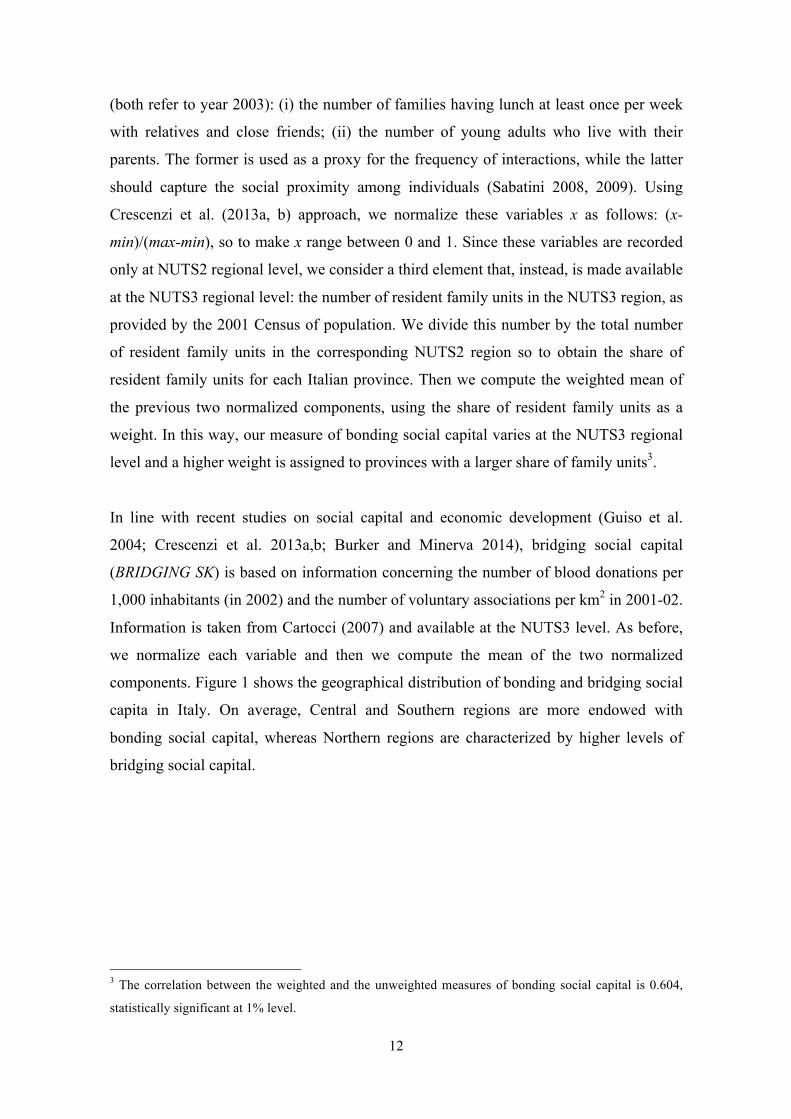
components. Figure 1 shows the geographical distribution of bonding and bridging social
capita in Italy. On average, Central and Southern regions are more endowed with
bonding social capital, whereas Northern regions are characterized by higher levels of
bridging social capital.
3 The correlation between the weighted and the unweighted measures of bonding social capital is 0.604,
statistically significant at 1% level.
13
Figure 1. The geography of bonding and bridging social capital in Italy
Bonding social capital Bridging social capital
Source: Authors’ elaborations. In our empirical analysis, we also control for the quality of formal institutions. We make
us of the Quality of Government index at the province level, as computed by Nifo and
Vecchione (2015). Similarly to the World Governance Indicator of the World Bank
(Kaufmann et al. 2011), the Quality of Government Index (QGI) includes five sub-
indicators on voice and accountability, government effectiveness, regulatory quality, rule
14
of law, and control of corruption. The higher the index, the higher the quality of regional
institutions. We consider the QGI for the first available year, 20044.
Finally, we include a series of regional characteristics that can confound the relationship
between institutions and regional diversification. As a first control, we include the degree
of industry variety (VAR) of the region. Following Frenken et al. (2007), the index is
computed as the level of entropy at 5-digit industry level in year 2004, using industry
employment data available from ASIA. This variable should control for the initial
distribution of 5-digit industries in the region. Second, we include population density
(POPDEN) for Census year 2001 in order to capture the role of urbanization
externalities. Third, we control for regional human capital (HK), given by the share of
regional labor force with at least a secondary school degree in 2001. We also include two
controls for the size and the initial economic wealth of the region, as given, respectively,
by the level of value added in 2001 (VA) and the growth rate of value added per capita
(GROWTH) between 2001 and 2004. A further element that can affect entry and exit is
the degree of trade openness of the region. We measure it by dividing the sum of exports
and imports by regional value added in 2001 (TRADE). Areas with large imports and/or
exports may either suffer business losses because of foreign competition or benefit from
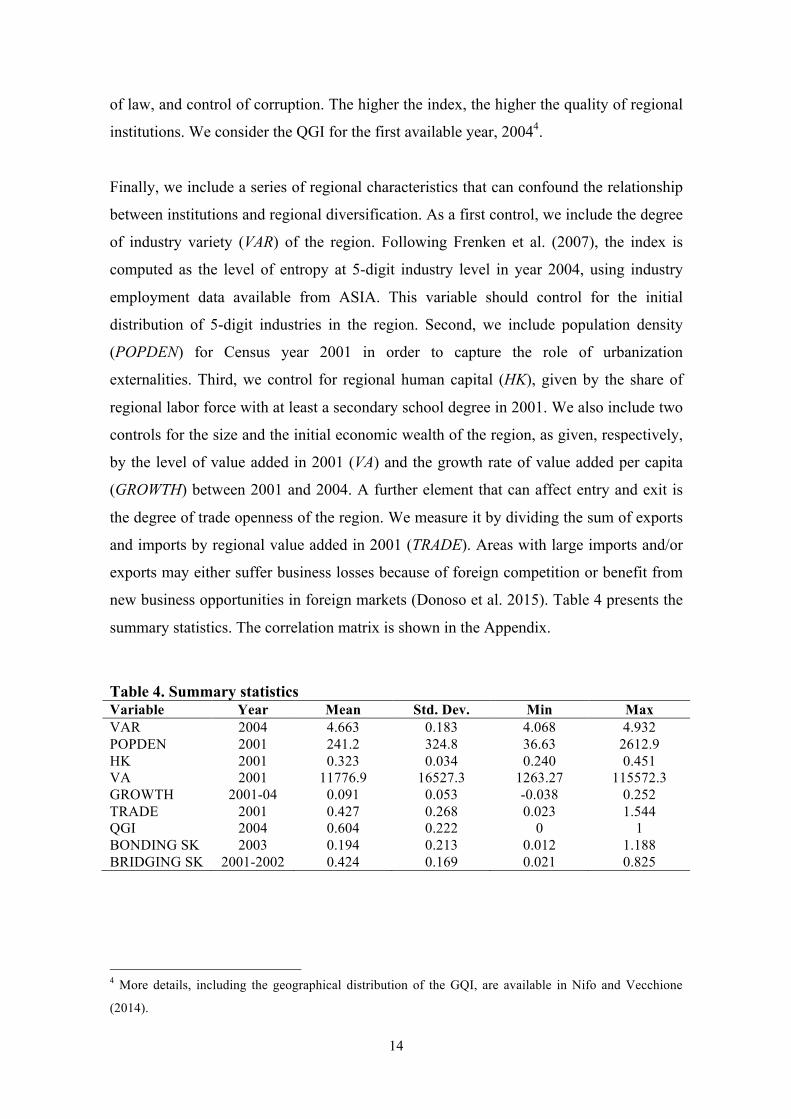
new business opportunities in foreign markets (Donoso et al. 2015). Table 4 presents the
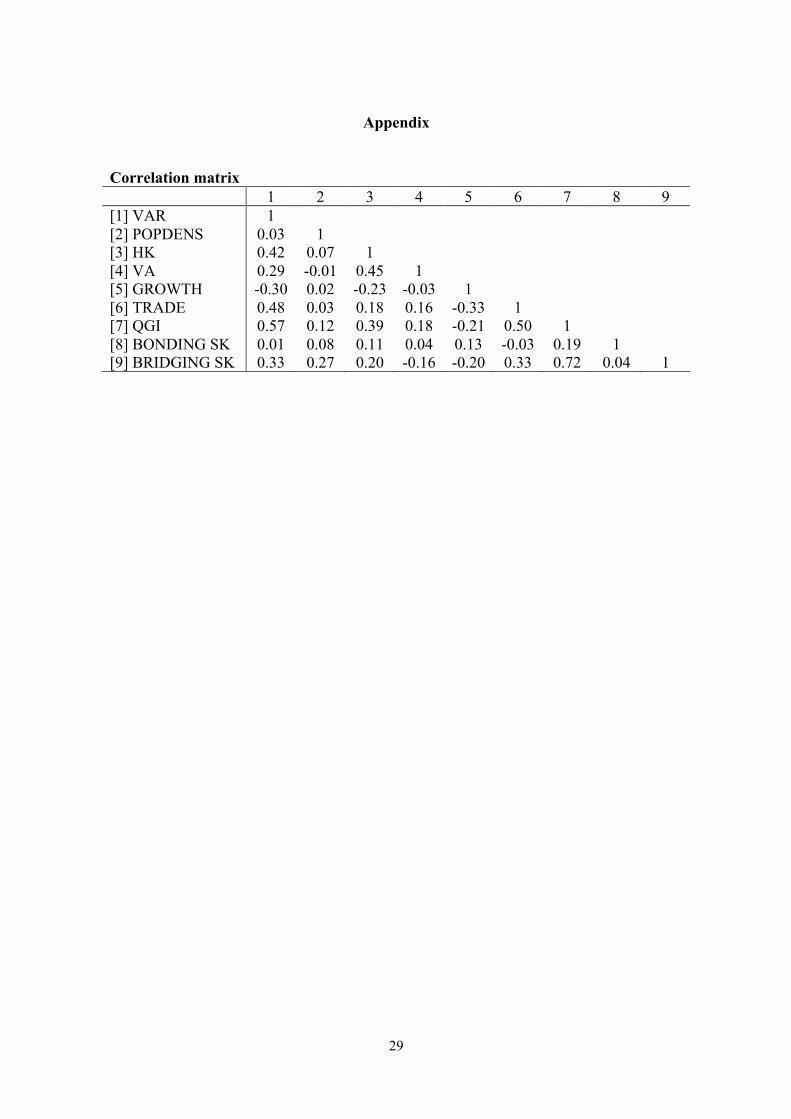
summary statistics. The correlation matrix is shown in the Appendix.
Table 4. Summary statistics Variable Year Mean Std. Dev. Min Max VAR 2004 4.663 0.183 4.068 4.932 POPDEN 2001 241.2 324.8 36.63 2612.9 HK 2001 0.323 0.034 0.240 0.451 VA 2001 11776.9 16527.3 1263.27 115572.3 GROWTH 2001-04 0.091 0.053 -0.038 0.252 TRADE 2001 0.427 0.268 0.023 1.544 QGI 2004 0.604 0.222 0 1 BONDING SK 2003 0.194 0.213 0.012 1.188 BRIDGING SK 2001-2002 0.424 0.169 0.021 0.825
4 More details, including the geographical distribution of the GQI, are available in Nifo and Vecchione
(2014).
15
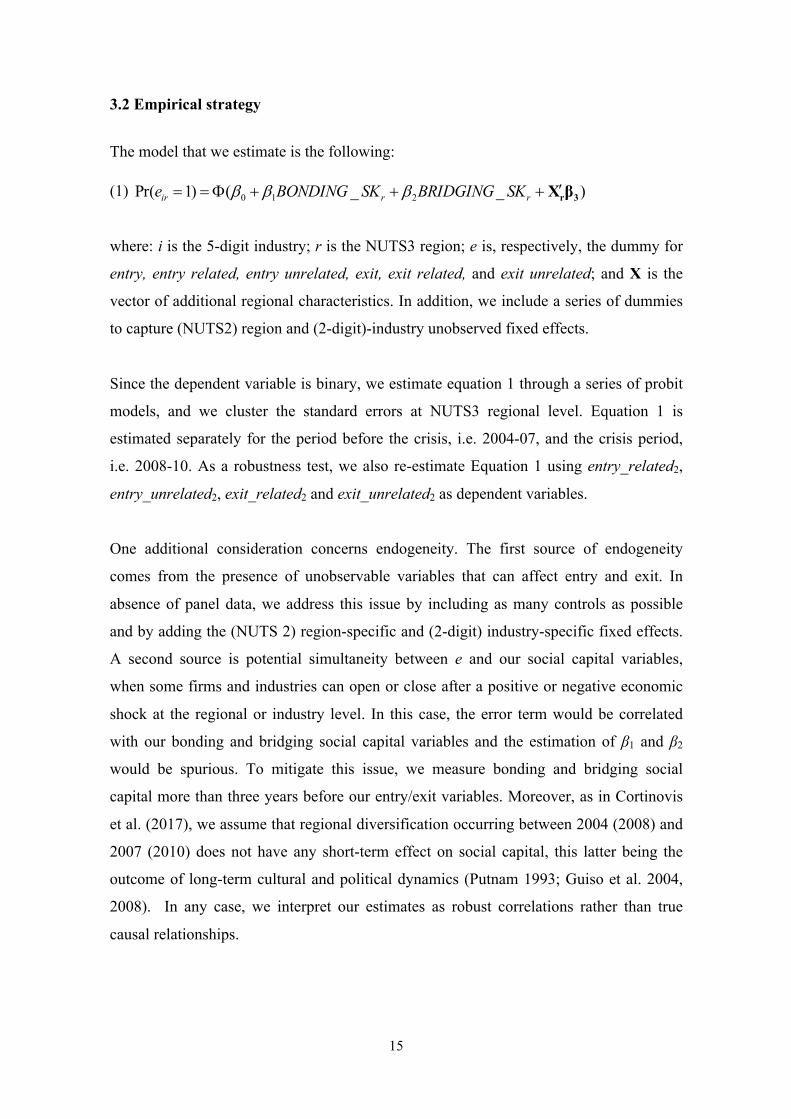
3.2 Empirical strategy
The model that we estimate is the following:
(1) )__()1Pr( 210 3rβX¢+++F== rrir SKBRIDGINGSKBONDINGe bbb
where: i is the 5-digit industry; r is the NUTS3 region; e is, respectively, the dummy for
entry, entry related, entry unrelated, exit, exit related, and exit unrelated; and X is the
vector of additional regional characteristics. In addition, we include a series of dummies
to capture (NUTS2) region and (2-digit)-industry unobserved fixed effects.
Since the dependent variable is binary, we estimate equation 1 through a series of probit
models, and we cluster the standard errors at NUTS3 regional level. Equation 1 is
estimated separately for the period before the crisis, i.e. 2004-07, and the crisis period,
i.e. 2008-10. As a robustness test, we also re-estimate Equation 1 using entry_related2,
entry_unrelated2, exit_related2 and exit_unrelated2 as dependent variables.
One additional consideration concerns endogeneity. The first source of endogeneity
comes from the presence of unobservable variables that can affect entry and exit. In
absence of panel data, we address this issue by including as many controls as possible
and by adding the (NUTS 2) region-specific and (2-digit) industry-specific fixed effects.
A second source is potential simultaneity between e and our social capital variables,
when some firms and industries can open or close after a positive or negative economic
shock at the regional or industry level. In this case, the error term would be correlated
with our bonding and bridging social capital variables and the estimation of β1 and β2
would be spurious. To mitigate this issue, we measure bonding and bridging social
capital more than three years before our entry/exit variables. Moreover, as in Cortinovis
et al. (2017), we assume that regional diversification occurring between 2004 (2008) and
2007 (2010) does not have any short-term effect on social capital, this latter being the
outcome of long-term cultural and political dynamics (Putnam 1993; Guiso et al. 2004,
2008). In any case, we interpret our estimates as robust correlations rather than true
causal relationships.
16
4. Results
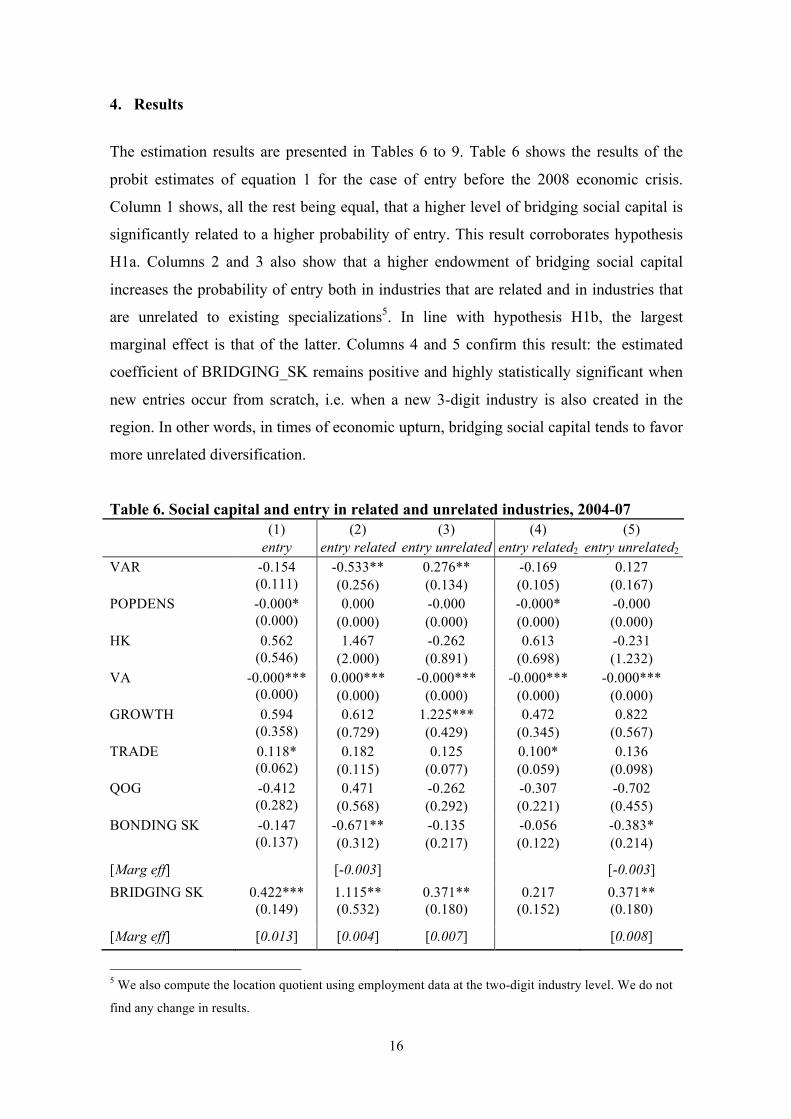
The estimation results are presented in Tables 6 to 9. Table 6 shows the results of the
probit estimates of equation 1 for the case of entry before the 2008 economic crisis.
Column 1 shows, all the rest being equal, that a higher level of bridging social capital is
significantly related to a higher probability of entry. This result corroborates hypothesis
H1a. Columns 2 and 3 also show that a higher endowment of bridging social capital
increases the probability of entry both in industries that are related and in industries that
are unrelated to existing specializations5. In line with hypothesis H1b, the largest
marginal effect is that of the latter. Columns 4 and 5 confirm this result: the estimated
coefficient of BRIDGING_SK remains positive and highly statistically significant when
new entries occur from scratch, i.e. when a new 3-digit industry is also created in the
region. In other words, in times of economic upturn, bridging social capital tends to favor
more unrelated diversification.
Table 6. Social capital and entry in related and unrelated industries, 2004-07 (1)
entry (2)
entry related (3)
entry unrelated (4)
entry related2 (5)
entry unrelated2
VAR -0.154 (0.111)
-0.533** (0.256)
0.276** (0.134)
-0.169 (0.105)
0.127 (0.167)
POPDENS -0.000* (0.000)
0.000 (0.000)
-0.000 (0.000)
-0.000* (0.000)
-0.000 (0.000)
HK 0.562 (0.546)
1.467 (2.000)
-0.262 (0.891)
0.613 (0.698)
-0.231 (1.232)
VA -0.000*** (0.000)
0.000*** (0.000)
-0.000*** (0.000)
-0.000*** (0.000)
-0.000*** (0.000)
GROWTH 0.594 (0.358)
0.612 (0.729)
1.225*** (0.429)
0.472 (0.345)
0.822 (0.567)
TRADE 0.118* (0.062)
0.182 (0.115)
0.125 (0.077)
0.100* (0.059)
0.136 (0.098)
QOG -0.412 (0.282)
0.471 (0.568)
-0.262 (0.292)
-0.307 (0.221)
-0.702 (0.455)
BONDING SK -0.147 (0.137)
-0.671** (0.312)
-0.135 (0.217)
-0.056 (0.122)
-0.383* (0.214)
[Marg eff] [-0.003] [-0.003] BRIDGING SK 0.422***
(0.149) 1.115** (0.532)
0.371** (0.180)
0.217 (0.152)
0.371** (0.180)
[Marg eff] [0.013] [0.004] [0.007] [0.008]
5 We also compute the location quotient using employment data at the two-digit industry level. We do not
find any change in results.
17
Regional dummies Yes Yes Yes Yes Yes Industry dummies Yes Yes Yes Yes Yes N 63,449 63,449 63,449 63,449 63,449
Pseudo R2 0.333 0.190 0.353 0.232 0.512
Mean VIF 4.39 2.96 4.14 4.37 4.73 Notes: all the estimates include a constant term. *** Significant at 1% level; ** significant at 5% level; * significant at 10% level. Standard errors are clustered at NUTS3 region level. Other covariates are omitted for reasons of space.
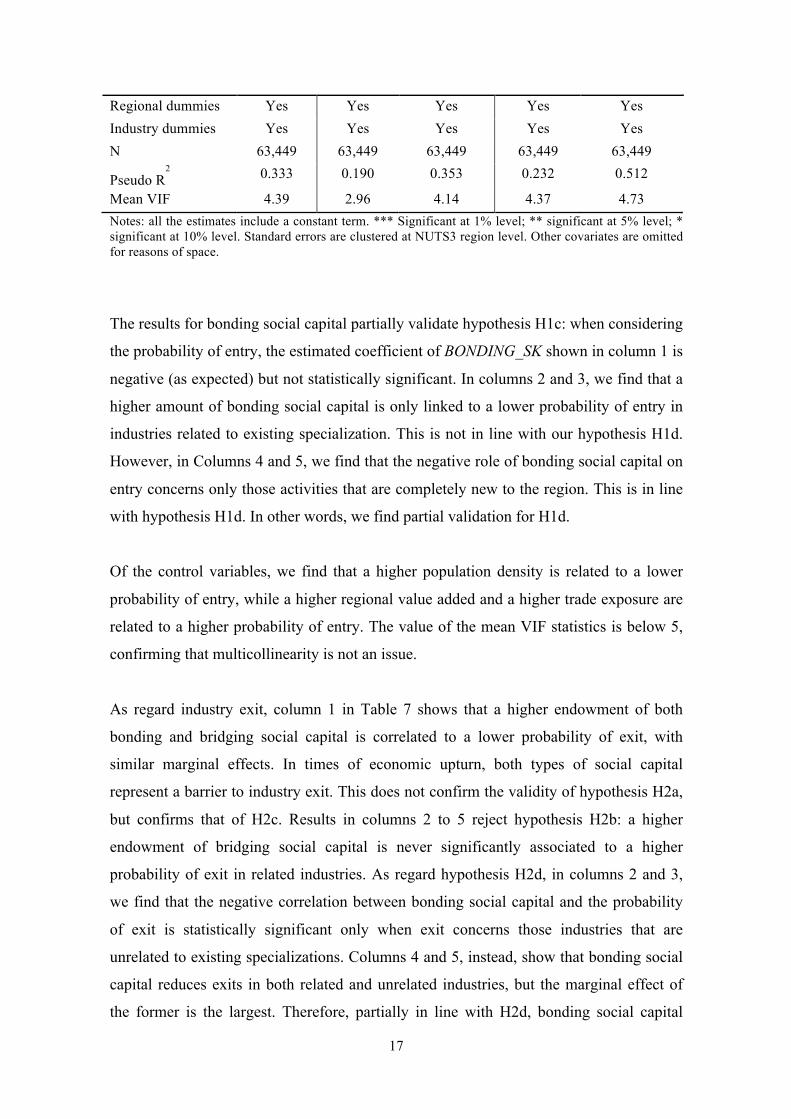
The results for bonding social capital partially validate hypothesis H1c: when considering
the probability of entry, the estimated coefficient of BONDING_SK shown in column 1 is
negative (as expected) but not statistically significant. In columns 2 and 3, we find that a
higher amount of bonding social capital is only linked to a lower probability of entry in
industries related to existing specialization. This is not in line with our hypothesis H1d.
However, in Columns 4 and 5, we find that the negative role of bonding social capital on
entry concerns only those activities that are completely new to the region. This is in line
with hypothesis H1d. In other words, we find partial validation for H1d.
Of the control variables, we find that a higher population density is related to a lower
probability of entry, while a higher regional value added and a higher trade exposure are
related to a higher probability of entry. The value of the mean VIF statistics is below 5,
confirming that multicollinearity is not an issue.
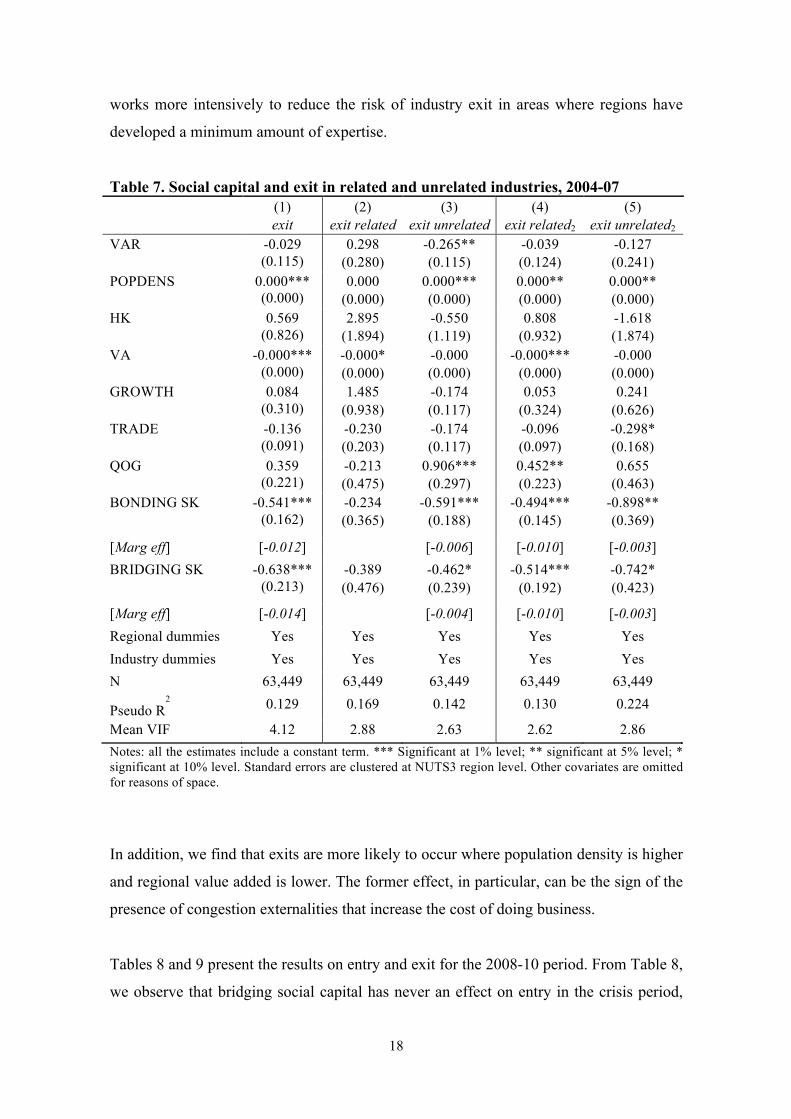
As regard industry exit, column 1 in Table 7 shows that a higher endowment of both
bonding and bridging social capital is correlated to a lower probability of exit, with
similar marginal effects. In times of economic upturn, both types of social capital
represent a barrier to industry exit. This does not confirm the validity of hypothesis H2a,
but confirms that of H2c. Results in columns 2 to 5 reject hypothesis H2b: a higher
endowment of bridging social capital is never significantly associated to a higher
probability of exit in related industries. As regard hypothesis H2d, in columns 2 and 3,
we find that the negative correlation between bonding social capital and the probability
of exit is statistically significant only when exit concerns those industries that are
unrelated to existing specializations. Columns 4 and 5, instead, show that bonding social
capital reduces exits in both related and unrelated industries, but the marginal effect of
the former is the largest. Therefore, partially in line with H2d, bonding social capital
18
works more intensively to reduce the risk of industry exit in areas where regions have
developed a minimum amount of expertise.
Table 7. Social capital and exit in related and unrelated industries, 2004-07 (1)
exit (2)
exit related (3)
exit unrelated (4)
exit related2 (5)
exit unrelated2
VAR -0.029 (0.115)
0.298 (0.280)
-0.265** (0.115)
-0.039 (0.124)
-0.127 (0.241)
POPDENS 0.000*** (0.000)
0.000 (0.000)
0.000*** (0.000)
0.000** (0.000)
0.000** (0.000)
HK 0.569 (0.826)
2.895 (1.894)
-0.550 (1.119)
0.808 (0.932)
-1.618 (1.874)
VA -0.000*** (0.000)
-0.000* (0.000)
-0.000 (0.000)
-0.000*** (0.000)
-0.000 (0.000)
GROWTH 0.084 (0.310)
1.485 (0.938)
-0.174 (0.117)
0.053 (0.324)
0.241 (0.626)
TRADE -0.136 (0.091)
-0.230 (0.203)
-0.174 (0.117)
-0.096 (0.097)
-0.298* (0.168)
QOG 0.359 (0.221)
-0.213 (0.475)
0.906*** (0.297)
0.452** (0.223)
0.655 (0.463)
BONDING SK -0.541*** (0.162)
-0.234 (0.365)
-0.591*** (0.188)
-0.494*** (0.145)
-0.898** (0.369)
[Marg eff] [-0.012] [-0.006] [-0.010] [-0.003] BRIDGING SK -0.638***
(0.213) -0.389 (0.476)
-0.462* (0.239)
-0.514*** (0.192)
-0.742* (0.423)
[Marg eff] [-0.014] [-0.004] [-0.010] [-0.003] Regional dummies Yes Yes Yes Yes Yes Industry dummies Yes Yes Yes Yes Yes N 63,449 63,449 63,449 63,449 63,449
Pseudo R2 0.129 0.169 0.142 0.130 0.224
Mean VIF 4.12 2.88 2.63 2.62 2.86 Notes: all the estimates include a constant term. *** Significant at 1% level; ** significant at 5% level; * significant at 10% level. Standard errors are clustered at NUTS3 region level. Other covariates are omitted for reasons of space.
In addition, we find that exits are more likely to occur where population density is higher
and regional value added is lower. The former effect, in particular, can be the sign of the
presence of congestion externalities that increase the cost of doing business.
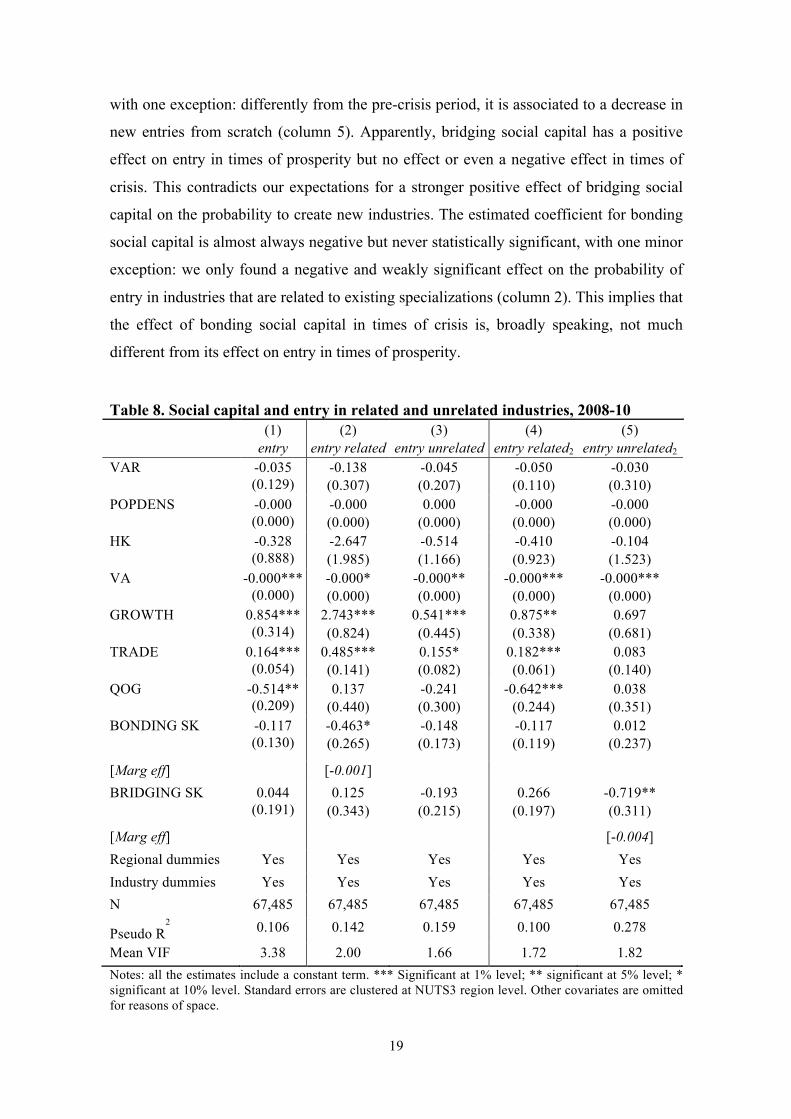
Tables 8 and 9 present the results on entry and exit for the 2008-10 period. From Table 8,
we observe that bridging social capital has never an effect on entry in the crisis period,
19
with one exception: differently from the pre-crisis period, it is associated to a decrease in
new entries from scratch (column 5). Apparently, bridging social capital has a positive
effect on entry in times of prosperity but no effect or even a negative effect in times of
crisis. This contradicts our expectations for a stronger positive effect of bridging social
capital on the probability to create new industries. The estimated coefficient for bonding
social capital is almost always negative but never statistically significant, with one minor
exception: we only found a negative and weakly significant effect on the probability of
entry in industries that are related to existing specializations (column 2). This implies that
the effect of bonding social capital in times of crisis is, broadly speaking, not much
different from its effect on entry in times of prosperity.
Table 8. Social capital and entry in related and unrelated industries, 2008-10 (1)
entry (2)
entry related (3)
entry unrelated (4)
entry related2 (5)
entry unrelated2
VAR -0.035 (0.129)
-0.138 (0.307)
-0.045 (0.207)
-0.050 (0.110)
-0.030 (0.310)
POPDENS -0.000 (0.000)
-0.000 (0.000)
0.000 (0.000)
-0.000 (0.000)
-0.000 (0.000)
HK -0.328 (0.888)
-2.647 (1.985)
-0.514 (1.166)
-0.410 (0.923)
-0.104 (1.523)
VA -0.000*** (0.000)
-0.000* (0.000)
-0.000** (0.000)
-0.000*** (0.000)
-0.000*** (0.000)
GROWTH 0.854*** (0.314)
2.743*** (0.824)
0.541*** (0.445)
0.875** (0.338)
0.697 (0.681)
TRADE 0.164*** (0.054)
0.485*** (0.141)
0.155* (0.082)
0.182*** (0.061)
0.083 (0.140)
QOG -0.514** (0.209)
0.137 (0.440)
-0.241 (0.300)
-0.642*** (0.244)
0.038 (0.351)
BONDING SK -0.117 (0.130)
-0.463* (0.265)
-0.148 (0.173)
-0.117 (0.119)
0.012 (0.237)
[Marg eff] [-0.001] BRIDGING SK 0.044
(0.191) 0.125
(0.343) -0.193 (0.215)
0.266 (0.197)
-0.719** (0.311)
[Marg eff] [-0.004] Regional dummies Yes Yes Yes Yes Yes Industry dummies Yes Yes Yes Yes Yes N 67,485 67,485 67,485 67,485 67,485
Pseudo R2 0.106 0.142 0.159 0.100 0.278
Mean VIF 3.38 2.00 1.66 1.72 1.82 Notes: all the estimates include a constant term. *** Significant at 1% level; ** significant at 5% level; * significant at 10% level. Standard errors are clustered at NUTS3 region level. Other covariates are omitted for reasons of space.
20
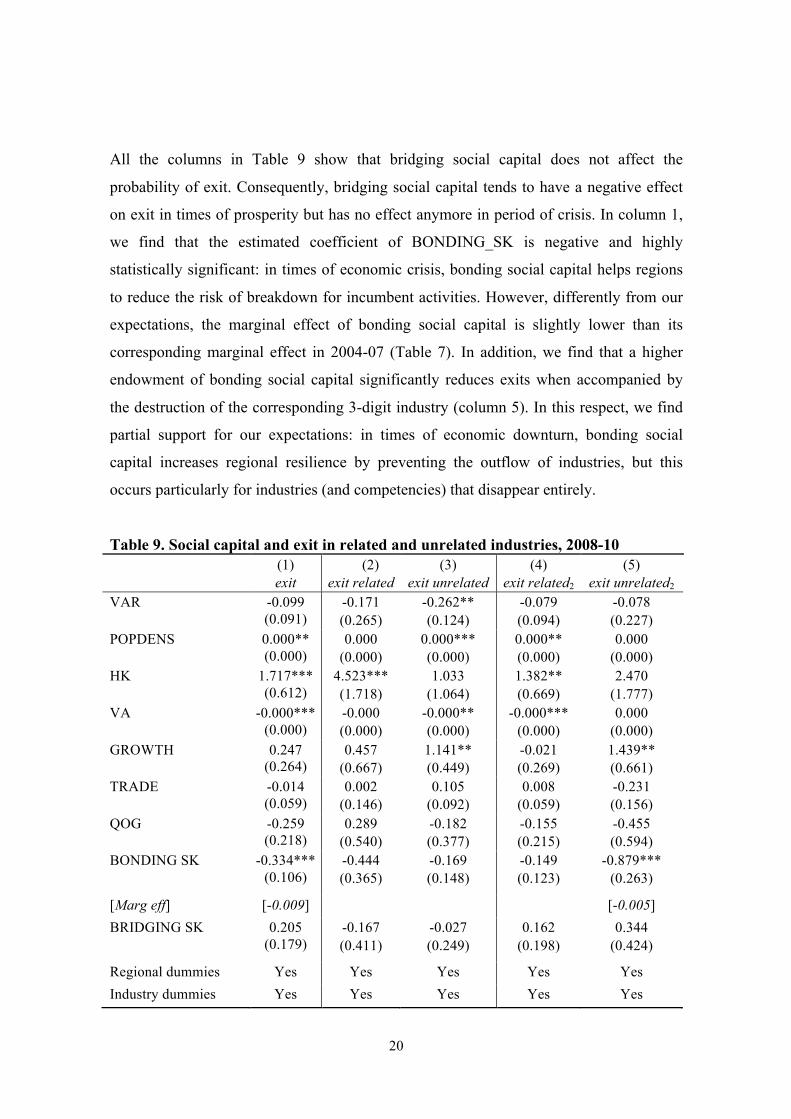
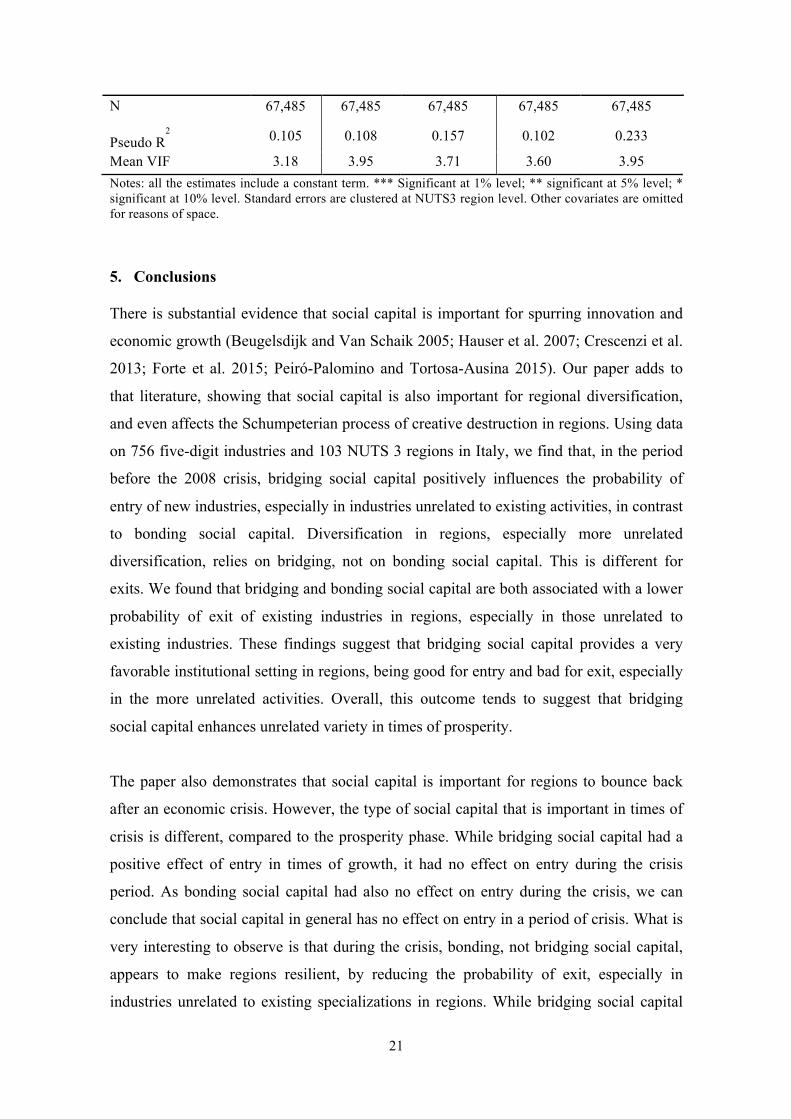
All the columns in Table 9 show that bridging social capital does not affect the
probability of exit. Consequently, bridging social capital tends to have a negative effect
on exit in times of prosperity but has no effect anymore in period of crisis. In column 1,
we find that the estimated coefficient of BONDING_SK is negative and highly
statistically significant: in times of economic crisis, bonding social capital helps regions
to reduce the risk of breakdown for incumbent activities. However, differently from our
expectations, the marginal effect of bonding social capital is slightly lower than its
corresponding marginal effect in 2004-07 (Table 7). In addition, we find that a higher
endowment of bonding social capital significantly reduces exits when accompanied by
the destruction of the corresponding 3-digit industry (column 5). In this respect, we find
partial support for our expectations: in times of economic downturn, bonding social
capital increases regional resilience by preventing the outflow of industries, but this
occurs particularly for industries (and competencies) that disappear entirely.
Table 9. Social capital and exit in related and unrelated industries, 2008-10 (1)
exit (2) exit related
(3) exit unrelated
(4) exit related2
(5) exit unrelated2
VAR -0.099 (0.091)
-0.171 (0.265)
-0.262** (0.124)
-0.079 (0.094)
-0.078 (0.227)
POPDENS 0.000** (0.000)
0.000 (0.000)
0.000*** (0.000)
0.000** (0.000)
0.000 (0.000)
HK 1.717*** (0.612)
4.523*** (1.718)
1.033 (1.064)
1.382** (0.669)
2.470 (1.777)
VA -0.000*** (0.000)
-0.000 (0.000)
-0.000** (0.000)
-0.000*** (0.000)
0.000 (0.000)
GROWTH 0.247 (0.264)
0.457 (0.667)
1.141** (0.449)
-0.021 (0.269)
1.439** (0.661)
TRADE -0.014 (0.059)
0.002 (0.146)
0.105 (0.092)
0.008 (0.059)
-0.231 (0.156)
QOG -0.259 (0.218)
0.289 (0.540)
-0.182 (0.377)
-0.155 (0.215)
-0.455 (0.594)
BONDING SK -0.334*** (0.106)
-0.444 (0.365)
-0.169 (0.148)
-0.149 (0.123)
-0.879*** (0.263)
[Marg eff] [-0.009] [-0.005] BRIDGING SK 0.205
(0.179) -0.167 (0.411)
-0.027 (0.249)
0.162 (0.198)
0.344 (0.424)
Regional dummies Yes Yes Yes Yes Yes Industry dummies Yes Yes Yes Yes Yes
21
N 67,485 67,485 67,485 67,485 67,485
Pseudo R2 0.105 0.108 0.157 0.102 0.233
Mean VIF 3.18 3.95 3.71 3.60 3.95 Notes: all the estimates include a constant term. *** Significant at 1% level; ** significant at 5% level; * significant at 10% level. Standard errors are clustered at NUTS3 region level. Other covariates are omitted for reasons of space.
5. Conclusions There is substantial evidence that social capital is important for spurring innovation and
economic growth (Beugelsdijk and Van Schaik 2005; Hauser et al. 2007; Crescenzi et al.
2013; Forte et al. 2015; Peiró-Palomino and Tortosa-Ausina 2015). Our paper adds to
that literature, showing that social capital is also important for regional diversification,
and even affects the Schumpeterian process of creative destruction in regions. Using data
on 756 five-digit industries and 103 NUTS 3 regions in Italy, we find that, in the period
before the 2008 crisis, bridging social capital positively influences the probability of
entry of new industries, especially in industries unrelated to existing activities, in contrast
to bonding social capital. Diversification in regions, especially more unrelated
diversification, relies on bridging, not on bonding social capital. This is different for
exits. We found that bridging and bonding social capital are both associated with a lower
probability of exit of existing industries in regions, especially in those unrelated to
existing industries. These findings suggest that bridging social capital provides a very
favorable institutional setting in regions, being good for entry and bad for exit, especially
in the more unrelated activities. Overall, this outcome tends to suggest that bridging
social capital enhances unrelated variety in times of prosperity.
The paper also demonstrates that social capital is important for regions to bounce back
after an economic crisis. However, the type of social capital that is important in times of
crisis is different, compared to the prosperity phase. While bridging social capital had a
positive effect of entry in times of growth, it had no effect on entry during the crisis
period. As bonding social capital had also no effect on entry during the crisis, we can
conclude that social capital in general has no effect on entry in a period of crisis. What is
very interesting to observe is that during the crisis, bonding, not bridging social capital,
appears to make regions resilient, by reducing the probability of exit, especially in
industries unrelated to existing specializations in regions. While bridging social capital
22
still had a negative effect on exit in times of prosperity, it shows no effect anymore on
exit during the crisis period. While not being bad either, our findings suggest that
bridging social capital loses its supportive role during the crisis period.
As any other paper, this paper is not free from limitations. First, to measure the effects of
the 2008 shock, we could cover only a short period 2008-2010, as comparable data were
not available after 2010. When possible, future research on resilience should therefore
take a longer time horizon, as the entry of new specializations may take time to develop.
This could be a plausible explanation for why we did not find an effect of social capital
on entry during the crisis. Second, there is a need to link more tightly this type of
research to qualitative case-study research that explores more in detail how bridging and
bonding social capital affect the entry and exit of specializations in specific regions. This
is most certainly true for the types of effects of social capital on regional innovation
during times of crisis, which is still relatively unexplored both in theoretical and
empirical terms. Third, we take a rather static approach to institutions. In that sense, our
paper is complementary to papers that look at the need for institution-building when new
industries develop (MacKinnon et al., 2009; Strambach and Klement 2012).
Our study also focuses on just one single country. This allows for the usage of fine-
grained data (5 digit industries) at a detailed regional level (NUTS-3), while most social
capital papers, if regional, are conducted at the NUTS-2 level, which is not a functional
economic unit. Italy as a country also represents a unique laboratory for testing the role
of social capital on diversification and resilience of regions, because of the high
heterogeneity in the distribution of social capital across its regions. Still, the question
remains whether our results will hold in other countries. And finally, there is need to
work out how our findings on social capital may assist policy makers working on smart
specialization policy in the EU (Morgan 2017), and resilience policy more in general
(Bailey and MacNeill 2008; OECD 2009; Wolfe 2010).
References Acemoglu, D.K. and Robinson, J.A. (2012) Why nations fail: the origins of power, prosperity and poverty, Random House: New York.
23
Akçomak, S. and Ter Weel, B. (2009) Social capital, innovation and growth: evidence from Europe. European Economic Review 53, 544-567. Antonietti, R., Ferrante, M.R. and Leoncini, R. (2016) Local market size, social capital and outsourcing: evidence from Emilia Romagna. Small Business Economics 47 (1), 243-260. Bailey, D. and S. MacNeill (2008) The Rover Task Force: A case study in proactive and reactive policy intervention, Regional Science Policy and Practices 1 (1), 109-142. Banfield, E. (1958) The Moral Basis of a Backward Society. The Free Press, Chicago. Beugelsdijk, S., and van Schaik, T. (2005) Social capital and growth in European regions: an empirical test. European Journal of Political Economy 21, 301-324. Beugelsdijk, S. and Smulders, S. (2009) Bonding and bridging social capital and economic growth, CentER Working Paper n. 2009-27, Tilburg University. Boschma, R., P.A. Balland and D.F. Kogler (2015), Relatedness and technological change in cities: The rise and fall of technological knowledge in U.S. metropolitan areas from 1981 to 2010, Industrial and Corporate Change 24 (1), 223-250.
Boschma, R., Minondo, A. and Navarro, M. (2013) The Emergence of new industries at the regional level in Spain:A proximity approach based on product relatedness. Economic Geography 89, (1), 29–51. Boschma, R. (2015) Towards an evolutionary perspective on regional resilience. Regional Studies 49, (5), 733-751. Boschma, R. (2017) Relatedness as driver behind regional diversification: a research agenda, Regional Studies, doi:10.1080/00343404.2016.1254767 Boschma, R. and Capone, F. (2015) Institutions and diversification: related versus unrelated diversification in a varieties of capitalism framework. Research Policy 44, (10), 1902-1914. Burker, M. and Minerva, G.A. (2014) Civic capital and the size distribution of plants: short-run dynamics and long-run Equilibrium. Journal of Economic Geography 14, 797-847. Camagni, R. and R. Capello (2013) Regional competitiveness and territorial capital: A conceptual approach and empirical evidence from the European Union, Regional Studies 47 (9), 1383-1402 Cartocci, R. (2007) Mappe del Tesoro. Atlante del Capitale Sociale in Italia. Il Mulino, Bologna. Charron, N., Dijkstra, L. and Lapuente, V. (2014). Regional governance matters: Quality of government within European Union member states. Regional Studies 48, (1), 68-90.
24
Christopherson, S.J. Michie and P. Tyler (2010) Regional resilience: theoretical and empirical perspectives, Cambridge Journal of Regions, Economy and Society 3, 3–10. Cooke, P. and K. Morgan (1998) The associational economy. Firms, regions and innovation, Oxford: Oxford University Press. Cortinovis, N., J. Xiao, R. Boschma and F. van Oort (2017) Quality of government and social capital as drivers of regional diversification in Europe, Journal of Economic Geography 17 (6), 1179–1208. Crescenzi, R., Gagliardi, L. and Percoco, M. (2013a), Social Capital and the Innovative Performance of Italian Provinces, Environment and Planning A, 45, 908-929. Crescenzi, R., Gagliardi, L. and Percoco, M. (2013b), The ‘bright side’ of social capital: how ‘bridging’ makes Italian provinces more innovative, in Crescenzi, R. and Percoco, M. (Eds), Geography, institutions and regional economic performance, Berling Heidelberg, Springer-Verlag, pp. 143-164. Dawley S. (2014) Creating new paths? Offshore wind, policy activism, and peripheral region development. Economic Geography 90 (1), 91-112.
Donoso, V., Martin, V., and Minondo, A. (2015). Do differences in the exposure to Chinese imports lead to differences in labour market outcomes? An analysis for Spanish provinces, Regional Studies, 49(10), 1746-1764.
Ebner, A. (2016) Editorial: Exploring regional varieties of capitalism, Regional Studies 50 (1), 3-6.
Echebarria, C. and Barrutia, J.M. (2010) Social capital, research and development, and innovation: An empirical analysis of Spanish and Italian regions, European Urban and Regional Studies 17 (4), 371-385.
Echebarria, C. and Barrutia, J.M. (2013) Limits of social capital as a driver of innovation: An empirical analysis in the context of European regions, Regional Studies 47 (7), 1001-1017.
Essleztbichler, J. (2015) Relatedness, industrial branching and technological cohesion in US metropolitan areas, Regional Studies 49 (5), 752–766.
Felice, E. (2012) Regional convergence in Italy, 1891-2001: testing human and social capital, Cliometrica 6 (3), 267-306.
Filipetti, A. and D. Archibugi (2011) Innovation in times of crisis: National Systems of Innovation, structure, and demand, Research Policy 40, 179-192.
Forte, A., J. Peiró Palomino and E. Tortosa-Ausina (2015) Does social capital matter for European regional growth? European Economic Review 77, 47-64.
Frenken, K., van Oort, F.G. and Verburg, T. (2007) Related Variety, Unrelated Variety and Regional Economic Growth, Regional Studies 41, 685-697.
25
Gertler, M. (2010) Rules of the game: The place of institutions in regional economic change. Regional Studies 44 (1), 1–15.
Gittel, R.J. and Vidal, A. (1998) Community Organizing: Building Social Capitl as a Development Strategy, Sage Publications, Thousands Oaks, CA. Grabher, G. (1993) The weakness of strong ties: the lock-in of regional development in the Ruhr area. Grabher, G. (ed) The Embedded Firm, London: Routledge, 255–277. Granovetter, M.S. (1973) The strength of weak ties, American Journal of Sociology 78, 1360-1380. Guiso L., Sapienza P. and Zingales L. (2004) The Role of Social Capital in Financial Development. American Economic Review 94 (3), 526-556. Guiso, L., Sapienza, P., and Zingales, L. (2008) Long-term persistence, NBER Working paper 14278. Guo, Q. and C. He (2017) Production space and regional industrial evolution in China, Geojournal 82 (2), 379-396. Hauser, C., Tappeiner G. and Walde, J. (2007) The learning region: the impact of social capital and weak ties on innovation, Regional Studies 41, 75-88. He, C., Y. Yan and D. Rigby (2016) Regional industrial evolution in China, Papers in Regional Science, forthcoming, doi:10.1111/pirs.12246. Hidalgo, C. (2015) Why information grows. The evolution of order, from atoms to economies, UK: Allen Lane. Hidalgo, C.A., Klinger, B., Barabasi, A.L. and Hausmann, R. (2007) The product space and its consequences for economic growth, Science 317, 482–487. Kaufmann, D., Kraay, A., & Mastruzzi, M. (2011) The Worldwide Governance Indicators: Methodology and Analytical Issues. Hague Journal on the Rule of Law 3 (2), 220–246. Kemeny, T., and Cooke, A. (2017) Urban immigrant diversity and inclusive institutions. Economic Geography, DOI: 10.1080/00130095.2017.1300056. Kleinknecht, A. (1987) Innovation patterns in crisis and prosperity: Schumpeter’s long cycle reconsidered, Basingstoke, Hampshire: MacMillan. Knack, S., and Keefer, P. (1997) Does social capital have an economic pay-off? A cross country investigation. Quarterly Journal of Economics 112, 1251-1288. Kogler, D.F., Rigby, D.L. and Tucker, I. (2013) Mapping Knowledge Space and Technological Relatedness in US Cities, European Planning Studies 21(9), 1374-1391.
26
Liang, J. (2017) Trade shocks, new industry entry and industry relatedness, Regional Studies 51 (12), 1749-1760. Levitte, Y. M. (2004) Bonding Social Capital in Entrepreneurial Developing Communities – Survival Networks Barriers? Journal of Community Development Society 35 (1), 44-64. MacKinnon, D., A. Cumbers, A. Pyke, K. Birch and R. McMaster (2009) Evolution in economic geography. Institutions, political economy and adaptation, Economic Geography, 85(2): 129-150. Malecki, E. (2012) Regional social capital: why it matters, Regional Studies 46 (8), 1023-1039. Martin, R. (2012) Regional economic resilience, hysteresis and recessionary shocks, Journal of Economic Geography 12, 1–32. Martin, R. and Sunley, P. (2015) On the notion of regional economic resilience: conceptualization and explanation, Journal of Economic Geography 15, 1-42. Morgan, K.J. (2017) Nurturing novelty: regional innovation policy in the age of smart specialisation. Environment and Planning C, 35 (4), 569-583. Neffke, F., Henning, M., and Boschma, R. (2011a) How Do Regions Diversify over Time? Industry Relatedness and the Development of New Growth Paths in Regions. Economic Geography 87, (3), 237–265.
Neffke, F., Henning, M., Boschma, R.A., Lundquist K.J. and Olander, L.O. (2011b) The dynamics of agglomeration externalities along the life cycle of industries. Regional Studies 45 (1), 49-65.
Neffke, F., Otto, A. and Hidalgo, C. (2016) The mobility of displaced workers: how the local industry mix affects job search strategies, Papers in Evolutionary Economic Geography, Working Paper n. 2016-03, Utrecht University.
Nifo, A., and Vecchione, G. (2014) Do Institutions play a role in skilled migration? The case of Italy. Regional Studies 48 (10), 1628–1649.
Nifo, A., and Vecchione, G. (2015) Measuring institutional quality in Italy. Rivista Economica del Mezzogiorno 1–2, 157–182.
North, D.C. (1990) Institutions, Institutional Change and Economic Performance, Cambridge University Press, Cambridge. O’Donoghue, D. and Gleave, B. (2004) A Note on methods for measuring industrial agglomeration. Regional Studies 38, (4), 419-427. OECD (2009) Policy responses to the economic crisis: investing in innovation for long-term growth. Paris: OECD. Olson, M. (1982) The rise and decline of nations. Economic growth, stagflation and social rigidities, New Haven: Yale University Press.
27
Pan, F. and C. He (2010) Regional difference in social capital and its impact on regional economic growth in China, Chinese Geographical Science, 20 (5), 442-449. Peiró-Palomino, J. and E. Tortosa-Ausina (2015) Social capital, investment and economic growth: some evidence for Spanish provinces, Spatial Economic Analysis 10 (1), 102-126. Pike, A., Dawley, S. and Tomaney, J. (2010) Resilience, adaptation and adaptability. Cambridge Journal of Regions, Economy and Society 3: 59–70 Portes, A. and Landolt, P. (1996) The downside of social capital. The American Prospect 26: 18 – 22. Putnam, R.D. (1993) Making Democracy Work: Civic Traditions in Modern Italy, Princeton University Press, Princeton. Putnam, R.D. (2000) Bowling Alone. The Collapse and Revival of American Community, Touchstone Books, New York. Rigby, D. (2015) Technological relatedness and knowledge space. Entry and exit of US cities from patent classes, Regional Studies 49 (11), 1922-1937. Rodriguez-Pose A. (2013), Do institutions matter for regional development? Regional Studies 47, 1034-1047. Rodriguez-Pose, A. and Di Cataldo, M. (2015) Quality of government and innovative performance in the regions of Europe, Journal of Economic Geography 15, 673-706. Sabatini F (2008) Social capital and the quality of economic development, Kyklos 61(3), 466–499. Sabatini, F. (2009) Social capital as social networks: A new framework for measurement and an empirical analysis of its determinants and consequences. Journal of Socio-Economics 38 (3), 429-433. Saxenian, A. (1994) Regional advantage. Culture and competition in Silicon Valley and Route 128, Cambridge (Mass.): Harvard University Press. Simmie, J. and R. Martin (2010) The economic resilience of regions: towards an evolutionary approach, Cambridge Journal of Regions, Economy and Society 3, 27–43. Storper M. (1995) The resurgence of regional economies, ten years later: The region as a nexus of untraded interdependencies, European Urban and Regional Studies 2, 191-221.
Strambach, S. and B. Klement (2012) Cumulative and combinatorial micro-dynamics of knowledge. The role of space and place in knowledge integration, European Planning Studies 20 (11), 1843-1866.
28
Tabellini, G. (2010) Culture and institutions: economic development in the regions of Europe. Journal of the European Economic Association 8(4), 677-716.
Tanner, A.N. (2014) Regional branching reconsidered: Emergence of the fuel cell industry in European regions, Economic Geography 90 (4), 403-427. Westlund, H. and Bolton, R. (2003) Local social capital and entrepreneurship. Small Business Economics 21, 77-113. Westlund, H. and Adam, F. (2010) Social capital and economic performance: a meta-analysis of 65 Studies, European Planning Studies 18, (6), 893-919. Wolfe, D.A. (2010) The strategic management of core cities: Path dependence and economic adjustment in resilient regions, Cambridge Journal of Regions, Economy and Society 3, 139–152. Xiao, J., Boschma, R. and Andersson, M. (2017) Resilience in the European Union: the effect of the 2008 crisis on the ability of regions in Europe to develop new industrial specializations, Industrial and Corporate Change, forthcoming, doi: 10.1093/icc/dtx023.
29
Appendix
Correlation matrix 1 2 3 4 5 6 7 8 9 [1] VAR 1 [2] POPDENS 0.03 1 [3] HK 0.42 0.07 1 [4] VA 0.29 -0.01 0.45 1 [5] GROWTH -0.30 0.02 -0.23 -0.03 1 [6] TRADE 0.48 0.03 0.18 0.16 -0.33 1 [7] QGI 0.57 0.12 0.39 0.18 -0.21 0.50 1 [8] BONDING SK 0.01 0.08 0.11 0.04 0.13 -0.03 0.19 1 [9] BRIDGING SK 0.33 0.27 0.20 -0.16 -0.20 0.33 0.72 0.04 1


