
Transforming Healthcare through Data-Driven Solutions
Pay for Performance Solutions
SM
SM
©2015 Mingle Analytics

Pause to check
Any problems hearing or seeing the presentation?Alert us through the webinar CHAT function
12/8/2015 ©2015 Mingle Analytics 2

Logistics
• Ask Questions Anytime
• Type your questions into the GoToWebinar dialog box
• Email questions to us after the Webinar
• We will distribute a link to the slides and a recording of the Webinar
12/8/2015 ©2015 Mingle Analytics 3

The PQRS Solutions Team
Dr. Dan Mingle, MD, MS• Family Physician and Educator
• Knows the business & practice of medicine
• Reporting PQRS since 2008
• Principle Architect for nine registries
• Feature in Healthcare Informatics magazine
12/8/2015 ©2015 Mingle Analytics 4
Nobody knows PQRS the way we do
Gay De Hart• Ten years in healthcare
• Practice Manager
• Business Writer – Grant Writer
• Working with Dr. Mingle since 2011
Kash Basavappa• Thirty years in healthcare and healthcare
informatics• Recipient of multiple awards as Chief
Information Officer• Directed development of commercial
healthcare information technology products• Working with Dr. Mingle since 2000
Scott Larsen• 27 years in Information Technology
• 6 years in healthcare informatics
• Web Applications, Software as a Service
• Security Infrastructures
• Building environments that scale
Assisted By• PQRS Consultants providing
• Client Support• Account Management• Project Management
• Data Analysts• Development Staff

Agenda
A. MIPS is Coming
B. 2016 PFS Final Rule Review:
• Section H: Physician Compare Website
• Section I: Physician Quality Reporting System
• Section J: Clinical Quality Measures
• Section M: Value-Based Payment ModifierPhysician Feedback Program
12/8/2015 ©2015 Mingle Analytics 5

PAY FOR PERFORMANCE SOLUTIONS
Details about PQRS, VBM, & MIPSPart I, Sept. 29: Value-Based Modifier & Quality TieringPart II, Oct. 6: Unlocking the Quality and Resource Use ReportPart III, October 13: What We Know About MIPS
Register and access recordings:http://pqrssolutions.com/webinars
Dr. Dan Mingle, CEO©2015 Mingle Analytics

The Merit-Based Incentive Payment System
MIPS
12/8/2015 ©2015 Mingle Analytics 7
It’s coming
2017
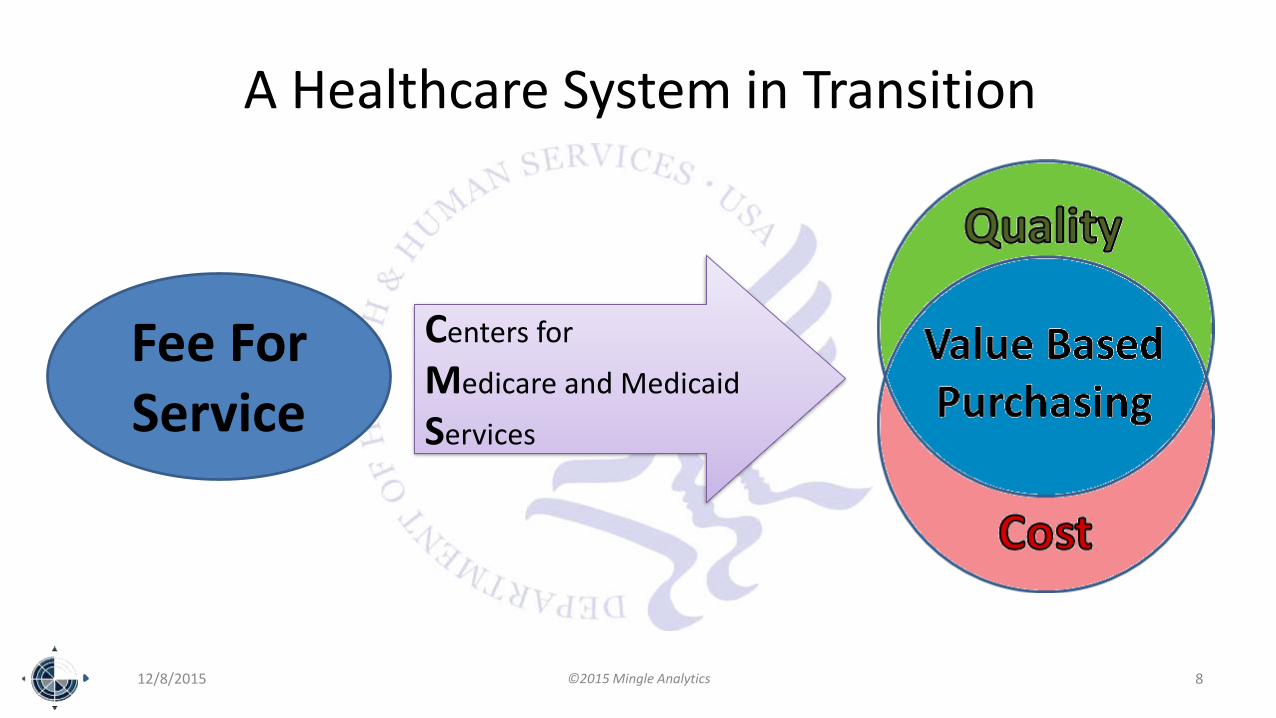
A Healthcare System in Transition
12/8/2015 ©2015 Mingle Analytics 8
Fee For Service
Centers for
Medicare and Medicaid
Services

Remix / Renaming
2016 (2018) is the Final Year in their current form:
– Physician Quality Reporting System (PQRS)
– Value Based Modifier (VBM)
– Quality Tiering
– Meaningful Use
Merit-Based Incentive Payment System (MIPS)– [(Quality Tiering + PQRS + VBM + EHR) + a – b] x N
• Competition on a 100 point scale
– 30 quality points
– 30 resource use points
– 25 meaningful use points
– 15 practice improvement points
• Increasing Adjustments
– ±4% 2017 (2019)
– ±9% 2020 (2022)
12/8/2015 ©2015 Mingle Analytics 9
SM
MIPSS O L U T I O N S
SM
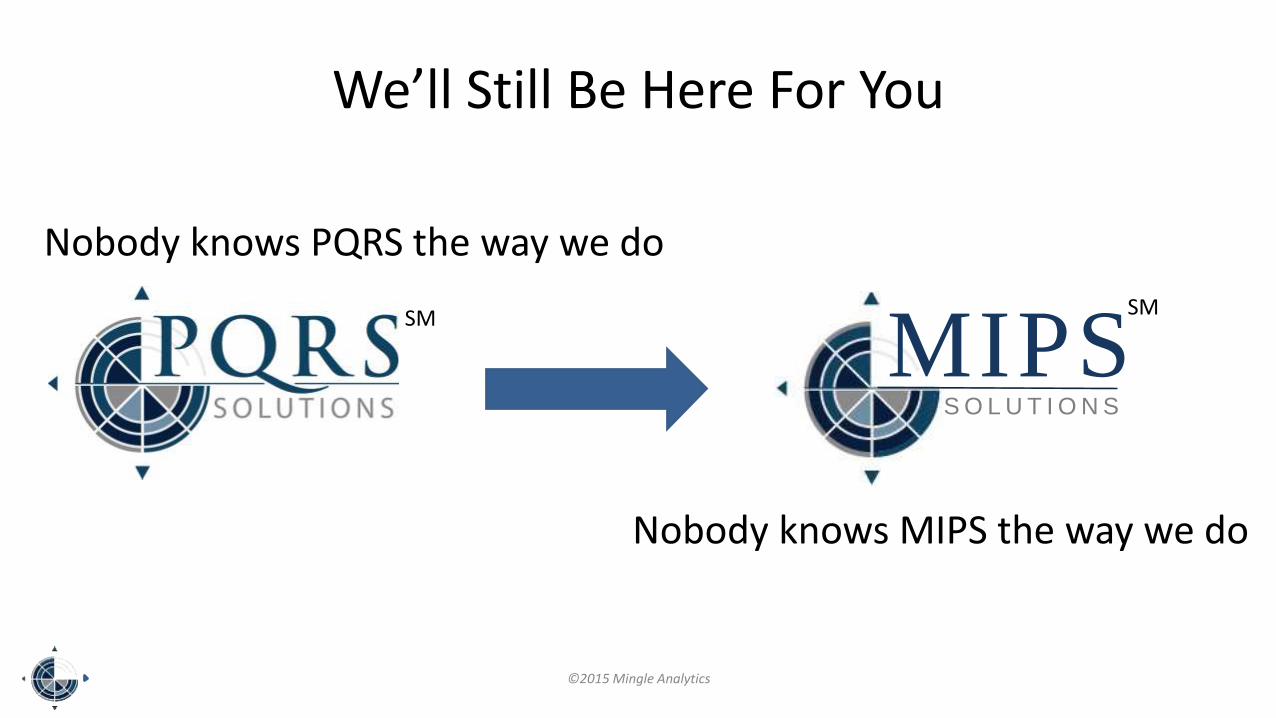
We’ll Still Be Here For You
Nobody knows MIPS the way we do
Nobody knows PQRS the way we do
©2015 Mingle Analytics

As Always
• Keep you informed of changes
• Your guide through confusing and contradictory rules
• Cost Effective Choices - for your unique circumstances
– The right measures
– The right mechanisms
– The right data collection processes
12/8/2015 ©2015 Mingle Analytics 11
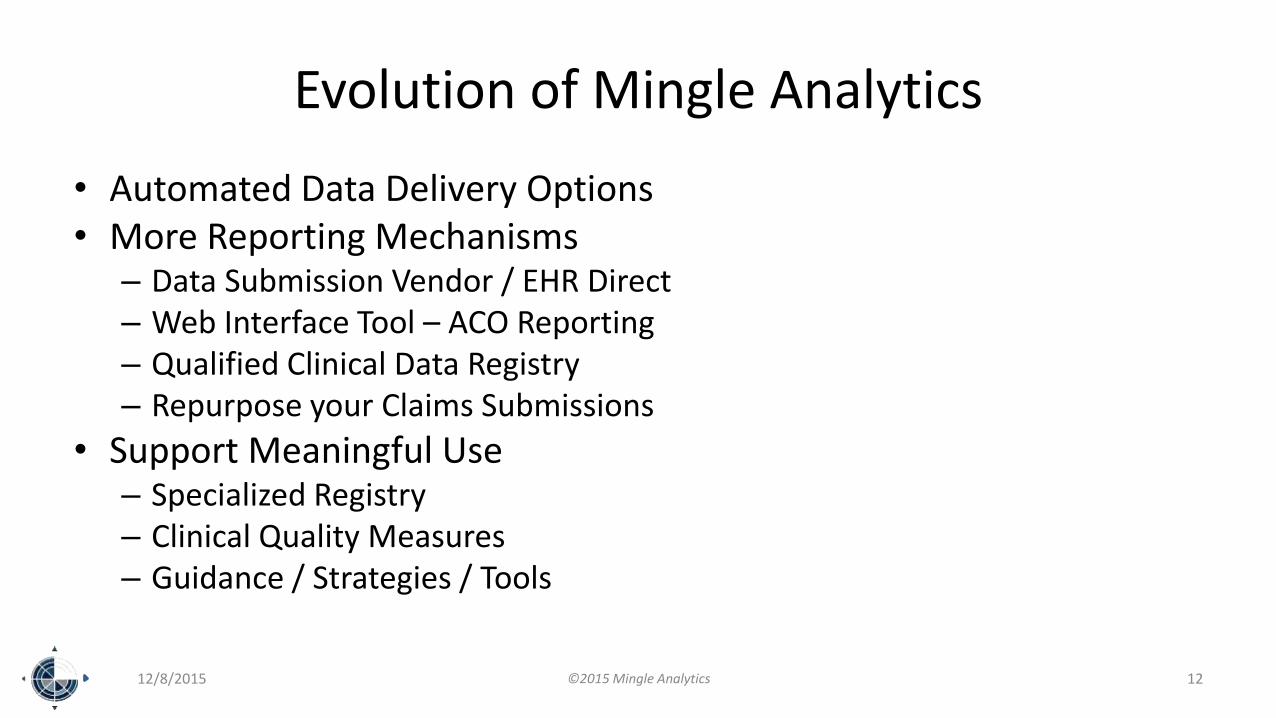
Evolution of Mingle Analytics
• Automated Data Delivery Options• More Reporting Mechanisms
– Data Submission Vendor / EHR Direct– Web Interface Tool – ACO Reporting– Qualified Clinical Data Registry– Repurpose your Claims Submissions
• Support Meaningful Use– Specialized Registry– Clinical Quality Measures– Guidance / Strategies / Tools
12/8/2015 ©2015 Mingle Analytics 12

HELP!Document and Report
Best Possible Performance
• MIPS Mastery Collaborative– Network with your peers– Develop Meaningful Measures through our QCDR– Includes our
• PQRS/MIPS Quality Reporting• Specialized Registry for MU
• MIPS Consulting Services– A-Z look at everything that feeds a performance score
• People• Processes• Technology
12/8/2015 ©2015 Mingle Analytics 13

Review of the 2016 Medicare PFS Final Rule
Revisions to Payment Policies under the Physician Fee Schedule and Other Revisions to Part B for CY 2016
CMS-1631-FCPublished in the Federal Register on 11/16/2015
Available online at http://federalregister.gov/a/2015-2800512/8/2015 ©2015 Mingle Analytics 14

Physician Compare
My Prediction:
Unchanged by MIPS
12/8/2015 ©2015 Mingle Analytics 15

Required by the Affordable Care Act – 2010
(CMS is) committed to providing data on Physician Compare that are useful to
beneficiaries in assisting them in making informed health care decisions, while being
accurate, valid, reliable, and complete…
12/8/2015 ©2015 Mingle Analytics 16

12/8/2015 ©2015 Mingle Analytics 17

• All Measures and All Mechanisms are Now Eligible for Publication• Measures Must Be
– Statistically comparable– Statistically valid and reliable– Understood by consumers– Beyond Year 1 of use
• 20 Patient Minimum Sample• Performance Benchmark Using Achievable Benchmark of Care (ABC™)
– Stratify by mechanism and Group/Individual
• Display a 5-Star Rating System• Practices Given 30-day Preview Period Before Publication
12/8/2015 ©2015 Mingle Analytics 18
Physician Compare Operating Principles

• Full Redesign in 2013– View information about approved Medicare professionals– Hospital affiliations that link to the hospital’s profile on Hospital Compare– Group practice names, specialties, practice locations, Medicare assignment status, and affiliated professionals
• By Late 2016 – Publication Eligible– All Measures– All Mechanisms– All Practice Sizes– Including CAHPS for PQRS– Including QCDR– Including ACO
• EHR and Registry Data Eligible But Not Yet Reported• 2018 PY Value Modifier Data (your 2016 service year data)
– WILL NOT BE PUBLISHED ON PHYSICIAN COMPARE– WILL BE in the Downloadable Database
12/8/2015 ©2015 Mingle Analytics 19
Physician Compare Progress

Physician Compare Resources
• Website URL: – http://www.medicare.gov/physiciancompare
• Data on Physician Compare comes from PECOS– https://pecos.cms.hhs.gov/pecos/login.do
• Specialty is as reported on your Medicare Enrollment Form• Physician Compare support team
• Physician Compare information and updates– http://www.cms.gov/Medicare/Quality-Initiatives-Patient-Assessment-
Instruments/physician-compare-initiative/
12/8/2015 ©2015 Mingle Analytics 20

12/8/2015 ©2015 Mingle Analytics 21
Pause for Questions about Physician Compare

PQRS
My Prediction:
Name Disappears but
Program Continues to evolve within MIPS
12/8/2015 ©2015 Mingle Analytics 22

Remember Medicare’s Naming Conventions
The Program Year is Named for the Adjustment Year
• The 2018 Program Year
• Refers to Your 2016 Year of Patient Service
• That You Report in 2017
• The Adjustment is Applied to Payments for 2018 Patient Services
• Watch Out For Labels Such as 2016PY, 2016CY
12/8/2015 ©2015 Mingle Analytics 23

12/8/2015 ©2015 Mingle Analytics 24
0.5%
-2%
-5.0%
-4.0%
-3.0%
-2.0%
-1.0%
0.0%
1.0%
2.0%
3.0%
2007 2008 2009 2010 2011 2012 2013 2014 2015 2016 2017 2018
Incentive Adjustment Earned Adjustment Applied Value Based Modifier Earned Value Based Modifier Applied
VBM Penalty
-4%
No More Incentive (except MOC)
Adjustment stable at 2% (PQRS) and 2%-4% (VBM)
Service Year
PQRS Penalty
Adjustmentwill be
Avoided
We Are
(almost)
Here
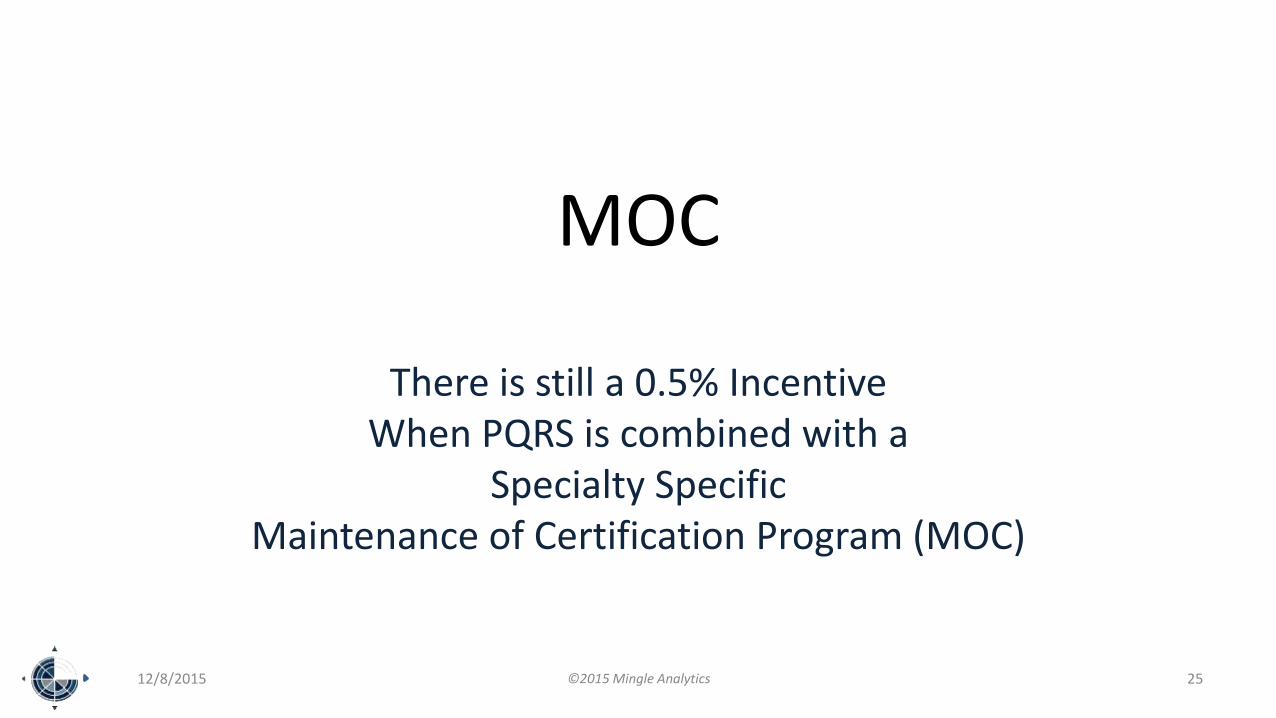
MOC
There is still a 0.5% IncentiveWhen PQRS is combined with a
Specialty Specific Maintenance of Certification Program (MOC)
12/8/2015 25©2015 Mingle Analytics
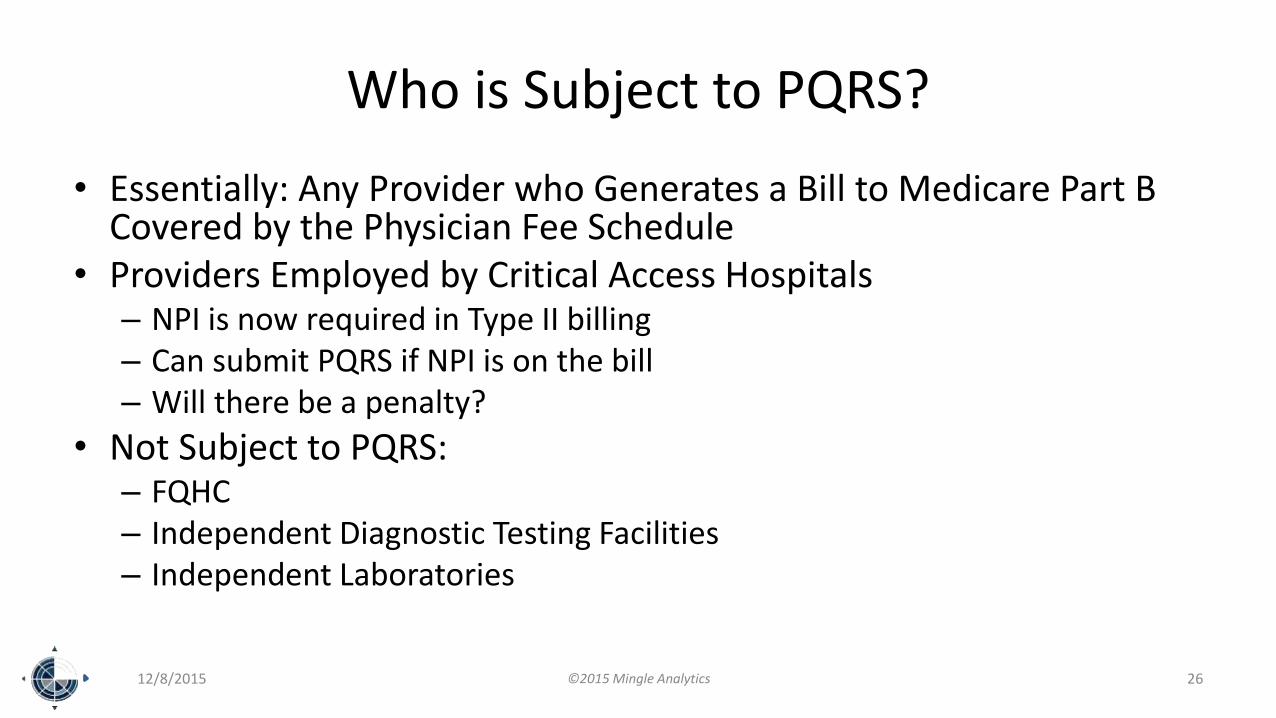
Who is Subject to PQRS?
• Essentially: Any Provider who Generates a Bill to Medicare Part B Covered by the Physician Fee Schedule
• Providers Employed by Critical Access Hospitals– NPI is now required in Type II billing– Can submit PQRS if NPI is on the bill– Will there be a penalty?
• Not Subject to PQRS:– FQHC– Independent Diagnostic Testing Facilities– Independent Laboratories
12/8/2015 ©2015 Mingle Analytics 26
12/8/2015 ©2015 Mingle Analytics 27
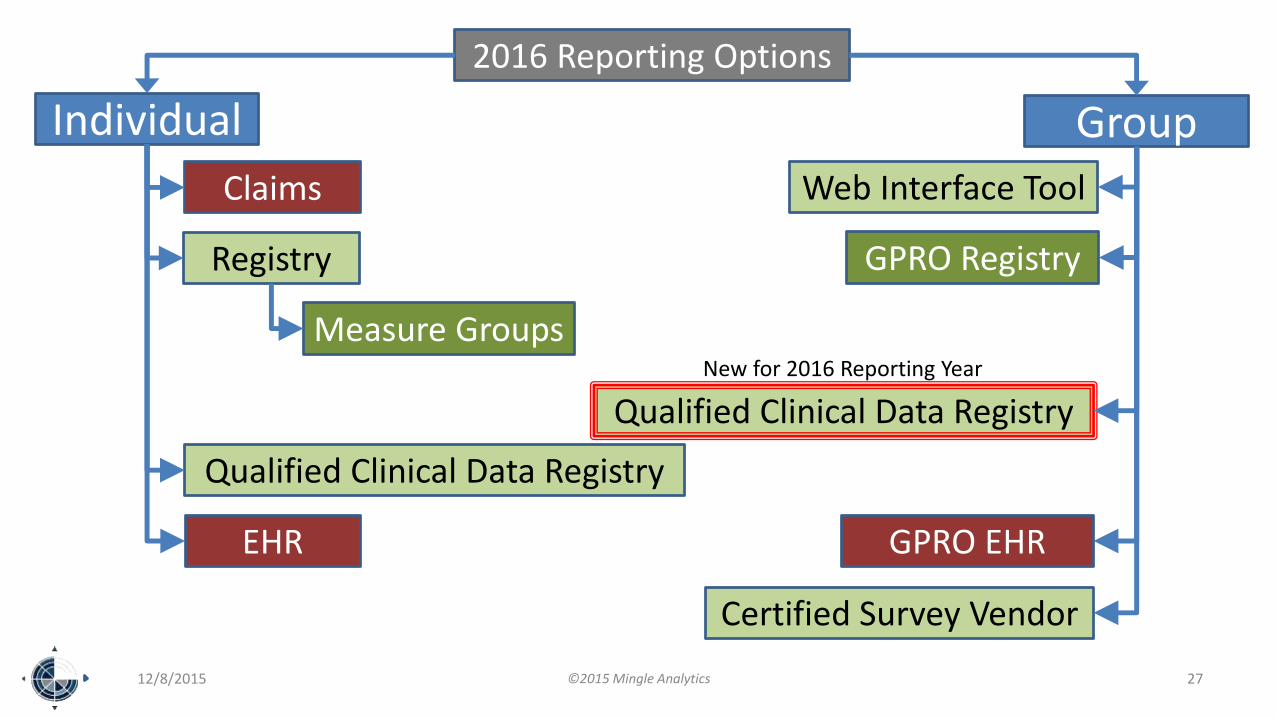
Individual Group
Claims
Registry
2016 Reporting Options
Qualified Clinical Data Registry
EHR
Measure Groups
Web Interface Tool
GPRO Registry
GPRO EHR
Certified Survey Vendor
Qualified Clinical Data Registry
New for 2016 Reporting Year
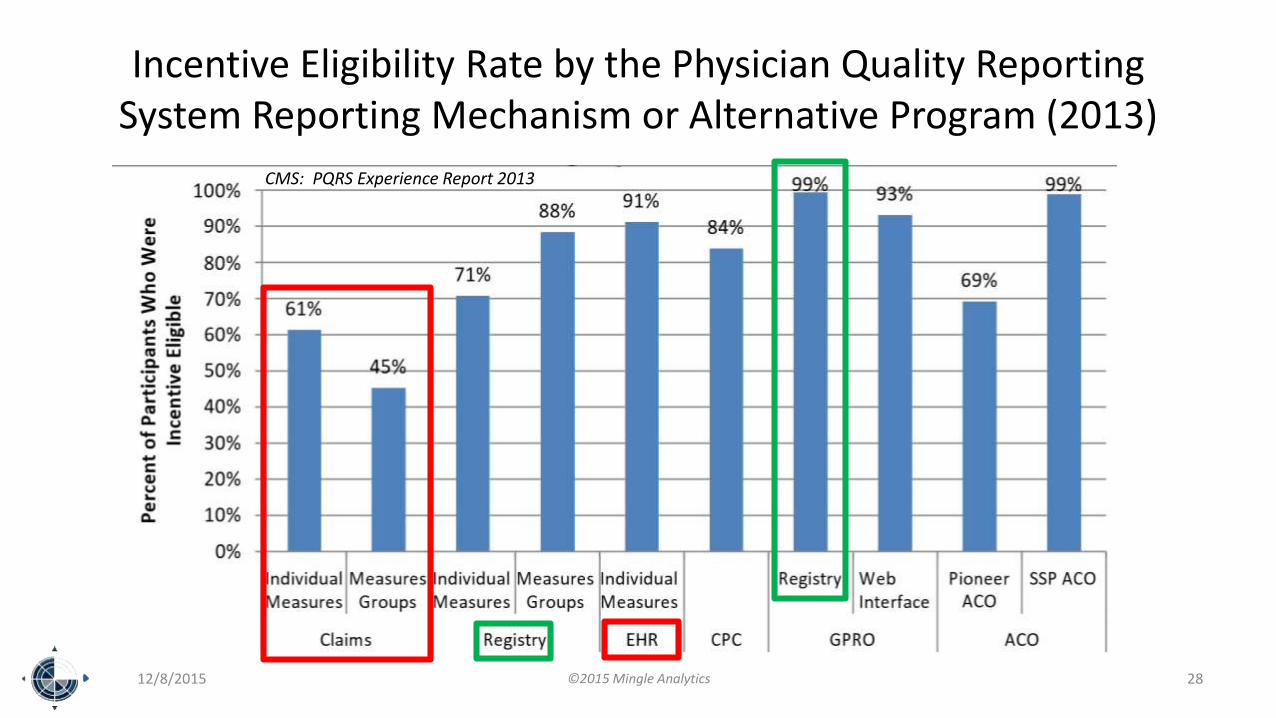
Incentive Eligibility Rate by the Physician Quality Reporting System Reporting Mechanism or Alternative Program (2013)
12/8/2015 ©2015 Mingle Analytics 28
CMS: PQRS Experience Report 2013

Reporting Basics Unchanged
• 9 Measures
• 3 Domains
• ≥ 50 % of Eligible Medicare Patients
• Any Measure with 0% Performance will not be Counted
• Submit 1 Cross-Cutting Measure
– If there is at least 1 face-to-face visit
– AND 15 Eligible instances for any Cross-Cutting Measure
12/8/2015 ©2015 Mingle Analytics 29

Claims Measures Continue to be De-Emphasized
In the 2015 Final Rule
Queued for elimination (date TBD)
Cited reason: high failure rate
12/8/2015 ©2015 Mingle Analytics 30
Not Dead Yet

CAHPS for PQRS
• Required for all Practices ≥ 100 Submitting GPRO
• Optional for all Group Practices ≥ 2
• Practice Bears the Expense
• Counts for 3 Measures, 1 Non-Specific Domain
• CAHPS is Based on 6 Months of Data, July 1 – December 31
12/8/2015 ©2015 Mingle Analytics 31

3 New Measure Groups
• Cardiovascular Prevention Measures Group
• Diabetic Retinopathy Measures Group
• Multiple Chronic Conditions Measures Group
12/8/2015 ©2015 Mingle Analytics 32

Measure Groups Requirements
• Only through Registry
• Submit 1 Measure Group
≥ 20 Patients
≥ 11 Medicare Patients
• If any measure has 0% performance the Measure Group will not be counted.
12/8/2015 ©2015 Mingle Analytics 33

Web Interface Tool
• Only Applicable to GPRO Submissions for ≥ 25 Providers
• Must Have One Measure with Medicare Patient Data
• Groups ≥ 100 Providers Must also Submit CAHPS for PQRS
• Measures Increased From 17 18– #438: Statin Therapy for the Prevention and Treatment of Cardiovascular
Disease
• For All Size Practices ≥ 25 Providers: – Report on first consecutive 248 eligible patients for each measure
– Or all patients if < 248
12/8/2015 ©2015 Mingle Analytics 34
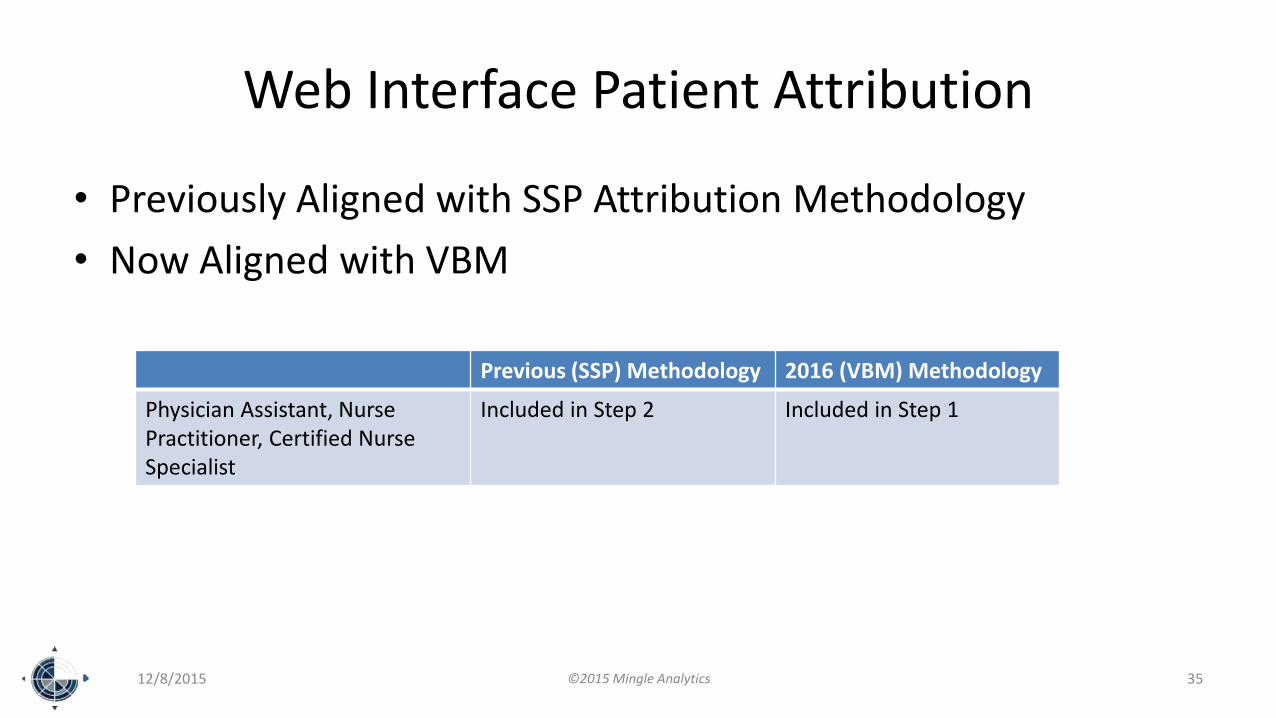
Web Interface Patient Attribution
• Previously Aligned with SSP Attribution Methodology
• Now Aligned with VBM
12/8/2015 ©2015 Mingle Analytics 35
Previous (SSP) Methodology 2016 (VBM) Methodology
Physician Assistant, NursePractitioner, Certified Nurse Specialist
Included in Step 2 Included in Step 1

Not Enough Measures?
• Claims and Registry Reporting
– Measure Applicability Validation (MAV) is back
• EHR Reporting:
– Submit what you’ve got
• Web Interface
– Submit what you’ve got
• Qualified Clinical Data Registry
– No excuses
12/8/2015 ©2015 Mingle Analytics 36

PQRS 2016 (2018 Program Year)and the Measure Applicability Validation Test (MAV)
12/8/2015 37
Submit 9 Measures3 Domains
1CC
No Adjustment
2%PQRS
Adjustment
YES
NO
Other applicable Measures not submitted
MAVCMS test for other
applicable measures
No otherApplicable measures
≥1 Measure Submitted
No Face to Face Visits
<15 Elig Instances for all Cross Cutting Measures
≥1 CC Meas Submitted
≥50% Reporting Rate
Non-Zero Performance
YES
NO
©2015 Mingle Analytics

GPRO Election Deadline
June 30 Annually
Elect GPRO and Commit to Method
Method is Now Flexible
12/8/2015 ©2015 Mingle Analytics 38

Submission Deadlines
February 28 annually [EHR, DSV, QCDR(QRDA)]
March 21 annually (Web Interface)
March 31 annually [Reg, QCDR(xml)]
12/8/2015 ©2015 Mingle Analytics 39
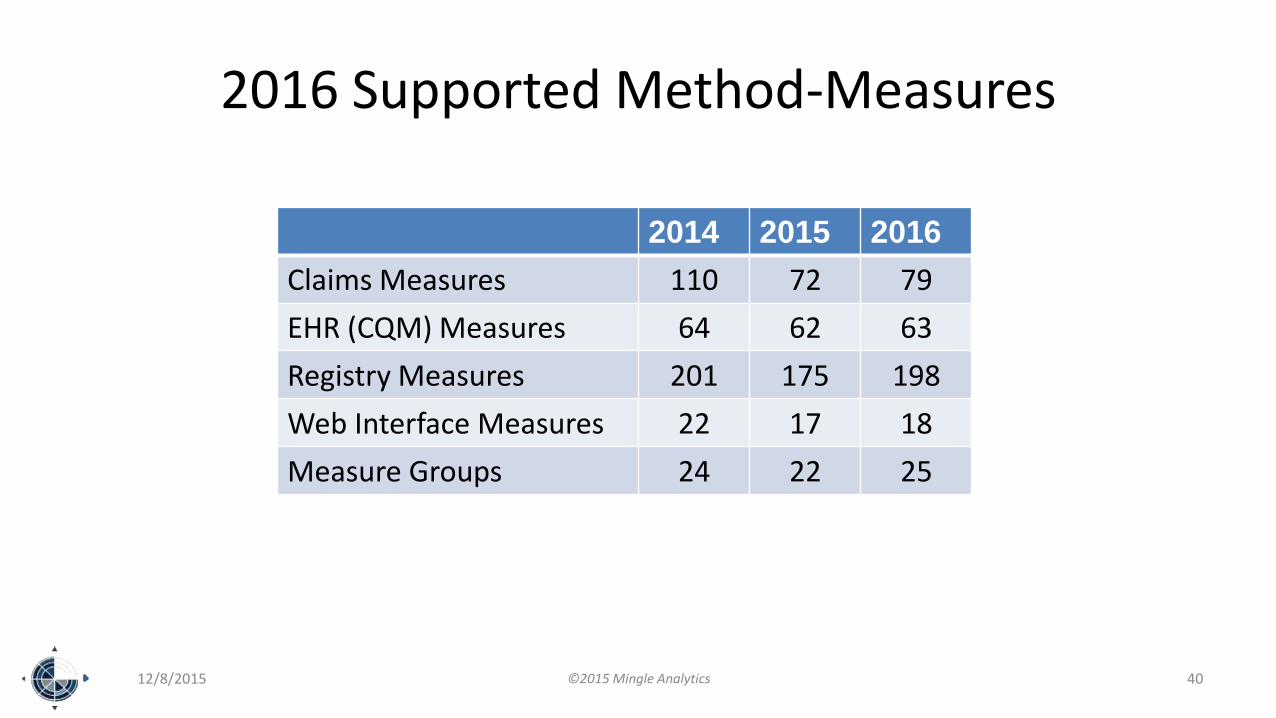
2016 Supported Method-Measures
2014 2015 2016
Claims Measures 110 72 79
EHR (CQM) Measures 64 62 63
Registry Measures 201 175 198
Web Interface Measures 22 17 18
Measure Groups 24 22 25
12/8/2015 ©2015 Mingle Analytics 40

4 New Cross-Cutting Measures# Topic Mthd
1 Hemoglobin A1c control C,R,E
46 Medication Reconciliation C,R
47 Care Plan C,R
110 Influenza C,R,E
111 Pneumovax C,R,E
112 Breast Cancer Screening C,R,E
128 BMI and Plan C,R,E
130 Current Medications C,R,E
131 Pain Assessment and Plan C,R
134 Screen for Depression and Plan C,R,E
154 Falls: Risk Assessment C,R
155 Falls: Plan of Care C,R
12/8/2015 ©2015 Mingle Analytics 41
# Topic Mthd
182 Functional Outcome Assessment and Plan C,R
226 Tobacco Use and Plan C,R,E
236 Controlling High Blood Pressure C,R,E
240 Childhood Immunization Status E
317 Screen for HTN and Plan C,R,E
318 Screen for Fall Risk E
321 CAHPS for PQRS Survey S
374 Receipt of Specialist Report E
400 Hepatitis C Screening R
402 Tobacco Use and Plan in Adolescents R,MG
431 Unhealthy Alcohol Use: Screening & Brief Counseling
R

12 Discontinued Measures
33 Stroke and Stroke Rehabilitation: Anticoagulant Therapy Prescribed for Atrial Fibrillation (AF) at Discharge
40 Osteoporosis: Management Following Fracture of Hip, Spine or Distal Radius for Men and Women Aged 50 Years and Older
81 Adult Kidney Disease: Hemodialysis Adequacy: Solute
82 Adult Kidney Disease: Peritoneal Dialysis Adequacy: Solute
172 Hemodialysis Vascular Access Decision-Making by Surgeon to Maximize Placement of Autogenous Arterial Venous (AV) Fistula
173 Preventive Care and Screening: Unhealthy Alcohol Use – Screening
193 Perioperative Temperature Management
194 Oncology: Cancer Stage Documented
285 Dementia: Screening for Depressive Symptoms
335 Maternity Care: Elective Delivery or Early Induction Without Medical Indication at ≥ 37 and < 39 Weeks
336 Maternity Care: Post-Partum Follow-Up and Care Coordination
349 Optimal Vascular Composite
12/8/2015 ©2015 Mingle Analytics 42

Reasons to Discontinue Measures
1. Consistent and Universal Near-100% Performance
2. Consolidation/Deduplication
3. Failure to Identify a “Measure Steward”
4. Change in Standard of Care
12/8/2015 ©2015 Mingle Analytics 43

1-10 of 37 New Measures# Title
403 Adult Kidney Disease: Referral to Hospice
404 Anesthesiology Smoking Abstinence
405 Appropriate Follow-up Imaging for Incidental Abdominal Lesions
406 Appropriate Follow-up Imaging for Incidental Thyroid Nodules in Patients
407 Appropriate Treatment of MSSA Bacteremia
408 Opioid Therapy Follow-up Evaluation
409 Clinical Outcome Post Endovascular Stroke Treatment
410 Psoriasis: Clinical Response to Oral Systemic or Biologic Medications
411 Depression Remission at Six Months
412 Documentation of Signed Opioid Treatment Agreement
12/8/2015 ©2015 Mingle Analytics 44

11-20 of 37 New Measures# Title
413 Door to Puncture Time for Endovascular Stroke Treatment
414 Evaluation or Interview for Risk of Opioid Misuse
415 Emergency Department Utilization of CT for Minor Blunt Head Trauma for Patients Aged 18 Years and Older
416 Emergency Department Utilization of CT for Minor Blunt Head Trauma for Patients Aged 2 through 17 Years
417 Rate of Open Repair of Abdominal Aortic Aneurysms (AAA) Where Patients Are Discharged Alive
418 Osteoporosis Management in Women Who Had a Fracture
419 Overuse Of Neuroimaging For Patients With Primary Headache And A Normal Neurological Examination
420 Varicose Vein Treatment with Saphenous Ablation: Outcome Survey
421 Appropriate Assessment of Retrievable Inferior Vena Cava Filters for Removal
422 Performing Cystoscopy at the Time of Hysterectomy for Pelvic Organ Prolapse to Detect Lower Urinary Tract Injury
12/8/2015 ©2015 Mingle Analytics 45

21-30 of 37 New Measures# Title
423 Perioperative Anti-platelet Therapy for Patients undergoing Carotid Endarterectomy
424 Perioperative Temperature Management
425 Photodocumentation of Cecal Intubation
426 Post-Anesthetic Transfer of Care Measure: Procedure Room to a Post Anesthesia Care Unit (PACU)
427 Post-Anesthetic Transfer of Care: Use of Checklist or Protocol for Direct Transfer of Care from Procedure Room to Intensive Care Unit (ICU)
428 Pelvic Organ Prolapse: Preoperative Assessment of Occult Stress Urinary Incontinence
429 Pelvic Organ Prolapse: Preoperative Screening for Uterine Malignancy
430 Prevention of Post-Operative Nausea and Vomiting (PONV) – Combination Therapy
431 Preventive Care and Screening: Unhealthy Alcohol Use: Screening & Brief Counseling
432 Patients Sustaining a Bladder Injury at the Time of any Pelvic Organ Prolapse Repair
12/8/2015 ©2015 Mingle Analytics 46

31- 37 of 37 New Measures
# Title
433 Proportion of Patients Sustaining a Major Viscus Injury at the Time of any Pelvic Organ Prolapse Repair
434 Proportion of Patients Sustaining A Ureter Injury at the Time of any Pelvic Organ Prolapse Repair
435 Quality of Life Assessment for Patients with Primary Headache Disorders
436 Radiation Consideration for Adult CT: Utilization of Dose Lowering Techniques
437 Rate of Surgical Conversion from Lower Extremity Endovascular Revascularizatio n Procedure
438 Statin Therapy for the Prevention and Treatment of Cardiovascular Disease
439 Age Appropriate Screening Colonoscopy
12/8/2015 ©2015 Mingle Analytics 47

Other Measure Changes
• Change Domains
• Change Reporting Mechanism Options
• Adjust Specific Eligibility or Performance Specifications
• Support of Exclusion or Ineligibility Statuses
12/8/2015 ©2015 Mingle Analytics 48

12/8/2015 ©2015 Mingle Analytics 49
Pause for Questions about PQRS

Clinical Quality Measures forMeaningful Use
My Prediction:
Continues under MIPS
12/8/2015 ©2015 Mingle Analytics 50

Changes to Requirements
• CEHRT Must Submit Using Most Recent eCQM Specs
• CEHRT Need Not Recertify to Most Recent eCQM Specs
• EP May Still Attest or Submit Electronically
• 2015 Edition CQM Reporting Certification
– QRDA Category I and III standards
– Optional CMS “form and manner”
12/8/2015 ©2015 Mingle Analytics 51

Comprehensive Primary Care Initiative
• Must Report CQM Electronically as a Group• 13 Specified eMeasures• 3 Domains• EP in First Year of MU may Follow MU CQM Requirements or be
Qualified by the Group Submission• If CPC Practice Fails to Submit Group eCQMs, Individuals can
Comply Individually with MU Requirements• eSubmission Must be a 12-month (not 90-day) Reporting Period• Use a Hardship Exemption in the First Year to Avoid Payment
Reduction
12/8/2015 ©2015 Mingle Analytics 52

12/8/2015 ©2015 Mingle Analytics 53
Pause for Questions about Clinical Quality Measures for Meaningful Use

Value Based Modifier
My Prediction:
MIPS will most closely resemble VBM Quality Tiering.
12/8/2015 ©2015 Mingle Analytics 54

Value Based Modifier Applies To:
2015 Service Year (2017 Program Year)
• Physicians – Doctors of:– Medicine
– Osteopathy
– Dental Surgery
– Dental Medicine
– Podiatric Medicine
– Optometry
– Chiropracty
• Solo and Group Practices that include at least 1 Physician
2016 Service Year (2018 Program Year)
• Physicians in Solo and Group Practices
• Non-Physicians in Solo and Group Practices (no Physicians in the Practice)– Nurse Practitioner
– Physician Assistant
– Certified Nurse Specialist
– Certified Registered Nurse Anesthetist
12/8/2015 ©2015 Mingle Analytics 55

Mandatory Quality Tiering for All
Practice Type Size2015 Service Year 2016 Service Year
Max Negative Max Positive Max Negative Max Positive
PhysicianPractice
≥ 10 EP -4% 4% -4% 4%
1-9 EP 0 2% -2% 2%
Non-PhysicianPractice
All Sizes0 0 0 2%
12/8/2015 ©2015 Mingle Analytics 56

Size of Practice
12/8/2015 ©2015 Mingle Analytics 57
• Still Determined by the Lower Of:
– Count of Providers in PECOS in early July
– Count of Providers as of March 1 who billed Medicare Part B for the prior Service Year
• Also Determines if Your’s is a Physician or Non-Physician Practice.
– If either count yields 0 physicians, your’s is a non-physician practice.
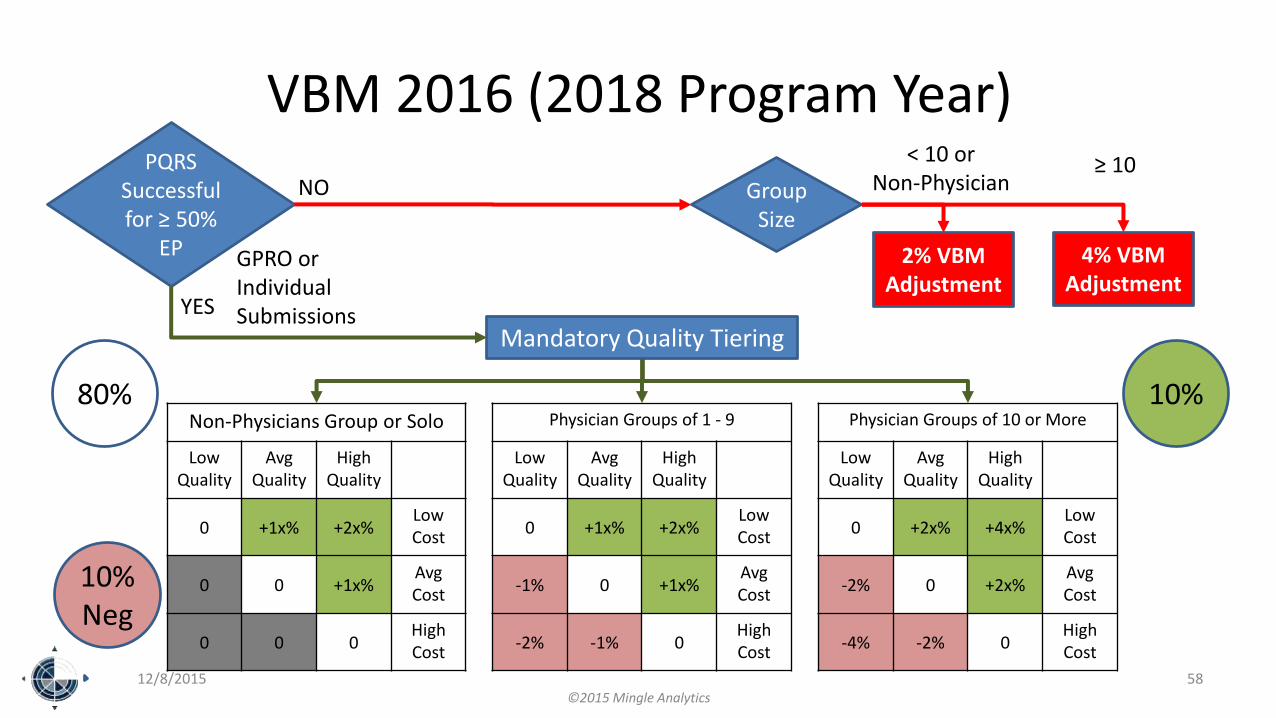
VBM 2016 (2018 Program Year)
12/8/2015 58
PQRS Successful for ≥ 50%
EP
YES
NO
4% VBMAdjustment
Group Size
< 10 or Non-Physician
≥ 10
GPRO or Individual Submissions
2% VBMAdjustment
Mandatory Quality Tiering
Non-Physicians Group or Solo
Low Quality
AvgQuality
High Quality
0 +1x% +2x%Low Cost
0 0 +1x%AvgCost
0 0 0High Cost
Physician Groups of 1 - 9
Low Quality
AvgQuality
High Quality
0 +1x% +2x%Low Cost
-1% 0 +1x%AvgCost
-2% -1% 0High Cost
Physician Groups of 10 or More
Low Quality
AvgQuality
High Quality
0 +2x% +4x%Low Cost
-2% 0 +2x%AvgCost
-4% -2% 0High Cost
10%
10%Neg
80%
©2015 Mingle Analytics

Fiddling with Value Based Modifier2015 Service Year (2017 Program Year) 2016 Service Year (2018 Program Year)
Benchmarks Separately Benchmark eCQMs
Minimum Cost Measure Sample Size 125 Attributed Patients No change
Hospital Cost Inclusions Include Maryland Hospitals
Applicability of VBM AdjustmentsGroup Adjustment applies to Physicians
Group Adjustment Applies to Physicians, NP, PA, CNS, CRNA
Benchmark Stratification Cost Measures adjusted by Specialty and by Risk
No change
VBM waived if 50% of Individuals Submit
Whether or not Self-Selected for GPRO No change
Permit Change in GPRO Method Immediately No change
All Cause Hospital Readmissions Low Reliability Index therefore not Applicable to Groups 1-9
and Non-Physician PracticesNo change
If any TIN provider is in an Innovation Model Group is not Subject to VM No change
12/8/2015
©2015 Mingle Analytics
59

Fiddling with Value Based Modifier2015 Service Year (2017 Program Year) 2016 Service Year (2018 Program Year)
Benchmarks Separately Benchmark eCQMs
Minimum Cost Measure Sample Size 125 Attributed Patients
Hospital Cost Inclusions Include Maryland Hospitals
Applicability of VBM AdjustmentsGroup Adjustment applies to Physicians
Group Adjustment Applies to Physicians, NP, PA, CNS, CRNA
Benchmark Stratification Cost Measures adjusted by Specialty and by Risk
VBM waived if 50% of Individuals Submit
Whether or Not Self Selected for GPRO
Permit Change in GPRO Method Immediately
All Cause Hospital Readmissions Low Reliability Index therefore Not Applicable toGroups 1-9 and Non-Physician Practices
If any TIN provider is in an Innovation Model Group is Not Subject to VM
12/8/2015 ©2015 Mingle Analytics 60

SSP ACO Policies in VBM2015 Service Year (2017 Program Year) 2016 Service Year (2018 Program Year)
If participating in > 1 ACO Apply best ACO Quality Composite VBM Score
No change
If any TIN provider is in an Innovation Model
Group is Subject to VM No change
ACO Does Not Successfully Report Not Subject to Negative VBM Adjustment
Subject to Negative VBM Adjustment
If High Quality and ≥ 75th Percentile for beneficiary Risk Score
Add 1x% Positive Adjustment No change
CAHPS for PQRS Survey Included in Quality Composite Score
12/8/2015 ©2015 Mingle Analytics 61

SSP ACO Policies in VBM2015 Service Year (2017 Program Year) 2016 Service Year (2018 Program Year)
If participating in > 1 ACO Apply best ACO Quality Composite VBM Score
If any TIN provider is in an Innovation Model
Group is Subject to VM
ACO Does Not Successfully Report Not Subject to Negative VBM Adjustment
Subject to Negative VBM Adjustment
If High Quality and ≥ 75th Percentile for beneficiary Risk Score
Add 1x% Positive Adjustment
CAHPS for PQRS Survey Included in Quality Composite Score
12/8/2015 ©2015 Mingle Analytics 62

12/8/2015 ©2015 Mingle Analytics 63
Pause for Questions about Value Based Modifier

Physician Feedback Programand Informal Review
My Prediction:
Continue to evolve under MIPS.
Likely to be consolidated.
12/8/2015 ©2015 Mingle Analytics 64

Mid-Year QRUR Report
• First Distributed in Spring 2015
• Provided by TIN to Physicians in Group and Solo Practice
• Cost and Administrative Claims Calculated Measures
• Most Recent July 1 through June 30 Reporting Period
• Expand in Spring 2016 to Non-Physicians in Groupand Solo Practice
12/8/2015 ©2015 Mingle Analytics 65

Supplemental QRUR Report
• First Distributed in Summer 2014– Provided by TIN to Groups ≥ 100
– Episodes of Care that occurred in 2012• 6 Major Episode Measures
• 20 Episode Subtypes
• Distributed in Fall 2015 – Provide by TIN to Group and Solo Providers
– Episodes of Care that occurred in 2014• 26 Major Episode Measures
• 38 Episode Subtypes
12/8/2015 ©2015 Mingle Analytics 66

Quality and Resource Use Report (QRUR)
• Annual Report for TIN Practices
• This is THE Report that Documents Your VBM Adjustment
• Available in Your CMS Enterprise Portal (PV-PQRS) Aug-Sept
• Contains:– Cost Performance
– Quality Performance
– Specialty and Risk Adjusted
– VBM Adjustment• Calculations
• Details
12/8/2015 ©2015 Mingle Analytics 67

PQRS Feedback Report
• Specific PQRS Performance Feedback
• All PQRS Methods Utilized
• Qualification Status
• Allowable Charges and Calculated Incentive
• Anticipated Adjustment
12/8/2015 ©2015 Mingle Analytics 68

Informal Review for PQRS
• Must be Requested Within 60 Days Following Publication of the Feedback Report
• Data can be RESUBMITTED (if infrastructure exists):
– Not submitted for the first time.
– Must be by a third-party.
– Not available for Claims, EHR Direct, or Web Interface.
• No Administrative or Judicial Review of Determinations
12/8/2015 ©2015 Mingle Analytics 69

Informal Review for VBM
• Requests due 60 days after Publication of QRUR
• Intended as a Means to correct Certain Errors Made by CMS or a Third-Party Vendor (for example, PQRS-qualified Registry)
• Possible Actions:
– Classify as average
– Resubmit/recalculate quality metrics
• No Administrative or Judicial Review of Determinations
12/8/2015 ©2015 Mingle Analytics 70
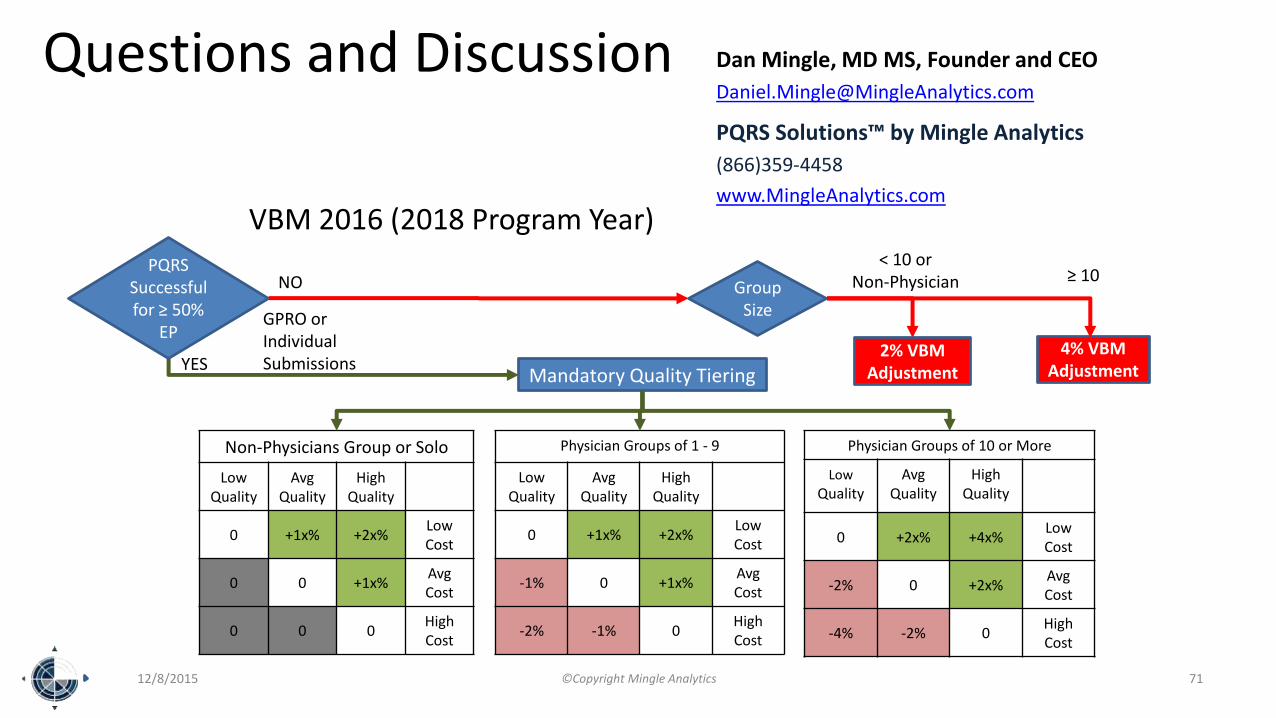
VBM 2016 (2018 Program Year)
12/8/2015 ©Copyright Mingle Analytics 71
PQRS Successful for ≥ 50%
EP
YES
NO
4% VBMAdjustment
Group Size
< 10 or Non-Physician ≥ 10
GPRO or Individual Submissions
2% VBMAdjustmentMandatory Quality Tiering
Non-Physicians Group or Solo
Low Quality
AvgQuality
High Quality
0 +1x% +2x%Low Cost
0 0 +1x%AvgCost
0 0 0High Cost
Physician Groups of 1 - 9
Low Quality
AvgQuality
High Quality
0 +1x% +2x%Low Cost
-1% 0 +1x%AvgCost
-2% -1% 0High Cost
Physician Groups of 10 or More
Low
QualityAvg
QualityHigh
Quality
0 +2x% +4x%Low Cost
-2% 0 +2x%AvgCost
-4% -2% 0High Cost
Questions and Discussion Dan Mingle, MD MS, Founder and CEO
PQRS Solutions™ by Mingle Analytics
(866)359-4458
www.MingleAnalytics.com


