SEVENTH FRAMEWORK PROGRAMME
SST–2007–TREN–1 - SST.2007.2.2.4. Maritime and logistics co-ordination platform
SKEMA Coordination Action
“Sustainable Knowledge Platform for the European Maritime and Logistics
Industry”
Deliverable: SE 3.2.3b Dynamic risk management methods Part 2
WP No 2 – SKEMA Consolidation Studies Task 2.3- Safety, Security and Sustainability Capabilities Responsible Partner: AUEB WP Leader: VTT Planned Submission Date: 1st July 2010 Actual Submission Date: 19th December 2008 Distribution Group: Consortium
Dissemination Level: PU (Public) Contract No. 218565 Project Start Date: 16th June 2008 End Date: 15th May 2011 Co-ordinator: Athens University of Economics and Business
Document Title Dynamic risk management methods Part 2
WP number
Document number: Document History
Version Comments Date Authorized by
First draft version 0.1 draft 22/12/2008 C. Glansdorp Advanced draft 1.0 Renumbering versions after
crash and many recovered versions
20/01/2009 C. Glansdorp
1.1 Small changes and renumbering volumes
06/06/2009 C. Glansdorp
2.0 SKEMA format 20/06/2010 C. Glansdorp Classification PU Number of pages: Number of annexes: 1 Responsible Organization: CETLE Contributing Organisation(s): MARIN
Principal Author(s): C. C. Glansdorp Contributing Author(s): C. van der Tak
WP/HA leader Name:
C. Glansdorp
Quality Control
Who Date
Checked by Task and WP Leader
Checked by Peer Review/edited
Checked by Quality Manager
Approved by Project Manager Takis Katsoulakos

Disclaimer The content of the publication herein is the sole responsibility of the publishers and it does not necessarily represent the views expressed by the European Commission or its services. While the information contained in the documents is believed to be accurate, the authors(s) or any other participant in the SKEMA consortium make no warranty of any kind with regard to this material. Neither the SKEMA Consortium nor any of its members, their officers, employees or agents shall be responsible or liable for negligence or in respect of any inaccuracy or omission, or for any direct or indirect or consequential loss or damage caused by or arising from any information herein.
Summary Page
Fields Instructions
Document Type [e.g. Paper, Book, Report, Article, SKEMA Study, Other, etc]
SKEMA Consolidation Study
Title Review of some methods assessing safety performance
Version 1.0 Date 1/7/2010 Authors [Name, Affiliation] C. Glansdorp Publisher / Contributors ISSN Language English Category [ Review, Methodology, Design, Product Description, Market Survey, etc]
Review
Abstract This report summarizes the most important issues in risk determination and risk management. After a historical overview the main methods in use in risk analysis are summarized. There is some emphasis on the use of precursors which are recently introduced. Cost 301 as a European project in the eighties explored new alleys for the numerical determination of risk. The origin is discussed which lay the foundation of modern marine risk analysis.
Key Findings / Conclusions The most important recommendation is that member States and other authorities making use of maritime risk analysis start using a dynamic risk model. These applications will be enhanced when accurate numerical data regarding vessels, routes become available. The use of AIS and MOS centers is a very important step to collect this information for future risk management work.
Study limitations Relevant countries Related Documents [title, author, description, type of relationship, PDF]
Topics Addressed in SKEMA Subject Index
SE3.1 European capabilities for safety and security SE3.2 Methods for assessing safety and security performance SE3.2.1 Review of collision and grounding risk analysis methods SE3.2.2 Evaluation of methods to estimate

the consequence costs of an oil spill SE 3.2.3a Dynamic risk management methods Part 1 SE 3.2.3b Dynamic risk management methods Part 2
Relevant Stakeholders − Maritime administrations − Ship owners − Port authorities − Policy makers − Maritime Operational Centers/Coast
Guards/OPRC/SAR/VTM Policies Addressed PE1.3.3 Sea/Water pollution
PE1.3.6 Environmental risk management PE1.1.2.4 Safety and Security PE1.1.2.5 Surveillance activities
Policy implications / recommendations Key words HAZOP, HAZID, FMECA, FTA, ETA, ASPM,
ALARP, FSA, Cost/Benefit, Pollution, RCO Document PDF or URL If PDF is not available URL of publisher

Contents Abstract ........................................................................................................................ 14
Summary ...................................................................................................................... 15
Political implications ............................................................................................... 17
1. Objectives ............................................................................................................ 19
1.1. General objective........................................................................................... 19
1.2. Application of FSA in ports and port approaches ......................................... 19
1.3. Risk analysis and risk assessment ................................................................. 19
1.4. Costs/Benefits Analyses ................................................................................ 19
2. Target stakeholders .............................................................................................. 20
3. Glossary of terms ................................................................................................. 21
4. Analysis................................................................................................................ 23
4.1. The navigation process and associated risk................................................... 23
4.1.1. The relation between navigation process and risk ................................. 23
4.1.2. Information in relation to the required Navigation Support Services .... 25
4.1.3. Risk Analysis ......................................................................................... 26
4.2. Methodology of a FSA .................................................................................. 30
4.2.1. Introduction ............................................................................................ 30
4.2.2. Cost categories ....................................................................................... 30
4.2.3. Selection of a RCO using ALARP......................................................... 31
4.3. Introduction to the determination of the risk reduction parameters using
experts opinions ....................................................................................................... 32
4.3.1. Introduction ............................................................................................ 32
4.3.2. Experts’ opinion meetings ..................................................................... 35
4.3.3. Results of experts’ opinion meetings ..................................................... 35
4.3.4. Use of tugs ............................................................................................. 41
4.4. Costs of time of ships and costs of Risk Control Options ................................ 44
4.4.1. Vessels .............................................................................................. 44
4.4.2. Pilotage Costs ................................................................................. 48
4.4.3. VTS charges ............................................................................................... 53
4.4.4. Costs of tugs ............................................................................................... 53
4.4.5. Mooring fees .............................................................................................. 58
4.5. Frequency calculations of accidents .............................................................. 62
4.5.1. Casualty rates for ships in port for different accident types .................... 62
4.5.2. Values of casualty rates as function of length when the vessel uses tug . 64
4.5.3. Effect of wind ......................................................................................... 65
4.5.4. Effect of visibility ................................................................................... 65
4.5.5. Effect of flag ........................................................................................... 66
4.5.6. Effect of classification society ................................................................ 68
4.5.7 Effect of age ............................................................................................ 69
4.5.8. Effect of exemptions ............................................................................... 70
4.6. Consequences .................................................................................................. 73
4.6.1. Material damage...................................................................................... 73
4.6.2. Loss of life .............................................................................................. 75
4.6.3. Injuries .................................................................................................... 76
4.7. Pollution ......................................................................................................... 77
4.7.1. Cargo Oil ................................................................................................ 77
4.7.2. Bunkers .................................................................................................. 78
4.7.3. Chemical cargoes ................................................................................... 79
4.7.4. Gas cargoes ............................................................................................ 81
4.7.5. Infrastructural damages .......................................................................... 82
4.7.6. Damage of cargoes ................................................................................. 83

4.8. Time efficiency of vessels in a port ................................................................ 84
4.8.1. Mooring times ........................................................................................ 84
4.8.2. Relative speeds of vessels in the port confines ...................................... 85
4.9 FSA calculations ............................................................................................. 87
4.9.1. Scenarios ................................................................................................. 87
4.9.2. LNG carrier inbound for Rotterdam ....................................................... 91
4.9.3. Chemical tanker inbound for Rotterdam................................................. 93
4.9.4. Container vessel outbound from Genova ................................................ 95
4.9.5. Reefer inbound for Rotterdam ............................................................... 97
4.9.6. LNG carrier outbound from Goteborg ................................................... 99
4.9.7. Bulk carrier outbound from Genova .................................................... 101
4.9.8. Product tanker inbound for Goteborg .................................................. 103
4.9.9. Ro-Ro carrier for unguided lorries outbound from Goteborg .............. 105
4.9.10. Ro-Ro carrier for guided lorries inbound for Rotterdam ..................... 107
4.9.11. Dry cargo vessel outbound from Genova ............................................ 109
4.9.12. Oil tanker outbound from Genova ...................................................... 111
4.13. Annex ............................................................................................................ 120
4.13.2. Quality of the vessel............................................................................. 122
4.13.3. Environment ........................................................................................ 125
4.13.4. Interaction between crew and vessel ........................................... 127
4.13.5. Interaction of the vessel with the environment ................................... 128
4.13.6. Interaction between crew and environment ........................................ 130
4.13.7. Interaction of the crew with the environment .................................. 131
5. Key publications ................................................................................................ 135
6. Key projects ....................................................................................................... 136
7. Related Projects ................................................................................................. 137
8. Key conferences ................................................................................................. 138

9. Key websites ...................................................................................................... 139
List of Figures
Figure 1: An example of the total costs of entering a port and determination of the
best Risk Control Option ............................................................................................. 16
Figure 2: Average improvement for the NSS variables for three locations in the
Netherlands, Göteborg and Genova. ............................................................................ 38
Figure 3: The speed drop factor in Genova and Göteborg for different wind forces and
different Risk Control Options..................................................................................... 40
Figure 4: Mooring times for different ship lengths and wind conditions .................... 41
Figure 5: Number of tugs required in Göteborg and the three entrances to Genova as
function wind conditions for vessels smaller than 10,000GT ...................................... 42
Figure 6: Number of tugs required in Göteborg and the three entrances to Genova as
function wind conditions for vessels larger than 10,000 GT and smaller than
30,000GT ..................................................................................................................... 42
Figure 7: Number of tugs required in Göteborg and the three entrances to Genova as
function wind conditions for vessels larger than 30,000 GT and smaller than
60,000GT ..................................................................................................................... 42
Figure 8: Number of tugs required in Göteborg and the three entrances to Genova as
function wind conditions for vessels larger than 60,000 GT and smaller than
100,000GT ................................................................................................................... 43
Figure 9: Number of tugs required in Göteborg and the three entrances to Genova as
function wind conditions for vessels larger than 100,000 GT ..................................... 43
Figure 10: Pilot dues in Rotterdam .............................................................................. 49
Figure 11: Dock pilot dues in Rotterdam ..................................................................... 50
Figure 12: Pilot dues in the port of Genova for Tankers and as function of kGT ....... 51
Figure 13: Pilot dues in the port of Genova for Roll-on Roll-off vessels and as
function of kGT............................................................................................................ 51
Figure 14: Pilot costs for 1 hour of pilotage and as function of kGT .......................... 52
Figure 15: Pilot costs for 5 hours of pilotage and as function of kGT......................... 52
Figure 16: Original VTS charges in the Netherlands as function of London length. .. 53
Figure 17: Overview of the number of tugs required for a container vessel as function
of size and weather conditions ..................................................................................... 55

Figure 18: Average tug rates in Rotterdam .................................................................. 56
Figure 19: Tug rates in Genova as function of GT for the old harbour and the
container terminal ........................................................................................................ 57
Figure 20: Tug rates in Genova as function of GT for the oil terminal in Multedo .... 57
Figure 21: Tug rates in Göteborg as function of LB .................................................... 58
Figure 22: Mooring dues in the port of Rotterdam for mooring and unmooring ........ 59
Figure 23: Mooring costs for Ro-Ro vessels and container vessels in the port of
Genova ......................................................................................................................... 60
Figure 24: Mooring costs for other vessels in the port of Genova ............................... 60
Figure 25: Mooring and unmooring costs for all vessels in the port of Göteborg ....... 61
Figure 26: The effect of length and tugs on the average casualty rates ....................... 64
Figure 27: Multiplication factor for wind effects ........................................................ 65
Figure 28: Multiplication factor of visibility. .............................................................. 66
Figure 29: Multiplication factor for different types of accidents as function of age ... 70
Figure 30: Modelling the reduction factor due to exemption ...................................... 71
Figure 31: Envelope of the reduction factors at begin of the xth call measured in
fraction of the year ....................................................................................................... 72
Figure 32: Relative speed of a vessel in a port as function of wind force and
Navigation Support Service ......................................................................................... 86
Figure 33: Risk of a loaded LNG carrier in the port of Rotterdam .............................. 91
Figure 34: Costs minimization for a LNG Carrier in Rotterdam ................................. 92
Figure 35: Risk of a loaded chemical tanker in the port of Rotterdam ........................ 93
Figure 36: Costs minimization for a chemical tanker in Rotterdam ............................ 94
Figure 37: Risk of a loaded container vessel in the port of Genova ............................ 96
Figure 38: Costs minimization for a container vessel in the port of Genova .............. 96
Figure 39: Risk of a loaded reefer in the port of Rotterdam ........................................ 97
Figure 40: Costs minimization for a loaded reefer in Rotterdam ................................ 98
Figure 41: Risk of a LPG carrier in the port of Göteborg ............................................ 99
Figure 42: Costs minimization for a LPG carrier in Goteborg .................................. 100
Figure 43: Risk of a bulk carrier in the port of Genova ............................................. 101
Figure 44: Costs minimization for a bulk carrier in Genova ..................................... 102
Figure 45: Risk of a product tanker in the port of Goteborg ..................................... 103
Figure 46: Costs minimization for a product tanker in Goteborg .............................. 104
Figure 47: Risk of a Ro-ro carrier with unguided lorries in the port of Goteborg ..... 105
Figure 48: Costs minimization for a Ro-Ro carrier with unguided lorries in Goteborg
.................................................................................................................................... 106
Figure 49: Risk of a Ro-ro carrier with guided lorries in the port of Rotterdam ....... 107
Figure 50: Costs minimization for a Ro-ro carrier with guided lorries in Rotterdam 108
Figure 51: Risk of a dry cargo vessel in the port of Genova ..................................... 109
Figure 52: Costs minimization for a dry cargo vessel in Genova .............................. 110
Figure 53: Risk of an oil tanker in the port of Genova .............................................. 111
Figure 54: Costs minimization for an oil tanker in Genova....................................... 112

List of Tables Table 1: Coefficients of polynomial; approximation of major characteristics for a
vessel ............................................................................................................................ 45
Table 2: Results of the calculation of the characteristics of a container vessel .......... 46
Table 3: Additional costs parameters ........................................................................... 46
Table 4: Calculation of day costs for a container vessel .............................................. 47
Table 5: Crew table for container vessels as function of size in GT .......................... 47
Table 6: Monthly pay rates in € for officers and ratings having different nationalities
...................................................................................................................................... 48
Table 7: Polynomial coefficients of pilotage in Rotterdam ......................................... 50
Table 8: Polynomial coefficients for pilot dues in Göteborg ....................................... 52
Table 9: Coefficients of the average tug rates in Rotterdam ....................................... 56
Table 10: Coefficients of the polynomials for mooring and unmooring in Rotterdam59
Table 11: Casualty rates*10^6 from Dutch studies ..................................................... 63
Table 12: Coefficients of the Multiplication factor for the length ............................... 65
Table 13: Multiplication factor of vessels with a given flag ....................................... 68
Table 14: Effect of Classification Society ................................................................... 69
Table 15: Material damage as a result of an analysis of Dutch Figures ...................... 73
Table 16: Damage costs of a vessel of 185 m based on the costs of an average vessel.
...................................................................................................................................... 74
Table 17: Probability of a fatality and total costs per call for a vessel with a crew of 12
...................................................................................................................................... 75
Table 18: Probability of an injury and total costs per call for a vessel with a crew of
12.................................................................................................................................. 76
Table 19: Probabilities and average pollution costs for a tanker with a length of 185 m
and single hull .............................................................................................................. 78
Table 20: Probabilities and average bunker pollution costs for a tanker with a length
of 185 m and double hull ............................................................................................. 79
Table 21: Probabilities and average chemical pollution costs for a tanker with a length
of 185 m and double hull ............................................................................................. 81
Table 22: Probabilities and costs of loss of life costs for a gas carrier with a length of
185 m and single hull ................................................................................................... 82
Table 23: Infrastructural damage for a vessel of a length 185 m ................................. 83

Table 24: Mooring time as function of ship length and BF number ............................ 84
Table 25: The coefficients of the relative speed as function of the Navigation Support
Service.......................................................................................................................... 86
Table 26: Ratio of Navigation Support Services compared with the Pilot on Board .. 88
Table 27: Average distances in the three ports ............................................................ 89
Table 28: Speed reductions relative to service speed for fairways and approach and in
the dock basins ............................................................................................................. 89
Table 29: Input and calculated values for a LNG carrier ............................................. 91
Table 30: Input and calculated values for a chemical tanker ....................................... 93
Table 31: Input and calculated values for a container vessel ....................................... 95
Table 32: Input and calculated values for a container vessel ....................................... 95
Table 33: Input and calculated values for a reefer ....................................................... 97
Table 34: Input and calculated values for a LPG carrier ............................................. 99
Table 35: Input and calculated values for a bulk carrier ............................................ 101
Table 36: Input and calculated values for a product tanker ....................................... 103
Table 37: Input and calculated values for a Roro vessel with unguided lorries ........ 105
Table 38: Input and calculated values for a Ro-ro vessel with guided lorries ........... 107
Table 39: Input and calculated values for a dry cargo vessel .................................... 109
Table 40: Input and calculated values for an oil tanker ............................................. 111

Abstract This report discussed an application of risk analysis in a port. The subject is the
optimization of the costs of a Navigation Support System which consist of the costs of
the Support System, the monetary changes due to the use of time of the vessel and the
risk costs when the Support System is applied.
The elements of the method are discussed and detailed results are given for three
major ports in Europe.

Summary
SKEMA is a European project that is intended to summarize and then make the
important results accessible through a knowledge base.
EMBARC was a project in the fifth framework program on vessel traffic management
in ports and coastal waters.
EMBARC introduced a new concept. This concept can be briefly characterised as the
construction of a risk equation for a vessel. This risk equation can be used to
determine the risk of a vessel under the present weather conditions in the present
position but also as s function of the cargo or/and bunkers on board. The risk is
expressed in €/hr or €/event. This is an improvement over the methods that are
recommended by IMO through Formal Safety Assessment, because it compares risk
costs with the additional costs of using a risk mitigation method.
This report describes the execution of a FSA in a port environment with respect to the
required Navigation Support Services. The term Navigation Support Services
comprises all services that are used to make a call in a port efficient and safe.
These services comprise, VTS and pilotage, but tugs and mooring gangs are also
important and are addressed in the FSA.
EMBARC has developed a FSA to determine the level of nautical assistance of a
vessel that calls in a port. These nautical services normally comprise VTS services,
shore-based pilotage, pilot on board and pilot on board with a PPU1.
The FSA consists of the determination of the risk of a vessel that will enter a port
without any assistance. The risk is based on the determination of frequency of an
accident and the average consequences of an accident. Seven types of accidents are
distinguished. Each has its own accident rate. The frequency of accidents is dependent
on distinct factors, such as age, classification society, flag and type. Weather and fog
are time dependent factors which are also taken into account.
The nautical services are seen as Risk Control Options. Pilots and other experts have
determined the risk reduction factor, and also the multiplication factors that need to be
applied on the average risk level.
1 PPU is Personal Pilot Unit
For each vessel dependent on the distance sailed in a specific port a monetary value of
the risk is determined. The effect of wind and fog are considered as time varying risk
increasing factors. These effects will also be apparent in a longer time needed to
navigate to or from the berth and the time required for berthing and unberthing. In
order to optimise i.e. to determine the optimal nautical support for each arriving or
departing vessel, the costs of each form of assistance in monetary terms are
calculated. That form of assistance is chosen that minimises the monetary values of
risk the ship’s time and the costs of assistance rendered as function of the wind force.
The method has originally been programmed for the port of Rotterdam, but many
improvements have been made. The method is also being used in Genova and
Göteborg.
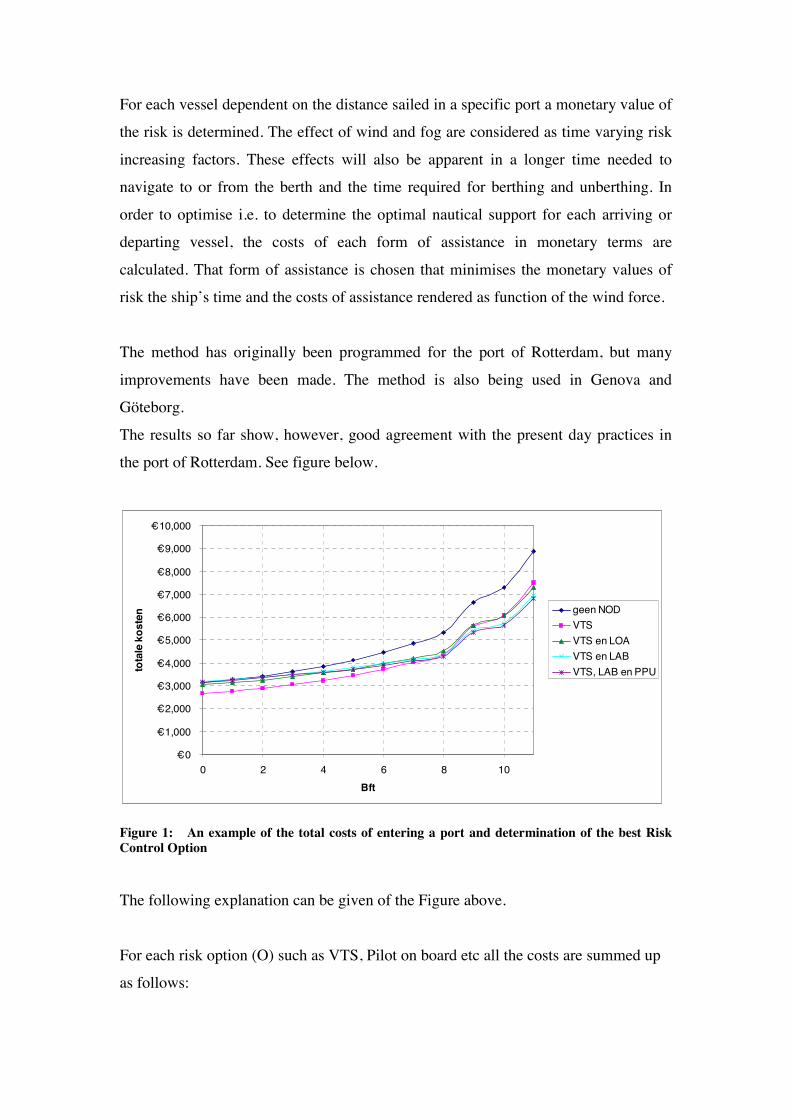
The results so far show, however, good agreement with the present day practices in
the port of Rotterdam. See figure below.
€ 0
€ 1,000
€ 2,000
€ 3,000
€ 4,000
€ 5,000
€ 6,000
€ 7,000
€ 8,000
€ 9,000
€ 10,000
0 2 4 6 8 10Bft
tota
le k
oste
n geen NODVTSVTS en LOAVTS en LABVTS, LAB en PPU
Figure 1: An example of the total costs of entering a port and determination of the best Risk Control Option
The following explanation can be given of the Figure above.
For each risk option (O) such as VTS, Pilot on board etc all the costs are summed up
as follows:
jijiijiji CBFOshipttugsOshiptresourceBFOshipShiptimeBFOshipRisk ,),,(cos),(cos),,(),,( =+++
The graph of jiC . is given above. The option with the lowest costs is the best choice.
In this case, a container feeder of about 150 m with average parameters can enter the
port alone under VTS guidance until BF 7. When there is more wind than indicated by
BF 7 than a pilot on board with a PPU is the best choice under these conditions. One
may also see the effect of tugs by the sudden increase in the graphs. It should be
remarked that using tugs, the risk is reduced by a factor 5 but the costs of tug
assistance are high and for the example ship the costs of the tug(s) are higher than the
risk reduction.
For each vessel such a graph can be constructed. Each port has its own accident
pattern which requires a customizing of the figures to each port’s accident pattern
related to the traffic.
Political implications
The political implications are important:
• Firstly the method might provide a uniform method for all European ports to
determine the level of Navigation Support Services as given by the
harbourmaster or specified in the by-laws of the port. This contributes to a
level playing field on nautical safety matters for European ports. Safety
should not be an issue for competition between ports.
• Secondly it will help reduce costs for those ship owners that really take care of
their ships, their crews and their equipment. For vessels of above medium
standard, the ship risks will decrease and as a consequence often less costly
Navigation Support Services need to be used.
• Thirdly, it also provides a framework for pilot exemption policy of smaller
vessels with the same masters that are regularly callers in a port.
• Fourthly, it assists in reduction of call costs making European ports more
attractive and affecting transport costs to make the “Motorways of the Sea”
more attractive.
• Lastly, application of the method suggested may contribute to a better
distribution model of the pilotage fees. This can be done by minimising the
total risk as a function of different pilot fee distribution models.


1 . Objectives
1.1. General objective
The objective of this report is to show an example of a risk analysis in a port
environment for three European ports.
1.2. Application of FSA in ports and port approaches
There are not many examples of a risk analysis for the determination of the required
nautical services. This one is based on the risk equation developed in Volume 2.
1.3. Risk analysis and risk assessment
When all hazards and associated risks have been identified, the risks will be further
analysed and categorised, to address proper risk control options to mitigate these risks
to a level as low as practicably possible.
For each risk identified, a proper Risk Control Option will be designed so that the
measure involved in practicable and acceptable to all WP-partners. Each RCO is
tested for its risk reducing effect and possible side effects, when integrated into the
Vessel Traffic Management system.
1.4. Costs/Benefits Analyses
Each RCO is further analysed to determine the direct and indirect costs of
implementation and the expected social benefits. The objective is to tune each RCO
so that the control option is applied against reasonable costs and leaves the remaining
risk at a level as low as practicably possible. A feed-back HAZOP meeting, for which
with all WP-partners will be invited, will assess the confidence of the WP-partners
have in the effectiveness of the RCOs.

2 . Target stakeholders
• Harbour masters
• Risk analysts
• Policy makers
• Masters
• Pilotage authorities
• Pilots
• Ship owners
3 . Glossary of terms
ABS American Bureau of Shipping
AIS Automatic Identification System
ALARP As Low As Reasonable Practicable
ATA Actual Time of Arrival
ATD Actual Time of Departure
BV Bureau Veritas
COST Co-operation of Science and Technology
DFl Dutch Florins
DW Dead weight
ECDIS Electronic Chart Display and Information System
EDI Electronic Data Interchange
ETA Estimated Time of Arrival
ETD Estimated Time of Departure
FSA Formal Safety Assessment
GT Gross Tonnage
HM Harbourmaster
IACS International Association of Classification Societies
IALA International Association of Lighthouse Authorities
IBCS Integrated Bridge Control System
IMO International Maritime Organisation
IPPA Innovative Portable Pilot Assistance (IST—1 999-20569)
LR Lloyds Register
NSS Navigation Support Services
NV Norske Veritas
PBA Pilot Boarding Area
PPU Portable Pilot Unit
POB Pilot on Board
RCO Risk Control Option
RIS River Information Services
SAR Search and Rescue [SAR Convention]
SBP Shore Based Pilotage
SSN SafeSeaNet
SWP Sub-Work Package
SWPL Sub Work Package Leader
TEU Twenty Foot Equivalent Unit
UKC Under Keel Clearance
VHF Very High Frequency
VTM Vessel Traffic Management
VTMIS Vessel Traffic Management and Information System
VTS Vessel Traffic Service
VTM Vessel Traffic Management
VTMS Vessel Traffic Management System (the system performing a subset of
VTM tasks)
VTMIS Vessel Traffic Management and Information Services
WAN Wide Area Network
WP Work Package
4 . Analysis
4.1. The navigation process and associated risk
4.1.1. The relation between navigation process and risk
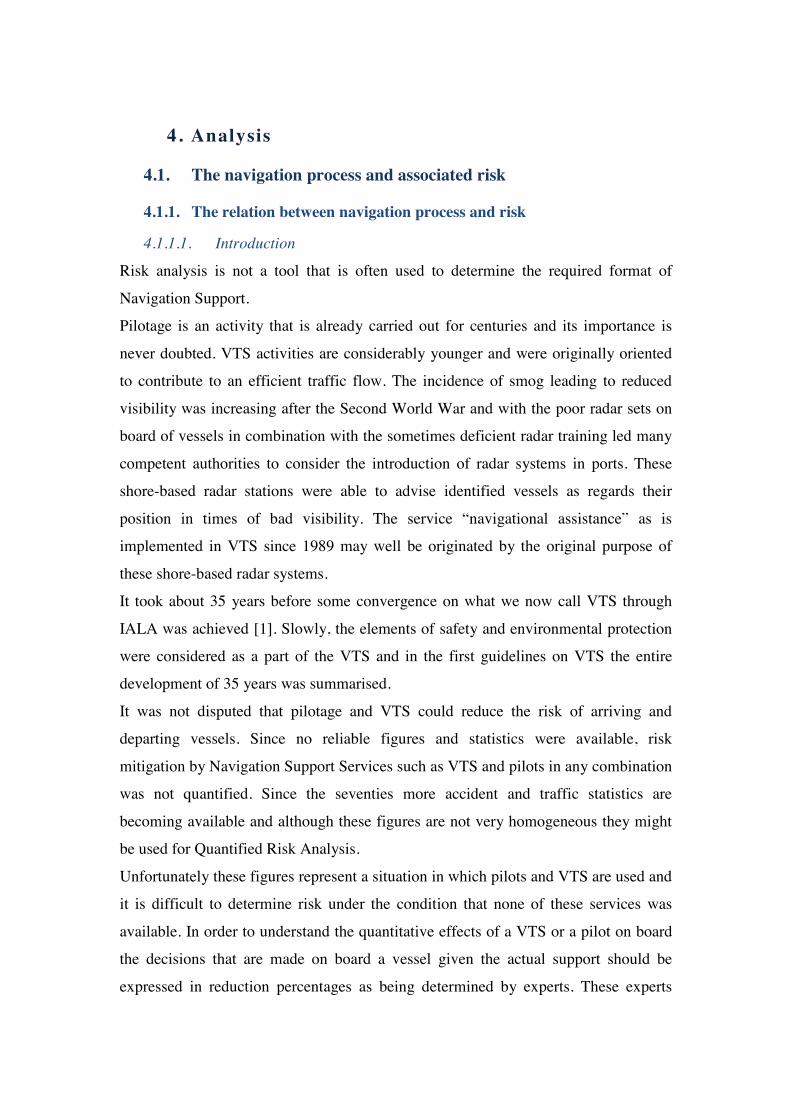
4.1.1.1. Introduction
Risk analysis is not a tool that is often used to determine the required format of
Navigation Support.
Pilotage is an activity that is already carried out for centuries and its importance is
never doubted. VTS activities are considerably younger and were originally oriented
to contribute to an efficient traffic flow. The incidence of smog leading to reduced
visibility was increasing after the Second World War and with the poor radar sets on
board of vessels in combination with the sometimes deficient radar training led many
competent authorities to consider the introduction of radar systems in ports. These
shore-based radar stations were able to advise identified vessels as regards their
position in times of bad visibility. The service “navigational assistance” as is
implemented in VTS since 1989 may well be originated by the original purpose of
these shore-based radar systems.
It took about 35 years before some convergence on what we now call VTS through
IALA was achieved [1]. Slowly, the elements of safety and environmental protection
were considered as a part of the VTS and in the first guidelines on VTS the entire
development of 35 years was summarised.
It was not disputed that pilotage and VTS could reduce the risk of arriving and
departing vessels. Since no reliable figures and statistics were available, risk
mitigation by Navigation Support Services such as VTS and pilots in any combination
was not quantified. Since the seventies more accident and traffic statistics are
becoming available and although these figures are not very homogeneous they might
be used for Quantified Risk Analysis.
Unfortunately these figures represent a situation in which pilots and VTS are used and
it is difficult to determine risk under the condition that none of these services was
available. In order to understand the quantitative effects of a VTS or a pilot on board
the decisions that are made on board a vessel given the actual support should be
expressed in reduction percentages as being determined by experts. These experts

comprise VTS-operators, masters, and pilots as well as staff officers of the
Harbourmaster.
They all might have an idea of the reduction in risk when the way in which navigation
decisions are effected by a VTS and a pilot is properly recognised.
4.1.1.2. Effect of VTS o the decisions of a navigator
The VTS will have an effect on the immediate decisions taken on board, through
proper and timely provision of information that affects tactical decision making on
board. Traffic organisation may also reduce risks by avoiding difficult encounter
situations at locations where such encounters produce more risk. Experts may be able
to determine the reduction percentage based on a mental model that is represented in
the diagram where a VTS affects the navigation.
4.1.1.3. Effect of a pilot on the decisions of a navigator
The pilot will have effect on the immediate decisions and partly on tactical decisions
in so far he is able to get a more general view of the traffic situation when he is
located on the bridge of a vessel. He might be able to improve the manoeuvres of the
vessel since his local knowledge and his experience may reduce the risk of the vessel.
Experts may be able to determine the reduction percentage based on a mental model
that is represented in the diagram where a pilot affects the navigation.
4.1.1.4. Pilot exemptions
In many ports a regime of exemptions is implemented. The basis of these schemes is
the idea that when a vessel with the same master arrives regularly the experience
accumulated by the master is sufficient to safely navigate the port. This would reduce
the associated risk. There are two important external variables:
• The knowledge of the lay-out of the port: This includes the wind effect exerted on
the vessels as well as the currents.
• The knowledge of the communications in the port, either with the harbour
master’s office or the VTS is essential for a safe passage.
It is assumed that masters of smaller Lo-Lo vessels and Ro-Ro vessels will have
sufficient experience and can maintain their experience, if they sail the port at least

10-15 times a year. For each port different thresholds apply. In general, exemptions
will not be given when the vessel is larger than 140 -150 m. Lo-Lo vessels and Ro-Ro
vessels generally have a large windage and when the wind blows more than BF 6
most vessels of more than 140 m in length need to use a tug. Tug handling is seen as
the domain of the pilot in many ports. Exceptions are Ro-Pax ferries which normally
have sufficient manoeuvring means to berth and un-berth without tugs up to Beaufort
A requirement for exemptions is that the communication and navigation equipment
should be in full working order. Deficiencies should be reported to the
harbourmaster’s office and the harbourmaster will decide which measures are
necessary to compensate for the deficiencies.
In many smaller ports, the harbourmaster personally assesses the master whether has
sufficient local knowledge by an oral examination followed by a trip on his vessel.
Often pilots are used to assess the master in larger ports supervised by representatives
of the harbourmaster’s office. In some larger ports this examination is difficult and the
time spent to study the material by the master is often wasted. The number of
exemptions in a large port is minimal and the number of failures following
examination is large.
It is further to be noted that a vessel is never exempted, but the combination master-
vessel. This also implies that if the vessel is commanded by another master the
exemption is not valid. The new combination has to pass the examination if the vessel
satisfies the criteria.
4.1.2. Information in relation to the required Navigation Support Services
In the preceding chapter the effect on risk reduction of VTS and pilot are discussed.
The effect of these elements (services) can be given in a reduction percentage of the
risk of a vessel as compared to the risk when none of these elements is present. This
chapter looks to the risk of a vessel that calls at a port. The factors that contribute to
the risk are summarised and briefly discussed.
The probability to be involved in an accident of vessels is not known other than in
general terms. Accidents can be categorised in terms of ship types and ship sizes.
They may be compared by the exposure that is generated by the vessels. This leads to
a casualty rate. It cannot be assessed whether or not a vessel will have more or less
than the average probability using accident databases or even PSC databases. Below
an attempt has been made to determine which factors affect the probability of
accidents. If it were possible to derive the risk in a number of factors that contribute to
risk, it should be possible to ask experts about their opinions on the numerical values
of the factors in case they were given a certain ship.
4.1.3. Risk Analysis
The next equation indicates the risk of a vessel in a port
CFrisk *= Equation 1
In Equation 1 is:
F = frequency of an undesired event in 1/year. This is also often called the accident
frequency.
C = sum of adverse consequences of the vent expressed in monetary terms.
The assumption of this risk analysis is that the original risk (base line risk) is
calculated under the proviso that no nautical support is provided. The next steps
contain the risk reduction that will apply when subsequently, VTS, VTS and SBP,
POB, and VTS with POB is applied. These options are called Risk Control Options
(RCOs).
It is assumed that when a measure is applied the frequency of accidents will reduce.
The consequences of an accident are assumed to be the same. Although this
assumption is not fully correct, since for example a pilot on board a vessel can
contribute to the reduction of the consequences of an accident more than the navigator
on board, for the sake of simplicity this assumption is accepted. Accident databases
don’t contain information for a more detailed analysis of the effect of a RCO on the
consequences.
4.1.3.1. Frequencies or accident probabilities
Frequencies of accidents can be determined from accident databases. In this report we
will use some data from a Dutch database [2] to illustrate a risk method to determine
the best RCO.

Additional data are provided by the Lloyds database. Database data will become
useful if we are able to relate the accident data to a certain measure that describe the
traffic flows.
For each type of accident such as grounding, collision and fire a special exposures can
be defined. For collision this exposure is the encounter. An encounter is defined when
vessels are closer to one another a predetermined distance.
The calculation of encounters requires a precise description of the traffic flow, also
with respect to the path a vessel follows. These traffic patterns are most of the time
not available. Furthermore in small ports the number of encounters is very small. This
is the reason to simplify traffic calculations to the calculation of the nautical miles
sailed.
The accident ratio is the ratio between the occurence of an accident of a specified type
per nautical ship-mile.
To determine the number of expected accidents in a port we calculate the number of
ship-miles for each category and size of vessel. The calculated number of ship-miles
is to be multiplied by the accident ratio.
4.1.3.2. Consequences of accidents in a port
The assessment of the consequences of an accident may be based on different
scenarios. The authorities want to have a look to the societal consequences, in other
words the negative aspects of transport for society. These consequences are mainly
the number of casualties and injured people and the effects on the environment due to
dangerous substances that may be released in an accident into the water or into the
atmosphere.
However, these consequences are not sufficient in a port. Undesired effects may
endanger the infrastructure. These events may also render the port’s facilities
unusable during a given time, affecting the revenue of the port and its users.
Damages to a vessel and its cargo needs also be taken into account, as well as the loss
of income to a ship owner when he is unable to use his ship for a certain period,
The suspension of the fairway due to an accident should also be taken into account, in
particular the damage to ship owners for waiting until the vessel can use the port’s
facilities again.
In summary, the following adverse consequences are considered:

• Fatalities and the societal costs of fatalities (D);
• Injured people and its societal costs (G);
• Release of dangerous substances and their effects on the environment, such as
their degrading effects, including cleaning up costs (UIT);
• The costs of fairway suspensions (S);
• The costs of damages to the infrastructure (I);
• The costs of damage to ships and cargoes (SS).
4.1.3.3. Parameters that describe the accident ratios of vessels
The accident rate is affected by a number of parameters: these parameters are called
risk effect factors.
In fact there are three types of risk effect factors:
• Those which affect the frequencies of the accidents;
• Those which affect the consequences of the accident;
• Those which affect both.
As an example we take GPS. An accurate positioning of the vessel will reduce the
probability of stranding which is the result of inaccurate positioning. GPS can thence
be considered as a risk reduction factor working on the frequency of grounding. In the
case that a grounding accident does happen, the consequences are not reduced.
A double hull in a tanker will by slow speeds avoid a spill when only the outer hull is
penetrated. But a double hull doesn’t have any effect on the frequency of for example
grounding.
We divide the risk effect factors in three basic categories:
• Crew;
• Vessel; and,
• Environment

The modelling technique is not capable of determining the accident ratio as function
of external parameters and it is probable that given the complexity of the problem we
will never arrive at a solution. In the Annex an overview is given of the different risk
factors in order to illustrate the complexity of the model and the large number of
parameters that play a role in an accident causation model.

4.2. Methodology of a FSA
4.2.1. Introduction
The methodology of a FSA has been explained in [3]. In order to understand the
mechanism that is adopted in this report, the principles of the selection method of a
certain Navigation Support Service is illustrated for a vessel calling at or departing
from a port. The principle is to determine risk costs, cost of ship’s time and the costs
of a RCO.
A number of elements play a role:
• Risk costs of a vessel;
• Costs of time of the vessel;
• Costs of the different Navigation Support Services (RCOs).
4.2.2. Cost categories
The risk costs are the costs of a vessel based on the frequency of an accident and the
consequences of such accident. The risk costs are reduced by applying a Risk Control
Option. Different RCOs are taken such as:
• None;
• VTS;
• VTS and exemptions;
• VTS and SBP;
• VTS and POB;
• POB;
• VTS and POB and PPU
The reduction factors that are applied are the results of the experts’ opinions. These
opinions are collected in special sessions in a number of ports in the project
EMBARC.
The costs of time of the vessel are calculated based on a number of assumptions. The
day costs are calculated from three components:
• Capital costs;
• Crew costs and administrative costs;
• Fuel costs;
The efficiency of the different RCOs is taken into account by a calculation of the time
that is needed for every RCO and is also taken as a function of weather, simplified by
the BF number.
The costs of the different RCOs are determined for each port. It concerns the costs of:
• Pilotage;
• VTS;
• Tugs;
• Mooring
4.2.3. Selection of a RCO using ALARP
The different cost components are determined for each RCO. These costs are
determined from the point of view that the user pays for the services rendered. This
means that we take the point of view of the owner of the ship and he pays for the
services he desires or which are mandatory to take according to the by-laws. This also
means that if the charges of a service are not commensurate with the quality of the
services rendered because of a subsidy of the competent authority, the total costs of
the RCO are then not taken into account. This problem is evident in case of the costs
for a VTS. In many ports VTS services are not separately invoiced and are catered for
in the pilot dues. Other services are often charged in a way that the user pays for the
integral services, such as tugs an mooring services.
The best RCO is now that RCO which shows the minimum total costs. This option is
not necessarily the best option in risk reduction terms. It is, however, the option that
uses the principle of ALARP. This principle indicates the best option that reduces the
risk to a tolerable level with reasonable costs.
4.3. Introduction to the determination of the risk reduction parameters using experts opinions
4.3.1. Introduction
In the Annex part overview is given of all factors that might affect the risk of a vessel.
Risk should be seen as consisting of two components: frequency and consequences.
The frequency of undesired events is determined by databases. An accident database
is used to identify the different types of accidents and the number of accidents in a
given period of time. A traffic database is necessary to determine the so-called
exposures. These exposures indicate the number of possible difficult events (for
example encounters for collisions and ship-miles for engine failures) that are
proportional with a given type of accident. However the resulting casualty rate is not
sufficient to characterise each and every vessel. The casualty rate describes the
average vessel not an individual vessel. If we are able to quantify the different
elements of risk of a vessel by using the identified factors, we may be able to
determine the risk. Many of the effects cannot be quantified and in those cases
experts’ opinions are used to determine the various parameters. Wind and visibility
affects the risk to a large amount. They can be determined as multiplication factors
from accident records. The large dependence of risk of the weather effects made it
also clear that the allocation of a certain RCO may vary with the weather. The same is
true but to a lesser extent with visibility. These parameters are so important that we
will express all effects of a RCO and the risk of the vessel in terms of Beaufort
number in order to have an overview when another RCO is required.
The consequences are also modelled in three categories:
• Loss of life
• Pollution
• Material damage (to ship and as the case might be, to cargo)
Monetary terms are being used to express risk. For loss of life the willingness to pay
method is used with a value of M€ 2/life.
The FSA is now applied as follows: for each vessel the risk will be determined, partly
by databases to get the average values and partly using expert opinions. The
exposures should be calculated to determine the number of ship-miles sailed and
number of encounters are estimated of the voyage of the vessel from the Pilot
Boarding Area to the berth. The risk in monetary terms is now known.
The vessel has been provided with a certain Risk Control Option. The effects of this
RCO need to be determined. These effects consist of effects on safety and also on
efficiency. The risk reduction might be determined. Not too many studies give
reduction factors for different RCOs. Some studies indicate that the effect of a VTS is
about 30% reduction in risk and for a VTS with a pilot about 50%, but these values
seem to be very general and not very specific for a port.
What we need is that experts estimate the reduction factors of the different RCOs. It
was thought that they are able to do it based on their internal mental model. An
internal model is a representation of the effect of some RCOs. An internal model is
constantly adapted by the experience gained in an actual operation.
Different experts were used:
• VTS-operators;
• Pilots;
• Harbourmasters;
• Masters;
• Policymakers
The VTS operators have a model of general behaviour of vessels and their encounters
and their mental model is often oriented to a more bird’s eye view type of model.
The pilots will have more detailed models about the vessel’s navigation and the way
in which they use external conspicuous points for the waypoints of the desired track
of the vessel. They take account of the weather conditions.
Harbourmasters have mental models that are more service oriented (and sometimes
the lack of services due to a shortage of resources) and they also deal with the quality
of vessels.
Masters have mental models that are used for comparison of navigation support in
different ports.
Policymakers have models that are often oriented to the usefulness of services and
their costs, but are often not capable of making estimations of the effects of RCOs.
They often miss the capability of using a mental model to make predictions on safety
levels, since the intricate mechanisms of deriving conclusions from scenarios are not
developed. They have restricted experience in using mental models, but often strong
will to reach their objectives.
The experts determine the effect of the risk reduction and they are also asked to
determine differences in efficiency of the movement of the vessel under different
RCOs.
For each RCO a set of data exists that reduces the risk and reduces the passage time.
These values should be expressed in monetary terms. For the risk reduction this is
simple. The reduction percentage is applied on the risk without a RCO. For the
efficiency part this is a bit more tedious, since the extra ship time needs to be
converted in monetary values. This is possible when we are able to determine the day
costs of a vessel.
The costs of a RCO can be more easily estimated. The costs of a VTS can be thought
to be proportional to what a ship-owner pays as a VTS charge. In some countries VTS
charges are not covering the total costs of VTS and they are only covering that part
which is used for sea going vessels in case when seagoing vessels and inland vessels
mix in a port. In those countries where a VTS levy exists, the calculation is simple. In
the discussion on the method we will deal with cases where the levies are only a part
of the real costs.
The costs of pilotage and the costs of tugs in so far they are required can be
calculated. It should be remarked that, if under all RCOs the number of tugs is the
same, it is useless to retain them. However, the weather effects are very dominant and
the number of tugs to be used is dependent on the weather.
When all the costs are known for all RCOs under all weather conditions we will try to
find that solution for a RCO that minimises the costs for a ship owner. This has been
done on purpose, because the ship owner is paying the bills for the navigation
resources.
Some practical rules are built into the system. One of them is that a master will not be
allowed to use tugs without a pilot.
It will be seen that when the wind force increases the required RCO will often change.
The solution with the minimum costs will be the selected one. It is to be remarked that
this is not always the minimum risk solution. Situations may occur that the costs of
more resources are higher than the risk reduction. The principle followed is typically a
case of the best risk reduction for a certain amount of money.
4.3.2. Experts’ opinion meetings
Three expert meetings were organised in the period 2001-2004.
In both cases VTS-operators, pilots, officials of the Harbourmaster office and masters
were invited.
4.3.3. Results of experts’ opinion meetings
4.3.3.1 Navigation Support Services
The model that is developed requires that for each cluster variable an indication is
given in what way the RCOs can improve the risk. The following Navigation Support
Services are considered:
• VTS;
• VTS and Exemptions;
• VTS and Shore Based Pilotage;
• Pilot on Board;
• VTS and Pilot on Board;
• VTS , Pilot on Board and a PPU;
• VTS, 2 Pilots on Board and special accurate Harbour Approach Systems
The reason for these options is as follows. Many European ports have VTS that is
used to enhance safety and efficiency. It is assumed that if a VTS is present all vessels
are obliged to use the VTS. The VTS will then provide information to the vessel and
if required instructions. The functionality of the VTS is according to the IMO
guidelines for VTS, resolution A857 of Sept 1996 [5]:
• Information services;
• Navigational Assistance;
• Traffic Organisation Services
Apart from this, a VTS may have tasks for enforcement of the navigation rules and
they might have a task in Calamity Abatement Information Services. This is
dependent of the way in which VTS is embedded in the national regulations.
VTS and exemptions are applicable in many ports where regular callers have the
possibility to obtain an exemption of mandatory pilotage. In many ports bye-laws
based on national law rule the necessity of a pilot on board the vessel. When the
navigator has obtained sufficient experience in one year by making sufficient calls
and he has passed an examination he may be exempted for the use of a pilot. It is to be
remarked that the exemption is valid for the combination of vessel and master, not for
each of these elements individually.
In some countries shore based pilotage or remote pilotage is used. In many countries
this is only possible under conditions where a pilot is unable to board the vessel in the
Pilot Boarding Area. The pilot usually boards the vessel at a location where boarding
can take place without too large a risk for the pilot. In some countries a more
fundamental approach is under debate, where always, and not only in bad weather
remote pilotage services should be provided. The background is that it is thought that
the services are provided more efficient and cheaper and that this would facilitate the
ship owners. It is to be remarked that the concept as it is seen by some officials is that
the shore based pilot will operate under the responsibility of the VTS-operator. The
latter remains responsible for the overall traffic picture and he oversees strategically
the activities of the shore based pilot whose task it is to assist in the navigation of the
vessel.
When dealing with the ports of Genova and Göteborg as compared to Dutch ports a
large difference became apparent. Göteborg and Genova receive a lot of Ro-Ro and
ferry traffic. These vessels are regular callers in Genova and Göteborg and
exemptions from the mandatory requirement to take a pilot on board are frequently
given in these port.
In Genova, these vessels will receive some kind of VHF guidance given by a pilot. In
Figure 2 this is categorised as remote pilotage. The original RCOs as being used for
the expert opinion capture meeting in the Netherlands need to be extended with the
RCO; “VTS and exemptions”. Since this item was not discussed in the Netherlands,
in the following Figures the line connecting the different options is discontinuous for
the Netherlands. This item is not applicable for Genova and again the information is
not relevant.
In many small ports the question of the establishment of a VTS is debated because it
is believed that the costs of such a facility will not be commensurate with the benefits.
In those cases the use of a pilot is indispensable when vessels have to deal with
difficult navigational conditions in the fairways to arrive at the berth. It is also
interesting to see whether the combination of a VTS and a pilot on board as a working
system is containing synergy in terms of safety that the simple addition of VTS and a
Pilot on Board.

VTS and the Pilot on Board is for many ports the most common configuration.
Certainly in the larger ports this combination is seen as the best possible guarantee for
enhancing safety and efficiency.
In the last decade the use of a PPU is becoming popular among pilots. First of all in
areas where not many Aids to Navigation are positioned, but where accurate position
information is required PPUs may provide valuable information. The PPU was
introduced by some pilotage organisation in larger and busier ports. The use of a PPU
brings the information on which the navigator in a port bases his decisions close to the
location where these decisions should be made.
It is thought that a PPU would be able to improve the quality of the navigation
decisions and improve the timeliness of this information. Its use also removes the
errors that are inescapably connected to oral communication in a port, due to failures
in equipment, hick ups in propagation conditions, difficulties in interpretation of
wording due to bad formulation and due to language problems.
The last option is a typical option for a channel for deep draft vessels, such as for
example the approach to the port of Rotterdam using the Euro channel. In those cases
two pilots are used. One pilot checks the position of the deep draught vessel in the
centre of the channel and the other is in charge of the general navigation of the vessel.
The position of the vessel is given with high accuracy position equipment, since each
navigation error may lead to grounding in the edges of the channel with high
probability of spill when the large vessel is a laden VLCC.
The probability of a collision with a smaller vessel that crosses the deep sea channel is
also not to be negated. This is where a VTS–operator may have the power to give
instructions to a vessel that endangers the progress of such a deep draft vessel and
invokes a collision avoidance action which cannot be made with a deep draft vessel in
a channel. This is a particular condition for a port with a channel outside and these
conditions don’t apply to the ports of Göteborg and Genova.
Figure 2 indicates the final results of the different types of NSS as found through the
opinions of all the stakeholders in the three ports.

Figure 2: Average improvement for the NSS variables for three locations in the Netherlands, Göteborg and Genova.
The results are interesting in the sense that some general ideas about the risk reduction
capabilities can be derived. The effect of a VTS in risk reduction is estimated at about
19% in Rotterdam, but 32% in Göteborg and 37% in Genova. For a VTS and POB,
which may be considered as the most frequent RCO in European ports, the port of
Rotterdam thinks that the risk reduction effect is 44%, in Genova about 45% and in
Göteborg 52%.
These results are very interesting since it appears that the VTS in Rotterdam interacts
more with the traffic than elsewhere. From this perspective one may expect that if
much information is provided that the number of accidents will decrease and the risk
reduction may be higher.
When the Figures of the VTS and POB are compared and the effect of the VTS is
eliminated (provided that the effects are linear) the influence of the pilot is assessed
highest in the port of Rotterdam say about 26%, in Göteborg about 20% and in
Genova only a disappointing 8%.
These Figures are not well supported when the distribution of activities between VTS
and Pilots are considered in the different ports.
Improvement NSS
0.0
10.0
20.0
30.0
40.0
50.0
60.0
70.0
VTS
VTS+E
xemp
VTS+S
BPPOB
VTS+P
OB
VTS+P
OB+PPU
VTS+2
POB+HANAS
NLGOTGENAverage

4.3.3.2 Efficiency of ship calls in a port
Speeds in ports
Speeds in ports are assumed to be affected by the nature of the type of Navigation
Support Services. It is assumed that if there is less interaction of the shore or when
there is a pilot with local knowledge on board the speed of the vessel will be larger. In
general two speed regimes are assumed in the ports considered. The first aspect is the
speed in the fairways and approaches. The second aspect is the speed in the basins and
near the berths. Generally speaking the fairway speed is assumed to be 50 to 70% of
the service speed of the vessel. The speeds in the basins are assumed to be about 20 to
25% of the service speeds. A speed reduction factor is now defined to indicate the
speed loss as function of the Navigation Support Service that is rendered.
The experts were asked to indicate this speed drop factor which should be used with
the predetermined speeds in the fairway and the basins/docks.
The situation in Rotterdam is rather clear. The vessels go to the PBA pick up the pilot
and then navigate to the moles and in the port. If they go to the more Eastern basins
they will have a rather large speed in the fairway called the “Nieuwe Waterweg”
(New Waterway). When they are close to the mouth of the basin of their destination
they reduce speed, tugs are made fast as required and the vessel manoeuvres in the
basin to its final berth.
The situation in Göteborg is not much different. The vessel picks up the pilot and sails
through the littoral sea to the mouth of the river Göta. When the vessel is near its
berth, most of the time still on the river Göta the vessel reduces speed turns and
approaches the berth. The two speeds assumed are for the fairway and the last part of
the trip.
In Genova, as a result of the lay-out of the port three port access channels are
available: the old port (Porto Antico), the terminal of Voltri and the oil port of
Multedo. These three areas are seen as basins and the fairway is the location where
the pilot boards the vessel when it is destined for one of these areas. The pilot
boarding area is then variable and depends on the destination of the vessel. It is
assumed that the pilot boards at a distance of 5 nautical miles out of the entrance but
in many cases for smaller vessels this distance may well be smaller.
The results of the opinions of the experts for the speed are given in the following
Figure.
speed drop as function of NSS
0.0%20.0%40.0%60.0%80.0%
100.0%120.0%
No
RC
O
VTS
VTS+
Exem
p
VTS+
SBP
POB
VTS+
POB
VTS+
POB+
PPU
VTS+
2PO
B+H
ANAS
NSS
Perc
enta
ge o
f orig
inal
sp
eed
av GotBF0
av GenBF0
av GotBF7
av GenBF7
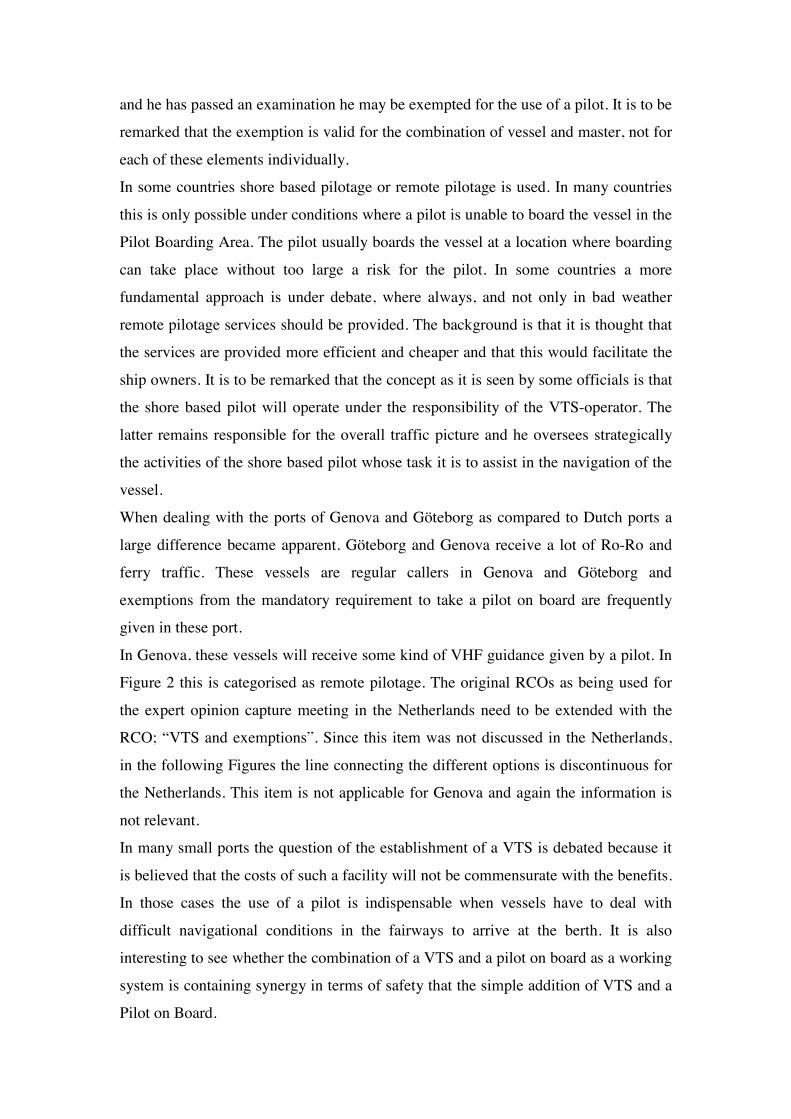
Figure 3: The speed drop factor in Genova and Göteborg for different wind forces and different Risk Control Options
It is shown that the experts in Göteborg are estimating a somewhat lower speed drop
than the experts of Genova. The lay-out of the factor can easily explain these
differences. This trend continues for a higher wind speed.
The results of Rotterdam were not available.
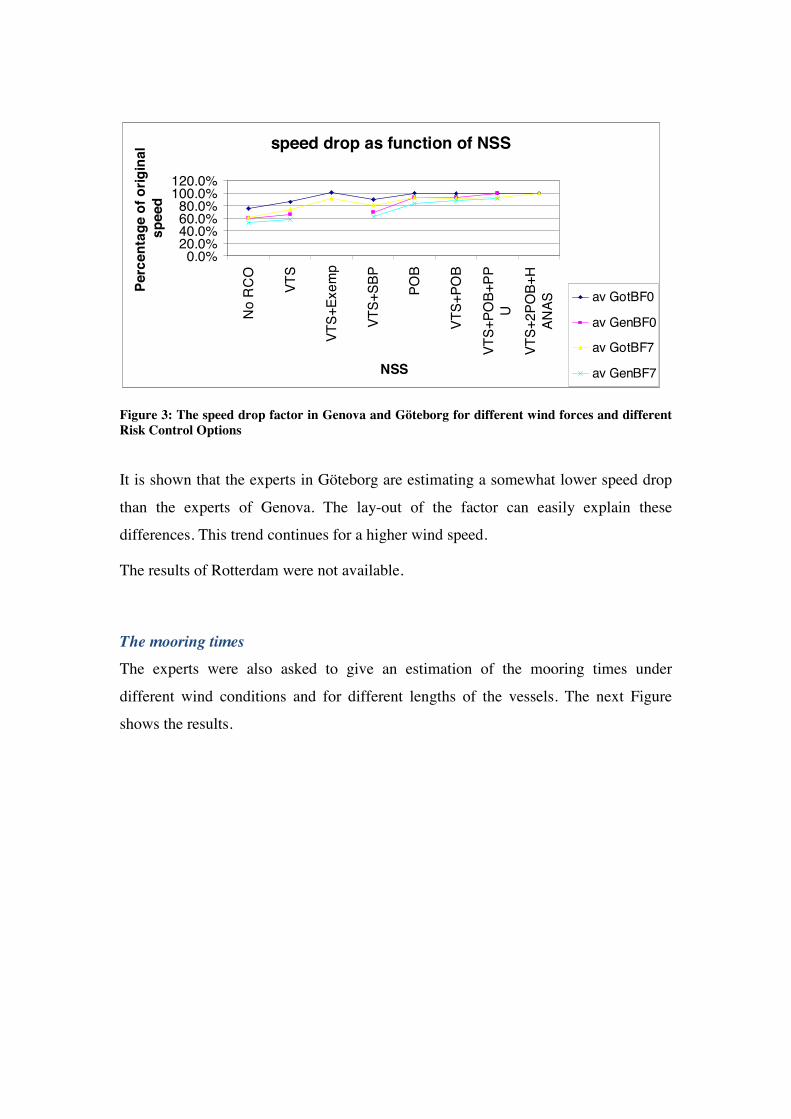
The mooring times The experts were also asked to give an estimation of the mooring times under
different wind conditions and for different lengths of the vessels. The next Figure
shows the results.
Mooring times in minutes in Goteborg and Genova
0.010.020.030.040.050.060.070.0
BF=0 BF=4 BF=8
avGot100avGen100avGot200avGen200avGot300avGen300
Figure 4: Mooring times for different ship lengths and wind conditions
The results are rather similar with the exception of the smaller ship lengths. The
average values are used to check the relationships that are assumed in the efficiency
sections of the report.
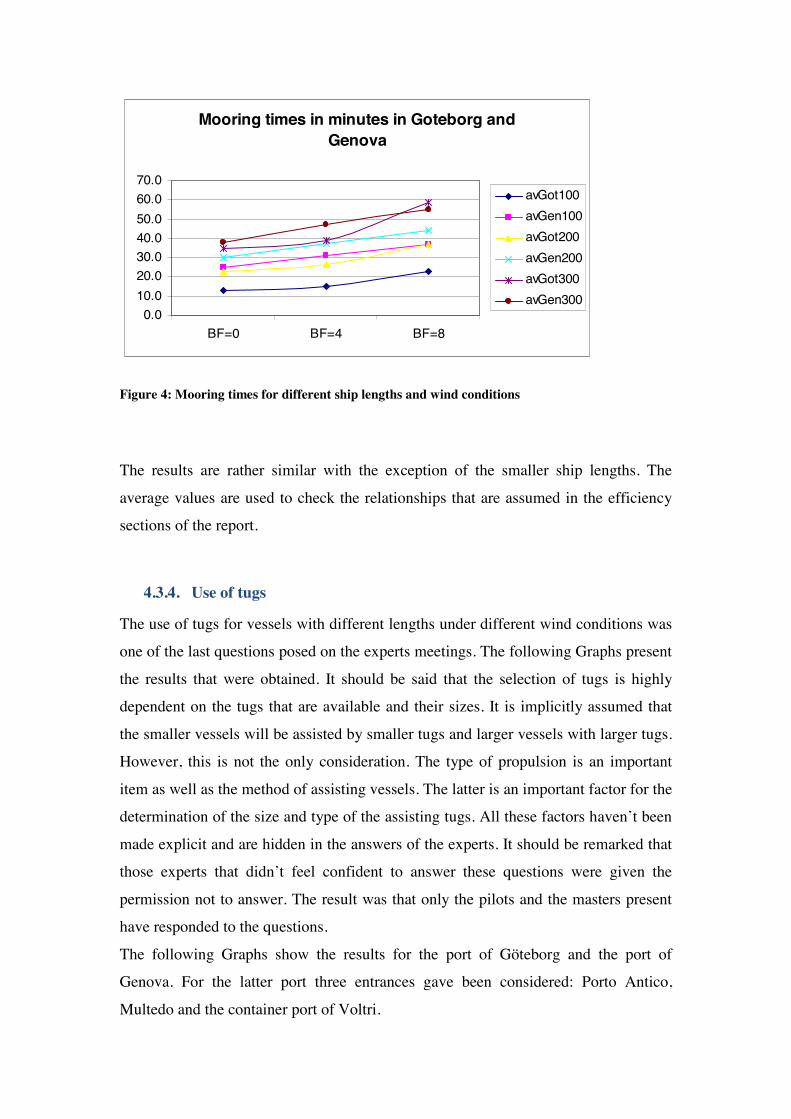
4.3.4. Use of tugs
The use of tugs for vessels with different lengths under different wind conditions was
one of the last questions posed on the experts meetings. The following Graphs present
the results that were obtained. It should be said that the selection of tugs is highly
dependent on the tugs that are available and their sizes. It is implicitly assumed that
the smaller vessels will be assisted by smaller tugs and larger vessels with larger tugs.
However, this is not the only consideration. The type of propulsion is an important
item as well as the method of assisting vessels. The latter is an important factor for the
determination of the size and type of the assisting tugs. All these factors haven’t been
made explicit and are hidden in the answers of the experts. It should be remarked that
those experts that didn’t feel confident to answer these questions were given the
permission not to answer. The result was that only the pilots and the masters present
have responded to the questions.
The following Graphs show the results for the port of Göteborg and the port of
Genova. For the latter port three entrances gave been considered: Porto Antico,
Multedo and the container port of Voltri.
Number of tugs for vessels of 10,000GT
0.000.501.001.502.002.503.003.50
BF=0 BF=1 BF=2 BF=3 BF=4 BF=5 BF=6 BF=7 BF=8 BF=9
BF scale
NU
mbe
r of t
ugs
GotVoltriMultedoAntico
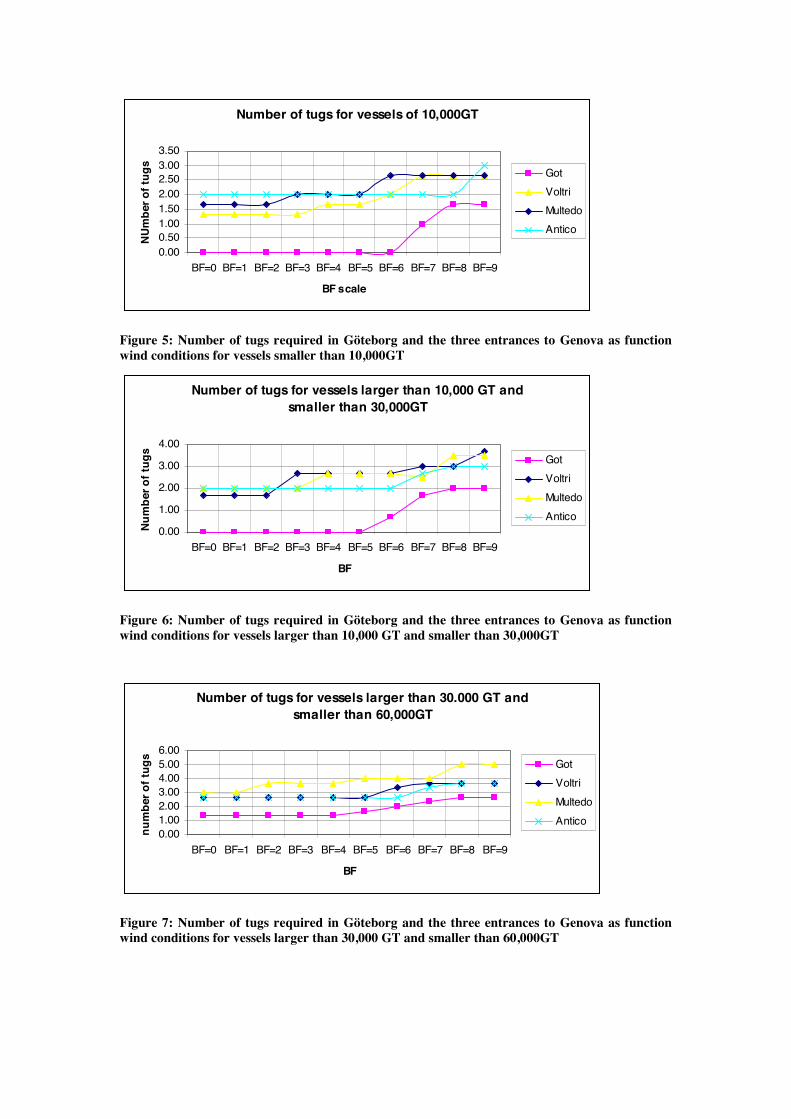
Figure 5: Number of tugs required in Göteborg and the three entrances to Genova as function wind conditions for vessels smaller than 10,000GT
Number of tugs for vessels larger than 10,000 GT and smaller than 30,000GT
0.00
1.00
2.00
3.00
4.00
BF=0 BF=1 BF=2 BF=3 BF=4 BF=5 BF=6 BF=7 BF=8 BF=9
BF
Num
ber o
f tug
s
GotVoltriMultedoAntico
Figure 6: Number of tugs required in Göteborg and the three entrances to Genova as function wind conditions for vessels larger than 10,000 GT and smaller than 30,000GT
Number of tugs for vessels larger than 30.000 GT and smaller than 60,000GT
0.001.002.003.004.005.006.00
BF=0 BF=1 BF=2 BF=3 BF=4 BF=5 BF=6 BF=7 BF=8 BF=9
BF
num
ber o
f tug
s
GotVoltriMultedoAntico
Figure 7: Number of tugs required in Göteborg and the three entrances to Genova as function wind conditions for vessels larger than 30,000 GT and smaller than 60,000GT

Number of tugs for vessels larger than 60,000GT and smaller than 100,000- GT
0.00
2.00
4.00
6.00
8.00
BF=0 BF=1 BF=2 BF=3 BF=4 BF=5 BF=6 BF=7 BF=8 BF=9
BF
Num
ber o
f tug
s
GotVoltriMultedoAntico
Figure 8: Number of tugs required in Göteborg and the three entrances to Genova as function wind conditions for vessels larger than 60,000 GT and smaller than 100,000GT
Number of tugs for vessels arger than 100,000 GT
0.001.002.003.004.005.006.007.00
BF=0 BF=1 BF=2 BF=3 BF=4 BF=5 BF=6 BF=7 BF=8 BF=9
BF
Num
ber o
f tug
s
GotVoltriMultedoAntico
Figure 9: Number of tugs required in Göteborg and the three entrances to Genova as function wind conditions for vessels larger than 100,000 GT
The lines don’t represent integer number of tugs as would be the case in reality. This
is due to averages that are used. The standard deviations are also reasonably large;
indicating that among the experts there was no uniform opinion
It is clear that large differences are apparent in Genova between the different
entrances. The container terminal of Voltri can be reached using fewer tugs than when
oil tankers are going to Multedo.
The results of Göteborg are more or less comparable with Porto Antico in Genova for
the larger size classes. For the smaller size classes for Porto Antico more tugs are
required by the pilots.
4.4. Costs of time of ships and costs of Risk Control Options
4.4.1. Vessels
4.4.1.1. Introduction
When a risk analysis is executed from the point of view of the ship owner the costs of
ship time are an important parameter. The time that can be saved using a specified
RCO needs to be taken into account. For this purpose a model to determine the ship’s
costs is developed in a parametric way. First, the different types of vessels should be
specified. For the present study the following vessels are selected:
• Chemical tanker;
• LNG carrier;
• Reefer;
• LPG tanker;
• Ro-Ro vessel with unguided chassis on board;
• Ro-Ro vessel with guided chassis on board;
• Container vessel;
• Product tanker;
• Crude carrier;
• Bulk carrier;
• General dry cargo vessel
4.4.1.2. Dimensions
In order to deal with all sizes of vessels it is required to develop a parametric
representation of the important characteristics of a vessel. The input variable should
be the length of a vessel. The following characteristics are considered:
• GT;
• TEUs / Deadweight/ gas volume /refrigerated volume as appropriate;
• Speed;
• Summer draft;
• Displacement;
• Horse power of the vessel;
• Building costs;

The parametric relations are determined from consolidated characteristics for the type
of vessels that are defined in the preceding Section These characteristics are based on
average ship characteristics as given by the register book of LR. A matrix was
designed for all vessel types and for 9 size classes.
An example of these relations for a container vessel is given below:
type A B C
GRT 1.1139 -124.15 3913.6
Number of
TEUs 0.0646 -6.9144 265.75
Speed 0 0.0562 8.6829
Draught -0.00007 0.066 0
Displacement 1.4598 -90.085 1400.8
APK 1.2333 -126 3918.1
Fuel
consumption 0.0035 -0.3187 8.814
Table 1: Coefficients of polynomial; approximation of major characteristics for a vessel
The format of the equation is in this case:
CBxAxy ++= 2 Equation 2
Other regression formats are also used and the one which fits best are used.
4.4.1.3. Day costs of vessels, sailing and at the berth
The following Table indicates the way in which for this vessel the day costs at sea and
in a port are calculated.
The following values were calculated for a container vessel with a length of 120 m.

TEUs 366 TEUs
Building costs 6,928,355 Euro
Gross Tonnage 5,056 GT
Speed 15.43 knots
Draught 6.91 m
Displacement 11,612 m^3
Power of main
engine 6,558 HP
Fuel
consumption 21.25 tons/day
Table 2: Results of the calculation of the characteristics of a container vessel
These characteristics were transformed to the day costs using a number of additional
parameters regarding insurance, repair, administrative costs and extra crew for a
100% occupancy of the vessel throughout the year.
The following additional parameters are used:
Additional parameters
interest rate 8.00% Per year
repair year 1 2.00% of building costs
insurance 2.50% Of building costs
administration 30.00%
Of crew, repair and
insurance costs
Remaining value 10.00%
Value after lifecycle of
the vessel
additional crew 30.00% Reserve crew
fuel costs 240 Euro/ton
addition for social
security 30.00%
Surcharge on crew
salaries
port fuel 20.00% Percentage of sea fuel
Table 3: Additional costs parameters

The next Table shows the calculation of the day costs of this container vessel.
Calculation of day costs
building costs 6,928,355 Euro
life cycle 15 year
capital costs 2,091 Euro/day
crew costs 466 Euro/day
repair costs 380 Euro/day
insurance 475 Euro/day
administration 396 Euro/day
fixed costs 3,808 Euro/day
# sea days 146 day/year
# port days 204 day/year
fuel at sea 5,099 Euro/sea day
fuel in ports 1,020 Euro/port day
costs per sea day 8,907 Euro/sea day
costs per port day 4,828 Euro/port day
costs per sea hour 371 Euro/sea hour
costs per port hour 201 Euro/port hour
Total costs 2,285,299 Euro/year
Table 4: Calculation of day costs for a container vessel
4.4.1.4. Crew costs
The crew costs depend on the number of crew of the vessel. Minimum manning
Tables are used to determine the number of crew. For container vessels the next Table
shows the number of crew required.
Number of crew GT >=100 <1600 <30000 <100000 from
GT <500 <1000 <10000 <60000 100000
GT 300 750 1300 5800 20000 45000 80000 150000 total 5 7 9 12 16 20 22 24 officers 2 3 4 5 7 8 10 10 crew 3 4 5 7 9 12 12 14
Table 5: Crew table for container vessels as function of size in GT
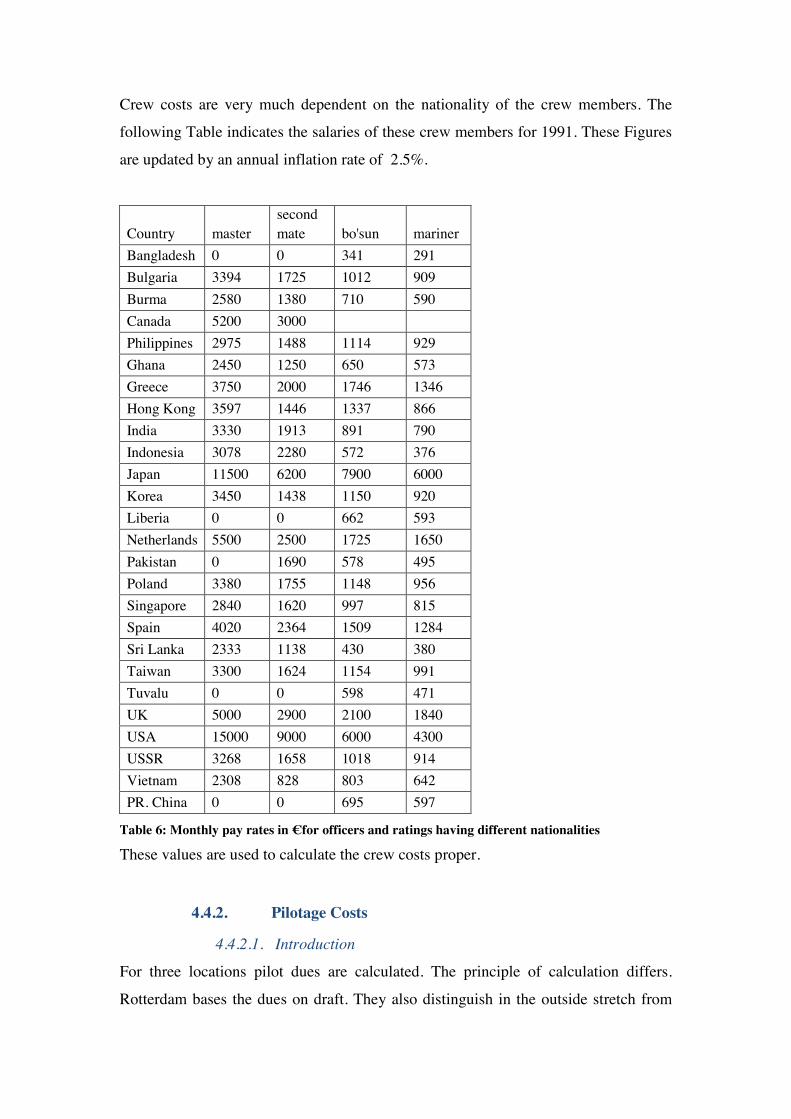
Crew costs are very much dependent on the nationality of the crew members. The
following Table indicates the salaries of these crew members for 1991. These Figures
are updated by an annual inflation rate of 2.5%.
Country master second mate bo'sun mariner
Bangladesh 0 0 341 291 Bulgaria 3394 1725 1012 909 Burma 2580 1380 710 590 Canada 5200 3000 Philippines 2975 1488 1114 929 Ghana 2450 1250 650 573 Greece 3750 2000 1746 1346 Hong Kong 3597 1446 1337 866 India 3330 1913 891 790 Indonesia 3078 2280 572 376 Japan 11500 6200 7900 6000 Korea 3450 1438 1150 920 Liberia 0 0 662 593 Netherlands 5500 2500 1725 1650 Pakistan 0 1690 578 495 Poland 3380 1755 1148 956 Singapore 2840 1620 997 815 Spain 4020 2364 1509 1284 Sri Lanka 2333 1138 430 380 Taiwan 3300 1624 1154 991 Tuvalu 0 0 598 471 UK 5000 2900 2100 1840 USA 15000 9000 6000 4300 USSR 3268 1658 1018 914 Vietnam 2308 828 803 642 PR. China 0 0 695 597
Table 6: Monthly pay rates in € for officers and ratings having different nationalities
These values are used to calculate the crew costs proper.
4.4.2. Pilotage Costs
4.4.2.1. Introduction
For three locations pilot dues are calculated. The principle of calculation differs.
Rotterdam bases the dues on draft. They also distinguish in the outside stretch from
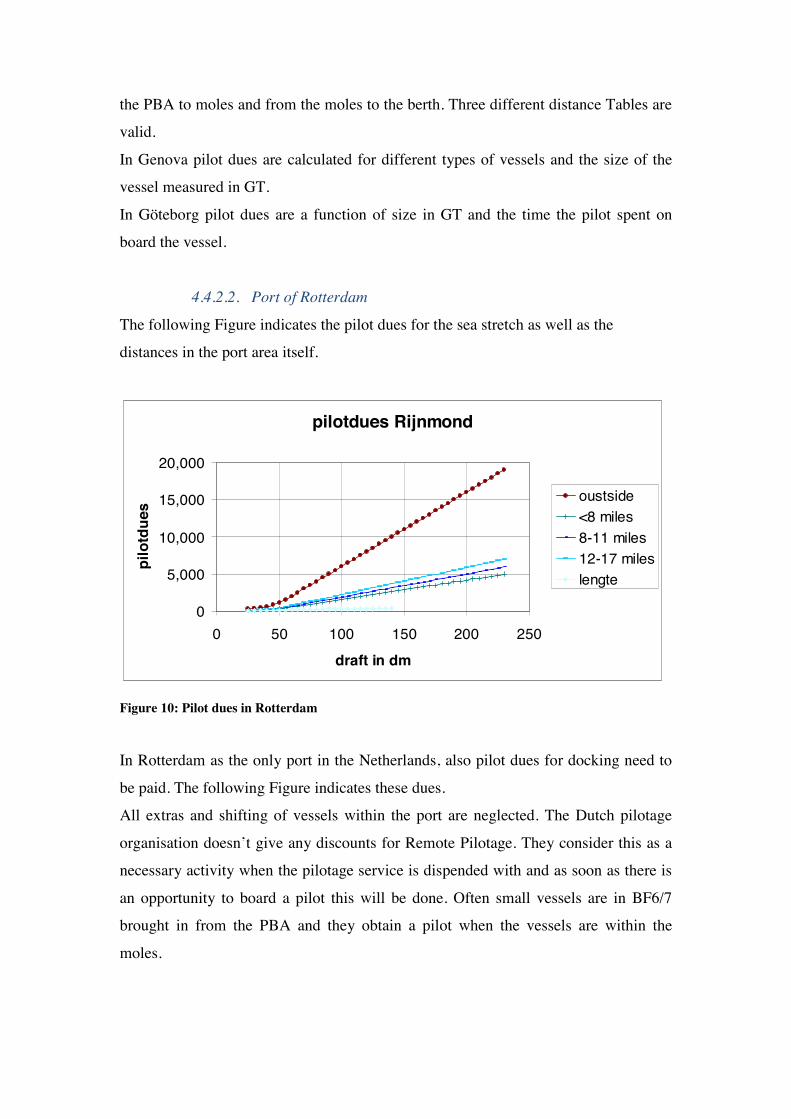
the PBA to moles and from the moles to the berth. Three different distance Tables are
valid.
In Genova pilot dues are calculated for different types of vessels and the size of the
vessel measured in GT.
In Göteborg pilot dues are a function of size in GT and the time the pilot spent on
board the vessel.
4.4.2.2. Port of Rotterdam
The following Figure indicates the pilot dues for the sea stretch as well as the
distances in the port area itself.
pilotdues Rijnmond
0
5,000
10,000
15,000
20,000
0 50 100 150 200 250
draft in dm
pilo
tdue
s oustside<8 miles8-11 miles12-17 mileslengte
Figure 10: Pilot dues in Rotterdam
In Rotterdam as the only port in the Netherlands, also pilot dues for docking need to
be paid. The following Figure indicates these dues.
All extras and shifting of vessels within the port are neglected. The Dutch pilotage
organisation doesn’t give any discounts for Remote Pilotage. They consider this as a
necessary activity when the pilotage service is dispended with and as soon as there is
an opportunity to board a pilot this will be done. Often small vessels are in BF6/7
brought in from the PBA and they obtain a pilot when the vessels are within the
moles.

Dock pilot dues
0
1000
2000
3000
4000
5000
0 100 200 300 400
length
portp
ilotd
ues
costsestimation
Figure 11: Dock pilot dues in Rotterdam
This Figure above shows the costs and an estimation of these costs by a polynomial.
The coefficients for the polynomials are shown in the following Table.
draft <60 draft>=60 Dock pilot
outside <8 miles 8-11 miles 12-17 miles outside
<8 miles
8-11 miles
12-17 miles
a 0.0251 0.0068 0.0077 0.0092 116 30 36 42 0.0002
b -1.4383 -0.3967 -0.4422 -0.5291 -5,923 -1,534 -1,837 -2,172 -0.0506
c 35.3717 9.7542 10.9131 13.1326 6.8046
Table 7: Polynomial coefficients of pilotage in Rotterdam
The polynomials have the following simple format:
60<IfT TcTbTatsPilot ***cos 23 ++= Equation 3
60>=IfT bTatsPilot += *cos Equation 4
LcLbLatsDockpilot ***cos 23 ++= Equation 5
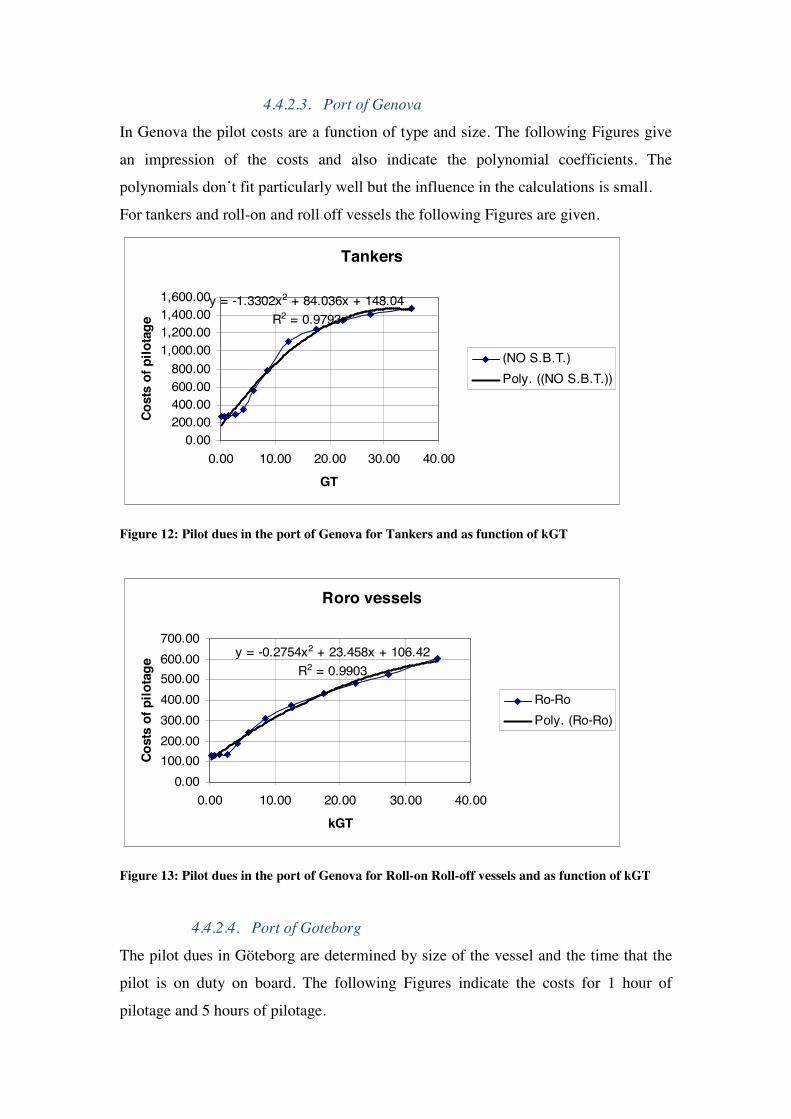
4.4.2.3. Port of Genova
In Genova the pilot costs are a function of type and size. The following Figures give
an impression of the costs and also indicate the polynomial coefficients. The
polynomials don’t fit particularly well but the influence in the calculations is small.
For tankers and roll-on and roll off vessels the following Figures are given.
Tankers
y = -1.3302x2 + 84.036x + 148.04R2 = 0.9793
0.00200.00400.00600.00800.00
1,000.001,200.001,400.001,600.00
0.00 10.00 20.00 30.00 40.00
GT
Cost
s of
pilo
tage
(NO S.B.T.)Poly. ((NO S.B.T.))
Figure 12: Pilot dues in the port of Genova for Tankers and as function of kGT
Roro vessels
y = -0.2754x2 + 23.458x + 106.42R2 = 0.9903
0.00100.00200.00300.00400.00500.00600.00700.00
0.00 10.00 20.00 30.00 40.00
kGT
Cost
s of
pilo
tage
Ro-RoPoly. (Ro-Ro)
Figure 13: Pilot dues in the port of Genova for Roll-on Roll-off vessels and as function of kGT
4.4.2.4. Port of Goteborg
The pilot dues in Göteborg are determined by size of the vessel and the time that the
pilot is on duty on board. The following Figures indicate the costs for 1 hour of
pilotage and 5 hours of pilotage.

Pilotcosts 1 houry = 0.1207x3 - 12.719x2 + 480.67x +
2303.6R2 = 0.9874
02000400060008000
1000012000
0 20 40 60 80
kGT
Cost
s SEKPoly. (SEK)
Figure 14: Pilot costs for 1 hour of pilotage and as function of kGT
Pilotcosts 5 hours
y = 0.2938x3 - 30.977x2 + 1171.7x + 5623.1
R2 = 0.9874
05000
1000015000200002500030000
0 20 40 60 80
KGT
Cost
s SEKPoly. (SEK)
Figure 15: Pilot costs for 5 hours of pilotage and as function of kGT
It is possible to combine the results for different time periods that the pilot is on board
the vessel to one expression.
This leads to:
)()()()(cos 44332
223
11 BtAkGTBtAkGTBtAkGTBtAtsPilot +++++++= Equation 6
A 0.04344 -4.579 173.08 829.6
B 0.07712 -8.13 307.35 1474.2
Table 8: Polynomial coefficients for pilot dues in Göteborg
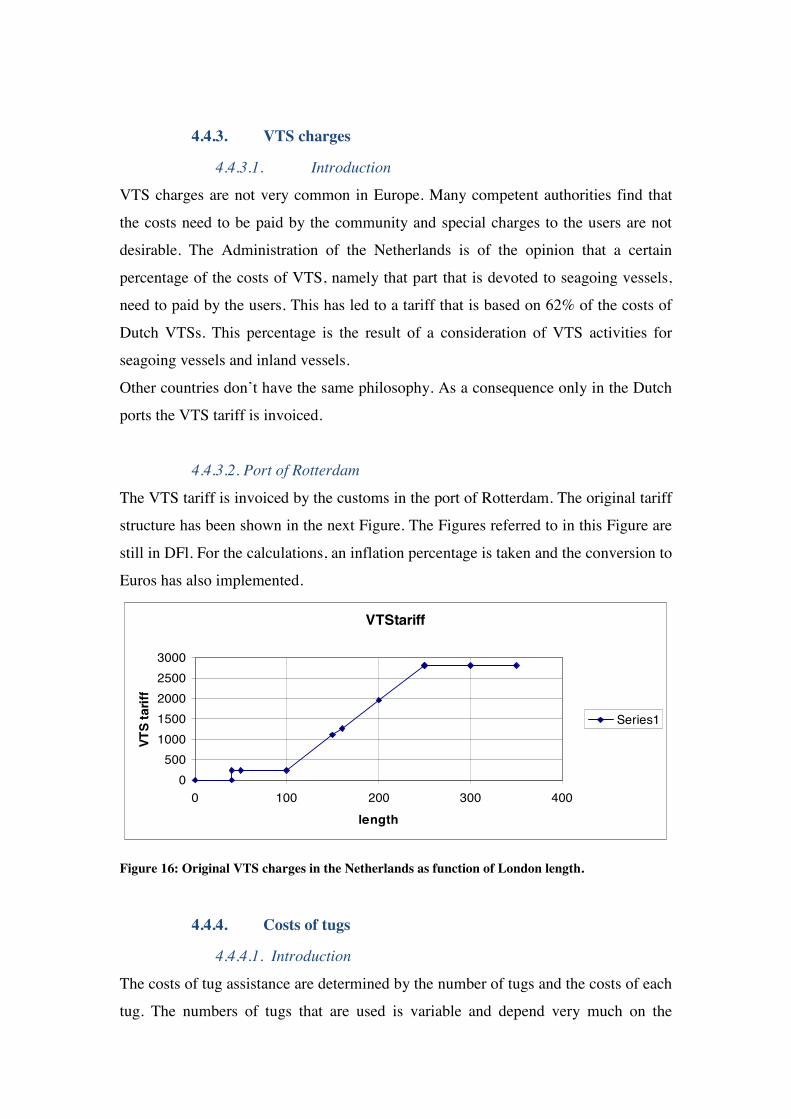
4.4.3. VTS charges
4.4.3.1. Introduction
VTS charges are not very common in Europe. Many competent authorities find that
the costs need to be paid by the community and special charges to the users are not
desirable. The Administration of the Netherlands is of the opinion that a certain
percentage of the costs of VTS, namely that part that is devoted to seagoing vessels,
need to paid by the users. This has led to a tariff that is based on 62% of the costs of
Dutch VTSs. This percentage is the result of a consideration of VTS activities for
seagoing vessels and inland vessels.
Other countries don’t have the same philosophy. As a consequence only in the Dutch
ports the VTS tariff is invoiced.
4.4.3.2. Port of Rotterdam
The VTS tariff is invoiced by the customs in the port of Rotterdam. The original tariff
structure has been shown in the next Figure. The Figures referred to in this Figure are
still in DFl. For the calculations, an inflation percentage is taken and the conversion to
Euros has also implemented.
VTStariff
0500
10001500200025003000
0 100 200 300 400length
VTS
tarif
f
Series1
Figure 16: Original VTS charges in the Netherlands as function of London length.
4.4.4. Costs of tugs
4.4.4.1. Introduction
The costs of tug assistance are determined by the number of tugs and the costs of each
tug. The numbers of tugs that are used is variable and depend very much on the
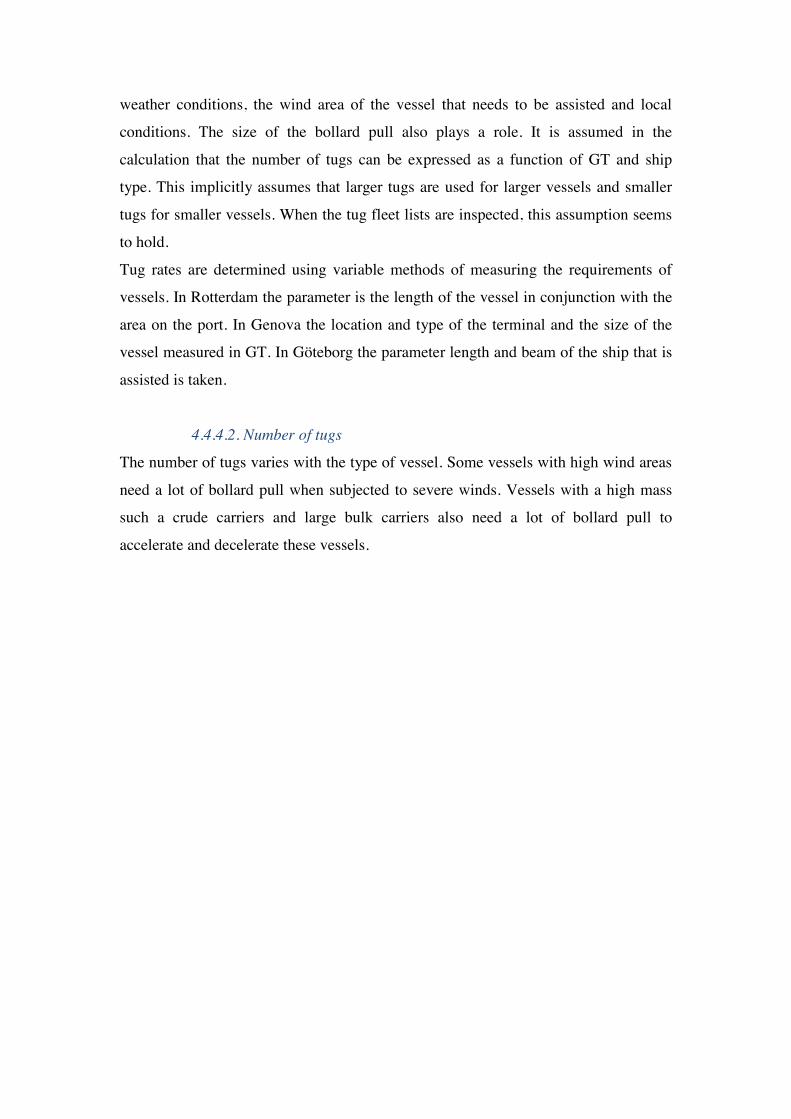
weather conditions, the wind area of the vessel that needs to be assisted and local
conditions. The size of the bollard pull also plays a role. It is assumed in the
calculation that the number of tugs can be expressed as a function of GT and ship
type. This implicitly assumes that larger tugs are used for larger vessels and smaller
tugs for smaller vessels. When the tug fleet lists are inspected, this assumption seems
to hold.
Tug rates are determined using variable methods of measuring the requirements of
vessels. In Rotterdam the parameter is the length of the vessel in conjunction with the
area on the port. In Genova the location and type of the terminal and the size of the
vessel measured in GT. In Göteborg the parameter length and beam of the ship that is
assisted is taken.
4.4.4.2. Number of tugs
The number of tugs varies with the type of vessel. Some vessels with high wind areas
need a lot of bollard pull when subjected to severe winds. Vessels with a high mass
such a crude carriers and large bulk carriers also need a lot of bollard pull to
accelerate and decelerate these vessels.

Number of tugs for container vessels GT >=100 <1600 <30000 <100000 from GT <500 <1000 <10000 <60000 100000 Average GT 300 750 1300 5800 20000 45000 80000 150000 length 53.7 6 7 . 4 77.6 128.1 192.7 234.5 278.2 315.5 BF0 0 0 0 0 1 2 2 2 BF1 0 0 0 0 1 2 2 2 BF2 0 0 0 0 1 2 2 3 BF3 0 0 0 0 1 2 2 3 BF4 0 0 0 0 1 2 3 4 BF5 0 0 0 0 1 2 3 4 BF6 0 0 0 0 1 3 4 5 BF7 0 0 0 0 2 3 4 5 BF8 0 0 0 0 2 4 4 6 BF9 0 0 0 1 2 4 5 6 BF10 0 0 0 1 3 5 5 6 BF11 0 0 0 2 3 5 6 6
Figure 17: Overview of the number of tugs required for a container vessel as function of size and weather conditions
For other vessels similar Tables are drafted, that are not very different from the Table
above.
4.4.4.3. Tug rates in Rotterdam
The tug rates in Rotterdam where a number of different tug services are available are
selected for average conditions. An average location has been selected. No additional
surcharges are taken into account. These surcharges apply for the weekends, when
there is limited visibility, cancellation, dead vessels and when special safety
requirements require more bollard pull.
The following Figure is applicable for the tug rates.
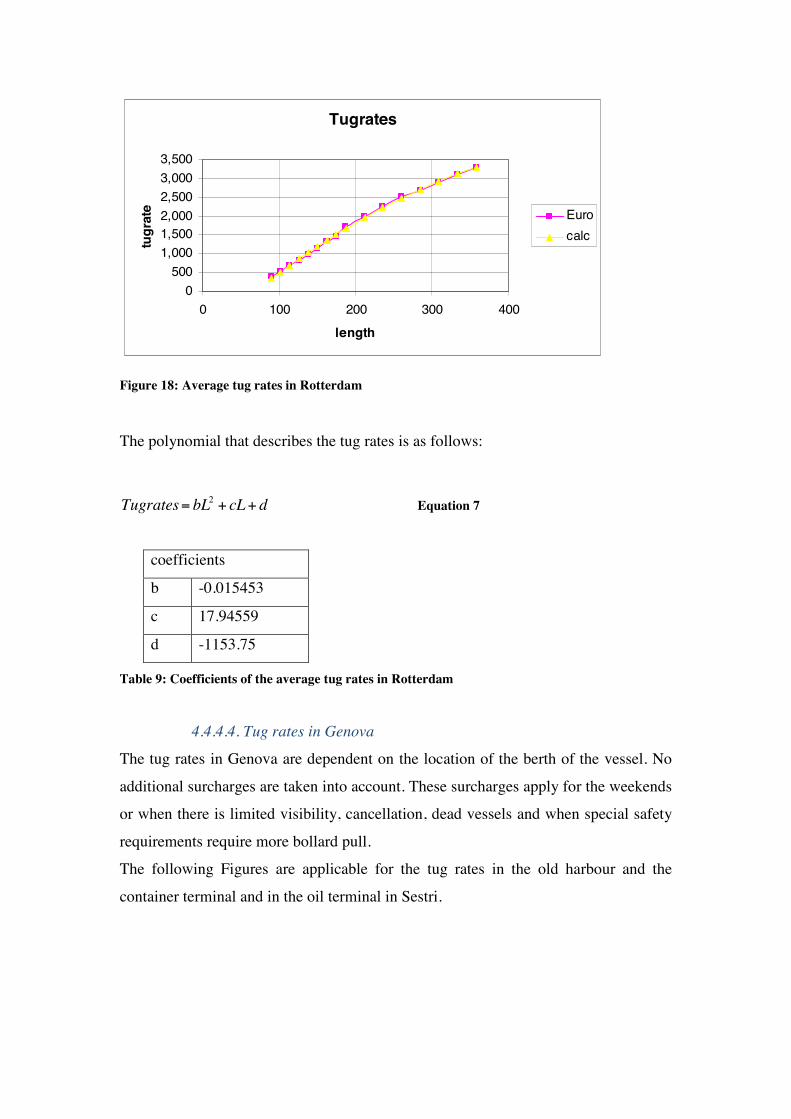
Tugrates
0500
1,0001,5002,0002,5003,0003,500
0 100 200 300 400
length
tugr
ate Euro
calc
Figure 18: Average tug rates in Rotterdam
The polynomial that describes the tug rates is as follows:
dcLbLTugrates ++= 2 Equation 7
coefficients
b -0.015453
c 17.94559
d -1153.75
Table 9: Coefficients of the average tug rates in Rotterdam
4.4.4.4. Tug rates in Genova
The tug rates in Genova are dependent on the location of the berth of the vessel. No
additional surcharges are taken into account. These surcharges apply for the weekends
or when there is limited visibility, cancellation, dead vessels and when special safety
requirements require more bollard pull.
The following Figures are applicable for the tug rates in the old harbour and the
container terminal and in the oil terminal in Sestri.

Old harbour and container terminal
y = 0.022x3 - 2.5965x2 + 106.75x + 244.61
R2 = 0.9852
0.00
500.00
1,000.00
1,500.00
2,000.00
2,500.00
0.00 20.00 40.00 60.00
kGT
Tug
rate Cost (€)
Poly. (Cost (€))
Figure 19: Tug rates in Genova as function of GT for the old harbour and the container terminal
Oilterminal Sestri
y = 0.0031x3 - 0.9004x2 + 90.442x + 727.81
R2 = 0.9857
0.00500.00
1,000.001,500.002,000.002,500.003,000.003,500.004,000.004,500.005,000.00
0.00 50.00 100.00 150.00 200.00kGT
tugr
ate Cost (€)
Poly. (Cost (€))
Figure 20: Tug rates in Genova as function of GT for the oil terminal in Multedo
4.4.4.5. Tug rates in Goteborg
The tug rates in Göteborg are dependent on the product of length and beam of the
vessel that needs to be assisted. No additional surcharges are taken into account.
These surcharges apply for the weekends, when there is limited visibility,
cancellation, dead vessels and when special safety requirements require more bollard
pull.
The following Figure is applicable for the tug rates in the port of Göteborg.

Tugrates
y = 3.9097x + 1317.4R2 = 0.9947
05000
100001500020000250003000035000400004500050000
0 5000 10000 15000LB
cost
s SEKLinear (SEK)
Figure 21: Tug rates in Göteborg as function of LB
4.4.5. Mooring fees
4.4.5.1. Introduction
Mooring dues are not strictly required for the calculation since that for all Risk
Control Options mooring costs are involved. However, when the costs and risks in
various ports are compared the mooring costs are helpful. Mooring costs in Rotterdam
are dependent on length of the vessel and the fact whether the vessel moors or
unmoors. Mooring dues in Genova are dependent on GT and type of vessel. In
Göteborg the mooring costs are dependent on size of the vessel and whether or not the
vessel moors or unmoors.
4.4.5.2. Mooring fees in Rotterdam
The following Figure shows the mooring dues in the port of Rotterdam.
Mooring costs
0.0
1,000.0
2,000.0
3,000.0
4,000.0
5,000.0
6,000.0
0.0 100.0 200.0 300.0 400.0length
moo
ring
and
unm
oorin
g du
es
unmooringmooringcalc unmoorcalc moor
Figure 22: Mooring dues in the port of Rotterdam for mooring and unmooring
The coefficients of the polynomial are given in the next Table. The conversion to Euros has not taken place in the Figure.
unmooring mooring
a 0.00014 0.00015
b -0.0122 -0.013
c 1.78503 1.91405
d 70.58155 77.4111
Table 10: Coefficients of the polynomials for mooring and unmooring in Rotterdam
The expression which should be used is given below:
dLcLbLauesUnmooringdMoorindues +++= ***/ 23 Equation 8
4.4.5.3. Mooring fees in Genova
The mooring costs in Genova are based on the type of the vessel and on the GT of the
vessel. In fact only Ro-Ro vessels and container vessels have a special tariff. All other
vessels have the same tariff as can be seen in the following Figures.

Roro and container vessels
y = 0.0108x + 98.189R2 = 0.9859
0.00
200.00
400.00
600.00
800.00
1,000.00
1,200.00
0 20,000
40,000
60,000
80,000
100,000
GT
Cost
s of
moo
ring
COST (€)Linear (COST (€))
Figure 23: Mooring costs for Ro-Ro vessels and container vessels in the port of Genova
Other vessels
y = 0.0149x + 113.3R2 = 0.9932
0.00200.00400.00600.00800.00
1,000.001,200.001,400.001,600.00
0 20,000
40,000
60,000
80,000
100,000
GT
cost
s of
moo
ring
COST (€)Linear (COST (€))
Figure 24: Mooring costs for other vessels in the port of Genova
4.4.5.4. Mooring fees in Goteborg
Mooring costs in Göteborg are dependent on the GT. It is important that the outbound
tariff is half of the inbound tariff.
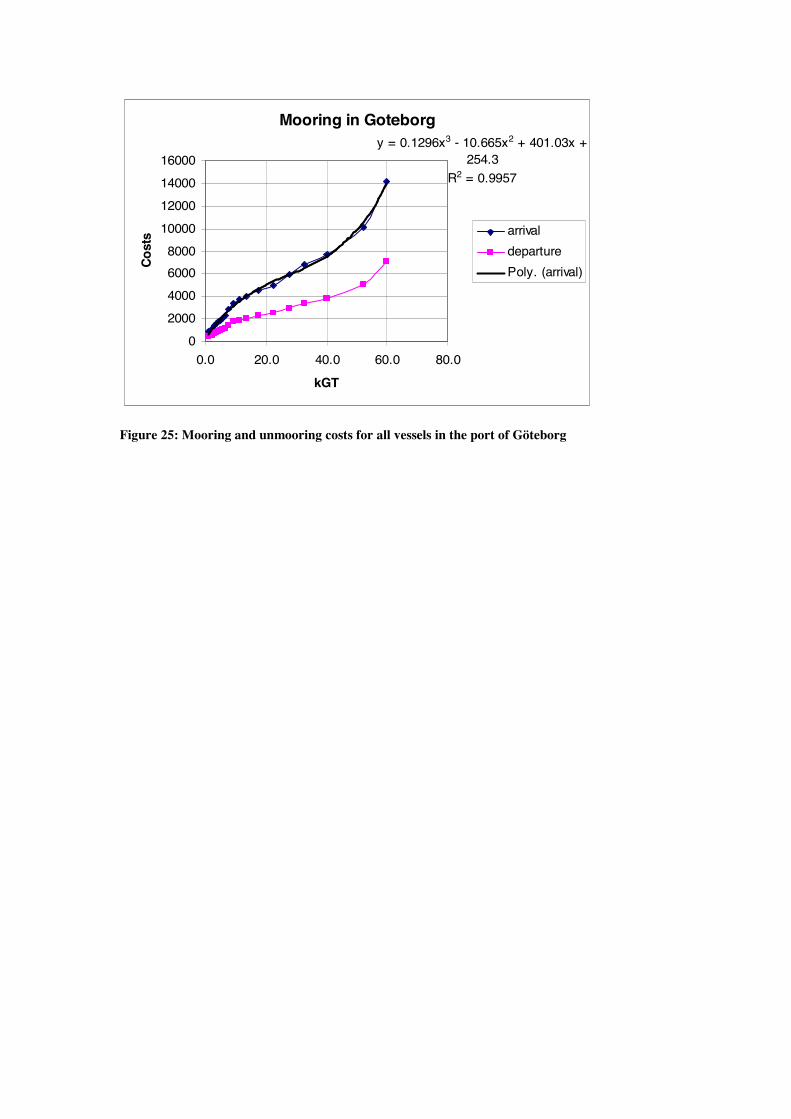
Mooring in Goteborgy = 0.1296x3 - 10.665x2 + 401.03x +
254.3R2 = 0.9957
02000400060008000
10000120001400016000
0.0 20.0 40.0 60.0 80.0
kGT
Cost
s arrivaldeparturePoly. (arrival)
Figure 25: Mooring and unmooring costs for all vessels in the port of Göteborg

4.5. Frequency calculations of accidents
4.5.1. Casualty rates for ships in port for different accident types
Accidents are often related to the exposure in order to get a casualty rate per unit of
exposure. Exposures are vessel-kilometres, transits in locks and through bridges and
for collisions an important exposure is the encounter. Encounters can be calculated
using the traffic patterns in aport and the intensities of shipping on each link of the
port. This information is not readily available and as a consequence collisions are also
related to vessel-kilometres.
Statistics on accident are collected in the Netherlands for many years and the statistics
seem to be helpful to be used in this study. The categorisation of accidents is given in
the following Table. Accident-type S c h e l d e R i j n m o n d I J m o n d G o t e b o r g G e n o v a
Collision in
dock 2 4 1 . 69 1,537.86 9 0 5 . 9 5 1 ,066.20 710 .80 c a l l s
Collision in a
lock 1 7 7 . 64 9 1 8 . 35 7 0 . 7 2 0 . 0 0 0 . 0 0
Lock transits
Collision 6 . 9 9 1 6 . 9 8 3 . 5 1 1 4 . 2 2 5 . 3 3 V e s s e l - k m
Contact with
bridge 1 0 2 . 2 3 1 0 3 . 80 0 . 0 0 1 0 6 . 6 2 0 . 0 0
Bridge transits
Contacts in
dock 2 4 1 . 4 6 1 ,331.81 1 8 6 . 5 2 2 1 3 . 2 4 533 .10
calls
Other contacts 2 . 7 3 8 . 3 0 2 . 2 3 2 . 3 1 2 . 3 1 v e s s e l - k m
Contacts in lock
chamber 1,101.35 5,050.90 8 1 3 . 3 0 0 . 0 0 0 . 0 0
Lock transits
Contacts in
Fairway 1 . 0 6 5 . 1 6 7 . 7 5 6 . 2 2 6 . 2 2
Vessel-km
Grounding 8 . 1 2 1 . 1 3 0 . 0 0 1 0 . 6 6 4 . 8 0 V e s s e l - k m
Fire/Explosion 0 . 2 1 0 . 3 5 0 . 0 0 0 . 4 0 0 . 4 0 V e s s e l - k m
Sinking 0 . 0 2 0 . 0 3 0 . 0 0 0 . 0 2 0 . 0 2 V e s s e l - k m
Other 4 . 4 1 9 . 2 0 5 . 4 0 7 . 0 0 7 . 0 0 V e s s e l - k m
Unknown 1 . 8 0 8 . 1 4 7 . 9 8 5 . 0 0 5 . 0 0 V e s s e l - k m

Table 11: Casualty rates*10^6 from Dutch studies
The accident types are given in the first column. The casualty rates are given in the
following columns. The casualty rates are not implemented for IJmond, the port of
Amsterdam and IJmuiden.
These casualty rates need to pertain for the condition that no Navigation Support
Services should be present. This condition is the base case and is difficult to obtain.
Under normal conditions VTS and pilotage are available and risks take these NSSs
into account. However, a small portion of vessels are entering without a Pilot on
Board and this gives us a clue to determine the casualty rates in absence of a pilot.
The effect of VTS has been determined in other studies and in this case the casualty
rate is determined for no NSSs.
The Figures for the Netherlands ports are from the databases. Unfortunately the same
data are not available for Genova and Göteborg. An estimate has been made. The
values for lock accidents are not important in these cases. The values for bridge
transits are immaterial for the port of Genova. The estimation for Genova and
Göteborg is done by comparing traffic volumes. However the effect of the port lay out
on casualty rates was impossible to estimate and hence this effect has not been
incorporated in the casualty rates. Some information on accidents was provided and
that information was not rejecting the values that were estimated.
The general concept of the use of casualty rates is that special effects are being
incorporated by means of multiplication factors. The model that is used is as follows:
origexemptageclassflagviswindeff CasRatffffffCasRat = Equation 9
This model was rather intuitive. Research done in the project MarNIS has shown that
the multiplicative model gave the best fit [6].
In the following sections the numerical values of the multiplication factors are being
determined.

4.5.2. Values of casualty rates as function of length when the vessel uses tug
During the analysis of the casualty rates it became clear that there is a dependence of
the casualty rate of the length. This can be understood, since a large vessel is rather
difficult to maneuver at low speeds in a port environment. The following Figure
shows the relationship that was found. It was also found that as soon as tugs are used
the multiplication factor was very much reduced. This reduction is also shown in the
next Figure. Tugs can be seen as very effective in reducing the risk.
0.001.002.003.004.005.006.007.008.00
0 100 200 300 400
LENGTH
CASR
AT F_lengthF_length*F_LAB*F_tug
Figure 26: The effect of length and tugs on the average casualty rates
The length factor is described as follows:
CBLALMFlength ++= 2 Equation 10
The tug factor is described by:
100/1 LMFMF
MFlengthLAB
tug = Equation 11
The coefficients can be found in the next Table.
Coefficients Value
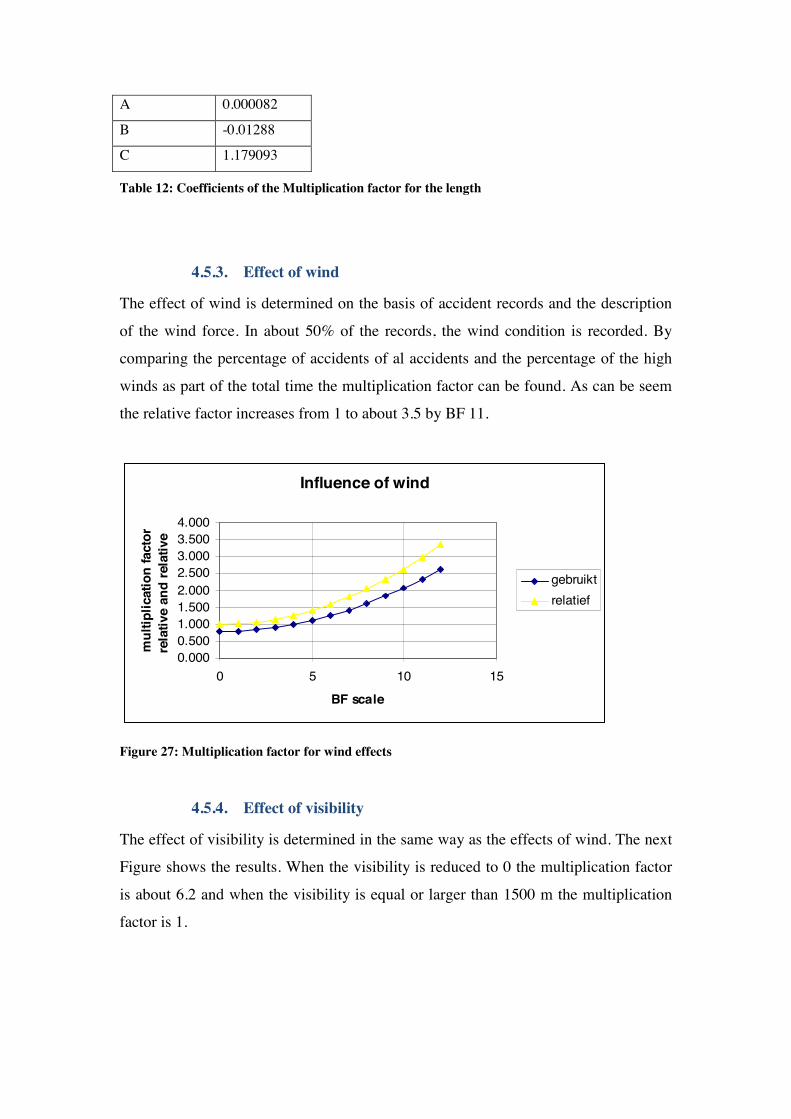
A 0.000082
B -0.01288
C 1.179093
Table 12: Coefficients of the Multiplication factor for the length
4.5.3. Effect of wind
The effect of wind is determined on the basis of accident records and the description
of the wind force. In about 50% of the records, the wind condition is recorded. By
comparing the percentage of accidents of al accidents and the percentage of the high
winds as part of the total time the multiplication factor can be found. As can be seem
the relative factor increases from 1 to about 3.5 by BF 11.
Influence of wind
0.0000.5001.0001.5002.0002.5003.0003.5004.000
0 5 10 15
BF scale
mul
tiplic
atio
n fa
ctor
re
lativ
e an
d re
lativ
e
gebruiktrelatief
Figure 27: Multiplication factor for wind effects
4.5.4. Effect of visibility
The effect of visibility is determined in the same way as the effects of wind. The next
Figure shows the results. When the visibility is reduced to 0 the multiplication factor
is about 6.2 and when the visibility is equal or larger than 1500 m the multiplication
factor is 1.
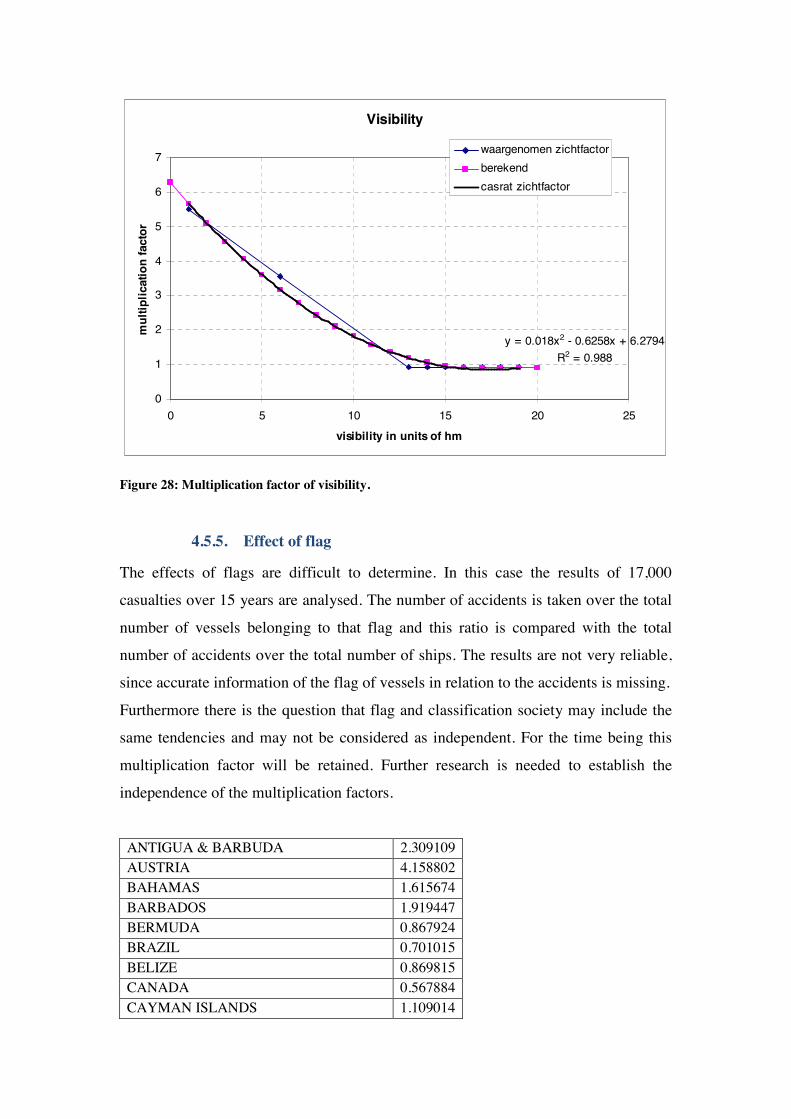
Visibility
y = 0.018x2 - 0.6258x + 6.2794R2 = 0.988
0
1
2
3
4
5
6
7
0 5 10 15 20 25visibility in units of hm
mul
tiplic
atio
n fa
ctor
waargenomen zichtfactorberekendcasrat zichtfactor
Figure 28: Multiplication factor of visibility.
4.5.5. Effect of flag
The effects of flags are difficult to determine. In this case the results of 17,000
casualties over 15 years are analysed. The number of accidents is taken over the total
number of vessels belonging to that flag and this ratio is compared with the total
number of accidents over the total number of ships. The results are not very reliable,
since accurate information of the flag of vessels in relation to the accidents is missing.
Furthermore there is the question that flag and classification society may include the
same tendencies and may not be considered as independent. For the time being this
multiplication factor will be retained. Further research is needed to establish the
independence of the multiplication factors.
ANTIGUA & BARBUDA 2.309109 AUSTRIA 4.158802 BAHAMAS 1.615674 BARBADOS 1.919447 BERMUDA 0.867924 BRAZIL 0.701015 BELIZE 0.869815 CANADA 0.567884 CAYMAN ISLANDS 1.109014
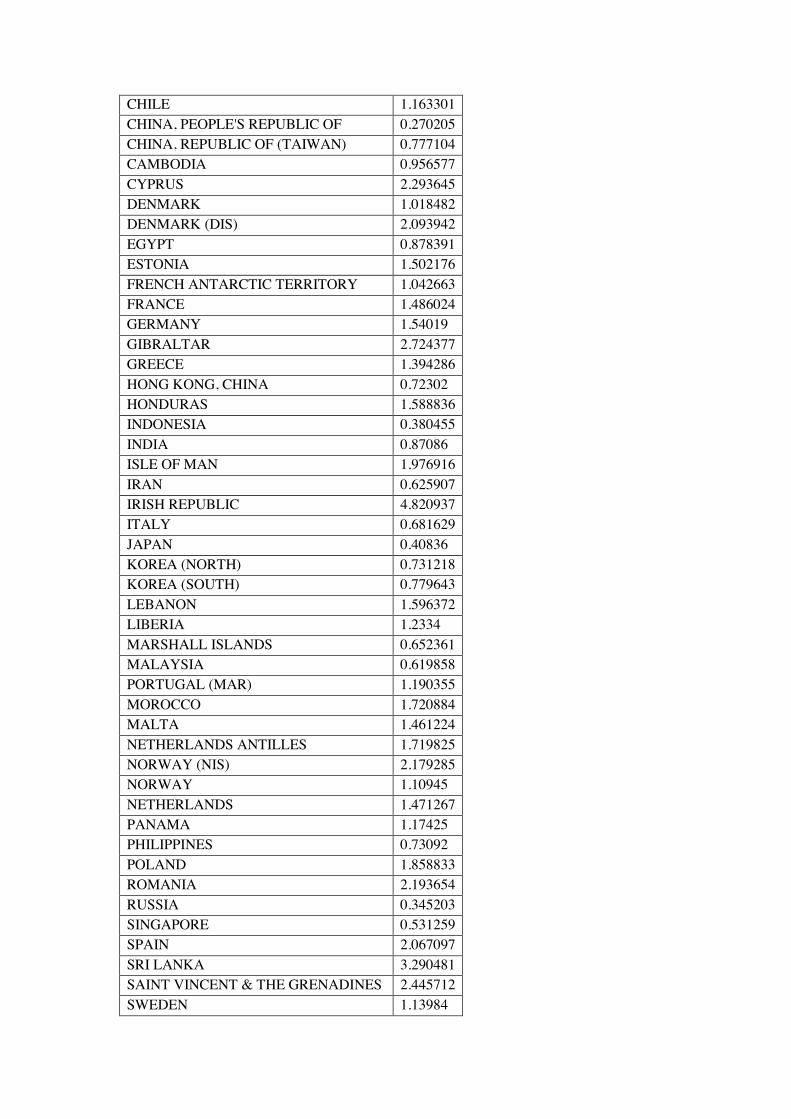
CHILE 1.163301 CHINA, PEOPLE'S REPUBLIC OF 0.270205 CHINA, REPUBLIC OF (TAIWAN) 0.777104 CAMBODIA 0.956577 CYPRUS 2.293645 DENMARK 1.018482 DENMARK (DIS) 2.093942 EGYPT 0.878391 ESTONIA 1.502176 FRENCH ANTARCTIC TERRITORY 1.042663 FRANCE 1.486024 GERMANY 1.54019 GIBRALTAR 2.724377 GREECE 1.394286 HONG KONG, CHINA 0.72302 HONDURAS 1.588836 INDONESIA 0.380455 INDIA 0.87086 ISLE OF MAN 1.976916 IRAN 0.625907 IRISH REPUBLIC 4.820937 ITALY 0.681629 JAPAN 0.40836 KOREA (NORTH) 0.731218 KOREA (SOUTH) 0.779643 LEBANON 1.596372 LIBERIA 1.2334 MARSHALL ISLANDS 0.652361 MALAYSIA 0.619858 PORTUGAL (MAR) 1.190355 MOROCCO 1.720884 MALTA 1.461224 NETHERLANDS ANTILLES 1.719825 NORWAY (NIS) 2.179285 NORWAY 1.10945 NETHERLANDS 1.471267 PANAMA 1.17425 PHILIPPINES 0.73092 POLAND 1.858833 ROMANIA 2.193654 RUSSIA 0.345203 SINGAPORE 0.531259 SPAIN 2.067097 SRI LANKA 3.290481 SAINT VINCENT & THE GRENADINES 2.445712 SWEDEN 1.13984
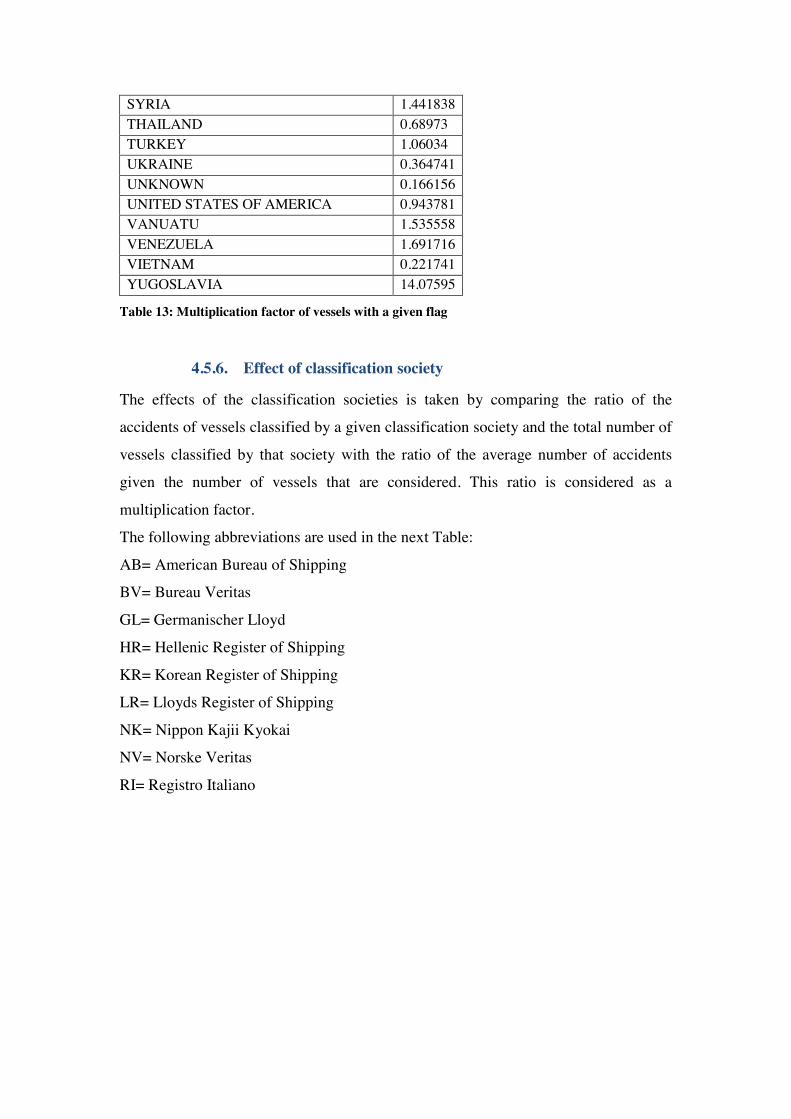
SYRIA 1.441838 THAILAND 0.68973 TURKEY 1.06034 UKRAINE 0.364741 UNKNOWN 0.166156 UNITED STATES OF AMERICA 0.943781 VANUATU 1.535558 VENEZUELA 1.691716 VIETNAM 0.221741 YUGOSLAVIA 14.07595
Table 13: Multiplication factor of vessels with a given flag
4.5.6. Effect of classification society
The effects of the classification societies is taken by comparing the ratio of the
accidents of vessels classified by a given classification society and the total number of
vessels classified by that society with the ratio of the average number of accidents
given the number of vessels that are considered. This ratio is considered as a
multiplication factor.
The following abbreviations are used in the next Table:
AB= American Bureau of Shipping
BV= Bureau Veritas
GL= Germanischer Lloyd
HR= Hellenic Register of Shipping
KR= Korean Register of Shipping
LR= Lloyds Register of Shipping
NK= Nippon Kajii Kyokai
NV= Norske Veritas
RI= Registro Italiano
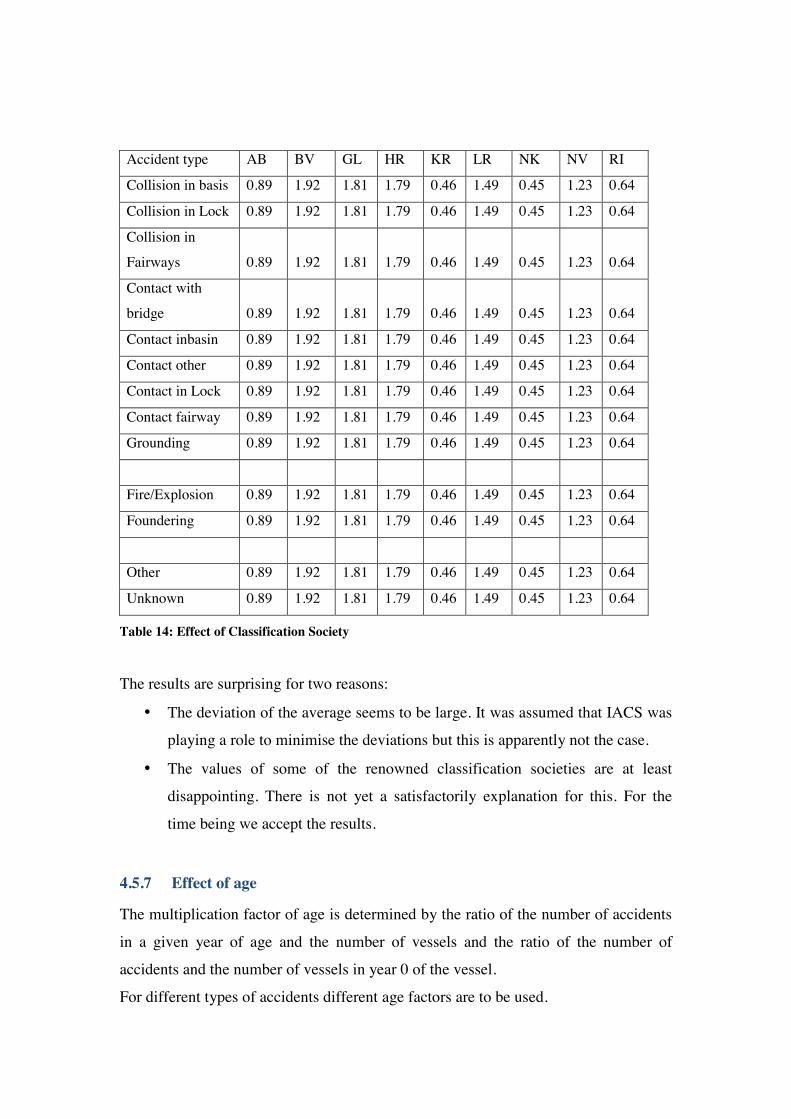
Accident type AB BV GL HR KR LR NK NV RI
Collision in basis 0.89 1.92 1.81 1.79 0.46 1.49 0.45 1.23 0.64
Collision in Lock 0.89 1.92 1.81 1.79 0.46 1.49 0.45 1.23 0.64
Collision in
Fairways 0.89 1.92 1.81 1.79 0.46 1.49 0.45 1.23 0.64
Contact with
bridge 0.89 1.92 1.81 1.79 0.46 1.49 0.45 1.23 0.64
Contact inbasin 0.89 1.92 1.81 1.79 0.46 1.49 0.45 1.23 0.64
Contact other 0.89 1.92 1.81 1.79 0.46 1.49 0.45 1.23 0.64
Contact in Lock 0.89 1.92 1.81 1.79 0.46 1.49 0.45 1.23 0.64
Contact fairway 0.89 1.92 1.81 1.79 0.46 1.49 0.45 1.23 0.64
Grounding 0.89 1.92 1.81 1.79 0.46 1.49 0.45 1.23 0.64
Fire/Explosion 0.89 1.92 1.81 1.79 0.46 1.49 0.45 1.23 0.64
Foundering 0.89 1.92 1.81 1.79 0.46 1.49 0.45 1.23 0.64
Other 0.89 1.92 1.81 1.79 0.46 1.49 0.45 1.23 0.64
Unknown 0.89 1.92 1.81 1.79 0.46 1.49 0.45 1.23 0.64
Table 14: Effect of Classification Society
The results are surprising for two reasons:
• The deviation of the average seems to be large. It was assumed that IACS was
playing a role to minimise the deviations but this is apparently not the case.
• The values of some of the renowned classification societies are at least
disappointing. There is not yet a satisfactorily explanation for this. For the
time being we accept the results.
4.5.7 Effect of age
The multiplication factor of age is determined by the ratio of the number of accidents
in a given year of age and the number of vessels and the ratio of the number of
accidents and the number of vessels in year 0 of the vessel.
For different types of accidents different age factors are to be used.

MF1: Collision in docks, Collision in locks, Collision in fairway, Contact with bridge,
Contact with lock
MF2: Contact with fairway, grounding
MF3: Fire and Explosions
MF4: Foundering
The results were determined mainly using results of a large casualty database of
17,000 accidents. The results pertain to at sea conditions: it is assumed that the results
are also valid for navigation in ports.
Multiplicationfactor Age
0.000
10.000
20.000
30.000
40.000
50.000
60.000
70.000
0 5 10 15 20 25 30age
mul
tiplic
atio
n fa
ctor
MF1MF2MF3MF4
Figure 29: Multiplication factor for different types of accidents as function of age
4.5.8. Effect of exemptions
In many ports there is a possibility for vessels with the same master that calls more
than a given number of calls in the port to get an exemption of having a pilot on
board. Different requirements are set. Often the vessel needs to make a number of 12
calls per year with the same master. For a new master the exemption is not valid.
Masters who would like to qualify for an exemption needs to pass an examination
which is taken y the pilotage organisation.
In principle is the idea to model the exemptions based on the idea displayed in the
next Figure.
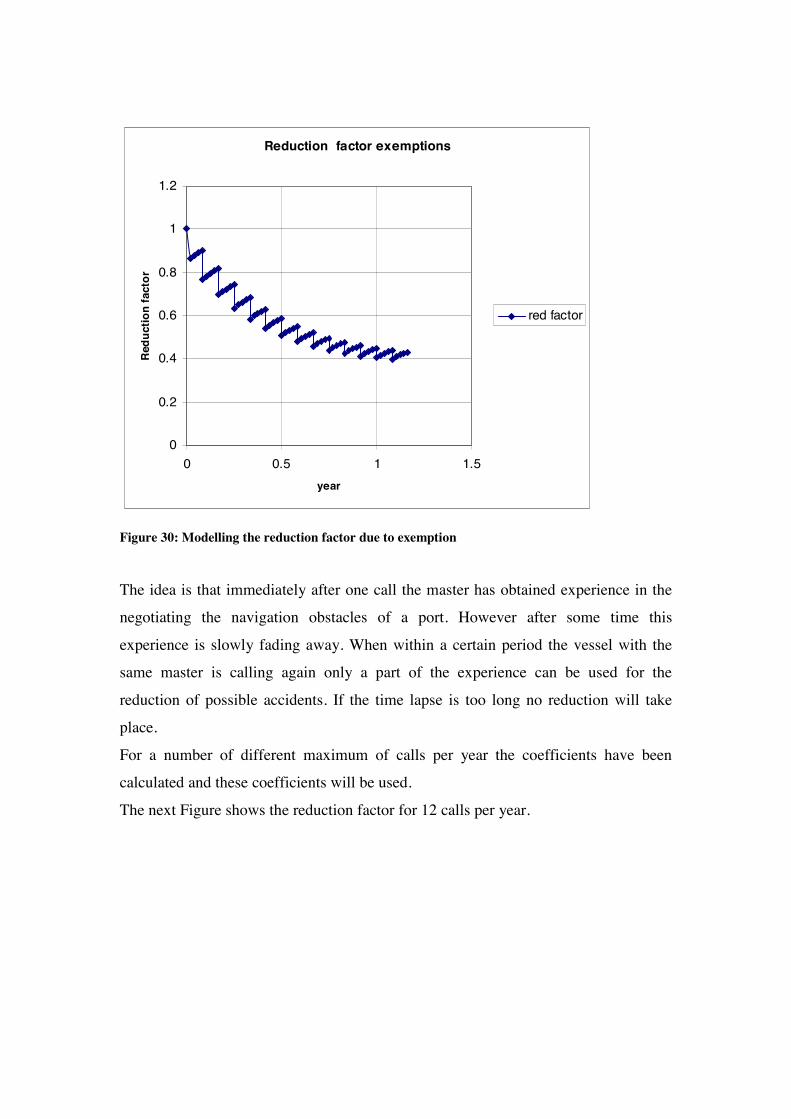
Reduction factor exemptions
0
0.2
0.4
0.6
0.8
1
1.2
0 0.5 1 1.5year
Red
uctio
n fa
ctor
red factor
Figure 30: Modelling the reduction factor due to exemption
The idea is that immediately after one call the master has obtained experience in the
negotiating the navigation obstacles of a port. However after some time this
experience is slowly fading away. When within a certain period the vessel with the
same master is calling again only a part of the experience can be used for the
reduction of possible accidents. If the time lapse is too long no reduction will take
place.
For a number of different maximum of calls per year the coefficients have been
calculated and these coefficients will be used.
The next Figure shows the reduction factor for 12 calls per year.

Envelope of exemptions
y = -0.4991x3 + 1.3806x2 - 1.4121x + 0.9652
R2 = 0.9941
0
0.2
0.4
0.6
0.8
1
1.2
0 0.5 1 1.5
year
redu
ctio
n fa
ctor
redfactPoly. (redfact)
Figure 31: Envelope of the reduction factors at begin of the xth call measured in fraction of the year

4.6. Consequences
4.6.1. Material damage
The material damage is based on two sets of data. The first is a Table indicating the
value of material damage for a standard vessel. The length of this vessel is taken as
118 m. This is the average length of vessels that call in the port of Rotterdam. The
following Table gives the mean values for damage on vessels.
Type nearly none light heavy
Collision in dock 1,180 177,000 1,180,000
Collision in lock 3,000 20,000 200,000
Collision in fairway 1,180 354,000 3,540,000
Bridge 500 20,000 2,000,000
Dock 500 2,000 20,000
other 500 2,000 20,000
lock 500 5,000 200,000
fairway 500 10,000 100,000
grounding 0 20,000 300,000
traffic accidents
Fire/Explosion 50,000 500,000 5,000,000
Foundering 8,000,000 8,000,000 8,000,000
Other 3,000 20,000 200,000
Unknown 3,000 20,000 200,000
Table 15: Material damage as a result of an analysis of Dutch Figures
The average damage can be calculated when the percentages of the three categories of
damage is known. The next Table indicates the percentages for these categories for
the standard vessel with a length of 118 m. A correction of these percentages has been
made based on the following correction formulae:
heavyheavy oldPercentageLnewPercentage0394.0118*10*2
0394.010*24
4
++
=−
−
Equation 12
And,

lightlight oldPercentageLnewPercentage5283.0118*10*2
5283.010*24
4
++
=−
−
Equation 13
If these equations are analysed it appears that with length larger than 118 m the
percentages of heavy and light damage are decreasing. This is one expect with the
reduced speeds in ports and larger vessels.
The following Table indicates the damage values for a vessel that has a length of 185
m.
accident type Euro
nearly
none light heavy
nearly
none light heavy Euro
Collision in dock 203,121 51.50% 44.21% 4.30% 44.88% 51.57% 3.54% 133,628
Collision in lock 16,126 57.14% 42.86% 0.00% 50.00% 50.00% 0.00% 11,500
Collisions fairway 1,155,962 47.80% 34.88% 17.32% 45.02% 40.69% 14.29% 650,297
Bridge 409,412 37.21% 50.25% 12.55% 31.03% 58.62% 10.34% 218,776
Dock 1,977 71.32% 26.84% 1.84% 67.17% 31.31% 1.52% 1,265
other 2,165 84.52% 11.88% 3.60% 83.17% 13.86% 2.97% 1,287
lock 13,882 66.67% 29.81% 3.52% 62.32% 34.78% 2.90% 7,848
fairway 23,867 54.44% 34.01% 11.55% 50.79% 39.68% 9.52% 13,746
grounding 5,775 94.07% 5.04% 0.89% 93.38% 5.88% 0.74% 3,382
traffic accidents
Fire/Explosion 279,964 71.43% 28.57% 0.00% 66.67% 33.33% 0.00% 200,000
Foundering 12,542,373 85.71% 14.29% 0.00% 83.33% 16.67% 0.00% 8,000,000
Other 13,795 84.77% 13.45% 1.78% 82.84% 15.69% 1.47% 8,564
Unknown 54,394 46.66% 40.77% 12.57% 42.07% 47.56% 10.37% 31,506
Table 16: Damage costs of a vessel of 185 m based on the costs of an average vessel.
The Table above also indicated that the damage costs for a larger vessel are larger
than the average damage costs of the standard vessel. The following compensation
formula is used:
118/*)***)1((cos ,118
LDamagePercentageDamagePercentageDamagePercentagePercentagetsDamage
heavyheavylight
lightnonetlightheavynew
+
+−−=
Equation 14
The values shown in the second column of the Table above are calculated with this
formula.
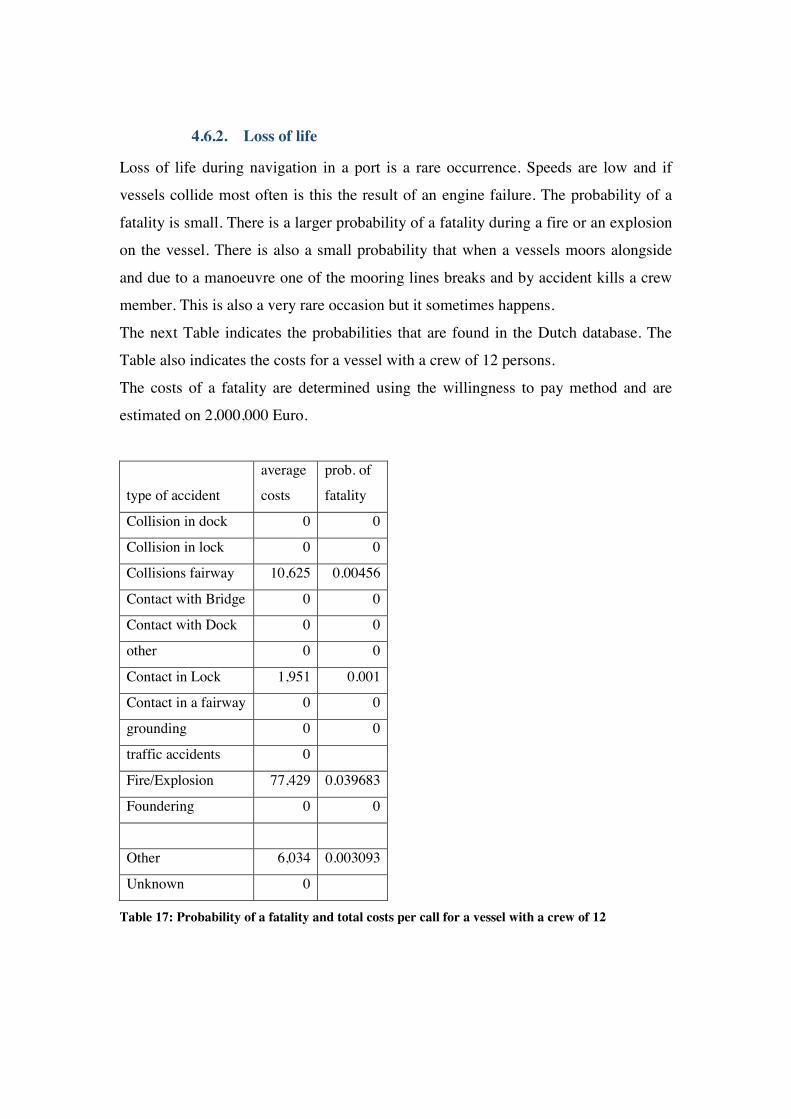
4.6.2. Loss of life
Loss of life during navigation in a port is a rare occurrence. Speeds are low and if
vessels collide most often is this the result of an engine failure. The probability of a
fatality is small. There is a larger probability of a fatality during a fire or an explosion
on the vessel. There is also a small probability that when a vessels moors alongside
and due to a manoeuvre one of the mooring lines breaks and by accident kills a crew
member. This is also a very rare occasion but it sometimes happens.
The next Table indicates the probabilities that are found in the Dutch database. The
Table also indicates the costs for a vessel with a crew of 12 persons.
The costs of a fatality are determined using the willingness to pay method and are
estimated on 2,000,000 Euro.
type of accident
average
costs
prob. of
fatality
Collision in dock 0 0
Collision in lock 0 0
Collisions fairway 10,625 0.00456
Contact with Bridge 0 0
Contact with Dock 0 0
other 0 0
Contact in Lock 1,951 0.001
Contact in a fairway 0 0
grounding 0 0
traffic accidents 0
Fire/Explosion 77,429 0.039683
Foundering 0 0
Other 6,034 0.003093
Unknown 0
Table 17: Probability of a fatality and total costs per call for a vessel with a crew of 12

4.6.3. Injuries
Injuries during navigation in a port are rare occurrences. Speeds are low and if vessels
collide most often is this the result of an engine failure. The probability of an injury is
small. There is a larger probability of an injury during a fire or an explosion on the
vessel. There is also a small probability that when a vessels moors alongside and due
to a manoeuvre one of the mooring lines breaks and by accident injures a crew
member. This is also a very rare occasion but it sometimes happens.
The next Table indicates the probabilities that are found in the Dutch database. The
Table also indicates the costs for a vessel with a crew of 12 persons.
The costs of an injury are determined using the “willingness to pay method” and are
estimated on 150,000 Euro.
accident type Euro probability Collision in dock 5,091 0.002829 Collision in lock 0 0 Collisions fairway 24,624 0.01368 Bridge 24,129 0.013405 Dock 18,000 0.01 other 0 0 lock 7,884 0.00438 fairway 0 0 grounding 0 0 traffic accidents 0 Fire/Explosion 428,571 0.238095 Foundering 0 0 Other 16,700 0.009278 Unknown 0 0
Table 18: Probability of an injury and total costs per call for a vessel with a crew of 12

4.7. Pollution
4.7.1. Cargo Oil
The probability of an oil spill due to an accident in a port area is small. The following
Table gives some information. First an oil spill can only be expected when the vessel
is involved in a (relatively) heavy accident. It is assumed that these accidents might
give a probability of an oil spill. The percentage of heavy damage is taken from the
accident files of the Ministry of Transport in The Hague. A study of the Port
Authority of Rotterdam indicated that even in the case of heavy damage the
probability of a large or a small oil spill are small. Generally speaking the probability
of a large spill is assumed to take place in 5% of the cases and a small spill in 10% of
the cases of heavy damage. When a tank vessel has a double hull, the Rotterdam study
indicated that the probabilities of a spill were 10% of the values of a single hull.
The costs of cleaning up an oil spill in a port environment are difficult to determine,
since generally no data are available. For large spills at sea more information is
available and by extrapolating these values a cost of € 10,000/m³ has been established.
The size of the spills is taken as a fixed part of the total amount of oil that is carried
on board.
The following values are taken:
30/argargarg dooilonboarcooilspillecl = Equation 15
100/argarg dooilonboarcooilspillsmallc = Equation 16

Table 19: Probabilities and average pollution costs for a tanker with a length of 185 m and single hull
4.7.2. Bunkers
The probability of a bunker oil spill due to an accident in a port area is small. The
following Table gives some information. First a bunker spill can only be expected
when the vessel is involved in a (relatively) heavy accident. It is assumed that these
accidents might give a probability of a bunker spill. The percentage of heavy damage
is taken from the accident files of the Ministry of Transport in The Hague. A study of
the Port Authority of Rotterdam indicated that even in the case of heavy damage the
probability of a large or a small bunker spill are small. Generally speaking the
probability of a large spill is assumed to take place in 5% of the cases and a small spill
in 10% of the cases of heavy damage. When a tank vessel has a double hull the
Rotterdam study indicated that the probabilities of a spill were 10% of the values of a
single hull.
The costs of cleaning up the bunker oil spill in a port environment are difficult to
determine, since generally no data are available. For large bunker spills at sea more
accident type
Euro % heavy damage
probability large spill
probability small spill
cleanup costs/m3
Probability large spill double hull
Probability small spill double hull
Collision in dock 15,157 4.33% 0 0.1 10000 0 0.01 Collisions fairway 133,333 14.29% 0.05 0.1 10000 0.005 0.01 Bridge 96,552 10.34% 0.05 0.1 10000 0.005 0.01 Dock 14,141 1.52% 0.05 0.1 10000 0.005 0.01 other 27,723 2.97% 0.05 0.1 10000 0.005 0.01 lock 27,053 2.90% 0.05 0.1 10000 0.005 0.01 fairway 88,889 9.52% 0.05 0.1 10000 0.005 0.01 grounding 6,863 0.74% 0.05 0.1 10000 0.005 0.01 traffic accidents Fire/Explosion 0 0.00% 0.05 0.1 10000 0.005 0.01 Foundering 0 0.00% 0.05 0.1 10000 0.005 0.01 Other 13,725 1.47% 0.05 0.1 10000 0.005 0.01 Unknown 85,366 9.15% 0.05 0.1 10000 0.005 0.01 Total 508,803

information is available and by extrapolating these values a cost of € 10,000 has been
established. The size of the spills is taken as a fixed part of the total amount of oil that
is carried on board.
The following values are taken:
6/kerkerarg sonboardbunoilspillebunl = Equation 17
30/kerker sonboardbunoilspillsmallbun = Equation 18
accident type
Euro % heavy damage
Probability large spill
Probability small spill costs/m^3
Probability large spill double hull
Probability small spill double hull
Collision in dock 404 4.33% 0.10% 1.50% 10000 0.00% 0.15% Collision in lock 0 0.00% 0.10% 1.50% 10000 0.01% 0.15%
Collisions fairway 1,333 14.29% 0.10% 1.50% 10000 0.01% 0.15% Bridge 966 10.34% 0.10% 1.50% 10000 0.01% 0.15%
Dock 141 1.52% 0.10% 1.50% 10000 0.01% 0.15% other 277 2.97% 0.10% 1.50% 10000 0.01% 0.15% lock 271 2.90% 0.10% 1.50% 10000 0.01% 0.15%
fairway 889 9.52% 0.10% 1.50% 10000 0.01% 0.15% grounding 69 0.74% 0.10% 1.50% 10000 0.01% 0.15%
traffic accidents Fire/Explosion 0 0.00% 0.10% 1.50% 10000 0.01% 0.15%
Foundering 0 0.00% 0.10% 1.50% 10000 0.01% 0.15%
Other 137 1.47% 0.10% 1.50% 10000 0.01% 0.15% Unknown 854 9.15% 0.10% 1.50% 10000 0.01% 0.15%
Total 5,341 Table 20: Probabilities and average bunker pollution costs for a tanker with a length of 185 m and double hull
4.7.3. Chemical cargoes
The probability of a chemical spill due to an accident in a port area is small. The
following Table gives some information. First a chemical spill can only be expected
when the chemical vessel is involved in a (relatively) heavy accident. It is assumed
that these accidents might give a probability of a chemical spill. The percentage of
heavy damage is taken from the accident files of the Ministry of Transport in The
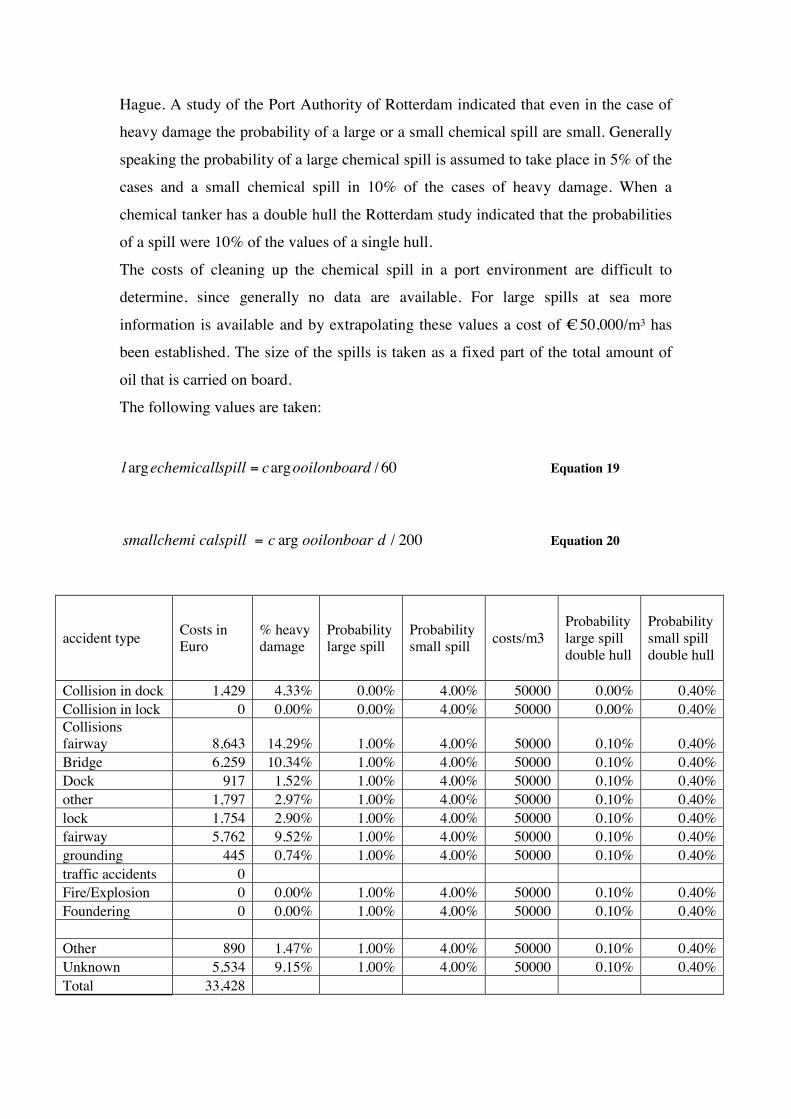
Hague. A study of the Port Authority of Rotterdam indicated that even in the case of
heavy damage the probability of a large or a small chemical spill are small. Generally
speaking the probability of a large chemical spill is assumed to take place in 5% of the
cases and a small chemical spill in 10% of the cases of heavy damage. When a
chemical tanker has a double hull the Rotterdam study indicated that the probabilities
of a spill were 10% of the values of a single hull.
The costs of cleaning up the chemical spill in a port environment are difficult to
determine, since generally no data are available. For large spills at sea more
information is available and by extrapolating these values a cost of € 50,000/m³ has
been established. The size of the spills is taken as a fixed part of the total amount of
oil that is carried on board.
The following values are taken:
60/argarg dooilonboarcspillechemicalll = Equation 19
200/arg dooilonboarccalspillsmallchemi = Equation 20
accident type Costs in Euro
% heavy damage
Probability large spill
Probability small spill costs/m3
Probability large spill double hull
Probability small spill double hull
Collision in dock 1,429 4.33% 0.00% 4.00% 50000 0.00% 0.40% Collision in lock 0 0.00% 0.00% 4.00% 50000 0.00% 0.40% Collisions fairway 8,643 14.29% 1.00% 4.00% 50000 0.10% 0.40% Bridge 6,259 10.34% 1.00% 4.00% 50000 0.10% 0.40% Dock 917 1.52% 1.00% 4.00% 50000 0.10% 0.40% other 1,797 2.97% 1.00% 4.00% 50000 0.10% 0.40% lock 1,754 2.90% 1.00% 4.00% 50000 0.10% 0.40% fairway 5,762 9.52% 1.00% 4.00% 50000 0.10% 0.40% grounding 445 0.74% 1.00% 4.00% 50000 0.10% 0.40% traffic accidents 0 Fire/Explosion 0 0.00% 1.00% 4.00% 50000 0.10% 0.40% Foundering 0 0.00% 1.00% 4.00% 50000 0.10% 0.40% Other 890 1.47% 1.00% 4.00% 50000 0.10% 0.40% Unknown 5,534 9.15% 1.00% 4.00% 50000 0.10% 0.40% Total 33,428

Table 21: Probabilities and average chemical pollution costs for a tanker with a length of 185 m and double hull
4.7.4. Gas cargoes
The probability of a gas outflow due to an accident in a port area is small. The
following Table gives some information. First a gas outflow can only be expected
when the gas carrier is involved in a (relatively) heavy accident. It is assumed that
these accidents might give a probability of a gas outflow. The percentage of heavy
damage is taken from the accident files of the Ministry of Transport in The Hague. It
is assumed that a small gas outflow is associated with the loss of life of 5 persons,
whilst a large gas outflow is associated with the loss of life of 100 persons. The size
of the gas outflow is taken as the contents of one gas tank. For the present calculation
the size of the tank is immaterial but it can be envisaged that the gas volume may play
a role when attempts are being made to calculate the number of people that may be
intoxicated by the gas cloud and hence are injured but not killed. This calculation is
not part of the software yet.
The following values are taken:
16/lgarg nboardgasvolumeoasspillsmalegasspilll == Equation 21
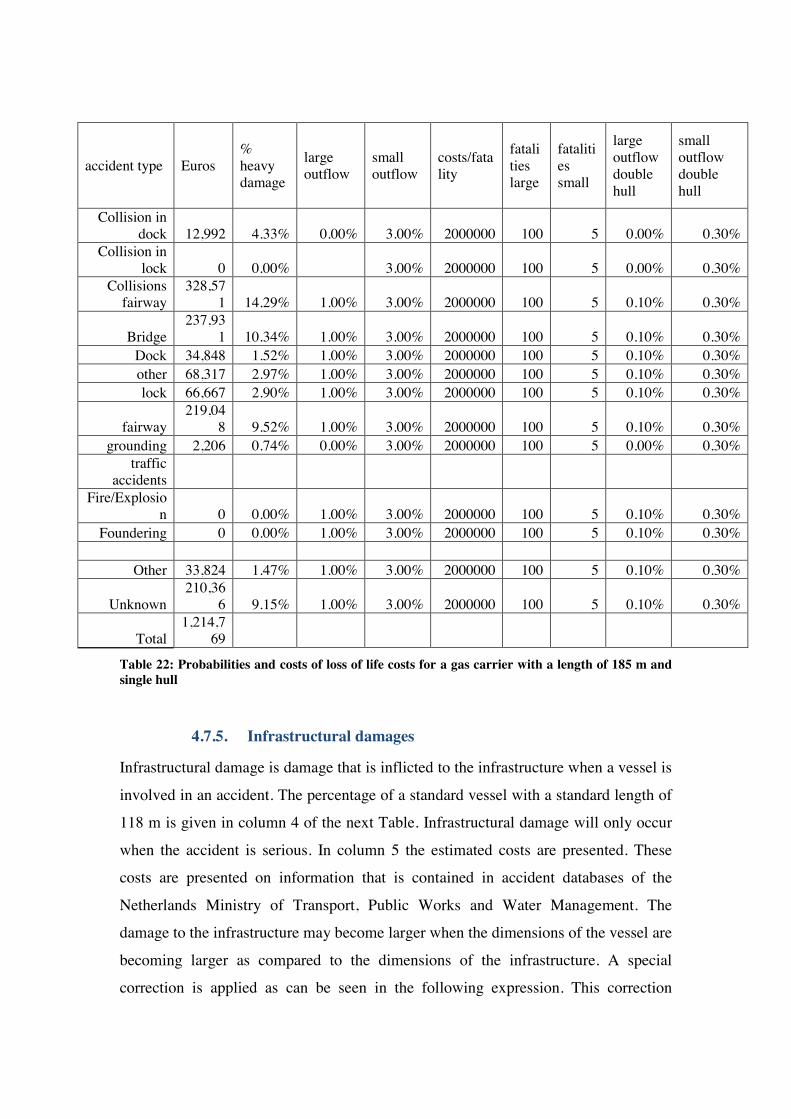
accident type Euros % heavy damage
large outflow
small outflow
costs/fatality
fatalities large
fatalities small
large outflow double hull
small outflow double hull
Collision in dock 12,992 4.33% 0.00% 3.00% 2000000 100 5 0.00% 0.30%
Collision in lock 0 0.00% 3.00% 2000000 100 5 0.00% 0.30%
Collisions fairway
328,571 14.29% 1.00% 3.00% 2000000 100 5 0.10% 0.30%
Bridge 237,93
1 10.34% 1.00% 3.00% 2000000 100 5 0.10% 0.30% Dock 34,848 1.52% 1.00% 3.00% 2000000 100 5 0.10% 0.30% other 68,317 2.97% 1.00% 3.00% 2000000 100 5 0.10% 0.30% lock 66,667 2.90% 1.00% 3.00% 2000000 100 5 0.10% 0.30%
fairway 219,04
8 9.52% 1.00% 3.00% 2000000 100 5 0.10% 0.30% grounding 2,206 0.74% 0.00% 3.00% 2000000 100 5 0.00% 0.30%
traffic accidents
Fire/Explosion 0 0.00% 1.00% 3.00% 2000000 100 5 0.10% 0.30%
Foundering 0 0.00% 1.00% 3.00% 2000000 100 5 0.10% 0.30%
Other 33,824 1.47% 1.00% 3.00% 2000000 100 5 0.10% 0.30%
Unknown 210,36
6 9.15% 1.00% 3.00% 2000000 100 5 0.10% 0.30%
Total 1,214,7
69
Table 22: Probabilities and costs of loss of life costs for a gas carrier with a length of 185 m and single hull
4.7.5. Infrastructural damages
Infrastructural damage is damage that is inflicted to the infrastructure when a vessel is
involved in an accident. The percentage of a standard vessel with a standard length of
118 m is given in column 4 of the next Table. Infrastructural damage will only occur
when the accident is serious. In column 5 the estimated costs are presented. These
costs are presented on information that is contained in accident databases of the
Netherlands Ministry of Transport, Public Works and Water Management. The
damage to the infrastructure may become larger when the dimensions of the vessel are
becoming larger as compared to the dimensions of the infrastructure. A special
correction is applied as can be seen in the following expression. This correction
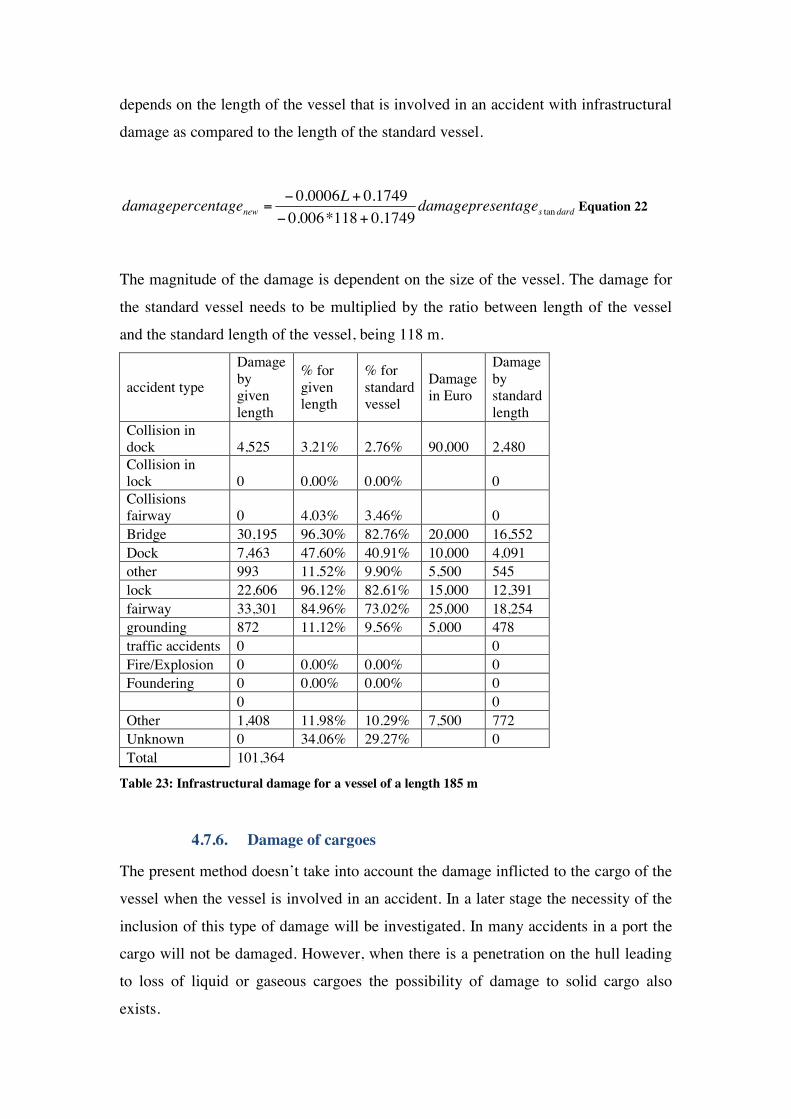
depends on the length of the vessel that is involved in an accident with infrastructural
damage as compared to the length of the standard vessel.
dardsnew entagedamagepresLentagedamageperc tan1749.0118*006.01749.00006.0
+−+−
= Equation 22
The magnitude of the damage is dependent on the size of the vessel. The damage for
the standard vessel needs to be multiplied by the ratio between length of the vessel
and the standard length of the vessel, being 118 m.
accident type
Damage by given length
% for given length
% for standard vessel
Damage in Euro
Damage by standard length
Collision in dock 4,525 3.21% 2.76% 90,000 2,480 Collision in lock 0 0.00% 0.00% 0 Collisions fairway 0 4.03% 3.46% 0 Bridge 30,195 96.30% 82.76% 20,000 16,552 Dock 7,463 47.60% 40.91% 10,000 4,091 other 993 11.52% 9.90% 5,500 545 lock 22,606 96.12% 82.61% 15,000 12,391 fairway 33,301 84.96% 73.02% 25,000 18,254 grounding 872 11.12% 9.56% 5,000 478 traffic accidents 0 0 Fire/Explosion 0 0.00% 0.00% 0 Foundering 0 0.00% 0.00% 0 0 0 Other 1,408 11.98% 10.29% 7,500 772 Unknown 0 34.06% 29.27% 0 Total 101,364
Table 23: Infrastructural damage for a vessel of a length 185 m
4.7.6. Damage of cargoes
The present method doesn’t take into account the damage inflicted to the cargo of the
vessel when the vessel is involved in an accident. In a later stage the necessity of the
inclusion of this type of damage will be investigated. In many accidents in a port the
cargo will not be damaged. However, when there is a penetration on the hull leading
to loss of liquid or gaseous cargoes the possibility of damage to solid cargo also
exists.

4.8. Time efficiency of vessels in a port
4.8.1. Mooring times
Mooring times play a role in the efficiency of ports since the pilot will stay on board
until the time that the vessel is safety moored alongside. In many cases the tugs are
standby or are even pushing to contribute to the process of making fast. In many cases
the time of this process will not play a role in the costs of the pilot, but in some cases
pilot costs are dependent from the total time the pilot spent on board.
It is, hence, necessary to determine the mooring time. The following Figure is an
example of a relationship of mooring times such as the size of the vessel and the
weather conditions.
BCBFLAeMooringtim /)/1)(50( +−= Equation 23
In this expression:
A, B and C are constants (In this case A=7, B=100 and C=4)
L is the length in m
BF is the pertaining wind condition expressed in Beaufort Number.
mooring times
0
20
40
60
80
100
120
0 100 200 300 400length of vessel
moo
ring
time
in m
inut
es
BF0BF1BF2BF3BF4BF5BF6BF7BF8BF9BF10BF11
Table 24: Mooring time as function of ship length and BF number

Unmooring is taken as 20% of the mooring time for all cases.
4.8.2. Relative speeds of vessels in the port confines
The efficiency of the movement of vessels is an important issue in discussions on
VTS. A VTS should not only enhance the safety but should also contribute to the
efficiency of the movements in a port. It is not easy to determine the efficiency in a
quantitative way. In many cases the efficiency of a VTS is measured in organisational
parameters. These issues are the timely arrival of a pilot and the availability and
punctuality of the tugs and the mooring gangs. The vessel is then not delayed. The
calculation of delay due to the availability or non availability is difficult to determine.
It is highly dependent in the number and bollard pull of the tugs that are available at
the moment that the vessel calls at the port. The same reasoning is valid for the pilot
and the mooring gangs. In times of extremely intense traffic it might well be that a
vessel cannot be serviced immediately but European ports generally have
dimensioned their resources in such a way that waiting times don’t occur frequently.
In this report we will assume that at all times sufficient resources are available. As a
consequence no delays will be taken into account as a result of late or insufficient
resources.
The base option is a FSA is a specific selected condition. It seems rather
straightforward to take as the base situation a vessel that calls in a port without any
Navigation Support Service.
The question is what relative speed would be used by the navigator during different
options.
The time that a vessel needs to reach its berth is important since if more time is
required in cases with less or none NSSs the extra time needs to be converted in
money, using the costs of the time of the vessel that is considered
The exercise is rather theoretical since no data are available for the base case. An
attempt has been made to indicate the differences between the different options.
The next Figure shows the speed relations for the different NSSs (Risk Control
Options). The general form of the expression is as follows:
2* BFBAVrelative −= Equation 24
In this equation A and B are constants.

BF is the instantaneous wind force according to the Beaufort scale
In the next Table the coefficients are displayed.
no
nautical
support
VTS VTS+EXEMP VTS+SBP POB VTS+POB VTS+POB+PPU
A 0.68 0.82 1 0.92 0.93 0.99 1
B 0.0049 0.0042 0.00373 0.0039 0.004 0.00376 0.00373
Table 25: The coefficients of the relative speed as function of the Navigation Support Service
Relative speed as function of windforce and NSS
0.000
0.2000.400
0.600
0.8001.000
1.200
0 5 10 15BF
rela
tive
spee
d no nautical supportVTSVTS+EXEMPVTS+SBPPOBVTS+POBVTS+POB+PPU
Figure 32: Relative speed of a vessel in a port as function of wind force and Navigation Support Service

4.9 FSA calculations
4.9.1. Scenarios
The scenario for the calculations of the appropriate Navigation Support Service is
determined by the following range of parameters. In the following sections the
scenario parameters will be discussed.
4.9.1.1. Range of types of vessels The following ship types are considered.
• Chemical tanker
• LNG carrier
• LPG carrier
• Product tanker
• Oil tanker
• Refrigerated carrier
• General dry cargo vessel
• Container vessel
• Ro-ro vessel with unguided lorries
• Ro-ro vessel with guided lorries
• Bulk carrier
4.9.1.2. Range of ports
The following range of ports is considered:
• Rotterdam (Rijnmond)
• Genova
• Göteborg
More ports can be easily inserted. When it is accepted that the casualty rates are
determined by comparison with Dutch ports, the essential data of all non Dutch ports
may be inserted when pilot-rates, tug-rates and mooring charges are known.
4.9.1.3. Costs of Shore Based Pilotage and PPU
In order to have comparable services the following assumptions have been made.

The Navigation Support Services consisting of shore-based pilotage and pilotage on
board with a PPU are having fixed costs ratios. These ratios are given in the next
Table.
Type of pilotage Ratio of service compared
POB (Pilot on Board) 1
SBP (Shore Based Pilot) 0.5
POB+PPU (POB with a Personal Pilot Unit) 1.03
Table 26: Ratio of Navigation Support Services compared with the Pilot on Board
The situation in the three ports considered deviates from this scenario.
In the port of Rotterdam, permanent Shore Based Pilotage is not (yet) implemented.
The reason behind it is that the Pilotage Organisation finds that SBP is a suboptimal
solution and can only be applied in those circumstances that a pilot cannot be safely
boarded in the Pilot Boarding area. In those cases the duty pilot replaces the VTS-
operator and he combines the task of a VTS-operator and a shore based pilot. As soon
as the vessel is within the moles and a pilot boat can come alongside of the vessel to
be piloted a pilot is boarding the vessel and the vessel continues with POB and as
soon as the vessel has left the VTS sector a VTS-operator is assisting the vessel. The
pilot service is often suspended for small vessel when the BF scale exceeds BF 6, but
it is also depending on the wind-direction. For larger vessels the limit of bringing a
pilot is higher but normally the pilot service is suspended with BF 9. The use of
helicopters to bring a pilot on board is even somewhat higher.
Based on these considerations the pilot service finds that the costs of remote pilotage
under these conditions should be equal to the costs of normal pilotage.
In Genova the way in which SBP is understood namely as VHF assistance for selected
large vessels and all smaller departing vessels, is said to be different from the
concepts use in this report. In fact VHF assistance is given by the pilots and is in fact
nothing else than SBP. Tariffs are different than the normal pilot dues.
The situation in Göteborg is again different. Göteborg has a relative large number of
ferry and Ro-ro vessels that frequently call at the port. All these vessels can apply for
pilot exemption certificates. The need for shore based pilotage is so small that this as
not been considered.
In order to create the same and comparable conditions the NSS are implemented in
the same way in the scenario calculations.

4.9.1.4. Standard port distances
The software provides the possibility to input the realistic values of a journey through
the port. This option will not be used in the scenario calculations presented in this
report. The following Table indicates the average distances that are assumed in the
three ports.
designation Total port distance
Dock distance
Rotterdam 40.6 km 4.0 km
Genova 13.3 km 3.0 km
Göteborg 60.0 km 4.0 km
Table 27: Average distances in the three ports
4.9.1.5. Speed in ports
The assumption for speeds is that in the approach and fairway a given percentage of
the service speed will be kept for ideal conditions. Normally this value will be
reduced by weather effects as discussed in section.
The next Table give the reduction percentages:
Designation % of speed in fairway and
approach % of speed in docks
Rotterdam 70% 25%
Genova 50% 20%
Göteborg 70% 25%
Table 28: Speed reductions relative to service speed for fairways and approach and in the dock basins
4.9.1.6. Exemptions
In many ports there is a possibility to obtain exemptions of the obligation to take a
pilot on board. There are rules under which conditions a vessel and its master, as an
inseparable entity, can obtain an exemption.
Exemptions are possible in the port of Rotterdam and Göteborg. It is assumed in the
scenarios for these ports that at least 10 calls need to be made to keep the exemption
valid, provided that the master has shown his proficiency to pilot the vessel in and out
the port in a satisfactory way to the pilotage organisation
Genova doesn’t have this option. It is assumed that the same option is valid for
Genova.
4.9.1.7. Length of vessels
The real important input value is the length of the vessel. It is assumed that the Length
between particulars is the only parameter. But, in fact, some of the Tables in the
different ports to calculate the pilot dues or tug rates use different length dimensions
of the vessel. Since this is highly confusing and direct relations between different
lengths for a vessel are missing in is assumed that the length between perpendiculars
is the only value for length.
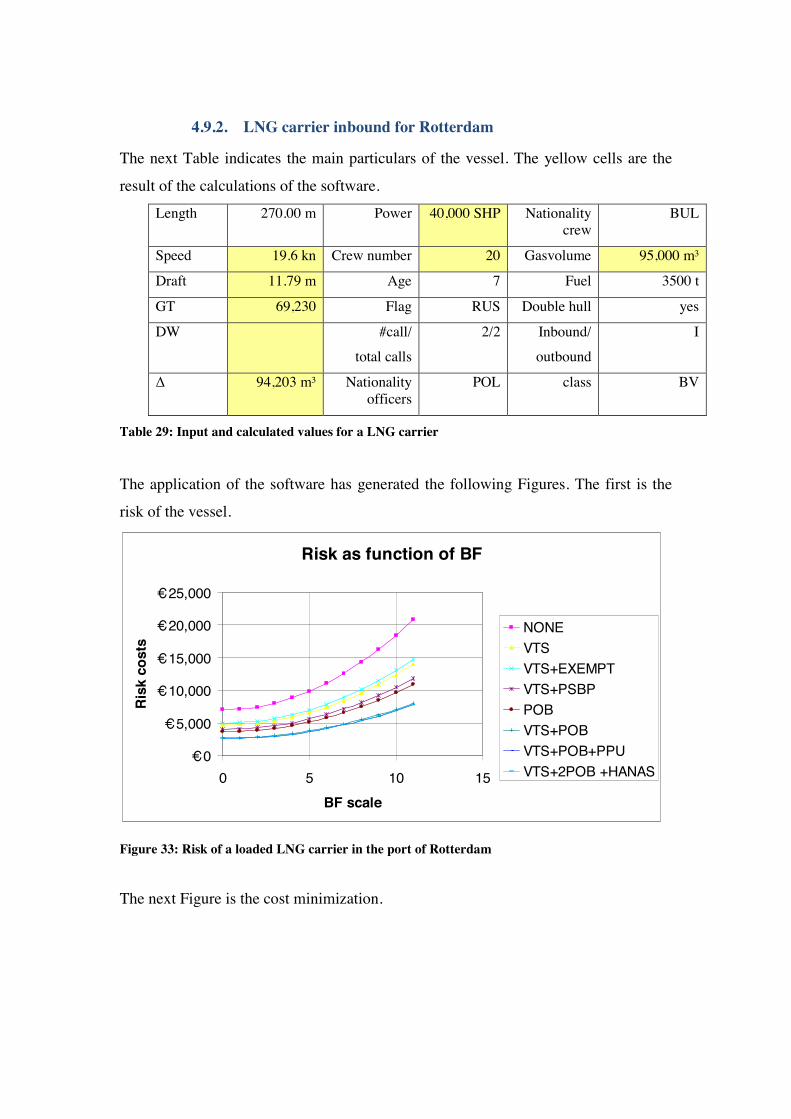
4.9.2. LNG carrier inbound for Rotterdam
The next Table indicates the main particulars of the vessel. The yellow cells are the
result of the calculations of the software.
Length 270.00 m Power 40,000 SHP Nationality crew
BUL
Speed 19.6 kn Crew number 20 Gasvolume 95,000 m³
Draft 11.79 m Age 7 Fuel 3500 t
GT 69,230 Flag RUS Double hull yes
DW #call/
total calls
2/2 Inbound/
outbound
I
∆ 94,203 m³ Nationality officers
POL class BV
Table 29: Input and calculated values for a LNG carrier
The application of the software has generated the following Figures. The first is the
risk of the vessel.
Risk as function of BF
€ 0
€ 5,000
€ 10,000
€ 15,000
€ 20,000
€ 25,000
0 5 10 15BF scale
Risk
cos
ts
NONEVTSVTS+EXEMPTVTS+PSBPPOBVTS+POBVTS+POB+PPUVTS+2POB +HANAS
Figure 33: Risk of a loaded LNG carrier in the port of Rotterdam
The next Figure is the cost minimization.

Costs minimalisation
020,00040,00060,00080,000
100,000120,000140,000
0 3 6 9 12BFscale
Cos
ts
noneVTSVTS and ExemptionVTS and SBPPOBVTS and POBVTS andPOB and PPU
Figure 34: Costs minimization for a LNG Carrier in Rotterdam
The differences between the different options are small. For the lower wind classes
the VTS is the best option. For BF4 the option VTS+POB is the best and from all BF
classes higher and including BF6 the best option is VTS+POB+PPU.

4.9.3. Chemical tanker inbound for Rotterdam
The next Table indicates the main particulars of the vessel. The yellow cells are the
result of the calculations of the software.
Length 185.00 m Power 12,500 SHP
Nat crew TAI
Speed 15.0 kn Crew number
18 Volume 35,000 m³
Draft 11.60 m Age 28 Fuel 1400 t
GT 21,068 Flag NTH Double hull no
DW 35,454 #call/ total calls
1/2 Inbound/ outbound
I
∆ 47,298 m³ Nat officers NTHL class LR
Table 30: Input and calculated values for a chemical tanker
The application of the software has generated the following Figures. The first is the
risk of the vessel.
Risk as function of BF
€ 0
€ 5,000
€ 10,000
€ 15,000
€ 20,000
€ 25,000
€ 30,000
0 5 10 15BF scale
Risk
cos
ts
NONEVTSVTS+EXEMPTVTS+PSBPPOBVTS+POBVTS+POB+PPUVTS+2POB +HANAS
Figure 35: Risk of a loaded chemical tanker in the port of Rotterdam
The next Figure is the cost minimization.

Costs minimalisation
0
20,000
40,000
60,000
80,000
100,000
120,000
0 3 6 9 12BFscale
Cos
ts
noneVTSVTS and ExemptionVTS and SBPPOBVTS and POBVTS andPOB and PPU
Figure 36: Costs minimization for a chemical tanker in Rotterdam
In this case for the low BF classes the best option is VTS+POB. From BF 3 through
BF 10 the best option VTS+POB+PPU.
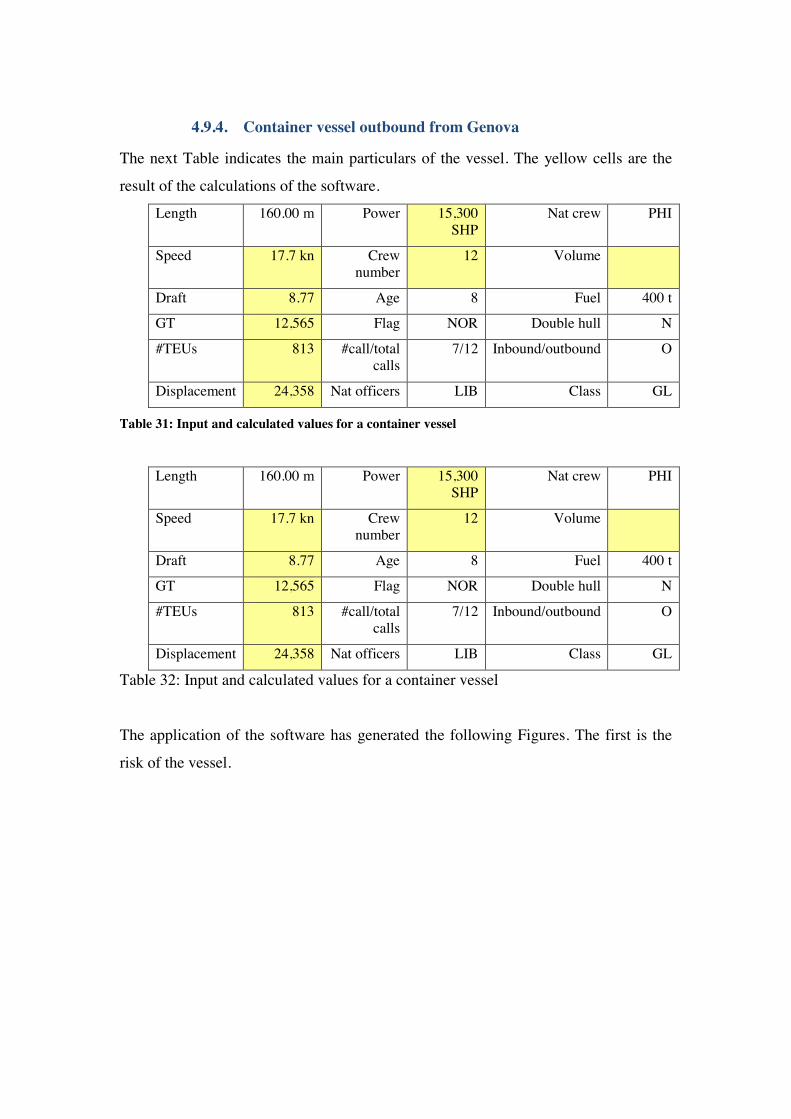
4.9.4. Container vessel outbound from Genova
The next Table indicates the main particulars of the vessel. The yellow cells are the
result of the calculations of the software.
Length 160.00 m Power 15,300 SHP
Nat crew PHI
Speed 17.7 kn Crew number
12 Volume
Draft 8.77 Age 8 Fuel 400 t
GT 12,565 Flag NOR Double hull N
#TEUs 813 #call/total calls
7/12 Inbound/outbound O
Displacement 24,358 Nat officers LIB Class GL
Table 31: Input and calculated values for a container vessel
Length 160.00 m Power 15,300 SHP
Nat crew PHI
Speed 17.7 kn Crew number
12 Volume
Draft 8.77 Age 8 Fuel 400 t
GT 12,565 Flag NOR Double hull N
#TEUs 813 #call/total calls
7/12 Inbound/outbound O
Displacement 24,358 Nat officers LIB Class GL
Table 32: Input and calculated values for a container vessel
The application of the software has generated the following Figures. The first is the
risk of the vessel.
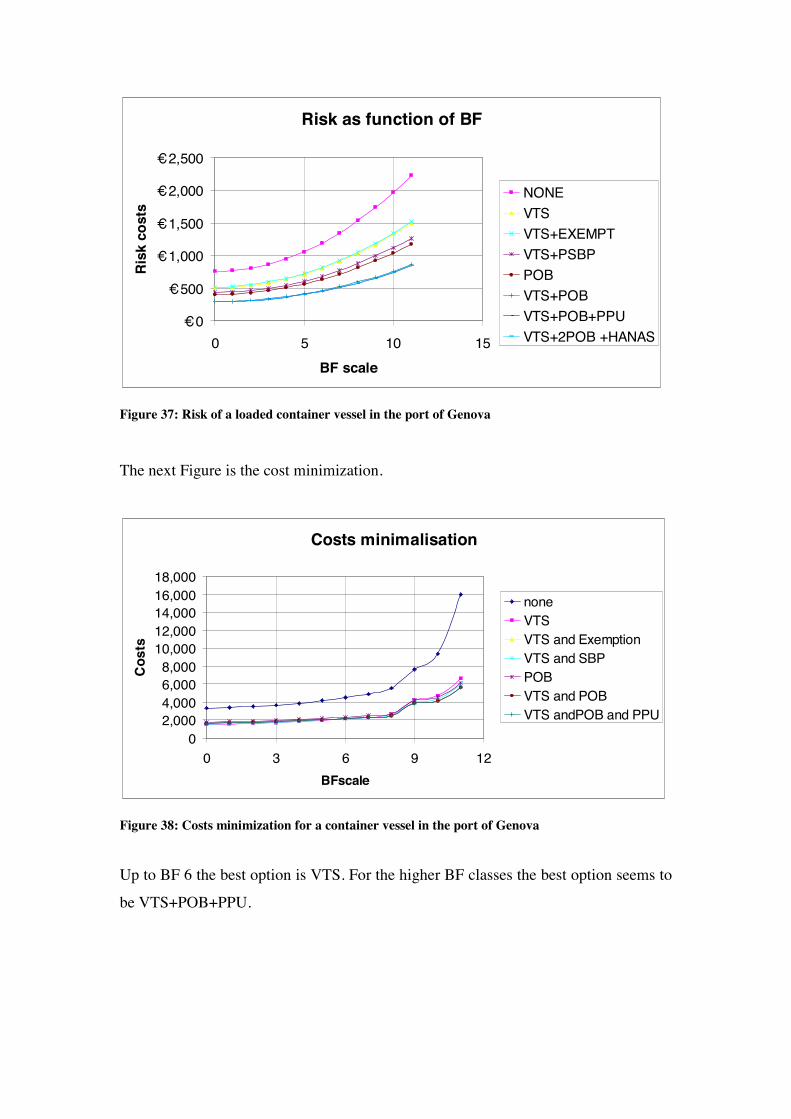
Risk as function of BF
€ 0
€ 500
€ 1,000
€ 1,500
€ 2,000
€ 2,500
0 5 10 15BF scale
Risk
cos
ts
NONEVTSVTS+EXEMPTVTS+PSBPPOBVTS+POBVTS+POB+PPUVTS+2POB +HANAS
Figure 37: Risk of a loaded container vessel in the port of Genova
The next Figure is the cost minimization.
Costs minimalisation
02,0004,0006,0008,000
10,00012,00014,00016,00018,000
0 3 6 9 12BFscale
Cos
ts
noneVTSVTS and ExemptionVTS and SBPPOBVTS and POBVTS andPOB and PPU
Figure 38: Costs minimization for a container vessel in the port of Genova
Up to BF 6 the best option is VTS. For the higher BF classes the best option seems to
be VTS+POB+PPU.

4.9.5. Reefer inbound for Rotterdam
The next Table indicates the main particulars of the vessel. The yellow cells are the
result of the calculations of the software.
Length 120.00 m
Power 7100 SHP
Nat crew GRE
Speed 16.1 kn Crew number
12 Volume 9500 m³
Draft 7.18 m Age 15 Fuel 400 t
GT 5510 Flag LIB Double hull N
Deadweight #call/total calls
1/5 Inbound/outbound I
Displacement 9837 t Nat officers SPA
Table 33: Input and calculated values for a reefer
The application of the software has generated the following Figures. The first is the
risk of the vessel.
Risk as function of BF
€ 0
€ 1,000
€ 2,000
€ 3,000
€ 4,000
€ 5,000
0 5 10 15BF scale
Risk
cos
ts
NONEVTSVTS+EXEMPTVTS+PSBPPOBVTS+POBVTS+POB+PPUVTS+2POB +HANAS
Figure 39: Risk of a loaded reefer in the port of Rotterdam
The next Figure is the cost minimization.

Costs minimalisation
0
5,000
10,000
15,000
20,000
25,000
30,000
0 3 6 9 12BFscale
Cos
ts
noneVTSVTS and ExemptionVTS and SBPPOBVTS and POBVTS andPOB and PPU
Figure 40: Costs minimization for a loaded reefer in Rotterdam
Up to BF6 the best option is VTS. For higher BF classes the best option is
VTS+POB+PPU.
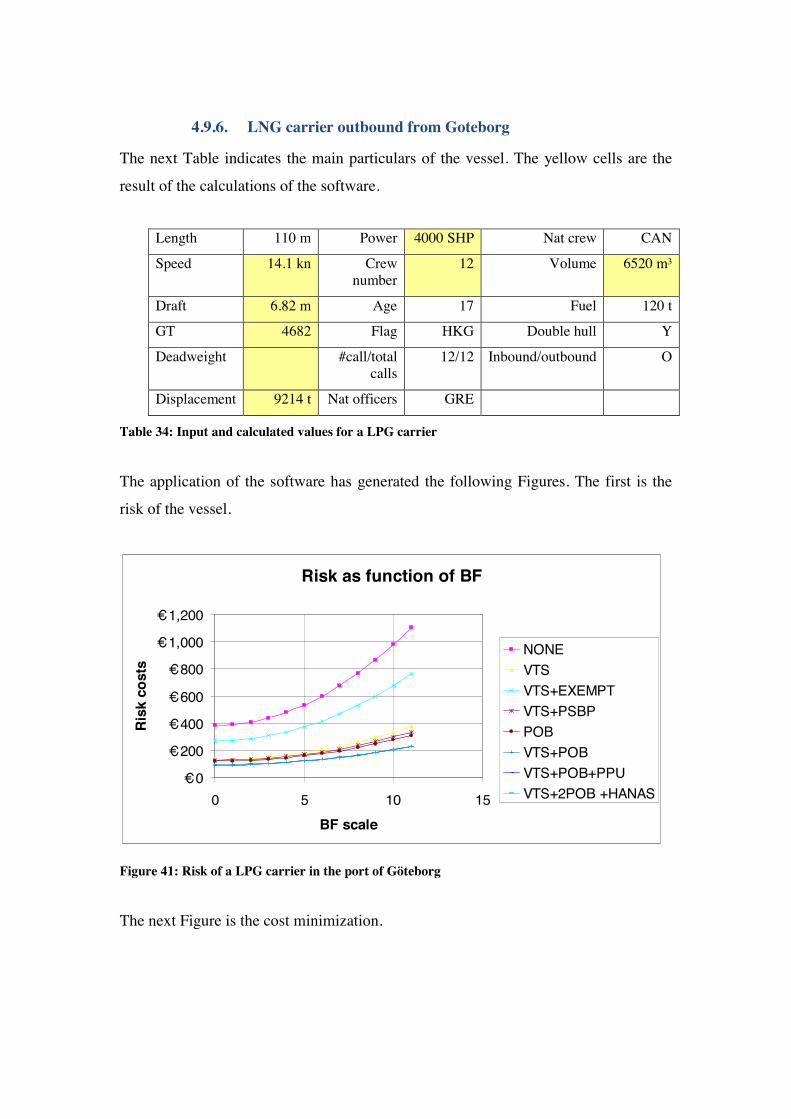
4.9.6. LNG carrier outbound from Goteborg
The next Table indicates the main particulars of the vessel. The yellow cells are the
result of the calculations of the software.
Length 110 m Power 4000 SHP Nat crew CAN
Speed 14.1 kn Crew number
12 Volume 6520 m³
Draft 6.82 m Age 17 Fuel 120 t
GT 4682 Flag HKG Double hull Y
Deadweight #call/total calls
12/12 Inbound/outbound O
Displacement 9214 t Nat officers GRE
Table 34: Input and calculated values for a LPG carrier
The application of the software has generated the following Figures. The first is the
risk of the vessel.
Risk as function of BF
€ 0
€ 200
€ 400
€ 600
€ 800
€ 1,000
€ 1,200
0 5 10 15BF scale
Risk
cos
ts
NONEVTSVTS+EXEMPTVTS+PSBPPOBVTS+POBVTS+POB+PPUVTS+2POB +HANAS
Figure 41: Risk of a LPG carrier in the port of Göteborg
The next Figure is the cost minimization.

Costs minimalisation
0
5,000
10,000
15,000
20,000
25,000
0 3 6 9 12BFscale
Cos
ts
noneVTSVTS and ExemptionVTS and SBPPOBVTS and POBVTS andPOB and PPU
Figure 42: Costs minimization for a LPG carrier in Goteborg
For the whole BF class range the best option is VTS+EXEMP.

4.9.7. Bulk carrier outbound from Genova
The next Table indicates the main particulars of the vessel. The yellow cells are the
result of the calculations of the software.
Length 250.00 m Power 22,000 SHP
Nat crew BUL
Speed 15.1 kn Crew number
20 Volume
Draft 15.03 m Age 5 Fuel 2500 t
GT 51,433 Flag DEN Double hull N
Deadweight 94,905 t #call/total calls
1/1 Inbound/outbound O
Displacement 117,266 t Nat officers NETH
Table 35: Input and calculated values for a bulk carrier
The application of the software has generated the following Figures. The first is the
risk of the vessel.
Risk as function of BF
€ 0€ 500
€ 1,000€ 1,500€ 2,000€ 2,500€ 3,000€ 3,500
0 5 10 15BF scale
Risk
cos
ts
NONEVTSVTS+EXEMPTVTS+PSBPPOBVTS+POBVTS+POB+PPUVTS+2POB +HANAS
Figure 43: Risk of a bulk carrier in the port of Genova
The next Figure is the cost minimization.

Costs minimalisation
05,000
10,00015,00020,00025,00030,00035,00040,000
0 3 6 9 12BFscale
Cos
ts
noneVTSVTS and ExemptionVTS and SBPPOBVTS and POBVTS andPOB and PPU
Figure 44: Costs minimization for a bulk carrier in Genova
For the wind classes up to and including BF6 the best option is VTS+POB. For the
higher wind classes the best option is VTS+POB+PPU.

4.9.8. Product tanker inbound for Goteborg
The next Table indicates the main particulars of the vessel. The yellow cells are the result of the calculations of the software.
Length 180.00 m Power 12,750 SHP
Nat crew BUR
Speed 15.2 kn Crew number
16 Volume
Draft 10.85 m Age 14 Fuel 1,500 t
GT 19,317 Flag JAP Double hull Y
Deadweight 31,850 #call/total calls
1/2 Inbound/outbound I
Displacement 51,224 Nat officers PAK
Table 36: Input and calculated values for a product tanker
The application of the software has generated the following Figures. The first is the
risk of the vessel.
Risk as function of BF
€ 0
€ 500
€ 1,000
€ 1,500
€ 2,000
€ 2,500
0 5 10 15BF scale
Risk
cos
ts
NONEVTSVTS+EXEMPTVTS+PSBPPOBVTS+POBVTS+POB+PPUVTS+2POB +HANAS
Figure 45: Risk of a product tanker in the port of Goteborg
The next Figure is the cost minimization.

Costs minimalisation
0
10,000
20,000
30,000
40,000
50,000
0 3 6 9 12BFscale
Cos
ts
noneVTSVTS and ExemptionVTS and SBPPOBVTS and POBVTS andPOB and PPU
Figure 46: Costs minimization for a product tanker in Goteborg
For the BF classes up and including 5 the best option is VTS, for the higher wind
classes the best option VTS+POB+PPU.
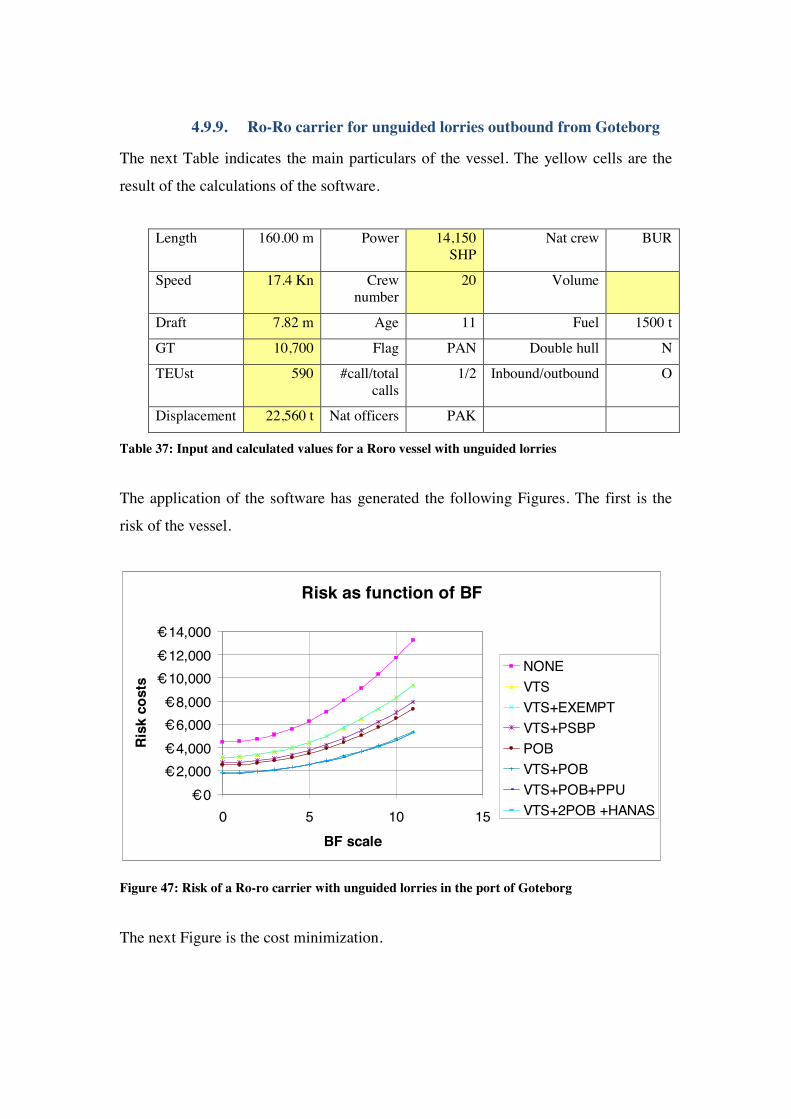
4.9.9. Ro-Ro carrier for unguided lorries outbound from Goteborg
The next Table indicates the main particulars of the vessel. The yellow cells are the
result of the calculations of the software.
Length 160.00 m Power 14,150 SHP
Nat crew BUR
Speed 17.4 Kn Crew number
20 Volume
Draft 7.82 m Age 11 Fuel 1500 t
GT 10,700 Flag PAN Double hull N
TEUst 590 #call/total calls
1/2 Inbound/outbound O
Displacement 22,560 t Nat officers PAK
Table 37: Input and calculated values for a Roro vessel with unguided lorries
The application of the software has generated the following Figures. The first is the
risk of the vessel.
Risk as function of BF
€ 0€ 2,000€ 4,000€ 6,000€ 8,000€ 10,000€ 12,000€ 14,000
0 5 10 15BF scale
Risk
cos
ts
NONEVTSVTS+EXEMPTVTS+PSBPPOBVTS+POBVTS+POB+PPUVTS+2POB +HANAS
Figure 47: Risk of a Ro-ro carrier with unguided lorries in the port of Goteborg
The next Figure is the cost minimization.
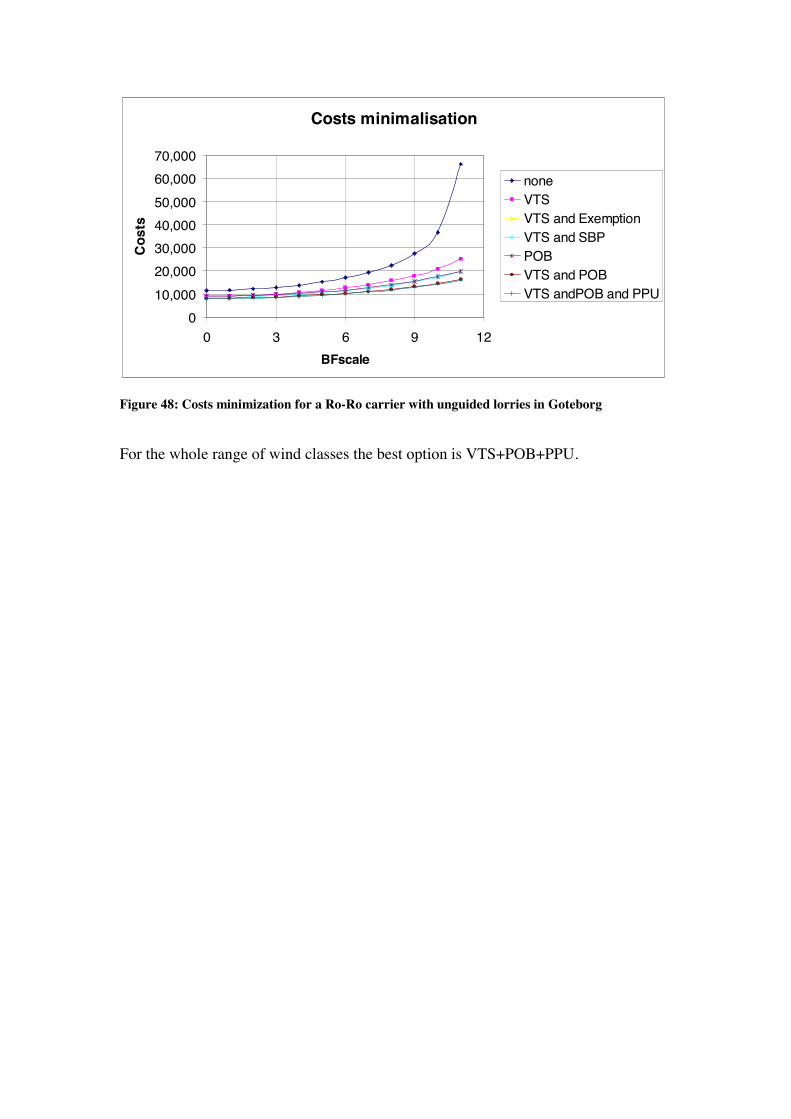
Costs minimalisation
010,00020,00030,00040,00050,00060,00070,000
0 3 6 9 12BFscale
Cos
ts
noneVTSVTS and ExemptionVTS and SBPPOBVTS and POBVTS andPOB and PPU
Figure 48: Costs minimization for a Ro-Ro carrier with unguided lorries in Goteborg
For the whole range of wind classes the best option is VTS+POB+PPU.
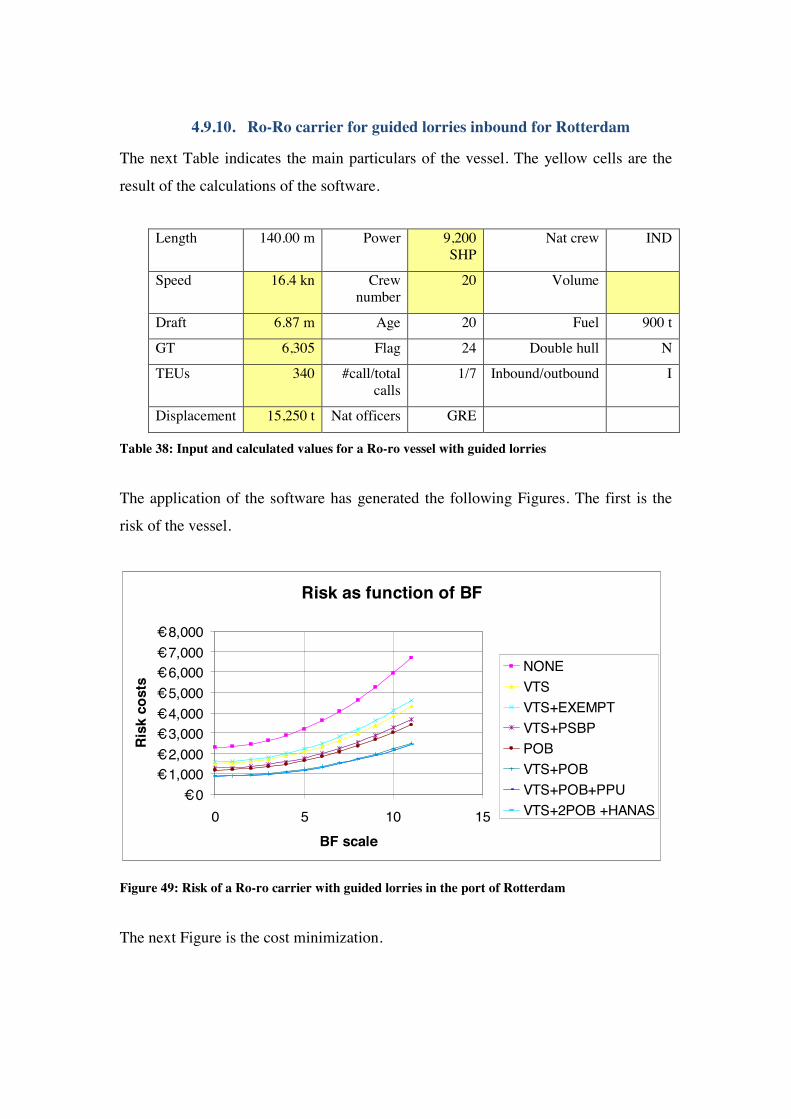
4.9.10. Ro-Ro carrier for guided lorries inbound for Rotterdam
The next Table indicates the main particulars of the vessel. The yellow cells are the
result of the calculations of the software.
Length 140.00 m Power 9,200 SHP
Nat crew IND
Speed 16.4 kn Crew number
20 Volume
Draft 6.87 m Age 20 Fuel 900 t
GT 6,305 Flag 24 Double hull N
TEUs 340 #call/total calls
1/7 Inbound/outbound I
Displacement 15,250 t Nat officers GRE
Table 38: Input and calculated values for a Ro-ro vessel with guided lorries
The application of the software has generated the following Figures. The first is the
risk of the vessel.
Risk as function of BF
€ 0€ 1,000€ 2,000€ 3,000€ 4,000€ 5,000€ 6,000€ 7,000€ 8,000
0 5 10 15BF scale
Risk
cos
ts
NONEVTSVTS+EXEMPTVTS+PSBPPOBVTS+POBVTS+POB+PPUVTS+2POB +HANAS
Figure 49: Risk of a Ro-ro carrier with guided lorries in the port of Rotterdam
The next Figure is the cost minimization.

Costs minimalisation
05,000
10,00015,00020,00025,00030,00035,000
0 3 6 9 12BFscale
Cos
ts
noneVTSVTS and ExemptionVTS and SBPPOBVTS and POBVTS andPOB and PPU
Figure 50: Costs minimization for a Ro-ro carrier with guided lorries in Rotterdam
In the range of BF0 to BF6 the best option is VTS. For BF7 the best option
VTS+POB. For higher BF classes the best option VTS+POB+PPU.
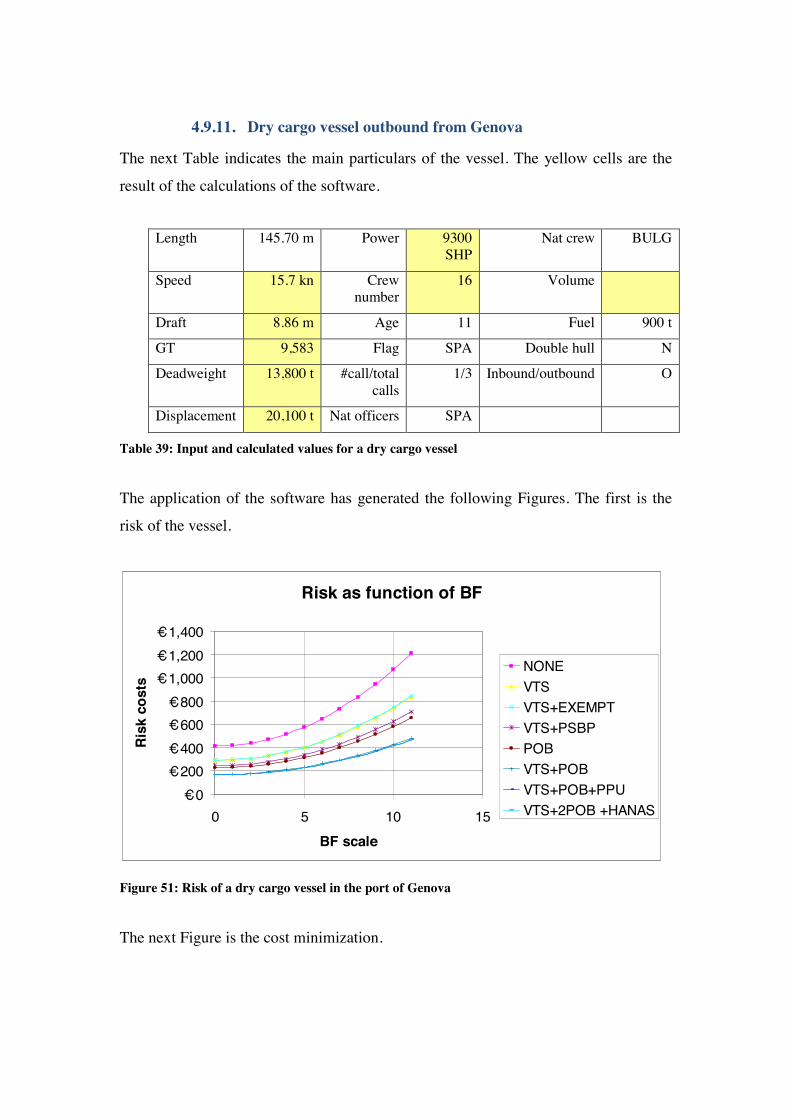
4.9.11. Dry cargo vessel outbound from Genova
The next Table indicates the main particulars of the vessel. The yellow cells are the
result of the calculations of the software.
Length 145.70 m Power 9300 SHP
Nat crew BULG
Speed 15.7 kn Crew number
16 Volume
Draft 8.86 m Age 11 Fuel 900 t
GT 9,583 Flag SPA Double hull N
Deadweight 13,800 t #call/total calls
1/3 Inbound/outbound O
Displacement 20,100 t Nat officers SPA
Table 39: Input and calculated values for a dry cargo vessel
The application of the software has generated the following Figures. The first is the
risk of the vessel.
Risk as function of BF
€ 0€ 200€ 400€ 600€ 800
€ 1,000€ 1,200€ 1,400
0 5 10 15BF scale
Risk
cos
ts
NONEVTSVTS+EXEMPTVTS+PSBPPOBVTS+POBVTS+POB+PPUVTS+2POB +HANAS
Figure 51: Risk of a dry cargo vessel in the port of Genova
The next Figure is the cost minimization.

Costs minimalisation
02,0004,0006,0008,000
10,00012,00014,00016,000
0 3 6 9 12BFscale
Cos
ts
noneVTSVTS and ExemptionVTS and SBPPOBVTS and POBVTS andPOB and PPU
Figure 52: Costs minimization for a dry cargo vessel in Genova
For the BF range between 0 and 6 the right option is VTS. For larger vessels
VTS+POB+PPU is the correct option.

4.9.12. Oil tanker outbound from Genova
The next Table indicates the main particulars of the vessel. The yellow cells are the
result of the calculations of the software.
Length 300.00 m Power 41,000 SHP
Nat crew PHI
Speed 15.6 kn Crew number
22 Volume
Draft 17.94 m. Age 8 Fuel 4,500 t
GT 88,630 Flag CYP Double hull Y
Deadweight 168,000 t #call/total calls
2/3 Inbound/outbound O
Displacement 222,214 t Nat officers GRE
Table 40: Input and calculated values for an oil tanker
The application of the software has generated the following Figures. The first is the
risk of the vessel.
Risk as function of BF
€ 0
€ 2,000
€ 4,000
€ 6,000
€ 8,000
€ 10,000
€ 12,000
0 5 10 15BF scale
Risk
cos
ts
NONEVTSVTS+EXEMPTVTS+PSBPPOBVTS+POBVTS+POB+PPUVTS+2POB +HANAS
Figure 53: Risk of an oil tanker in the port of Genova
The next Figure is the cost minimization.
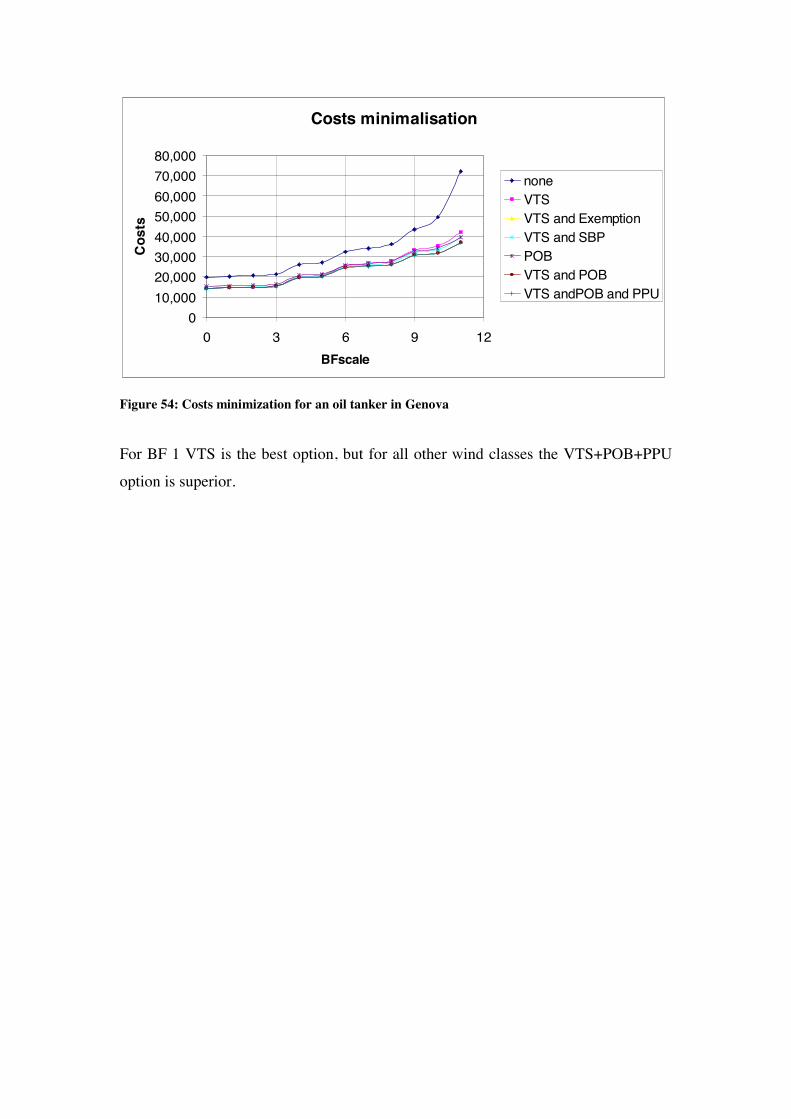
Costs minimalisation
010,00020,00030,00040,00050,00060,00070,00080,000
0 3 6 9 12BFscale
Cos
ts
noneVTSVTS and ExemptionVTS and SBPPOBVTS and POBVTS andPOB and PPU
Figure 54: Costs minimization for an oil tanker in Genova
For BF 1 VTS is the best option, but for all other wind classes the VTS+POB+PPU
option is superior.
4.10. Discussion The software is a prototype programmed in Excel. It was envisaged that the software
may act as an expert system to assist the harbourmaster in the selection of the most
appropriate Navigation Support Service.
This expert system is based on risk considerations of the vessel that calls in a port.
Such an approach is new. Nearly all ports determine the appropriate Navigation
Support service on the expertise of the Harbourmaster and the pilots. A common
requirement to the holders of these positions is that they have a captain’s ticket or in
some more stringent ports they have sailed as a master on a seagoing vessel for a
given time.
The accumulated experience is still seen as sufficient to determine the best Navigation
Support Service. In many cases this experience is substantiated in Bye-laws, stating
that a given vessel of a certain size should always use the services of VTS by stating
that vessels have to report to the VTS and that vessels of a certain size needs to have a
certified Pilot on Board.
However, criticisms were exercised when the port authorities and the pilotage
organisations came to the conclusion that delays of vessels was unproductive for a
port and that in some cases in these emergency conditions Shore Based Pilotage could
be then be applied. It seems for those outside of the inner circle of harbourmasters and
pilots that when a vessel can be piloted from the shore in rather bad weather
conditions it could also be done in much improved weather conditions. The counter
argument of some pilotage organisations was that the situation was far from optimal
regarding the capacity of the fairway (larger separations are required when a pilot is
not on board) and that the navigational safety was also reduced. The shore based pilot
was not able to adapt to a situation when the master or the navigator on board the
shore based pilotage vessel thought that he could ignore the advice and
recommendations of the pilot.
Anecdotal evidence is available in many ports regarding the behaviour of Shore Based
Pilotage vessels and the reduction of safety due to ignoring of advice of the pilot.
Economic motives were also playing a role. Ship owners could easily envisage
situations where no pilots are on board and where the pilotage dues are reduced.
Policymakers were also concerned about rigid regimes of pilotage and the lack of

dynamic response of pilotage organisations to situations where less intense (and hence
cheaper) Navigation Support Services were made available.
VTS-operators also played a role. Many of these operators have sailed at sea and
many of them as deck officers and among this group a strong feeling became manifest
that the so-called “light SBP services” could be provided by VTS-operators as well.
Under these conditions the pilotage organisations felt many threats and as a result
they stick to the rules which were formulated in the past and were so successful for
many decades.
Risk analysis and in a later stage the by IMO initiated FSA methods were
underdeveloped in the maritime world. The most important reason was that no
sufficient statistical material was available to fuel the risk models. However, the
Transport research Centre of the Ministry of Transport, Public Works and Water
Management collected in the framework of the project Monitoring Navigation Safety
accident data of the Dutch Inland Waters Infrastructure. These data also include
accident in the ports of the Netherlands, such as the ports of Rotterdam, Amsterdam,
and the ports along the river Scheldt.
Apart from the situation in the Netherlands, the situation regarding sufficient data is
slowly changing elsewhere. In many Member States there is need to collect accident
records and to collect traffic statistics. These can be used in risk studies.
The FSA development of IMO has introduced the ALARP principle. The background
is that striving for minimal risk is not recommended when minimum risk can only be
achieved with large financial efforts. The ALARP principle encouraged a more
rational aspect in the assessment of risk studies and the way in which RCOs may have
a mitigating effect without undue costs.
This has lead to an attempt to use a FSA for Navigation Support Services and to use
the ALARP principle.
Using the opinions of the expert is became clear that when a vessel is given a pilot
and a PPU in a VTS environment that the risk of the vessel could be minimised. The
costs were often high and were not commensurate with the risk reduction that could
be obtained according to the Costs-Benefits analysis.
Using a risk approach in Navigation Support Services quantifies the benefits and
compares that with the costs involved and as such can become a standard expertise
tool for the competent authority to determine the best possible option given the risk
reduction and the costs of the options that reduce risks.


4.11. Conclusions The following conclusions are made:
• Considering the recognition of IMO and IALA towards the use of risk analysis
tools in determining the required format of Navigation Support work in this
area should be continued to fine-tune a suitable methodology in the port and
approaches area.
• The collection of accident and traffic data should be structured in such a way
as to meet the (eventual) requirements of risk analyses tools so that the
appropriate quantification of risk mitigation may be obtained.
• The method and software is a start for a usable expert tool to assist the harbour
master in making decisions on the selection of a suitable Navigation Support
Option for a given vessel.
• The method is also suitable to determine the relative values of tariffs.
• Other ports can be inputted rather simple.
• More information is required on the different accidents and their frequencies.
• The basic option of no Navigation Support Services is difficult to determine
due to the complete absence of data for that options
• The values of risk reduction as provided by different stakeholder groups can
be improved for example by dividing VTM functions in a more logical
structure.
• The collection of experts’ opinions is difficult and great are should be
exercised to collect the opinions in an impartial and objective way.
• The analysis method which was employed should be improved.
• Experts have problems in making quantitative judgements since their main
expertise is in another field.
• The method as used should be checked on consistency of the assumption used.
• The determination of the risk reduction for a VTS is rather crude. The typical
properties of the three VTSs in the three ports haven’t been taken into account.
Rather a general concept of VTS was used which doesn’t reflect the real VTS
functionalities in the three ports.
• The results of the study with the assumed costs of POB, SBP and POB +PPU
show that VTS and VTS+POB+PPU are often the best solutions for vessels
calling at a port less than the number required to get a pilot exemption. This
may mean that the costs of SBP should be reduced and that SBP doesn’t give
sufficient value for money. In this respect the position of VHF assistance in
the port of Genova might be an example of proper pricing.

4.12. Recommendations The following recommendations are made:
• It is recommended that the accuracy of the solutions is considered with
distributions of the accident frequencies. Monte Carlo simulations may then
indicate the confidence limits of the solutions.
• A sensitivity analysis may enable to value the differences of the different
options.
• More accident data are required for other ports to get more reliable solutions.
• More damage data are also required to determine the risk of vessels.
• The method as is developed here should be expanded in MarNIS. First of all
the functions of the VTS as well as the lay-out of a port should be better
described. This would allow experts to make a better judgement of the risk
reduction capability of the different VTS functions.
• Apart from the NSS for an individual vessel it is recommended that a global
FSA is carried out to determine the best combination of functions for a port
VTS. This should be encompassed in MarNIS.
4.12. References [1] IALA VTS Manual, 2002
[2] C. v/d Tak,
Evaluation of accidents 1992-2002
Marin report, 2003
[3] MEPC 392/MSC 1023
Guidelines for Formal Safety Assessment
[4] Final report EMBARC
2003
[5] IMO Resolution A.857 (20); Guidelines for VTS
[6] Degre, T.
[7] VTS 2000, VTS 2004 and VTS 2008 symposium proceedings

4.13. Annex
When the crew is considered the effect of the minimum requirements as being
determined by the STCW convention should be included. This means that the
minimum requirements will act as the reference.
4.13.1. Quality of the crew The following aspects are discussed:
• Education;
• Training;
• Experience
4.13.1.1. Education The education of mariners- with special reference to the officers takes care of the
development of basic skills which with the future officers will be able to understand
the practical issues which they will encounter in their professional career. A
professional education prepares the mariner to distinguish dangerous situations and
provides him with the procedures that he may use to avoid getting in dangerous
situations. The education also provides him with knowledge of the potential
consequences when these critical conditions are not battled and the situation grows
worse. Education as a risk effect factor acts on both, frequencies of accidents and
consequences.
4.13.1.2. Training Training of mariners, especially the officers, is an important feature to train or
example, cooperation on the bridge in a bridge team (Bridge Resource Management)
and survival training. Simulation has the big advantage that the scenario may be
stopped to provide more information on errors by the instructors and a definite
advantage is the assessment of the exercise after the exercise has been completed.
Direct response is a good method to learn from mistakes. There are also a number of
practical training centres where survival training and other necessary practical skills
need to be trained. Training is often seen as a bridge between the more theoretical
education and the harsh experience in practice.
Training has often a bit more emphasis on the frequencies than on the consequences.

4.13.1.3. Experience Experience is a personal practical reference system. It takes care of a speedy
recognition of situations that may be dangerous and indicates what the best method to
take counter-measures is. Experience is sometimes counterproductive when an officer
uses his experience too mechanically. Experience acts on both aspects: frequency and
consequences.
4.13.1.4. Other aspects “Situational awareness” can be regarded as a complex interaction between a bridge
team member and the pilot in observing the environment apart from his main activity.
The information processing using his mental model should determine whether or not a
new activity might in the near future affect the present activity. The person in charge
of navigation should extrapolate the present position and the present intentions in
order to decide whether the newly observed activity might hamper the execution of
the plan. Persons with a high sense for situational awareness may be less susceptible
for accidents.
When a vessel calls in a port it is of importance that the licenses are being checked by
the competent authority. This is not necessary for vessels which will have a pilot on
board, but key personnel of vessels with exemptions and vessels under shore based
pilotage need to have he right licenses. A certificate doesn’t provide an absolute
certainty for a competent mariner: but it surely increases the probability. In many
cases, the competent authority requires knowledge of communication procedures and
local rules before a certificate of exemption is given. Oral examinations are often used
to check the knowledge of the future holders of certificates of exemption.
4.13.2. Quality of the vessel
The following factors are considered:
• Construction of the hull;
• Equipment;
• Inherent manoeuvring qualities of the vessel;
• Classification society where the vessel is classed;

• Age;
• Flag State
4.13.2.1. Construction The minimum scantlings of the construction are being governed by the Classification
rules. Class also takes care of the regime of surveys. Many member states consider
that a vessel built under class will automatically the national construction rules. There
are only a small number of exceptions to this rule. The construction of a vessel has a
large effect on the risk effect factors especially on the consequence risk effect factor.
The occurrence of engine failures is sometimes an aspect of the construction of the
vessel and this aspects gas a large effect on the risk effect factor for the frequency.
However, maintenance and the treatment of the heavy oil might be more important for
the frequency of accidents.
4.13.2.2. Equipment The minimum equipment requirements are often given by class, but the national
administrations also have requirements that need to be satisfied. Of great importance
are the SOLAS requirements. The minimal requirements pertain to:
• Gyrocompasses;
• Autopilot;
• GNSS2;
• Radar;
• ECDIS;
• Communication equipment, among them AIS3;
• Bridge controls of the engine and the steering engine
• Fire abatement equipment is also a part of the ship borne equipment.
The state of the equipment has sometimes an effect on risk effect factors of the
frequency. These include:
2 GNSS = “Global Navigation Satellite System”, e.g. GPS 3 AIS = “Automatic Identification System”

The state of the equipment has sometimes an effect on risk effect factors of the
frequency. These include:
• A bad interface of navigational equipment;
• Bad choice of parameters of autopilots and difficult methods to switch from
one manoeuvring mode to another a well as bad position of the autopilot
console;
• Not or insufficient operational status of communication equipment;
• Paper charts or ENCs not properly updated;
• Calibration and operational errors of the radar
• 4.13.2.3. Inherent manoeuvring qualities The inherent manoeuvring qualities are dependent of the following parameters:
• The ratio between engine power and displacement;
• The number of propellers;
• The ratio of rudder area in relation to the lateral;
• The ratio between wind area and lateral area;
• The block coefficient;
• The length breadth area;
• The rudder-propeller configuration;
• The trim.
The value of these parameters results from the design of the vessel and the owner’s
requirements. Generally no official requirements on manoeuvrability are set by the
shipping inspectorates. The requirements are sometimes defined by the owner on the
basis of required functionality, for example in small ports with small manoeuvring
areas. When the vessel is commissioned often manoeuvring trials are held. Turning
circles, stopping trials, zigzag trials and spiral tests are the most well-known. The
results give an idea of the manoeuvrability although pilots often claim that these tests
don’t provide the parameters they want during pilotage.
The ratio of power to displacement is an important variable to characterise the
response of the vessel to changes in fuel supply to the engine: the parameter is
associated with the so-called time constant. In order to understand this, one should

compare a vessel with 20 MW and a displacement of 3,000 tons with one with the
same power and 400,000 tons.
The wind sensitivity is also an important variable: lo-lo and ro-ro vessels are heavily
affected by wind.
4.13.2.4. Classification Society The accident sensitivity of ships classified by a given class can be determined using
accident statistics where the classification is known. From these statistics remarkable
conclusions could be derived. Contrary to the opinion among experts, the West
European classification societies don’t top the performance list.
4.13.2.5. Age When vessels age the accident sensitivity increases. Older vessels are owned by the
third or fourth owner and they are often sold just before a big survey when the ship
owner expects large repair costs. The critical age is about 12 to 15 years. Vessels
become then very maintenance sensitive. The economies of scale, improved engines
with improved specific fuel consumption and engines suitable for very heavy fuel
make it useful to sell these vessels and built new, more efficient ones. Older vessels
have definitely larger accident sensitivity.
4.13.2.6. Flag state The database of Lloyds indicates that accident sensitivity is also a function of the flag
the ship flies. Results in the PSC data base underline this phenomenon.
4.13.3. Environment
The following factors are considered:
• The lay-out of the port;
• Traffic intensity and complexity;
• The sensitivity of the environment (flora, fauna, water quality);
• Wind;
• Visibility;
• Tidal streams.
4.13.3.1. Lay out of the port
The lay-out of a port concerns the configuration of the main fairway and the adjacent
fairways, the docks and the manmade constructions that affect the navigable waters.
The lay-out affects the basic frequencies of the different types of accidents, partly due
to the traffic complexity. The position of the facilities also affects the traffic
intensities.
The lay-out of a port has a large influence on the external safety. This is the exposure
of innocent people to the consequences of maritime accidents. Requirements exist that
minimise the frequency of being killed.
4.13.3.2. Traffic intensity and complexity
The evolution of traffic is called complex when due to the mix of ship types the speed
differences and the manoeuvrability differences between ships increases. Large ports
with mixed vessel traffic might have complex traffic patterns. .Small ports have often
simple traffic patterns.
Ports with a high volume of cargo to be transferred are receiving many vessels and
intensities can become very high. Complexities and intensities can vary strongly in
the same port and certainly in different small and medium ports.
4.13.3.3. Sensitivity of the environment
Some ports are located in areas where stringent environmental requirements apply.
Release of dangerous and polluting substances may have very serious or even
disastrous consequences for the environment. Sometimes the national administration
has reacted by declaring some sea areas and port areas as a special sensitive area. This
signifies that special navigation rules may apply.
4.13.3.4. Wind
Wind is an important and independent variable that might affect the movement of
vessels. Especially, vessels with a large wind area are sensitive, such as the vessels of
interest in this study lo-lo vessels and Ro-Ro vessels. From accident databases it is
well known that heavy wind effects might increase the frequency of accidents with a
factor 3 to 4.
4.13.3.5. Visibility
Visibility is an independent variable affecting the navigation of the vessel. The
navigator needs to collect navigational information using radar and AIS. The
important support of self observation is not possible. As a consequence the accident
proneness is increasing. However, the effect of visibility on different accident type is
variable. In some cases the accident sensitivity multiplication factor may be as high as
5.
4.13.3.6. Tidal streams
Visibility is an independent variable affecting the navigation of the vessel. The
navigator needs to collect navigational information using radar and AIS. The
important support of self observation is not possible. As a consequence the accident
proneness is increasing. However, the effect of visibility on different accident type is
variable. In some cases the accident sensitivity multiplication factor may be as high as
5.
4.13.4. Interaction between crew and vessel
The following interaction factors are considered:
• Composition of the crew;
• Knowledge of crew with known vessel;
4.13.4.1. Composition of the crew
Under the composition is meant the different nationalities of the crew. When the
number of crew is smaller than the number indicated in the safe manning certificate,
one runs the risk that fatigue will become an important variable. Since the vessels
considered in this report have a large number of port calls per year and that the crew
has a large number of port duties regarding lashing of containers and organise traffic
on the Ro-Ro decks. This leads to an increased risk of fatigue especially as the vessel
is at sea. Fatigue leads to carelessness and a lower level of attention than is required to
execute the navigation tasks. This in turn can induce large accident proneness. When
more nationalities are on board and the cultural differences are large between these
nationalities there is a large probability that team work required in many
circumstances on board is adversely affected due to communication difficulties. These

manifest itself in the execution of rudder and course orders, communication on
fo’c’sle and poop during tug fastening, anchoring and mooring as well as during
lookout turns of the able seamen.
4.13.4.2. Knowledge of the crew of own vessel
The rotation of crews from one ship to another is large. A number of crew members
are sometimes provided by a crewing agency. The result is that some crew members
aren’t long at a specific vessel to acquaint themselves with the peculiarities of a
vessel. This may result in a deterioration of the skills regarding the essential functions
of the vessels such as the control of propellers and rudder, the use of communication
systems, the seamanlike use of navigational equipment and the administration of the
logs of this equipment and chart updating.
4.13.4.3. Other aspects
Other aspects that affect the relation crew vessel of importance for the risk of the
vessel are:
• The availability and the proper functioning of the navigational equipment;
• Working procedures;
• Housekeeping and equipment;
• Controversial interests of stakeholder groups such as ship operator-crew-
freight forwarder and third parties;
• Communication between crew and between crew and third parties; and
• Acquisition, training and labour conditions.
4.13.5. Interaction of the vessel with the environment
The following aspects are considered:
• Under keel clearance;
• The width of the fairway;
• Bends and manoeuvring circles;
• Bridges and locks;
• Tug assistance.

4.13.5.1. Under keel clearance (UKC)
Manoeuvring characteristics are dependent of the UKC. The flow beneath the vessel
is restricted, resulting in smaller drift angles and slow manoeuvring since also the
inertia of the vessel increases. When the UKC decreases the accident proneness is
becoming larger. The efficiency of the propulsion system is decreasing and as a
consequence stopping lengths are becoming larger as compared with unrestricted
waters.
4.13.5.2. Width of fairway
The sectional area of a vessel as compared with the wet sectional area of a fairway is
an important variable. First of all the vessel will sink in; this is called squat. The squat
is dependent on the square of the speed and as a result ship speeds should be reduced
to keep the squat within reasonable limits.4. The width of the fairway is important
when the vessel has to turn. It is also important for overtaking and passing of vessels.
The width of the vessel related to a characteristic dimension of the fairway determines
the relation between vessel and infrastructure and indicates the marginality of the
vessel in relation to it. The accident proneness increases when the marginality
increases.
4.13.5.3 Bends and manoeuvring circles
Bends and manoeuvring circles indicate the level of difficulty of vessels to reach their
final berths. The radius of a bend related to the length of a vessel indicates the level of
difficulty. The diameter of a manoeuvring circle related to the length of the vessel is
important. Smaller radii imply more potential problems than larger radii.
4.13.5.4. Locks and bridges
Locks and bridges have normally reduced openings as compared to the width of the
fairway in which they are located. Their opening widths are often small as compared
to the beam of the vessel. This ratio affects the accident ratio. Damage of a bridge or
lock might imply suspensions in order to repair the damage. This sometimes leads to
large financial consequences.
4 The principle of squat may be explained by the application of the law of Bernoulli.

4.13.5.5. Tug assistance
Tug assistance is crucial when the external forces on a vessel cannot be compensated
with on board means. In such cases tugs are required of sufficient capacities. If tug
assistance is not available or the tugs don’t have sufficient bollard pull than the
accident ratio will increase. This is the more the case when the vessel has a minimal
speed near the berth Windage is a large factor in determining the nature and size of
tug assistance.
Unfortunately the pilot is often the only person who is able to check the interaction
between vessel and environment and to suggest the right number and type of tugs,
although experienced masters are able to give a good estimation.
4.13.6. Interaction between crew and environment
The following factors are considered:
• “situational awareness” of the crew regarding the lay-out of the port;
• Frequency of visits to the port;
• Other aspects
4.13.6.1. Situational awareness of the crew regarding the lay-out of the port
A simple lay out of a port makes it easier for the navigator of a vessel to estimate the
consequences of the vessel behaviour. The influence of a poor interaction between
navigator and vessels on accident sensitivity is less than in the opposite case.
Situational awareness is the key factor and this factor is increasing in importance
when the port is less synoptic.
4.13.6.2. Frequencies of visits to the port
The more a crew gathers experience the smaller will be the number of accidents that
are related to experience. Experience improves the “mental model” of the navigator
but it also increases his situational awareness since he knows where snags and
bottlenecks can be expected. The frequency of visits is an important variable to assess
the experience gathered and the effect of the latter on the control of the vessel in a
port environment.

4.13.6.3 Other aspects
Other aspects of the interaction between crew and environment on the risk of a vessel
are:
• The presence of navigational aids;
• The direction of the fairways relative to the wind;
• The position of the infrastructure of a port relative to tidal streams
4.13.7. Interaction of the crew with the environment
The following aspects are considered:
• International behaviour rules during navigation in a port;
• Communication procedures;
• The execution of communication procedures;
• The controllability of a vessel in its environment;
• The perception that controllability will be maintained by use of tugs;
• The complexity of the traffic picture;
• The unavailability of terminal berths;
• The disposition of hydro-meteo information
• International behaviour rules in a port
• Navigation presupposes seamanship. This implies:
• Respecting international laws and obligations;
• No misuse of the hospitability of the port;
• Respect for all interests of all parties involved;

• Taking account of the potentialities of other traffic participants to address
complex and dynamic situations where normal rules fail to provide solutions.

4.13.7.1. Local rules and by laws
Knowledge of local rules is essential for safe navigation. It is necessary to avoid
places of a port that are unsafe and for the safety of other vessels to avoid sudden
manoeuvres.
4.13.7.3 Communication procedures
Communication procedures that are established by the port authority should be
respected. Disrespect can lead to dangerous situations. Unsafe situations are also the
result when the VTS cannot determine or is unable to read the goal of communication
of vessels.
4.13.7.4. Execution of local communication procedures
The language for communication is not always fixed and if so, the procedures are
often misused. Reasons are different nationalities, poor readability of messages
through VHF, lack of training, lack of experience and unclear agreements. The
effectiveness of a VTS to reduce the number of dangerous situations is very much
dependent on the execution of local communication procedures.
4.13.7.5. Controllability of the vessel
Controllability is defined as the proper use of the own and external means to control
the path of the vessel under all conditions. The expertise to use the manoeuvring
devices needs to be available. Loss of controllability leads to larger accident
sensitivity.
4.13.7.6. Effects of tugs on controllability
If the ship based manoeuvring devices are insufficient to provide sufficient level of
controllability external manoeuvring devices such as tugs need to be used. Critical
areas are the region of low speeds where external forces on the vessel can become
larger as those generated by the ship’s devices. In those cases tugs need to be used.
The expertise to use tugs in an appropriate way will reduce accident sensitivity in
higher wind conditions and in those cases in which high local streams are present.
4.13.7.7. Complexity of traffic patterns
The accident sensitivity increases when the complexity of the traffic becomes larger
and the vessel is not equipped with means to interpret the situation or when the VTS
is incapable to provide information for a correct behaviour of the vessel. An uncertain
factor is the intention of the fellow traffic participant. If this intention is clear through
for example radar and AIS then it is well possible to anticipate. In such cases the
accident sensitivity is reduced.
4.13.7.8. Unavailability of terminal berths
It will often happen that an arriving vessel will replace a departing vessel. The
departure can be delayed often due to commercial reasons, whilst the other vessel is
on its way. Expertise is required to keep the vessel moving with low speeds
anticipating the departure of the other vessel. The accident sensitivity increases when
insufficient expertise is available on the arriving vessel.
4.13.7.9. Provision of hydro-meteo information
The provision of information regarding expected wind conditions, expected visibility
and information regarding the navigational boundaries will result in lower accident
sensitivity. This information needs to be interpreted by a navigator with sufficient
skills.
4.13.7.10. Other aspects
Traffic management is effective to avoid accidents, but traffic management is not the
only panacea. Strategic traffic management can be effectively used: this can be
defined as taking mitigating measures and providing essential information by the
competent authority in time. These measures contribute to reduced accident
sensitivity. The development of integrated navigation systems on board, integrating
radar, AIS, ECDIS and GNSS information may lead to the generation of the same
traffic image as is available in VTS centres. It is believed that this will reduce
accident sensitivity. Personal Pilot Units may be seen as contributing to a degree of
integration.

5. Key publications
EMBARC f inal repor t

6 . Key projects
• COST 301
• EMBARC
• MARNIS

7. Related Projects None

8 . Key conferences
IALA 2004 Shang hai
IALA 2010, Capetown

9 . Key websites The COST 301 project was launched in the period that internet was being used by a
limited number of scientific users. Consequently there is and was no website.
EMBARC had an own website but this website ceased to exist when the results of the
project were approved and the final administrative formalities were finalised. CETLE
decided that the tangible results of the project should survive. These results can be
found under
http://www.cetle.info/author/.magnolia/pages/adminCentral.html
The user name and password are:
username is: sma_guest
password: stockholm2010
The project website of MarNIS is still in the air: www.marnis.org


