RESEARCH ARTICLE
Size Reduction in Early European DomesticCattle Relates to Intensification of NeolithicHerding StrategiesKatie Manning1, Adrian Timpson2, Stephen Shennan1*, Enrico Crema1,3
1 Institute of Archaeology, University College London, London, United Kingdom, 2 Research Department ofGenetics, Evolution and Environment, University College London, London, United Kingdom, 3 CaSEs—Complexity and Socio-Ecological Dynamics Research Group, Universitat Pompeu Fabra, Department ofHumanities, Barcelona, Spain
AbstractOur analysis of over 28,000 osteometric measurements from fossil remains dating between
c. 5600 and 1500 BCE reveals a substantial reduction in body mass of 33% in Neolithic cen-
tral European domestic cattle. We investigate various plausible explanations for this pheno-
typic adaptation, dismissing climatic change as a causal factor, and further rejecting the
hypothesis that it was caused by an increase in the proportion of smaller adult females in
the population. Instead we find some support for the hypothesis that the size decrease was
driven by a demographic shift towards smaller newborns from sub-adult breeding as a result
of intensifying meat production strategies during the Neolithic.
IntroductionChanges in animal body size have been shown to correlate with various ecological factors suchas reproductive behaviour and environmental modifications including predator dynamics andrising temperatures [1–5]. Yet, whilst selection can be intense over short time scales i.e. a fewgenerations, its direction may vary through time, cancelling out long-term evolutionary trends[6–9]. Accessing the sort of long-term datasets required to identify such diachronic trends,however, can be problematic due to taphonomic bias, gaps in the fossil record, etc. [10]
Archaeozoological assemblages meanwhile offer an intermediate time scale, providingpotential insight into inter-generational phenotypic change and underlying evolutionarytrends. Size reduction, for example, has long been recognised as a consequence of the domesti-cation process [11–14] and several hypotheses have been proposed to explain the phenomena,namely deterioration in pasture conditions and early weaning [14], protection from predationand reduction in mobility [15].
It has been suggested that European cattle continued to reduce in size over the course of theNeolithic, Bronze Age, and pre-Roman Iron Age [11, 16], and this is well documented in sev-eral regional case studies [17–23]. Using archaeological data and more than 28,000 osteometricmeasurements, our results confirm a substantial and consistent reduction in domestic cattle
PLOSONE | DOI:10.1371/journal.pone.0141873 December 2, 2015 1 / 19
OPEN ACCESS
Citation: Manning K, Timpson A, Shennan S, CremaE (2015) Size Reduction in Early European DomesticCattle Relates to Intensification of Neolithic HerdingStrategies. PLoS ONE 10(12): e0141873.doi:10.1371/journal.pone.0141873
Editor: Ron Pinhasi, University College Dublin,IRELAND
Received: July 19, 2015
Accepted: October 14, 2015
Published: December 2, 2015
Copyright: © 2015 Manning et al. This is an openaccess article distributed under the terms of theCreative Commons Attribution License, which permitsunrestricted use, distribution, and reproduction in anymedium, provided the original author and source arecredited.
Data Availability Statement: All data from theoriginal are available from the public data repositoryof University College London. The address is http://discovery.ucl.ac.uk/1469811/. New data for thisrevised version are included in the two SupportingInformation tables.
Funding: This research was funded by the EuropeanResearch Council by an Advanced Grant (# 249390)to Stephen Shennan for the EUROEVOL Project. Thefunders had no role in study design, data collectionand analysis, decision to publish, or preparation ofthe manuscript.
size throughout the Neolithic at the sub-continental scale. We estimate the evolutionary rate ofbody size change as a function of time, demonstrating the long-term evolutionary developmentof early domestic cattle. For clarity, we use the term ‘evolution’ to include selective breeding, byconsidering humans as merely one of many species, thus removing the somewhat philosophi-cally flawed distinction between ‘artificial’ and ‘natural’ selection.
We consider a number of hypotheses, which have previously been proposed to explain theobserved trend, and we specifically test two of them:
1. The reduction in adult size merely reflects an increase over time in the ratio of the smallerfemale adults, as a consequence of changing herding strategies, such as an intensification ofdairying practices.
2. The reduction in adult size reflects a shift in the age distribution of the cattle populationtowards a younger sub-adult reproduction age, causing the offspring to achieve smalleradult size due to the physiological and morphological constraints of the mother giving birthbefore having reached adult body size. This phenomenon has been well documented in thesheep of St Kilda [2–3].
Materials and Methods
DataThis study adopts an inclusive approach to the data in order to formally test patterns in thepublished literature. As such we have not made judgements about the accuracy of species iden-tification or measuring procedure [24–25], and have only excluded samples that researchershave identified as erroneous. In order to guarantee a minimum standardization in the measur-ing procedure we have applied the criterion of only using osteometric measurements from fullyfused adult remains measured according to the von den Driesch [26] standard method. Despitepotential errors in the original recording of these data, there is no reason to believe these errorswould introduce a systematic bias, therefore this inclusive approach is inherently conservativesince random errors in the data would only serve to add additional background noise to under-lying trends.
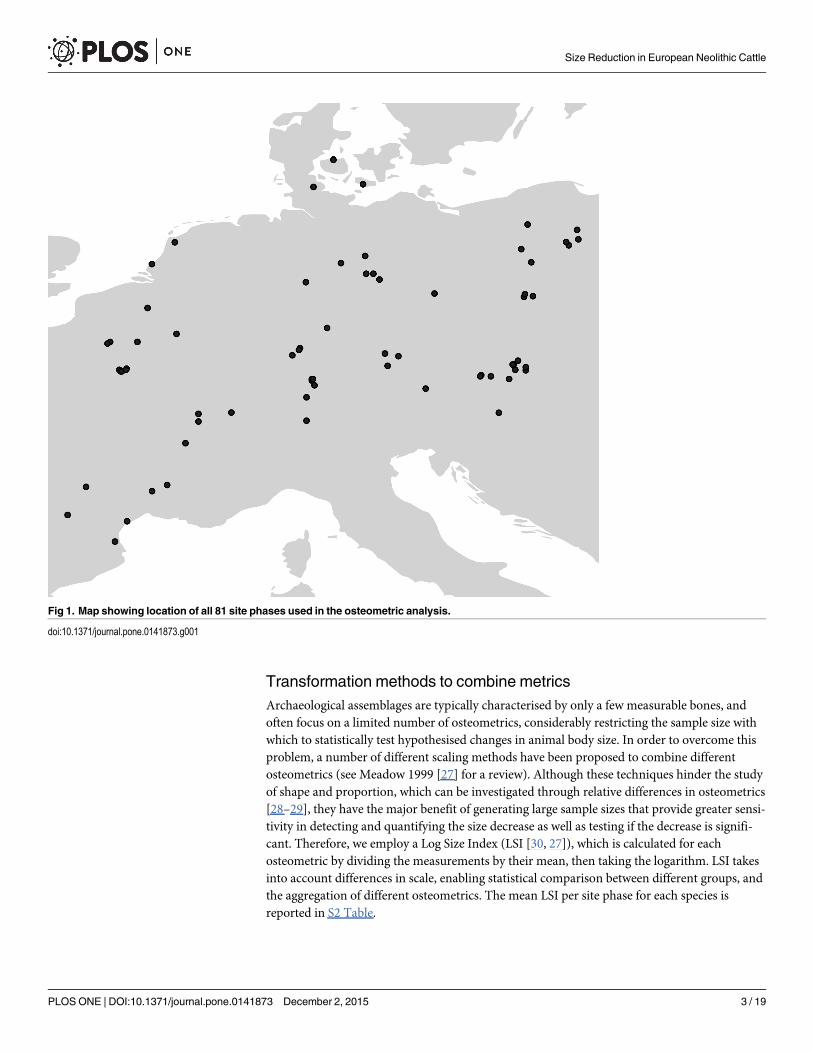
Data from the British Isles were excluded, to avoid the potential bias of a selective pressurefavouring smaller individuals for ease of sea transport. Finally, osteometrics with less than 10measurements, and site phases with less than 10 osteometrics were excluded to reduce sam-pling noise, whilst still ensuring good skeletal, geographic and temporal representation, pro-ducing a total sample of 28,266 measurements from 152 postcranial and dental elements forBos taurus (n = 16,568), Bos primigenius (n = 1119), Sus s. domesticus (n = 5021), Ovis aries(n = 3394), Capra hircus (n = 714), and Canis familiaris (n = 1450). These were obtained from81 phases identified in 70 archaeological sites in central Europe (Fig 1), dating from the EarlyNeolithic to the Early Bronze Age (c. 5600–1500 BCE). Where available, bones have also beenallocated a sex classification (male, female, and castrate) according to the original analyst’sdetermination in order to examine the size trend for males and females independently. We alsoutilise additional published data sex trend data and age profile data for Bos taurus. The sextrend data comprises 1340 counts of positively identified male, female and castrate bones,based on morphological criteria, from 38 site phases. The age profile data comprises relativeproportions of different age groups from 116 site phases. All osteometric, chronological andage profile data were derived from the EUROEVOL database (for details on the project seehttp://www.ucl.ac.uk/euroevol/), which is publicly accessible at http://discovery.ucl.ac.uk/1469811/, whilst the sex trend data are provided as an independent csv. file in the SI (S1 Table).
Size Reduction in European Neolithic Cattle
PLOS ONE | DOI:10.1371/journal.pone.0141873 December 2, 2015 2 / 19
Competing Interests: The authors have declaredthat no competing interests exist.
Transformation methods to combine metricsArchaeological assemblages are typically characterised by only a few measurable bones, andoften focus on a limited number of osteometrics, considerably restricting the sample size withwhich to statistically test hypothesised changes in animal body size. In order to overcome thisproblem, a number of different scaling methods have been proposed to combine differentosteometrics (see Meadow 1999 [27] for a review). Although these techniques hinder the studyof shape and proportion, which can be investigated through relative differences in osteometrics[28–29], they have the major benefit of generating large sample sizes that provide greater sensi-tivity in detecting and quantifying the size decrease as well as testing if the decrease is signifi-cant. Therefore, we employ a Log Size Index (LSI [30, 27]), which is calculated for eachosteometric by dividing the measurements by their mean, then taking the logarithm. LSI takesinto account differences in scale, enabling statistical comparison between different groups, andthe aggregation of different osteometrics. The mean LSI per site phase for each species isreported in S2 Table.
Fig 1. Map showing location of all 81 site phases used in the osteometric analysis.
doi:10.1371/journal.pone.0141873.g001
Size Reduction in European Neolithic Cattle
PLOS ONE | DOI:10.1371/journal.pone.0141873 December 2, 2015 3 / 19
Chronological sequencingWe employ two dating methods for different aspects of our analyses. Firstly, in order to identifybroad temporal trends we use a coarse-grained resolution, with all site phases being assigned toan archaeological ‘period’ i.e. Early Neolithic (c. 5600–4800 BCE), Middle Neolithic (c. 4800–3500 BCE), Late Neolithic (c. 3500–2500 BCE) or Early Bronze Age (c. 2500–1500 BCE). Byusing these chronological periods we assess the directional size change in cattle body size, theproportion of adult females in the population, and the proportion of different age groups.
Whilst categorising data into broad archaeological periods is a useful way of identifying anunderlying trend, we also wanted to calculate the evolutionary rate of phenotypic change forcomparison with different species, which required greater temporal resolution. We thereforedeveloped a method that hierarchically selects from different sources of chronological evidence.At the highest level, we use the midpoint of the chronological range published in the site report,which often integrates a variety of evidence filtered through the expertise of the author, forexample incorporating Bayesian analysis of both radiocarbon and stratigraphic evidence. If thiswas not available we generated a summed probability distribution from all radiocarbon datesfor each site phase with more than five radiocarbon samples (available in the EUROEVOLdatabase), then used the midpoint of the 95% (2-tails) confidence interval. The third level usedthe mean of the Gaussian date estimate for the archaeological culture associated with thatphase [31]. Finally, if none of the above were available, we resorted to using the midpoint of thestandard date range for that culture published in the literature (see Manning et al. 2014 [31] fora list of the standard date ranges used).
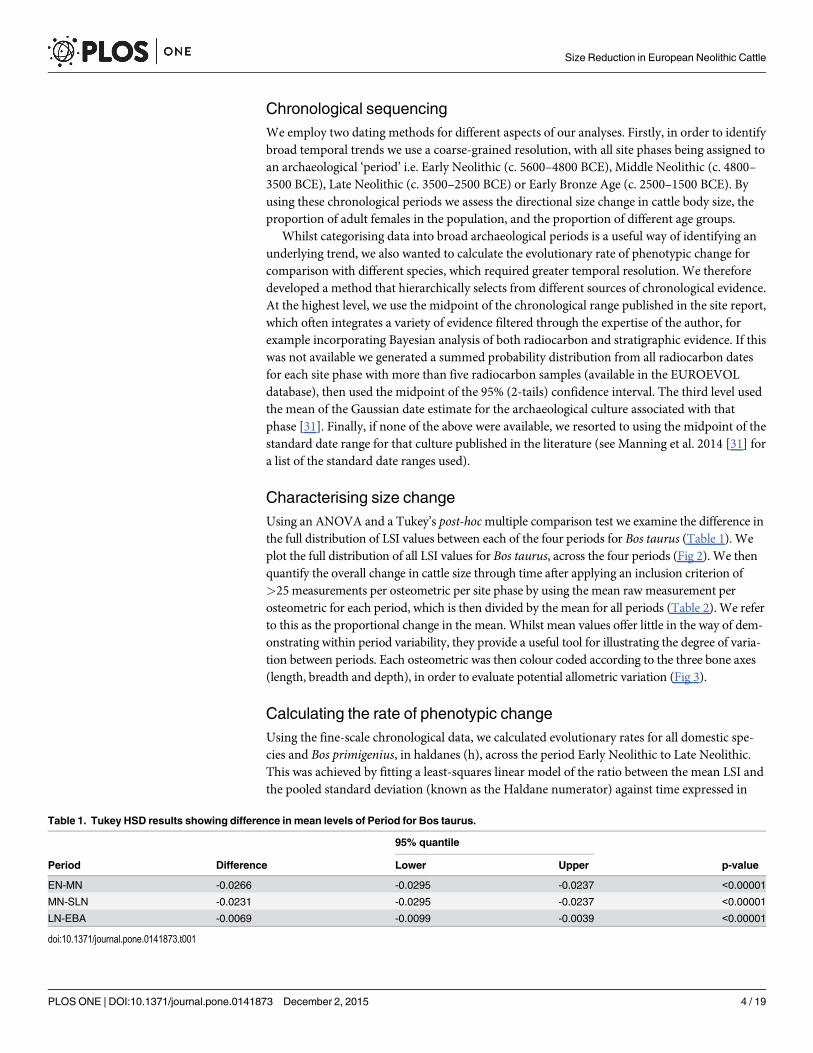
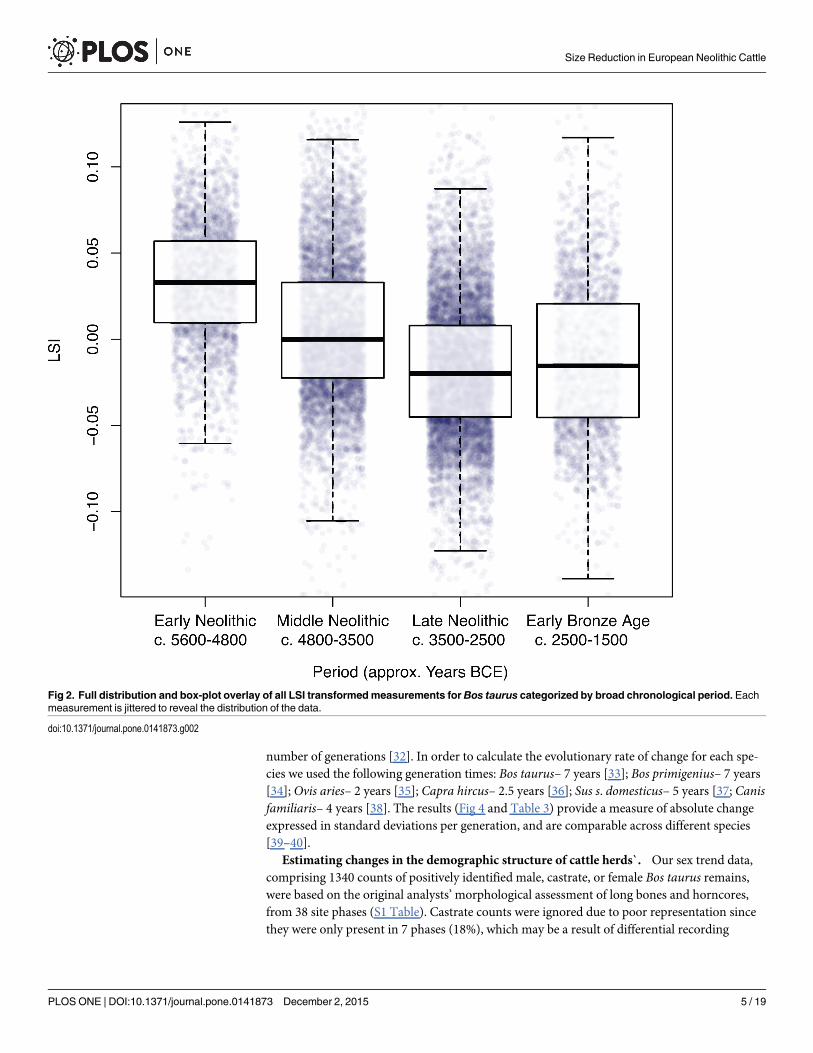
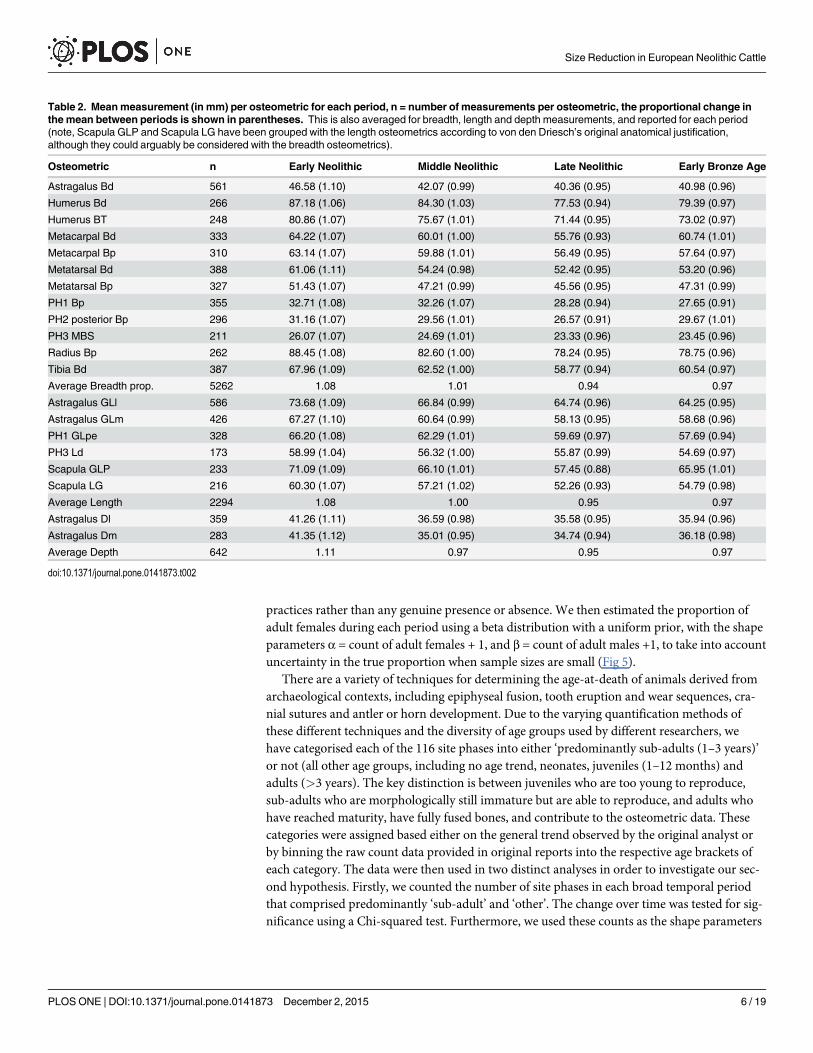
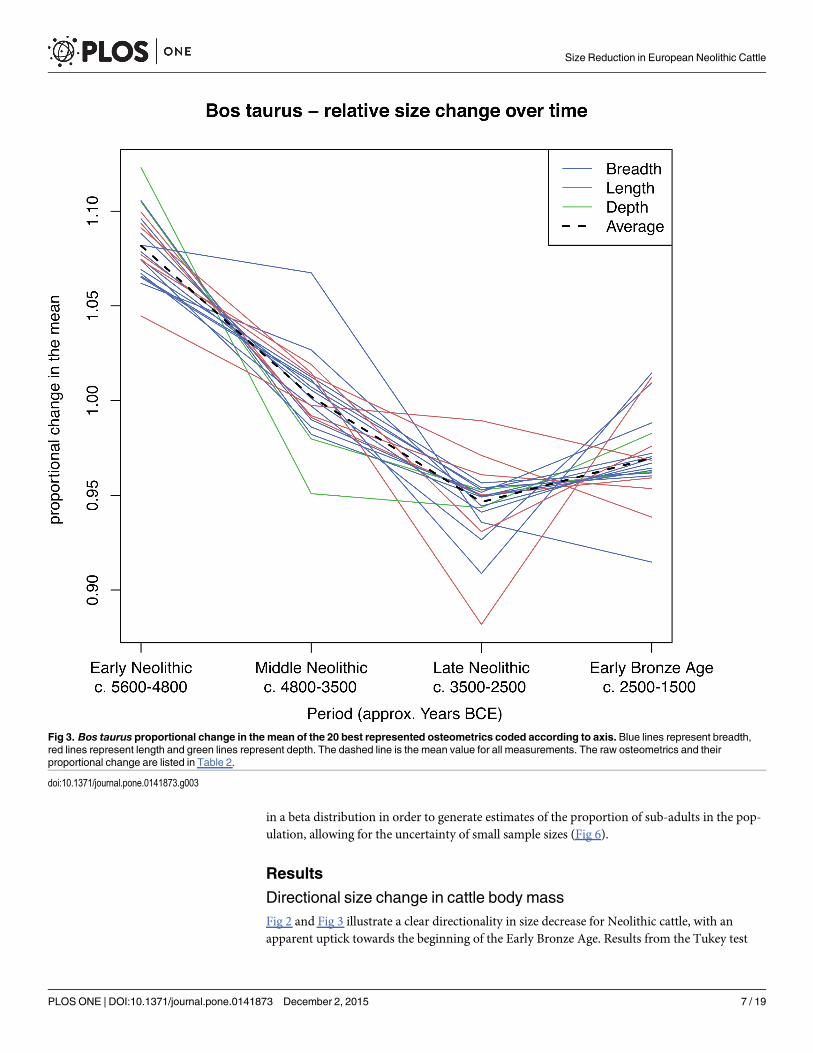
Characterising size changeUsing an ANOVA and a Tukey’s post-hocmultiple comparison test we examine the difference inthe full distribution of LSI values between each of the four periods for Bos taurus (Table 1). Weplot the full distribution of all LSI values for Bos taurus, across the four periods (Fig 2). We thenquantify the overall change in cattle size through time after applying an inclusion criterion of>25 measurements per osteometric per site phase by using the mean raw measurement perosteometric for each period, which is then divided by the mean for all periods (Table 2). We referto this as the proportional change in the mean. Whilst mean values offer little in the way of dem-onstrating within period variability, they provide a useful tool for illustrating the degree of varia-tion between periods. Each osteometric was then colour coded according to the three bone axes(length, breadth and depth), in order to evaluate potential allometric variation (Fig 3).
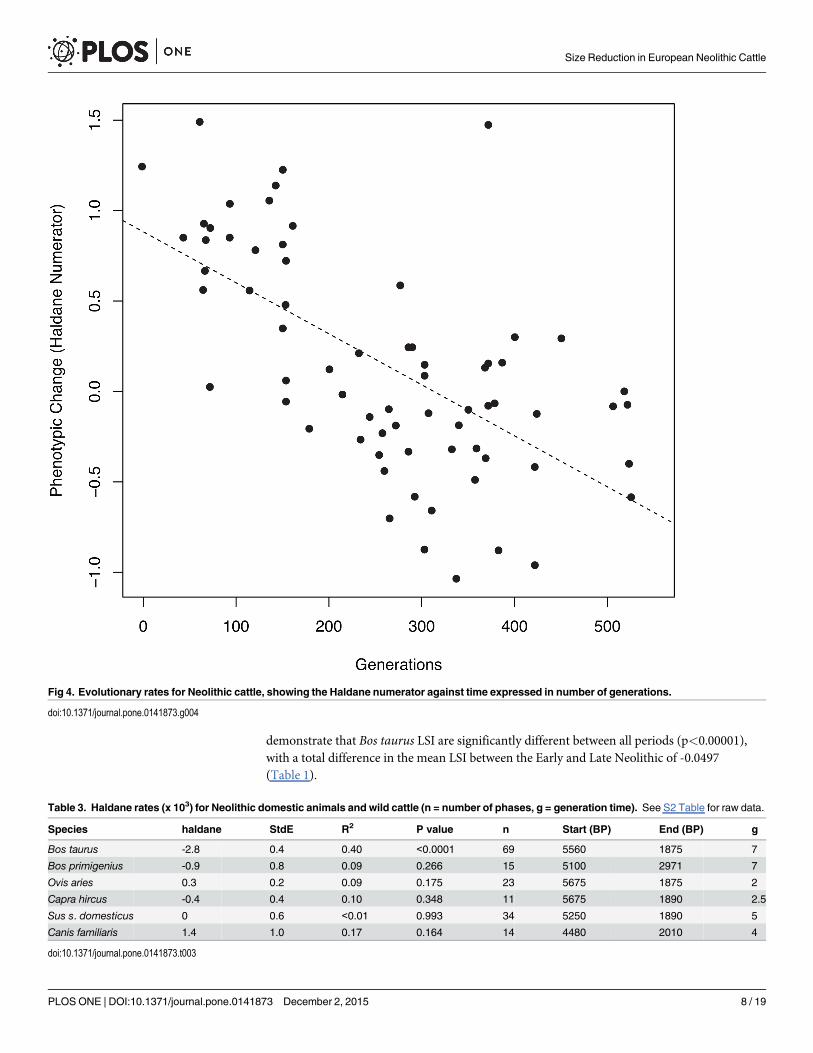
Calculating the rate of phenotypic changeUsing the fine-scale chronological data, we calculated evolutionary rates for all domestic spe-cies and Bos primigenius, in haldanes (h), across the period Early Neolithic to Late Neolithic.This was achieved by fitting a least-squares linear model of the ratio between the mean LSI andthe pooled standard deviation (known as the Haldane numerator) against time expressed in
Table 1. Tukey HSD results showing difference in mean levels of Period for Bos taurus.
95% quantile
Period Difference Lower Upper p-value
EN-MN -0.0266 -0.0295 -0.0237 <0.00001
MN-SLN -0.0231 -0.0295 -0.0237 <0.00001
LN-EBA -0.0069 -0.0099 -0.0039 <0.00001
doi:10.1371/journal.pone.0141873.t001
Size Reduction in European Neolithic Cattle
PLOS ONE | DOI:10.1371/journal.pone.0141873 December 2, 2015 4 / 19
number of generations [32]. In order to calculate the evolutionary rate of change for each spe-cies we used the following generation times: Bos taurus– 7 years [33]; Bos primigenius– 7 years[34]; Ovis aries– 2 years [35]; Capra hircus– 2.5 years [36]; Sus s. domesticus– 5 years [37; Canisfamiliaris– 4 years [38]. The results (Fig 4 and Table 3) provide a measure of absolute changeexpressed in standard deviations per generation, and are comparable across different species[39–40].
Estimating changes in the demographic structure of cattle herds`. Our sex trend data,comprising 1340 counts of positively identified male, castrate, or female Bos taurus remains,were based on the original analysts’morphological assessment of long bones and horncores,from 38 site phases (S1 Table). Castrate counts were ignored due to poor representation sincethey were only present in 7 phases (18%), which may be a result of differential recording
Fig 2. Full distribution and box-plot overlay of all LSI transformedmeasurements for Bos taurus categorized by broad chronological period. Eachmeasurement is jittered to reveal the distribution of the data.
doi:10.1371/journal.pone.0141873.g002
Size Reduction in European Neolithic Cattle
PLOS ONE | DOI:10.1371/journal.pone.0141873 December 2, 2015 5 / 19
practices rather than any genuine presence or absence. We then estimated the proportion ofadult females during each period using a beta distribution with a uniform prior, with the shapeparameters α = count of adult females + 1, and β = count of adult males +1, to take into accountuncertainty in the true proportion when sample sizes are small (Fig 5).
There are a variety of techniques for determining the age-at-death of animals derived fromarchaeological contexts, including epiphyseal fusion, tooth eruption and wear sequences, cra-nial sutures and antler or horn development. Due to the varying quantification methods ofthese different techniques and the diversity of age groups used by different researchers, wehave categorised each of the 116 site phases into either ‘predominantly sub-adults (1–3 years)’or not (all other age groups, including no age trend, neonates, juveniles (1–12 months) andadults (>3 years). The key distinction is between juveniles who are too young to reproduce,sub-adults who are morphologically still immature but are able to reproduce, and adults whohave reached maturity, have fully fused bones, and contribute to the osteometric data. Thesecategories were assigned based either on the general trend observed by the original analyst orby binning the raw count data provided in original reports into the respective age brackets ofeach category. The data were then used in two distinct analyses in order to investigate our sec-ond hypothesis. Firstly, we counted the number of site phases in each broad temporal periodthat comprised predominantly ‘sub-adult’ and ‘other’. The change over time was tested for sig-nificance using a Chi-squared test. Furthermore, we used these counts as the shape parameters
Table 2. Meanmeasurement (in mm) per osteometric for each period, n = number of measurements per osteometric, the proportional change inthe mean between periods is shown in parentheses. This is also averaged for breadth, length and depth measurements, and reported for each period(note, Scapula GLP and Scapula LG have been grouped with the length osteometrics according to von den Driesch’s original anatomical justification,although they could arguably be considered with the breadth osteometrics).
Osteometric n Early Neolithic Middle Neolithic Late Neolithic Early Bronze Age
Astragalus Bd 561 46.58 (1.10) 42.07 (0.99) 40.36 (0.95) 40.98 (0.96)
Humerus Bd 266 87.18 (1.06) 84.30 (1.03) 77.53 (0.94) 79.39 (0.97)
Humerus BT 248 80.86 (1.07) 75.67 (1.01) 71.44 (0.95) 73.02 (0.97)
Metacarpal Bd 333 64.22 (1.07) 60.01 (1.00) 55.76 (0.93) 60.74 (1.01)
Metacarpal Bp 310 63.14 (1.07) 59.88 (1.01) 56.49 (0.95) 57.64 (0.97)
Metatarsal Bd 388 61.06 (1.11) 54.24 (0.98) 52.42 (0.95) 53.20 (0.96)
Metatarsal Bp 327 51.43 (1.07) 47.21 (0.99) 45.56 (0.95) 47.31 (0.99)
PH1 Bp 355 32.71 (1.08) 32.26 (1.07) 28.28 (0.94) 27.65 (0.91)
PH2 posterior Bp 296 31.16 (1.07) 29.56 (1.01) 26.57 (0.91) 29.67 (1.01)
PH3 MBS 211 26.07 (1.07) 24.69 (1.01) 23.33 (0.96) 23.45 (0.96)
Radius Bp 262 88.45 (1.08) 82.60 (1.00) 78.24 (0.95) 78.75 (0.96)
Tibia Bd 387 67.96 (1.09) 62.52 (1.00) 58.77 (0.94) 60.54 (0.97)
Average Breadth prop. 5262 1.08 1.01 0.94 0.97
Astragalus GLl 586 73.68 (1.09) 66.84 (0.99) 64.74 (0.96) 64.25 (0.95)
Astragalus GLm 426 67.27 (1.10) 60.64 (0.99) 58.13 (0.95) 58.68 (0.96)
PH1 GLpe 328 66.20 (1.08) 62.29 (1.01) 59.69 (0.97) 57.69 (0.94)
PH3 Ld 173 58.99 (1.04) 56.32 (1.00) 55.87 (0.99) 54.69 (0.97)
Scapula GLP 233 71.09 (1.09) 66.10 (1.01) 57.45 (0.88) 65.95 (1.01)
Scapula LG 216 60.30 (1.07) 57.21 (1.02) 52.26 (0.93) 54.79 (0.98)
Average Length 2294 1.08 1.00 0.95 0.97
Astragalus Dl 359 41.26 (1.11) 36.59 (0.98) 35.58 (0.95) 35.94 (0.96)
Astragalus Dm 283 41.35 (1.12) 35.01 (0.95) 34.74 (0.94) 36.18 (0.98)
Average Depth 642 1.11 0.97 0.95 0.97
doi:10.1371/journal.pone.0141873.t002
Size Reduction in European Neolithic Cattle
PLOS ONE | DOI:10.1371/journal.pone.0141873 December 2, 2015 6 / 19
in a beta distribution in order to generate estimates of the proportion of sub-adults in the pop-ulation, allowing for the uncertainty of small sample sizes (Fig 6).
Results
Directional size change in cattle body massFig 2 and Fig 3 illustrate a clear directionality in size decrease for Neolithic cattle, with anapparent uptick towards the beginning of the Early Bronze Age. Results from the Tukey test
Fig 3. Bos taurus proportional change in the mean of the 20 best represented osteometrics coded according to axis. Blue lines represent breadth,red lines represent length and green lines represent depth. The dashed line is the mean value for all measurements. The raw osteometrics and theirproportional change are listed in Table 2.
doi:10.1371/journal.pone.0141873.g003
Size Reduction in European Neolithic Cattle
PLOS ONE | DOI:10.1371/journal.pone.0141873 December 2, 2015 7 / 19
demonstrate that Bos taurus LSI are significantly different between all periods (p<0.00001),with a total difference in the mean LSI between the Early and Late Neolithic of -0.0497(Table 1).
Fig 4. Evolutionary rates for Neolithic cattle, showing the Haldane numerator against time expressed in number of generations.
doi:10.1371/journal.pone.0141873.g004
Table 3. Haldane rates (x 103) for Neolithic domestic animals and wild cattle (n = number of phases, g = generation time). See S2 Table for raw data.
Species haldane StdE R2 P value n Start (BP) End (BP) g
Bos taurus -2.8 0.4 0.40 <0.0001 69 5560 1875 7
Bos primigenius -0.9 0.8 0.09 0.266 15 5100 2971 7
Ovis aries 0.3 0.2 0.09 0.175 23 5675 1875 2
Capra hircus -0.4 0.4 0.10 0.348 11 5675 1890 2.5
Sus s. domesticus 0 0.6 <0.01 0.993 34 5250 1890 5
Canis familiaris 1.4 1.0 0.17 0.164 14 4480 2010 4
doi:10.1371/journal.pone.0141873.t003
Size Reduction in European Neolithic Cattle
PLOS ONE | DOI:10.1371/journal.pone.0141873 December 2, 2015 8 / 19
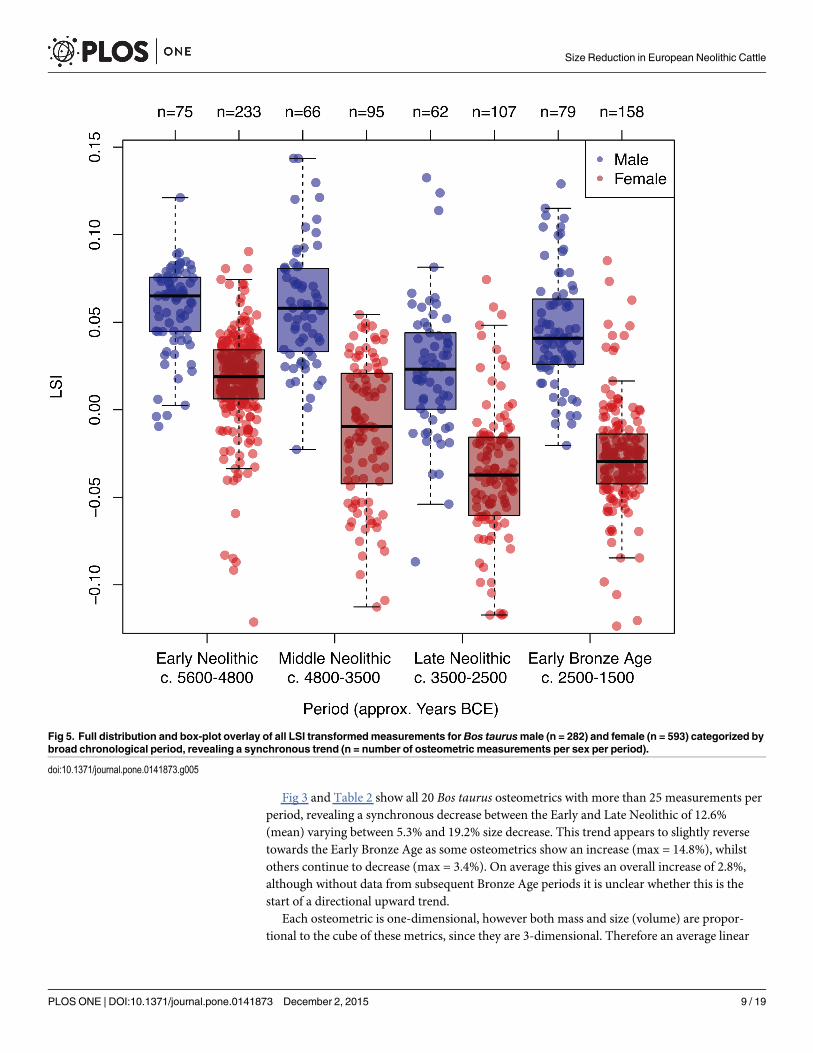
Fig 3 and Table 2 show all 20 Bos taurus osteometrics with more than 25 measurements perperiod, revealing a synchronous decrease between the Early and Late Neolithic of 12.6%(mean) varying between 5.3% and 19.2% size decrease. This trend appears to slightly reversetowards the Early Bronze Age as some osteometrics show an increase (max = 14.8%), whilstothers continue to decrease (max = 3.4%). On average this gives an overall increase of 2.8%,although without data from subsequent Bronze Age periods it is unclear whether this is thestart of a directional upward trend.
Each osteometric is one-dimensional, however both mass and size (volume) are propor-tional to the cube of these metrics, since they are 3-dimensional. Therefore an average linear
Fig 5. Full distribution and box-plot overlay of all LSI transformedmeasurements for Bos taurusmale (n = 282) and female (n = 593) categorized bybroad chronological period, revealing a synchronous trend (n = number of osteometric measurements per sex per period).
doi:10.1371/journal.pone.0141873.g005
Size Reduction in European Neolithic Cattle
PLOS ONE | DOI:10.1371/journal.pone.0141873 December 2, 2015 9 / 19
reduction of 12.6% equates to 1 - (1–0.126)3, giving a reduction in size and mass of 33.2%. Thisassumes the shape of cattle remained approximately similar, which is supported by separatecalculations for mean breadth reduction (32.9%) and mean length reduction (32.4%). Howeverwe were also able to estimate absolute limits in the size decrease given the total volume must bea function of the combination of linear osteometrics. It is not required for this function to beknown since the total decrease must be greater than the smallest linear decrease cubed, andalso smaller than the greatest linear decrease cubed. This provides absolute limits of 15.1% to47.2%.
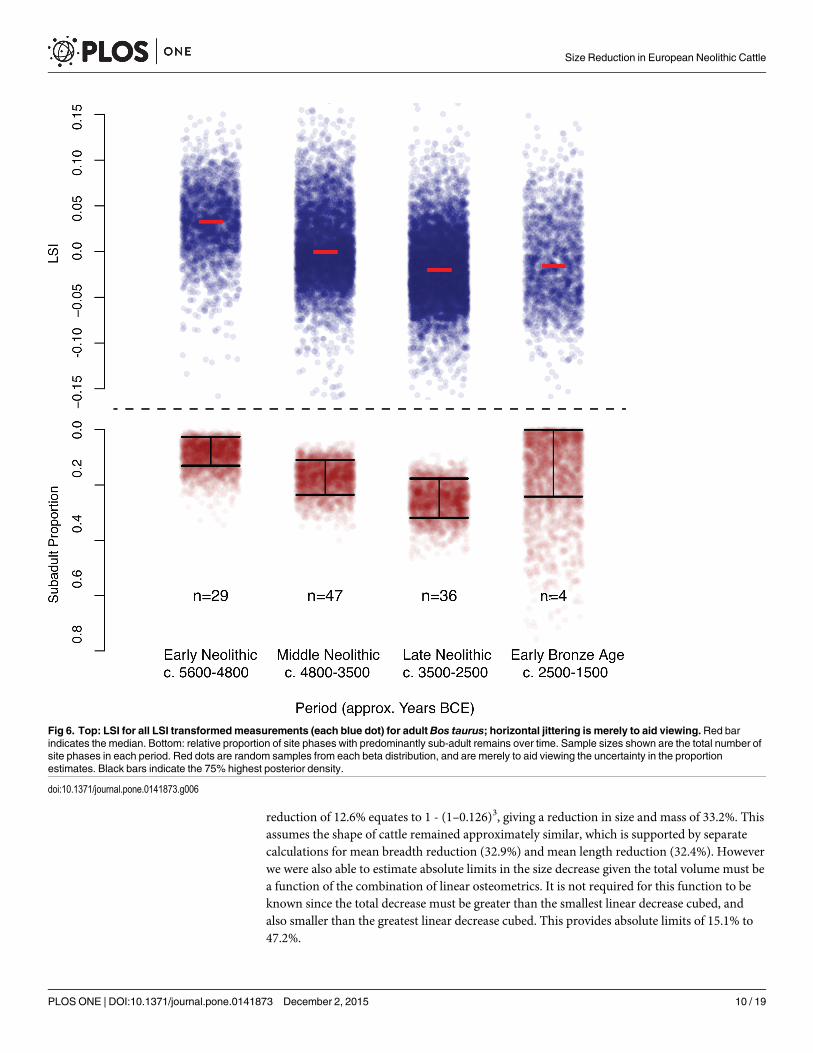
Fig 6. Top: LSI for all LSI transformedmeasurements (each blue dot) for adultBos taurus; horizontal jittering is merely to aid viewing.Red barindicates the median. Bottom: relative proportion of site phases with predominantly sub-adult remains over time. Sample sizes shown are the total number ofsite phases in each period. Red dots are random samples from each beta distribution, and are merely to aid viewing the uncertainty in the proportionestimates. Black bars indicate the 75% highest posterior density.
doi:10.1371/journal.pone.0141873.g006
Size Reduction in European Neolithic Cattle
PLOS ONE | DOI:10.1371/journal.pone.0141873 December 2, 2015 10 / 19
Although analysis of the allometric changes characterising Neolithic cattle populations isbeyond the scope of this paper, the separation of breadth, length and depth measurements pro-vide some indication of changes in body proportions over time and would clearly benefit froma more detailed study that takes into account the effects of sexual dimorphism, as well asregional complexities in bone allometry.
Rates of Phenotypic changeSince the trend of size reduction during the Neolithic appears to slightly reverse at the EarlyBronze Age, the Haldane evolutionary rate was only calculated across the Neolithic using thedata at the scale of individual phases (Table 3; Fig 4). Only Bos taurus, and no other domestictaxa, showed a significant change through time (-2.8±0.4 haldanes x 103, p<0.00001, numberof phases = 70). Therefore, whilst other species may have undergone more regionally and tem-porally sensitive changes in size, they do not demonstrate the same scale of directional sizechange observed in cattle.
Demographic changes to cattle herdsUsing the independent sex data as shape parameters in a beta distribution, we estimated themost likely proportion of adult females in each period, and the 95% confidence intervals toreflect the uncertainty from small samples sizes. These results show a slight decrease in the pro-portion of adult females from 0.70 (95% HPD = 0.65–0.75) during the Early Neolithic to 0.62(95% HPD = 0.58–0.65) by the Late Neolithic (Table 4). The lack of overlap between the 95%HPD indicates a statistically significant decrease in the proportion of adult females, corrobo-rated by a Chi-squared test (p = 0.0075).
Furthermore an assessment of LSI measurements, which had been positively identified asmale (n = 282) or female (n = 593) also shows that both sexes undergo synchronous sizechange. T-tests show a decrease of 0.035 in the mean LSI of males between the Early and LateNeolithic (p< 0.00001), and in females an even greater decrease of 0.053 (p< 0.00001) acrossthe same period (Fig 5). The results of our analysis therefore contradict the hypothesis that thereduction in cattle size was attributable to an increase in the proportion of adult females in theoverall population.
Our analysis of the age profile data shows an increase in the proportion of sub-adults, withthe proportion of site phases with predominantly sub-adult remains rising from6% during theEarly Neolithic to 15% in the Middle Neolithic and 31% in the Late Neolithic, which is syn-chronous with the decline in average adult cattle size. The proportion of site phases with pre-dominantly sub-adult remains then decreases during the Early Bronze Age, synchronous withthe uptick in cattle size (Fig 6). Chi-squared test shows a statistically significant difference inthe proportion of site phases with predominantly sub-adult remains, between the Early andLate Neolithic (p = 0.0132).
Table 4. Raw counts of adult male and adult female bones identified according tomorphological criteria (n = number of phases). The proportion val-ues and 95%CI are calculated from the beta distribution.
Period n Males Females Proportion 95% HPD
Early Neolithic 7 99 244 0.70 0.65–0.75
Middle Neolithic 7 71 191 0.72 0.66–0.77
Late Neolithic 20 228 379 0.62 0.58–0.65
Early Bronze Age 4 25 45 0.63 0.52–0.73
doi:10.1371/journal.pone.0141873.t004
Size Reduction in European Neolithic Cattle
PLOS ONE | DOI:10.1371/journal.pone.0141873 December 2, 2015 11 / 19
Discussion
Summary of resultsIt has long been recognised that European domestic cattle reduced in size over the course ofthe Neolithic, and previous studies have demonstrated this trend at different regional and chro-nological scales e.g. north/central Europe [11, 16], the Paris Basin [21], Poland [22] and Swit-zerland [23]. Our analysis evaluates size change at a much broader temporal and spatial scale,and our results strongly support this trend, demonstrating a substantial reduction in domesticcattle size but not any other domestic species during the European Neolithic. This may appearto contradict recent studies, which have demonstrated a size reduction in other taxa, for exam-ple pig [41], although this apparent discrepancy is likely due to the spatial and temporal scaleof the different analyses. Whilst other domestic taxa may have undergone regional or discon-tinuous variation in body size, they do not exhibit the same sort of long-term and geographi-cally widespread trend observed in Bos taurus. This suggests that only cattle were subject to thesort of consistent evolutionary pressure that resulted in such a directional phenotypic change.
Our results suggest a substantial reduction in body mass of c. 33% in only 3100 years. Thisis supported by the high evolutionary rate estimated from our data (-2.8±0.4 haldanes x 103),which can be fairly compared with Purugganan and Fuller’s [32] haldane rate of change forplant domestication traits. They report a rate of 1.3±0.2 haldanes x 103 for barley (Hordeumvulgare) and 0.9±0.2 for einkorn wheat (Triticum monococcum), which is of the same order ofmagnitude as our results and suggests a strong selective pressure acting on Neolithic cattle.
A number of different hypotheses have been proposed to explain a reduction in livestock bodysize, which include: a reduction in mobility, reduced nutritional levels [16], and a reduction in sex-ual dimorphism, which is a well-studied consequence of the domestication process [42–43]. In thefollowing section we rule out certain proposed causal factors and test two specific hypotheses,namely an increase in the proportion of the smaller females, and a decrease in the reproduction age.
Ruling out possible causes: Domestication, introgression and climatechangeSize reduction and the development of other pedomorphic or neotenic features have long beenrecognised as consequences of the domestication process [44–46, 42]. However, the core pack-age of domestic animals (cattle, sheep, goat, and pigs) were domesticated in the northernLevant during the 10th-9th millennia BCE [43, 46] and subsequently exported to Europe [47].Hence the size reduction reported here post-dates the domestication process by more than3000 years, suggesting a phenotypic adaptation distinct from those associated with domestica-tion. An important cause of initial size reduction during domestication, for example, is adecrease in sexual dimorphism amongst early domesticates. Whilst this has been clearly dem-onstrated in Early Neolithic contexts in the Middle Euphrates [43], it is still possible that theprocess of decreasing sexual dimorphism continued as domestic cattle were more intensivelyexploited over the course of the Neolithic. However, this does not appear to have driven thesize reduction observed in early European cattle, as our results show a significant parallel sizechange in both male and female domestic cattle. A decrease in sexual dimorphism over thecourse of the Neolithic would result in the distribution of the two sexes becoming more similarby the Late Neolithic, but our results show that this sexual dimorphism was maintained. Fur-thermore, the size reduction associated with proto-domestication is also observed in Near East-ern sheep [13] goat [48] and pigs [12, 49–50], and yet in Europe these species do not undergo adirectional size decrease over the course of the Neolithic. Therefore our results suggest that theobserved size decrease in Neolithic cattle was distinct from the initial process of domestication.
Size Reduction in European Neolithic Cattle
PLOS ONE | DOI:10.1371/journal.pone.0141873 December 2, 2015 12 / 19

In some circumstances introgression with wild cattle may offer some explanation for a sizechange. Male aurochs were much larger than domestic bulls, and therefore introgression pro-vides a potential explanation for the opposite trend of a size increase. Even if introgression wasinitially prevalent and became less common over time, we would expect to see the rate of sizeincrease gradually retard, until the size remained approximately constant through time (subjectto random drift), but certainly not a size decrease. Furthermore, recent aDNA work corrobo-rates the importation of Near Eastern cattle stock [51], and provides little evidence for a geneticcontribution of native aurochs to the domestic gene pool [52–53].
Another possible explanation is that an exogenous force, such as climate, was the underlyingcause of the observed size reduction. Bergmann’s rule [54] for example, predicts that popula-tions living in warmer environments will comprise smaller individuals than those from a colderenvironment. However, we would expect an exogenous force, such as climate to have a similareffect on all species, both domestic and wild. Our analysis shows the directional size reductiononly affected cattle, and therefore we reject climate as a causal factor.
So, why did cattle undergo such a substantial size reduction?Given the expectation that farmers might improve meat yields by increasing the body mass oftheir livestock, or increase the number of larger males for traction, it is surprising to observesuch a dramatic reduction in average body mass. Indeed, pre-industrial European cattle under-went at least one well-documented size increase during the initial period of the Roman con-quest [55–59]. This is generally interpreted as a reflection of cattle improvement, linked eitherto an intensification of arable agriculture, in which more draft oxen were required [57], or theneed for provisioning an increasingly consumer based economy [60]. Why Neolithic farmersapparently bred smaller cattle, but not their other domestic animals, is therefore an intriguingpuzzle.
Hypothesis 1: Increase in the proportion of adult females. Assuming no intrinsic changein average cattle size through time, an increase in the proportion of the smaller adult females inthe domestic cattle population might explain our observed data, and provide evidence for achange in herding strategies. For example, where milk production is the priority, a herder’sobjective will be to ensure a large supply of lactating adult females. Hence, young males willoften be culled once the milk yield is assured, which in unimproved African breeds rangesfrom 139–259 days [61], leading to a higher rate of female survival through adulthood. Thissort of ‘post-lactation’ slaughter peak has been identified in the mortality profile of NeolithicEuropean cattle (e.g. [62–63]). Stable nitrogen isotopic analyses of bone and dentine collagenin modern and ancient samples furthermore suggests that Neolithic cattle were being slaugh-tered at the end of the mothers lactation period, around the calves weaning age, to assist themilk let-down reflex [63–65]. Our sex ratio data does not support an increase in the survivalrate of adult females, in fact showing an overall decrease in the proportion of adult females dur-ing the Late Neolithic. Analysis using the positively identified male and female osteometricmeasurements also contradicts this hypothesis by showing that both sexes underwent a sizereduction, indicating a population-level phenotypic adaptation, rather than simply a shift inthe sex ratio. Hence, the observed size diminution does not appear to be the result of anincrease in the proportion of adult females in the population, although this does not negatedairying practices, nor does it refute a change in the rate of intensification of dairying overtime.
Hypothesis 2: An increase in the proportion of reproductive sub-adults in the popula-tion resulted in the offspring achieving smaller adult size. The age and time of year atwhich animals give birth can have a significant impact on the size of their offspring. Some
Size Reduction in European Neolithic Cattle
PLOS ONE | DOI:10.1371/journal.pone.0141873 December 2, 2015 13 / 19
species, for example domestic cows and pigs, do not experience seasonal anoestrus and cantherefore breed throughout the year, although their reproductive performance will ultimatelybe influenced by nutritional factors [66]. As a consequence, herders can more easily modulatethe reproductive strategy of these animals in order to accommodate changes in the availabilityof forage or in response to other environmental effects.
Our analysis of the demographic structure of cattle herds reveals a significant increase in theproportion of sub-adults in the population during the Neolithic, synchronous with the decreasein adult size. Because the rate of body growth significantly slows at maturity (3–4 years in cat-tle), a strategy that maximises meat production will avoid retaining surplus stock beyond thesub-adult stage [67]. Consequently, there would be fewer reproductive adults and a greater pro-portion of reproductive sub-adults, resulting in potential lower birth weights due to the physio-logical and morphological constraints of giving birth before having reached adult body size [2–3].
Intensifying meat production is also suggested by an increase in the relative proportions ofdomestic pig over time [68], which is typically associated with an intensification of animal pro-duction [69]. Cattle, meanwhile, clearly play a central role in the Neolithic livestock economyof Central and northwest Europe [70], and are consistently well represented throughout theNeolithic and Early Bronze Age suggesting that any indication of intensification is likely to beobserved in another aspect of their herding regime e.g. in body mass, milk production etc. Wepropose that the apparent increase in the proportion of sub-adults, and the decline in cattlebody mass are indicative of an underlying change in the herding economy over time, which hasa greater emphasis on meat productivity. Recent studies [71–72], have identified an increase inhuman population levels following the introduction of agriculture in the local Early Neolithicfollowed by a decline towards the end of the Middle Neolithic, and in some cases a secondarypopulation increase during the later Neolithic or Early Bronze Age. This boom-bust pattern inregional population levels would have had major implications for the agro-pastoral systems ofthe time, leading to changes in the demands on animal productivity and input of labour, whichmay have unintentionally led to the size decrease observed here in Neolithic cattle.
Another factor, which we have not formally addressed here, is how these broad-scalechanges in herding strategies relate to other forms of environmental modification, such as dete-riorating pasture conditions. The practice of leaf foddering, as a means of providing dietarycompensation has been well documented at Middle Neolithic sites in Switzerland and Den-mark [73–74], the Paris Basin [75], and in southern France [76], and may be symptomatic of achange in the availability of nutrient-rich pasture. Similarly, evidence for slash-and-burn culti-vation in the Late Neolithic in central Europe [77], would have allowed agriculture to expandinto less suitable regions, increasing the availability of lower-quality feed from fallow grazing.As body mass is correlated with forage requirements due to calf weight being negativelyaffected by low nutrient intake in the gestating parent [78], one possible direction for furtherresearch would be to investigate links between changing cattle size, regional population pres-sures and deteriorating pasture conditions.
ConclusionUltimately, the exact cause of the observed size decrease remains a puzzle, open to furtherinvestigation, requiring high-resolution archaeological and palaeoenvironmental data, such asdetailed age-at-death profiles, and isotopic data to assess changes in birth seasonality (e.g.[79]). Nonetheless, our analysis provides compelling confirmation of a continental-wide post-domestication phenotypic adaptation, showing a size reduction of c.33% in Neolithic domesticcattle. Importantly, this trend is not observed in other domestic species, which may be due to
Size Reduction in European Neolithic Cattle
PLOS ONE | DOI:10.1371/journal.pone.0141873 December 2, 2015 14 / 19
the greater input of labour required in cattle, or a shift in their differential social status, i.e.from being a predominantly prestige resource during the Early Neolithic to a purely economicresource by the end of the Neolithic. Furthermore, we provide evidence of broad scale changesin the cattle herding strategies of Neolithic farmers, particularly an increase in the number ofsub-adults in the death assemblage, which may be related to intensifying meat production.This occurs in parallel with an increase in the exploitation of other high meat yielding animals,such as the domestic pig, and could reflect a form of intensification driven by higher humanpopulations levels.
Supporting InformationS1 Table. Relative frequencies of male, female and castrate bones per site phases identifiedusing osteometric and morphological criteria.(CSV)
S2 Table. Mean Log Size Index and Standard deviation per site phase for each species,including associated sample size, sitename, estimated mean date, period and cultural affili-ation.(CSV)
AcknowledgmentsThis research was funded by the European Research Council by an Advanced Grant (#249390) to Stephen Shennan for the EUROEVOL Project. We are grateful to Eva Fairnell andRebecca Rennell for assistance with the data input, and to all those who provided source data,to Sue Colledge for her insights on soil productivity and pasture conditions, and to Mark GThomas for his useful statistical advice.
Author ContributionsAnalyzed the data: KM AT EC. Wrote the paper: KM AT SS EC.
References1. Garel M, Cugnasse JM, Maillard D, Gaillard JM, Hewison MAJ, Dubray D. Selective harvesting and
habitat loss produce long-term life history changes in a mouflon population. Ecol. Appl. 2007; 17:1607–1618. doi: 10.1890/06-0898.1 PMID: 17913127
2. Ozgul A, Tuljapurkar S, Benton TG, Pemberton JM, Clutton-Brock TH, Coulson T. The dynamics ofphenotypic change and the shrinking sheep of St Kilda. Science 2009; 325: 464–467. doi: 10.1126/science.1173668 PMID: 19574350
3. Ozgul A, Childs DZ, Oli MK, Armitage KB, Blumstein DT, Olson LE, et al. Coupled dynamics of bodymass and population growth in response to environmental change. Nature 2010; 466: 482–487. doi:10.1038/nature09210 PMID: 20651690
4. Gardner JL, Peters A, Kearney MR, Joseph L, Heinsohn R. Declining body size: a third universalresponse to warming? Trends Ecol. Evol. 2011; 26, 6: 285–291. doi: 10.1016/j.tree.2011.03.005 PMID:21470708
5. Giroux MA, Tremblay JP, Anouk Simard M, Yoccoz NG, Côté SD. Forage-mediated density and climateeffects on body mass in a temperate herbivore: a mechanistic approach. Ecology 2014; 95:1332–1340. doi: 10.1890/13-0956.1 PMID: 25000764
6. Gingerich PD. Rates of evolution on the time scale of the evolutionary process. Genetica 2001; 112–113: 127–144. doi: 10.1007/978-94-010-0585-2_9 PMID: 11838762
7. Kinnison MT, Hendry NG. The pace of modern life II: from rates of contemporary microevolution to pat-tern and process. Genetica 2001;112–113, 145–164. doi: 10.1007/978-94-010-0585-2_10
8. Grant PR, Grant BR. Unpredictable evolution in a 30-year study of Darwin’s finches. Science 2002;296: 707–711. doi: 10.1126/science.1070315 PMID: 11976447
Size Reduction in European Neolithic Cattle
PLOS ONE | DOI:10.1371/journal.pone.0141873 December 2, 2015 15 / 19
9. Estes S, Arnold SJ. Resolving the paradox of stasis: models with stabilizing selection explain evolution-ary divergence on all timescales. Am. Nat. 2007; 169: 227–244. doi: 10.1086/510633 PMID: 17211806
10. Riesberg LH, Widmer A, Michele Arntz A, Burke JM. Directional selection is the primary cause of phe-notypic diversification. PNAS 2002; 99,19: 12242–12245. doi: 10.1073/pnas.192360899 PMID:12221290
11. Boessneck J, Von Den Driesch A, Meyer-Lemppenau U &Wechsler Von Ohlen E. Die Tierknochen-funde aud demOppidum von Manching. Wiesbaden: Die Ausgrabungen in Manching 6; 1971.
12. Bökönyi S. History of domestic animals in central and eastern Europe. Budapest: Akadémiai Kiadó;1974.
13. Uerpmann HP. Metrical analysis of faunal remains from the Middle East. In Zeder M, Meadow R, edi-tors. Approaches to faunal analysis in the Middle East. Peabody Museum Bulletin 1. Cambridge: Har-vard University Press; 1978. pp. 41–45
14. Meadow RH. Osteological evidence for the process of animal domestication. In: Clutton-Brock J. editor.The walking larder: Patterns of domestication, pastoralism, and predation. Unwin Hyman: London.1989. pp. 80–90.
15. Zohary D, Tchernov E, Horwitz LK. The role of unconscious selection in the domestication of sheepand goats. J. Zool. 1998; 245: 129–135.
16. Boessneck J, Von Den Driesch A. Die Tierknochenfunde aus der Neolithischen Siedlung auf dem Fikir-tepe bei Madiky amMarmarameer. München: Institut für Palaeoanatomie, Domestikationsforschungund Geschichte der Tiermedizin der Universität München; 1978.
17. Ijzereef GF. Bronze Age animal bones from Bovenkarspel. The excavation at Het Valkje. Nederlanseoudheden 10. Project Noord-Holland 1. Amersfoort: ROB; 1981.
18. Méniel P. Contribution à l’histoire de l’élevage en Picardie du Néolithique à la fin de l’âge du Fer.Amiens: Revue Archéologique de Picardie; 1984.
19. Poplin F, Poulain T, Méniel P, Vigne JD, Geddes D, Helmer D. Les débuts de l’élevage en France. InDemoule JP, Guilaine J, editors. Le néolithique de la France. Hommage àG. Bailloud. Paris: Picard;1986. p. 37–51.
20. Vigne JD. Les Mammifères post-glaciaires de Corse, étude Archéozoologique (XXVIe supplement aéGallia Préhistoire). Paris: Éditions du Centre National de la Recherche Scientifique; 1988.
21. Tresset A. Early husbandry in Atlantic areas. Animal introductions, diffusion of techniques and nativeacculturation at the north-western margin of Europe. In Henderson J, editor. The Prehistory and earlyHistory of Atlantic Europe. British Archaeological Reports. International Series; 2000. pp. 17–32
22. Lasota-Moskalewska A. Morphotic changes of domestic cattle skeleton from the Nelithic age to thebeginning of the Iron Age. Wiadomści Archeologiczne 1980; 45: 119–167.
23. Schibler J, Schlumbaum A. Geschichte und wirtschaftliche Bedeutung des Hausrindes (Bos taurus L.)in der Schweiz von der Jungsteinzeit bis ins fruhe Mittrlalter. Schweiz Arch Tierh. 2007; 149: 23–9. doi:10.1024/0036-7281.149.1.23 PMID: 17243447
24. Lyman RL, VanPool TL. Metric data in archaeology: a study of intra-analyst and inter-analyst variation.Am. Antiq. 2009; 74: 485–504.
25. Breslawski RP, Byers DA. Assessing measurement error in paleozoological osteometrics with bisonremains. J. Arch. Sci. 2015; 53: 235–242.
26. Von den Driesch A. A guide to the measurement of animal bones from archaeological sites. Cam-bridge, Mass: Peabody Museum of Archaeology and Ethnology; 1976.
27. Meadow RH. The use of size index scaling techniques for research on archaezoological collectionsfrom the Middle East. In: Historia Animalium ex Ossibus. Festschrift für Angela von den Driesch zum65. Geburtsta. Internationale Archäologie, Bd 8: Studia honoraria. Rahden, Westfalia: Verlag MarieLeidorf; 1999. pp. 285–300
28. Vigne JD, Helmer D, Peters J. New archaeozoological approaches to trace the first steps of animaldomestication: general presentation, reflections and proposals. In Vigne JD, Helmer D, Peters J, edi-tors. First steps of animal domestication. New archaeozoological approaches. Oxford: Oxbow books;2005. pp.1–16.
29. Evin A, Cucchi T, Cardini A, Vidarsdottir US, Larson G, Dobney K. The long and winding road: identify-ing pig domestication through molar size and shape. J. Archaeol. Sci. 2013; 40: 735–743
30. Simpson GG, Roe A, Lewontin RC. Quantitative Zoology, revised edition. New York: Harcourt, BraceandWorld; 1960.
31. Manning K, Timpson A, Colledge S, Crema E, Edinborough K, Kerig T, et al. The chronology of culture:a comparative assessment of European Neolithic dating approaches. Antiquity 2014; 88: 1065–1080.
Size Reduction in European Neolithic Cattle
PLOS ONE | DOI:10.1371/journal.pone.0141873 December 2, 2015 16 / 19
32. Purugganan MD, Fuller DQ. Archaeological data reveal slow rates of evolution during plant domestica-tion. Evolution 2010; 65(1): 171–183. doi: 10.1111/j.1558-5646.2010.01093.x
33. Gautier M, Faraut T, Moazami-Goudarzi K, Navratil V. Foglio M, Grohs C, et al. Genetic and haplotypicstructure in 144 European and African cattle breeds. Genetics 2007; 177: 1059–1070. PMID:17720924
34. Lari M, Rizzi E, Mona S, Corti G, Catalano G, Chen K, et al. The complete mitochondrial genome of an11,450 year old aurochsen (Bos primigenius) from Central Italy. Evol. Biol. 2011; 11: 32.
35. Kaeuffer R, Coltman DW, Chapuis JL, Pontier D, Réale D. Unexpected heterozygosity in an islandmouflon population founded by a single pair of individuals. Proc. B. Soc. B 2008; 274, 1609: 527–533.
36. Luikart G, Gielly L, Excoffier L, Vigne JD, Bouvet J, Taberlet P. Multiple maternal origins and weak phy-logeographic structure in domestic goats. PNAS 2001; 98(10): 5927–5932 PMID: 11344314
37. Groenen MAM, Archibald AL, Uenishi H, Tuggle CK, Takeuchi Y, Rothschild MF, et al. Analyses of piggenomes provide insight into porcine demography and evolution. Nature 2012; 491: 393–398. doi: 10.1038/nature11622 PMID: 23151582
38. Sacks BN, Brown SK, Stephens D, Pederson NC, Wu JT, Berry O. Y Chromosome analysis of dingoesand Southeast Asian village dogs suggests a Neolithic continental expansion from Southeast Asia fol-lowed by multiple Austronesian dispersals. Mol. Biol. Evol. 2013; 30(5): 1103–1118. doi: 10.1093/molbev/mst027 PMID: 23408799
39. Haldane JBS. The rate of mutation of human genes. Hereditas 1949; 35(1): 267–273.
40. Hendry AP, Nosil P, Riesberg LH. The speed of ecological speciation. Funct. Ecol. 2007; 21(3): 455–464. doi: 10.1111/j.1365-2435.2007.01240.x PMID: 19096732
41. Rowley-Conwy P, Gourichon L, Helmer D, Vigne JD. Early domestic animals in Italy, Istria, the Tyrrhe-nian Islands and southern France. In Colledge S, Conolly J, Dobney K, Manning K, Shennan S, editors.The Origins and Spread of Domestic Animals in Southwest Asia and Europe. Walnut Creek: LeftcoastPress. 2013. pp. 161–194.
42. Trut L, Osinka I, Kharlamova A. Animal evolution during domestication: the domesticated fox as amodel. Bioessays 2009; 31(3): 349–360. doi: 10.1002/bies.200800070 PMID: 19260016
43. Helmer D, Gourichon L, Monchot H, Peters J, Saña-Segui M. Identifying early domestic cattle from pre-pottery Neolithic sites on the middle Euphrates using sexual dimorphism. In: Vigne JD, Peters J, Hel-mer D, editors. The First Steps of Animal Domestication. Oxford: Oxbow Books; 2005. pp 86–95.
44. Bökönyi S. Archeological problems and methods of recognizing animal domestication. In: Ucko PJ &Dimbleby GW. The domestication and exploitation of plants and animals. London: Duckworth.1969. pp. 219–229.
45. Price EO. Behavioral aspects of animal domestication. Q. Rev. Biol. 1984; 59: 1–32.
46. Peters J, Helmer D, von den Driesch A, Saña Segui M. Early Animal Husbandry in the Northern Levant.Paléorient 1999; 25, 2: 27–48.
47. Colledge S, Conolly J, Dobney K, Manning K, Shennan S, editors. The Origins and Spread of DomesticAnimals in Southwest Asia and Europe. Walnut Creek: Leftcoast Press; 2013.
48. Meadow RH. Animal domestication in the Middle East: A view from the eastern margin. In Clutton-Brock J, Grigson C, editors. Animals and archaeology, volume 3: Early herders and their flocks. BARInternational Series. Oxford: Archaeopress; 1984. pp. 309–337.
49. Hongo H, Meadow R. Faunal remains from Prepottery Neolithic levels at Çayönü, southeastern Turkey:a preliminary report focusing on pigs (Sus sp.). In Marshkour M, Choyke AM, Buitenhuis H, Poplin F,editors. Archaeozoology of Southwest Asia IV. Groningen: ARC-Publications; 2000. pp. 121–140.
50. Albarella U, Dobney K, Rowley-Conwy P. The domestication of the pig (Sus scrofa): new challenges—and approaches. In Zeder M, Bradley D, Emshwiller E, Smith B, editors. Documenting Domestication:new genetic and archaeological paradigms. Berkeley: University of California Press; 2006. pp.209–27.
51. Bollongino R, Burger J, Powell A, Mashkour M, Vigne J- D, Thomas MG. Modern Taurine CattleDescended from Small Number of Near-Eastern Founders. Mol. Biol. Evol. Letter 2012: 29(9):2101–2104. doi: 10.1093/molbev/mss
52. Edwards CJ, Bollongino R, Scheu A, Chamberlain A, Tresset A, Vigne JD, et al. Mitochondrial DNAanalysis shows a Near Eastern Neolithic origin for domestic cattle and no indication of domestication ofEuropean aurochs. Proc. R. Soc. B, 2007; 274: 1616 1377–1385. doi: 10.1098/rspb.2007.0020
53. Bollongino R, Elsner J, Vigne JD, Burger J. Y-SNPs do not indicate hybridization between Europeanaurochs and domestic cattle. PlosOne 2008; 3(10) e3418. doi: 10.1371/journal.pone.0003418
54. Bergmann C. Über die Verhältnisse der Wärmeökonomie der Thiere zu ihrer Grösse. Göttinger Studien1847; 3(1): 595–708.
Size Reduction in European Neolithic Cattle
PLOS ONE | DOI:10.1371/journal.pone.0141873 December 2, 2015 17 / 19
55. Audoin-Rouzeau F. La taille des animaux d’élevage é l’époque romaine et leur exportation. In Cheval-lier R, editor. Homme et animal dans l’antiquité romaine, Actes du colloque de nantes 1991. Tours:Centre de Recherche. 1995. pp. 79–100.
56. Schlumbaum A, Stopp B, Breuer G, Rehazek A, Blatter R, Turgay M, et al. Combining archaeozoologyand molecular genetics: the reason behind the changes in cattle size between 150BC and 700AD inNorthern Switzerland. Antiquity 2003; 77, 298: Project Gallery.
57. Albarella U, Johnstone C, Vickers K. 2008. The development of animal husbandry from the late IronAge to the end of the Roman period: a case study from south-east Britain. J. Archaeol. Sci. 2008; 20:1–21. doi: 10.1016/j.jas.2007.11.016
58. MacKinnon M. Cattle “breed” variation and improvement in Roman Italy: connecting the zooarchaeolo-gical and ancient textual evidence. World Archaeol. 2010; 42(1): 55–73. doi: 10.1080/00438240903429730
59. Colominas L, Schlumbaum A, Saña M. The impact of the Roman Empire on animal husbandry prac-tices: study of the changes in cattle morphology in the north-east of the Iberian Peninsula throughosteometric and ancient DNA analyses. Archaeol. Anthropol. Sci. 2014; 6: 1–16. doi: 10.1007/s12520-013-0116-9
60. Luff RM. Animal bones from excavations in Colchester, 1971–85. Colch. Archaeol. Rep. 12. Colches-ter: Colchester Archaeological Trust Ltd; 1993.
61. Dahl G, Hjort A. Having herds: Pastoral herd growth and household economy. Stockholm Studies inSocial Anthropology 2. Department of Social Anthropology, University of Stockholm, Stockholm, Swe-den; 1976.
62. Tresset A. Le rôle des relations homme-animal dans l’ évolution économique et culturelle des sociétésdes Ve-IVe millénaires en Bassin parisien: Approche ethno-zootechnique fondée sur les ossementsanimaus. PhD thesis, Université Paris-I Panthéon-Sorbonne. 1996.
63. Gillis R, Bréhard S, Bălăşescu A, Ughetto-Monfrin J, Popovici J, Vigne JD, et al. Sophisticated cattledairy husbandry at Borduşani-Popină (Romania, fifth millennium BC): the evidence from complementaryanalysis of mortality profiles and stable isotopes. World Archaeol. 2014; 45:3: 447–472. doi: 10.1080/00438243.2013.820652
64. Balasse M. Keeping the young alive to stimulate milk production? Differences between cattle and smallstock. Anthropozoologica 2003; 37: 3–37.
65. Balasse M, Tresset A. Early weaning of Neolithic domestic cattle (Bercy, France) revealed by intra-tooth variation in Nitrogen isotope ratios. J. Arch. Sci. 2002; 29: 853–9.
66. Reinhardt C, Reinhardt A, Reinhardt V. Social behavior and reproductive performance in semi-wildScottish Highland cattle. Appl. Anim. Behav. Sci. 1986; 15: 125–136. doi: 10.1016/0168-1591(86)90058-4
67. Payne S. Kill-off patterns in sheep and goats: The mandibles from Aşvan Kale. Anatol. Stud. 1973; 23:281–303. DOI: http://dx.doi.org/10.2307/3642547
68. Schibler J. 2013. Zooarchaeological data from Late Mesolithic and Neolithic sites in Switzerland. In Col-ledge S, Conolly J, Dobney K, Manning K, Shennan S, editors. The Origins and Spread of DomesticAnimals in Southwest Asia and Europe. Walnut Creek: Leftcoast Press. 2013. pp. 253–269.
69. Fraser DG. 2005. Animal welfare and the intensification of animal production: an alternative interpreta-tion (Vol. 2). Food & Agriculture Organisation
70. Manning K, Downey SS, Colledge S, Conolly J, Stopp B, Dobney K, et al. 2013. The origins and spreadof stock-keeping: the role of cultural and environmental influences on early Neolithic animal exploitationin Europe. Antiquity 87 (338): 1046–1059. http://dx.doi.org/10.1017/S0003598X00049851
71. Shennan S, Downey SS, Timpson A, Edinborough K, Colledge S, Kerig T, et al. Regional populationcollapse followed initial agriculture booms in mid-Holocene Europe. Nat. Commun. 2013; 4: 2486. doi:10.1038/ncomms3486 PMID: 24084891
72. Timpson A, Colledge S, Crema E, Edinborough K, Kerig T, Manning K, et al. Reconstructing regionaldemographies of the European Neolithic using ‘dates as data’: a new case-study using an improvedmethod. J. Arch. Sci. 2014; 52: 549–557. doi: 10.1016/j.jas.2014.08.011
73. Rasmussen P. Leaf foddering in the earliest Neolithic agriculture. Evidence from Switzerland and Den-mark. Acta Archaeol. 1989; 60: 71–85.
74. Akeret Ö, Rentzel P. Micromorphology and plant macrofossil analysis of cattle dung from the Neolithiclake shore settlement of Arbon Bleiche 3. Geoarchaeology 2001; 16(6): 687–700. doi: 10.1002/gea.1016
75. Balasse M, Boury L, Ughetto-Monfrin J, Tresset A. Stable isotope insights (δ18 O, δ13C) into cattle andsheep husbandry at Bercy (Paris, France, 4th millennium BC): birth, seasonality and winter leaf fodder-ing. Environ. Archaeol. 2012; 17(1): 29–44. doi: 10.1179/1461410312Z.0000000003
Size Reduction in European Neolithic Cattle
PLOS ONE | DOI:10.1371/journal.pone.0141873 December 2, 2015 18 / 19
76. Delhon C, Martin L, Argant J, Thiébault S. Shepherds and plants in the Alps: multi-proxy archaeobotani-cal analysis of Neolithic dung from La Grande Rivoire’ (Isère, France). J. Arch. Sci. 2008; 35: 89–97.
77. Rösch M. Land use and food production in Central Europe from the Neolithic to the Medieval period:Change of landscape, soils and agricultural systems according to archaeobotanical data. In Kerig T,Zimmerman A, editors. Economic Archaeology: From structure to performance in European Archaeol-ogy. Bonn: Habelt; 2013. pp. 109–128.
78. Martin JL, Vonnahme KA, Adams DC, Lardy GP, Funston RN. Effects of dam nutrition on growth andreproductive performance of heifer calves. J. Anim. Sci. 2007; 85: 841–847. doi: 10.2527/jas.2006-337PMID: 17085735
79. Balasse M, Tresset A. Environmental constraints on the reproductive activity of domestic sheep andcattle: what latitude for the herder? Anthropozoologica 2007; 42(2): 71–88.
Size Reduction in European Neolithic Cattle
PLOS ONE | DOI:10.1371/journal.pone.0141873 December 2, 2015 19 / 19


