Download - SIG COMBIBLOC FY 2020 RESULTS
SIG COMBIBLOCFY 2020 RESULTS
CEO SAMUEL SIGRIST CFO FRANK HERZOG 23 FEBRUARY 2021
DISCLAIMER
The information contained in this presentation is not for use within any country or jurisdiction or by any persons where such use would constitute a violation of law. If this applies to you, you are not authorized to access or use any such information. This presentation may contain “forward-looking statements” that are based on our current expectations, assumptions, estimates and projections about us and our industry. Forward-looking statements include, without limitation, any statement that may predict, forecast, indicate or imply future results, performance or achievements, and may contain the words “may”, “will”, “should”, “continue”, “believe”, “anticipate”, “expect”, “estimate”, “intend”, “project”, “plan”, “will likely continue”, “will likely result”, or words or phrases with similar meaning. Undue reliance should not be placed on such statements because, by their nature, forward-looking statements involve risks and uncertainties, including, without limitation, economic, competitive, governmental and technological factors outside of the control of SIG CombiblocGroup AG (“SIG”, the “Company” or the “Group”), that may cause SIG’s business, strategy or actual results to differ materially from the forward-looking statements (or from past results). For any factors that could cause actual results to differ materially from the forward-looking statements contained in this presentation, please see our offering circular for the issue of Notes in June 2020. Nothing contained in this presentation is or should be relied upon as a promise or representation as to the future. It is up to the recipient of the presentation to make its own assessment as to the validity of such forward-looking statements and assumptions.
The information contained in the presentation does not purport to be comprehensive. SIG undertakes no obligation to publicly update or revise any information contained herein or forward-looking statements, whether to reflect new information, future events or circumstances or otherwise. It should further be noted, that past performance is not a guide to future performance.Please also note that interim results are not necessarily indicative of the full year results. Persons requiring advice should consult an independent adviser. While we are making great efforts to include accurate and up-to-date information, we make no representations or warranties, expressed or implied, and no reliance may be placed by any person as to the accuracy and completeness of the information provided in this presentation and we disclaim any liability for the use of it. Neither SIG nor any of its directors, officers, employees, agents, affiliates or advisers is under an obligation to update, correct or keep current the information contained in this presentation to which it relates or to provide the recipient of it with access to any additional information that may arise in connection with it and any opinions expressed in this presentation are subject to change.
The presentation may not be reproduced, published or transmitted, in whole or in part, directly or indirectly, to any person (whether within or outside such person’s organization or firm) other than its intended recipients. The attached information is not an offer to sell or a solicitation of an offer to purchase any security in the United States or elsewhere and shall not constitute an offer, solicitation or sale any
securities of SIG in any state or jurisdiction in which, or to any person to whom such an offer, solicitation or sale would be unlawful nor shall it or any part of it form the basis of, or be relied on in connection with, any contract or investment decision. No securities may be offered or sold within the United States or to U.S. persons absent registration or an applicable exemption from registration requirements. Any public offering of securities to be made in the United States will be made by means of a prospectus that may be obtained from any issuer of such securities and that will contain detailed information about us. Any failure to comply with the restrictions set out in this paragraph may constitute a violation of the securities laws of any such jurisdiction.
This presentation is not an offering circular within the meaning of article 652a of the Swiss Code of Obligations, nor is it a listing prospectus within the meaning of the listing rules of the SIX Swiss Exchange or a prospectus under any other applicable laws.
In this presentation, we utilise certain alternative performance measures including, but not limited to, EBITDA, adjusted EBITDA, core revenue, adjusted net income, adjusted earnings per share, net capital expenditure, free cash flow, ROCE and cash conversion that in each case are not recognised under International Financial Reporting Standards (“IFRS”). These alternative non-IFRS measures are presented as we believe that they and similar measures are widely used in the markets in which we operate as a means of evaluating a company’s operating performance and financing structure. They may not be comparable to other similarly titled measures of other companies and are not measurements under IFRS or other generally accepted accounting principles, nor should they be considered as substitutes for the information contained in the financial statements included in this presentation.
EBITDA is defined as profit or loss before net finance expense, income tax expense, depreciation of property, plant and equipment and right-of-use assets, and amortisation of intangible assets.
Adjusted EBITDA is defined as EBITDA adjusted to exclude certain non-cash transactions and items of a significant or unusual nature including, but not limited to, transaction- and acquisition-related costs, restructuring costs,unrealised gains or losses on derivatives, gains or losses on the sale of non-strategic assets, asset impairments and write-downs and share of profit or loss of joint ventures, and to include the cash impact of dividends received from joint ventures.
Adjusted net income is defined as profit or loss adjusted to exclude certain items of significant or unusual nature, including, but not limited to, the non-cash foreign exchange impact of non-functional currency loans, amortisation of transaction costs, the net change in fair value of financing-related derivatives, purchase price allocation (“PPA”) depreciation and amortisation, adjustments made to reconcile
EBITDA to adjusted EBITDA and the estimated tax impact of the foregoing adjustments. The PPA depreciation and amortisation arose due to the acquisition accounting that was performed when the Group was acquired by Onex in 2015. No adjustments are made for PPA depreciation and amortisation other than in connection with the Onex acquisition.
Adjusted EBITDA and adjusted net income are not performance measures under IFRS, are not measures of financial condition, liquidity or profitability and should not be considered as alternatives to profit (loss) for the period, operating profit or any other performance measures determined or derived in accordance with IFRS or operating cash flows determined in accordance with IFRS.
Additionally, adjusted EBITDA is not intended to be a measure of free cash flow for management’s discretionary use, as it does not take into account certain items such as interest and principal payments on our indebtedness, working capital needs and tax payments. We believe that the inclusion of adjusted EBITDA and adjusted net income in this presentation is appropriate to provide additional information to investors about our operating performance to provide a measure of operating results unaffected by differences in capital structures, capital investment cycles and ages of related assets among otherwise comparable companies. Because not all companies calculate adjusted EBITDA, core revenue, adjusted net income and other alternative performance measures in this presentation identically, they may not be comparable to other similarly titled measures in other companies.
For additional information about alternative performance measures used by management that are not defined in IFRS, including definitions and reconciliations to measures defined in IFRS, refer to the consolidated financial statements for the year ended 31 December 2020 included in the SIG 2020 Annual Report. For alternative performance measures that are not included in the 2020 Annual Report but only in this presentation, definitions of such measures are generally included in the footnotes on the slides where they are presented.
For an overview of definitions of alternative performance measures used by the Group and related reconciliations, please refer to the following link: www.sig.biz/investors/en/performance/key-figures
Some financial information in this presentation has been rounded and, as a result, the figures shown as totals in this presentation may vary slightly from the exact arithmetic aggregation of the figures that precede them
Please note that combismile is currently not available in Germany, Great Britain, France, Italy and Japan.
23 FEBRUARY 2021 FY 2020 RESULTS2
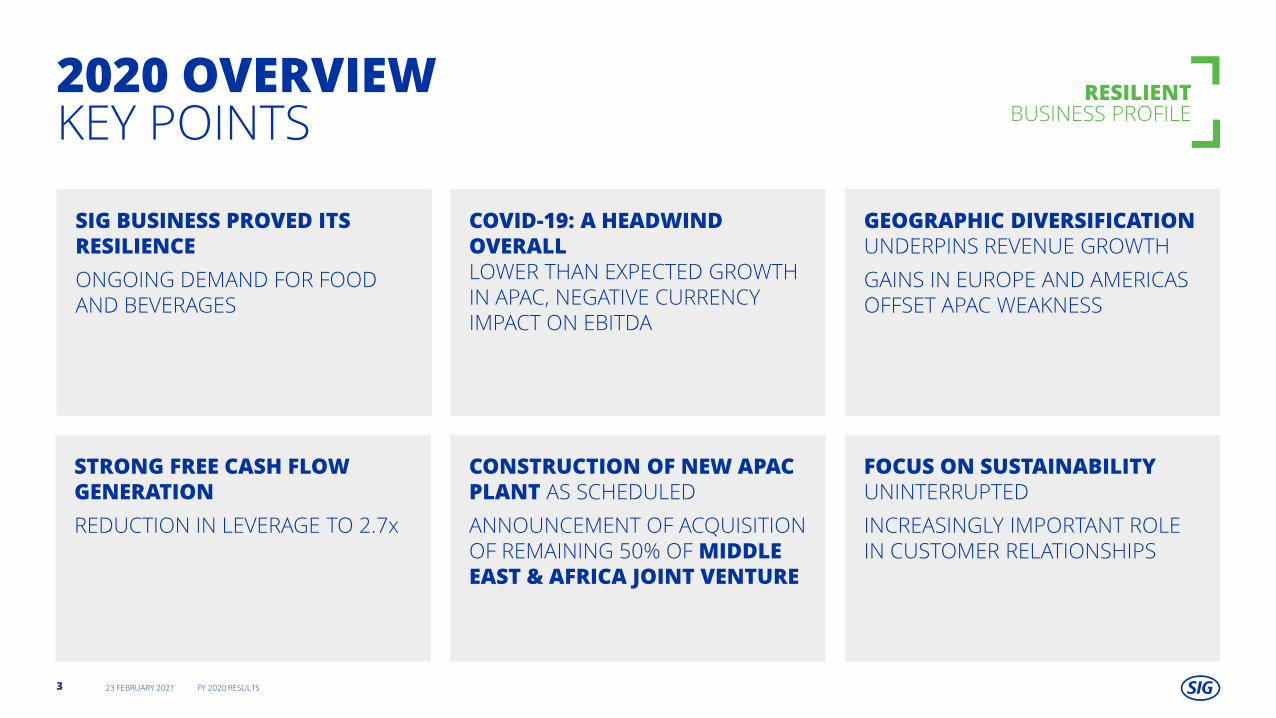
2020 OVERVIEWKEY POINTS
SIG BUSINESS PROVED ITS RESILIENCE
ONGOING DEMAND FOR FOOD AND BEVERAGES
CONSTRUCTION OF NEW APAC PLANT AS SCHEDULED
ANNOUNCEMENT OF ACQUISITION OF REMAINING 50% OF MIDDLE EAST & AFRICA JOINT VENTURE
COVID-19: A HEADWIND OVERALLLOWER THAN EXPECTED GROWTH IN APAC, NEGATIVE CURRENCY IMPACT ON EBITDA
GEOGRAPHIC DIVERSIFICATIONUNDERPINS REVENUE GROWTH
GAINS IN EUROPE AND AMERICAS OFFSET APAC WEAKNESS
RESILIENT BUSINESS PROFILE
FOCUS ON SUSTAINABILITY UNINTERRUPTED
INCREASINGLY IMPORTANT ROLE IN CUSTOMER RELATIONSHIPS
STRONG FREE CASH FLOW GENERATION
REDUCTION IN LEVERAGE TO 2.7x
23 FEBRUARY 2021 FY 2020 RESULTS3

FRANK HERZOG
CFO
• Previously CFO at VFS Global
• Finance leadership positions at Dematic Group and KION
• Extensive investment banking experience
JOSÉ MATTHIJSSE
PRESIDENT & GENERAL MANAGER EUROPE
• Previously a Managing Director with
FrieslandCampina
• International experience with Heineken
RECENT MANAGEMENT CHANGES
With effect 1.1.2021With effect 1.2.2021
23 FEBRUARY 2021 FY 2020 RESULTS4

2020 FINANCIALHIGHLIGHTS
CORE REVENUE € 1.80 BILLION
+5.5%AT CONSTANT CURRENCY
CORE REVENUE
+1.7%REPORTED
PERFORMANCE IN LINE WITH GUIDANCE
ADJUSTED EBITDA
€ 498MILLION(2019: € 485m)
ADJUSTED EBITDA MARGIN
27.4% (2019: 27.2%)
ROCE2
29.5%(2019: 22.8%)
FREE CASH FLOW
€ 233 MILLION (2019: € 267m)
FREE CASH FLOW PER SHARE:€ 0.73(2019: € 0.83)
ADJUSTED NET INCOME
€ 232MILLION(2019: € 217m)
PROPOSED DIVIDEND CHF 0.42 PER SHARE1
(2019: CHF 0.38)
1 Equivalent to a total payout of ~€124 million at 31 December 2020 exchange rate. The proposed dividend will be paid out of the foreign capital contribution reserve2 Calculated by applying a 30% reference tax rate to provide comparability between years. 150 basis points of 2020 improvement due to Whakatane asset impairments
23 FEBRUARY 2021 FY 2020 RESULTS5
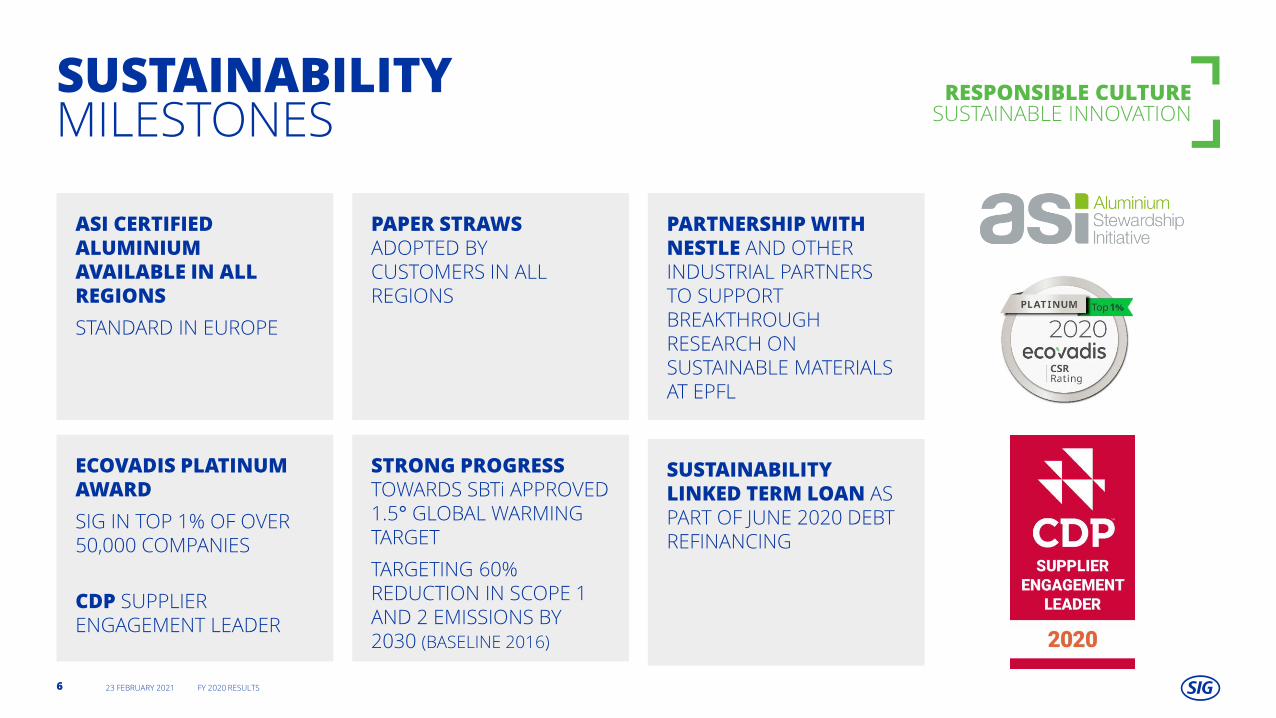
SUSTAINABILITYMILESTONES
ECOVADIS PLATINUM AWARD
SIG IN TOP 1% OF OVER 50,000 COMPANIES
CDP SUPPLIER ENGAGEMENT LEADER
ASI CERTIFIED ALUMINIUM AVAILABLE IN ALL REGIONS
STANDARD IN EUROPE
PAPER STRAWSADOPTED BY CUSTOMERS IN ALL REGIONS
PARTNERSHIP WITH NESTLE AND OTHER INDUSTRIAL PARTNERS TO SUPPORT BREAKTHROUGH RESEARCH ON SUSTAINABLE MATERIALS AT EPFL
RESPONSIBLE CULTURE SUSTAINABLE INNOVATION
SUSTAINABILITY LINKED TERM LOAN AS PART OF JUNE 2020 DEBT REFINANCING
STRONG PROGRESS TOWARDS SBTi APPROVED 1.5° GLOBAL WARMING TARGET
TARGETING 60% REDUCTION IN SCOPE 1 AND 2 EMISSIONS BY 2030 (BASELINE 2016)
23 FEBRUARY 2021 FY 2020 RESULTS6
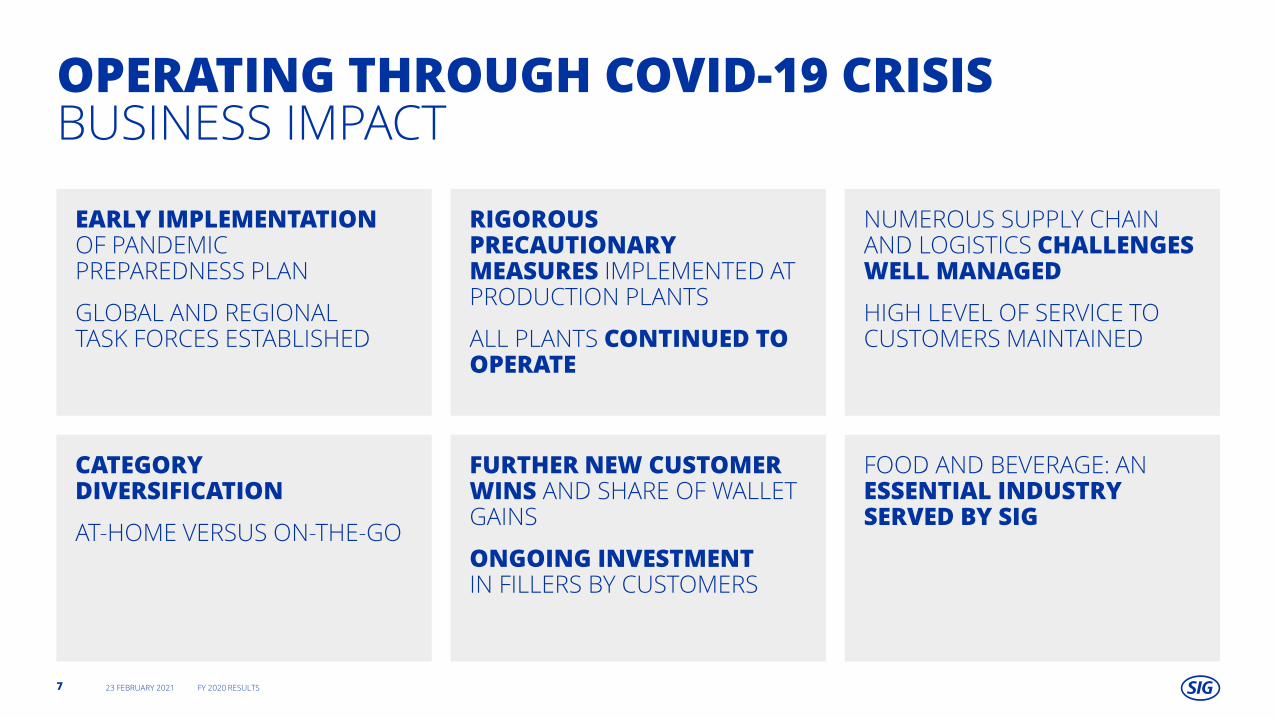
OPERATING THROUGH COVID-19 CRISISBUSINESS IMPACT
EARLY IMPLEMENTATION OF PANDEMIC PREPAREDNESS PLAN
GLOBAL AND REGIONAL TASK FORCES ESTABLISHED
RIGOROUS PRECAUTIONARY MEASURES IMPLEMENTED AT PRODUCTION PLANTS
ALL PLANTS CONTINUED TO OPERATE
CATEGORY DIVERSIFICATION
AT-HOME VERSUS ON-THE-GO
NUMEROUS SUPPLY CHAIN AND LOGISTICS CHALLENGES WELL MANAGED
HIGH LEVEL OF SERVICE TO CUSTOMERS MAINTAINED
FURTHER NEW CUSTOMER WINS AND SHARE OF WALLET GAINS
ONGOING INVESTMENTIN FILLERS BY CUSTOMERS
FOOD AND BEVERAGE: AN ESSENTIAL INDUSTRY SERVED BY SIG
23 FEBRUARY 2021 FY 2020 RESULTS7
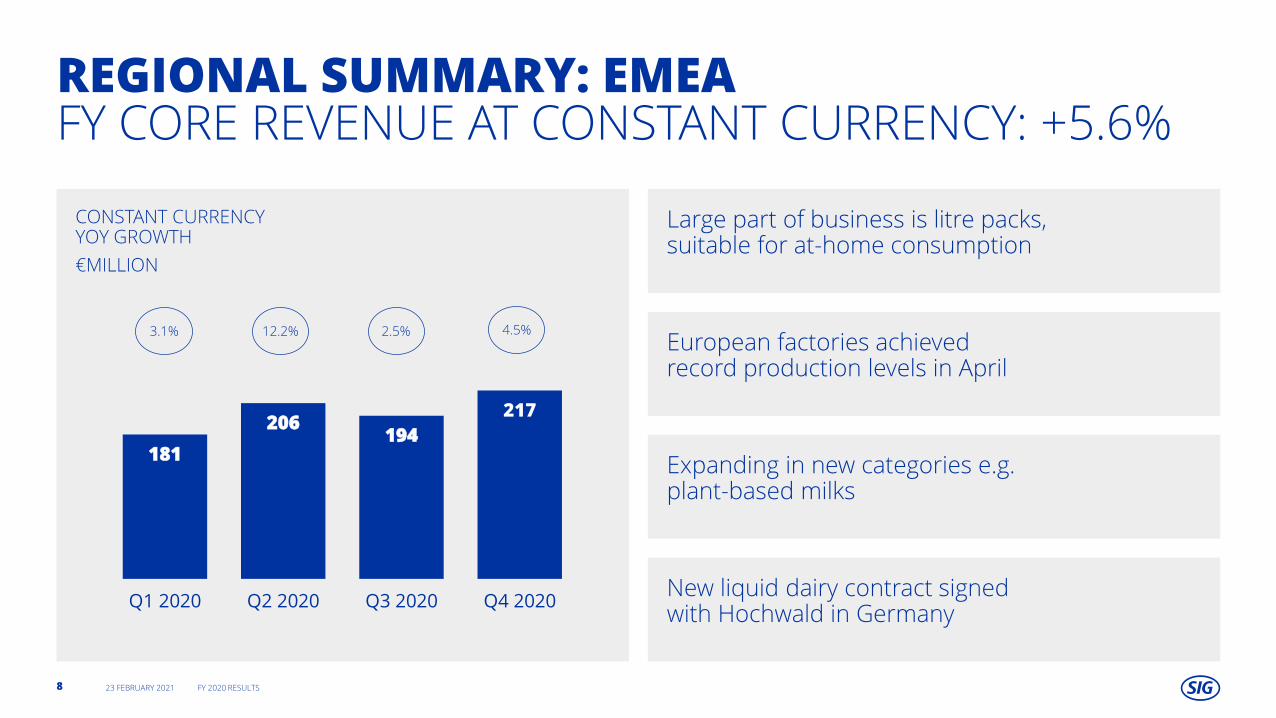
CONSTANT CURRENCYYOY GROWTH
€MILLION
181
206194
217
Q1 2020 Q2 2020 Q3 2020 Q4 2020
REGIONAL SUMMARY: EMEAFY CORE REVENUE AT CONSTANT CURRENCY: +5.6%
23 FEBRUARY 2021 FY 2020 RESULTS8
Large part of business is litre packs, suitable for at-home consumption
European factories achieved record production levels in April
Expanding in new categories e.g. plant-based milks
3.1% 12.2% 2.5%
New liquid dairy contract signedwith Hochwald in Germany
4.5%
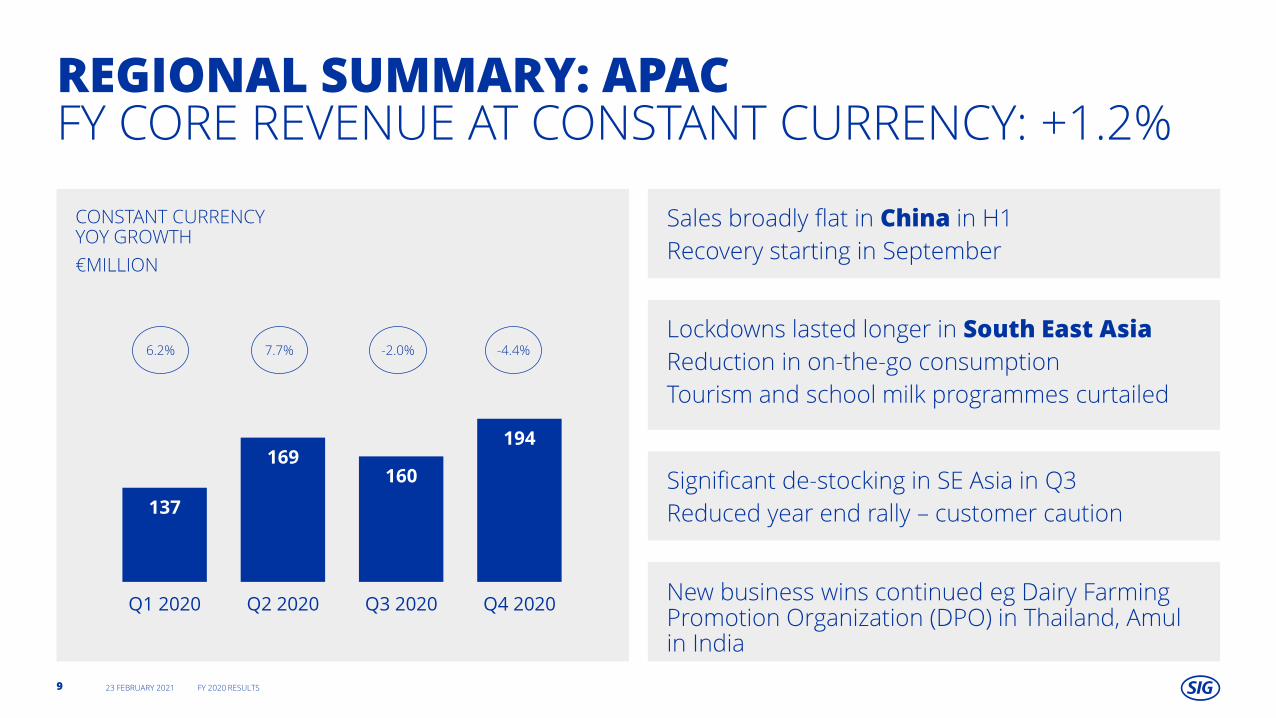
CONSTANT CURRENCYYOY GROWTH
€MILLION
137
169160
194
Q1 2020 Q2 2020 Q3 2020 Q4 2020
REGIONAL SUMMARY: APAC FY CORE REVENUE AT CONSTANT CURRENCY: +1.2%
23 FEBRUARY 2021 FY 2020 RESULTS9
Sales broadly flat in China in H1
Recovery starting in September
Lockdowns lasted longer in South East Asia
Reduction in on-the-go consumption
Tourism and school milk programmes curtailed
Significant de-stocking in SE Asia in Q3
Reduced year end rally – customer caution
6.2% 7.7% -2.0% -4.4%
New business wins continued eg Dairy Farming Promotion Organization (DPO) in Thailand, Amulin India

CONSTANT CURRENCYYOY GROWTH
€MILLION
68
8379
91
Q1 2020 Q2 2020 Q3 2020 Q4 2020
REGIONAL SUMMARY: AMERICASFY CORE REVENUE AT CONSTANT CURRENCY: +14.7%
23 FEBRUARY 2021 FY 2020 RESULTS10
Q1: low base of comparison
USA: lower foodservice sales; increase in at home consumption of food products
34.2% 5.0% 24.1% 5.3%
COVID-19 positive in Brazil and Mexico – higher at-home milk and food consumption
Increased welfare payments in Brazil
Catering to basic and premium segments
Q3: ramp-up of new filler placements in Brazil
9 fillers installed with two new customers
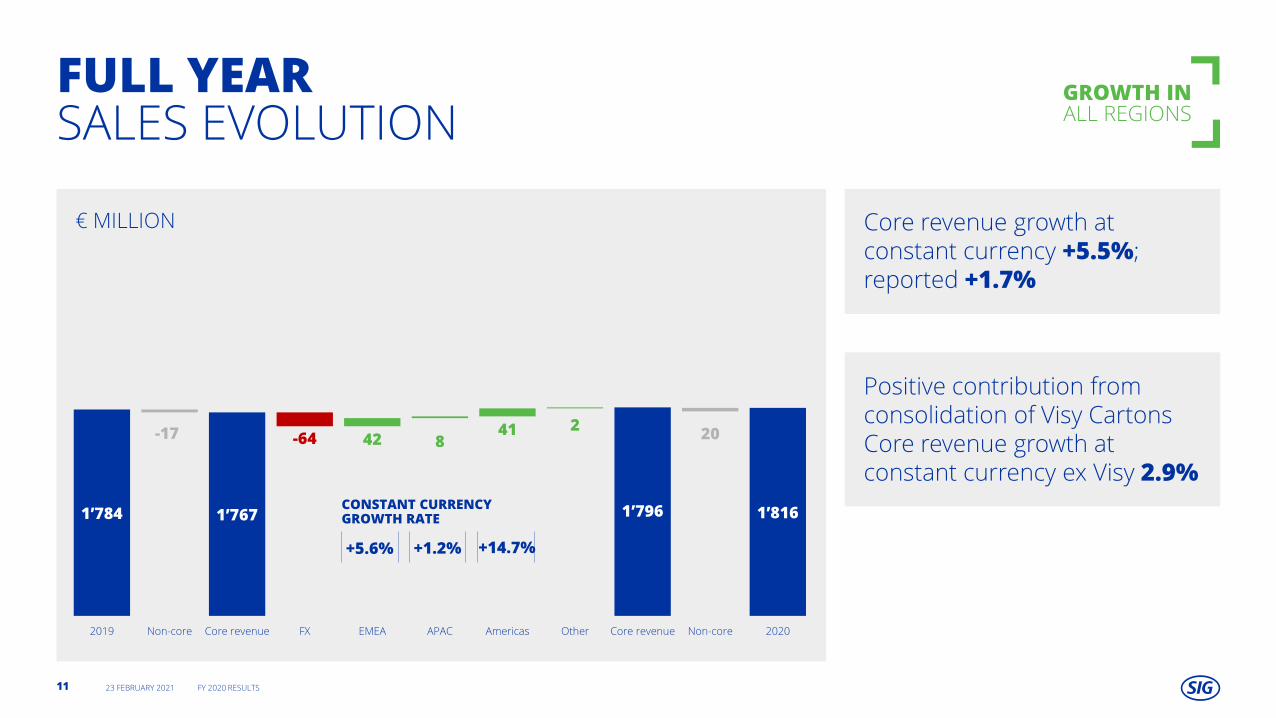
Core revenue growth at constant currency +5.5%; reported +1.7%
Positive contribution from consolidation of Visy CartonsCore revenue growth at constant currency ex Visy 2.9%
€ MILLION
1’784 1’767 1’796 1’816
-17 -64 42 841 2
20
2019 Non-core Core revenue FX EMEA APAC Americas Other Core revenue Non-core 2020
FULL YEARSALES EVOLUTION
GROWTH INALL REGIONS
CONSTANT CURRENCY GROWTH RATE
+5.6% +1.2% +14.7%
23 FEBRUARY 2021 FY 2020 RESULTS11
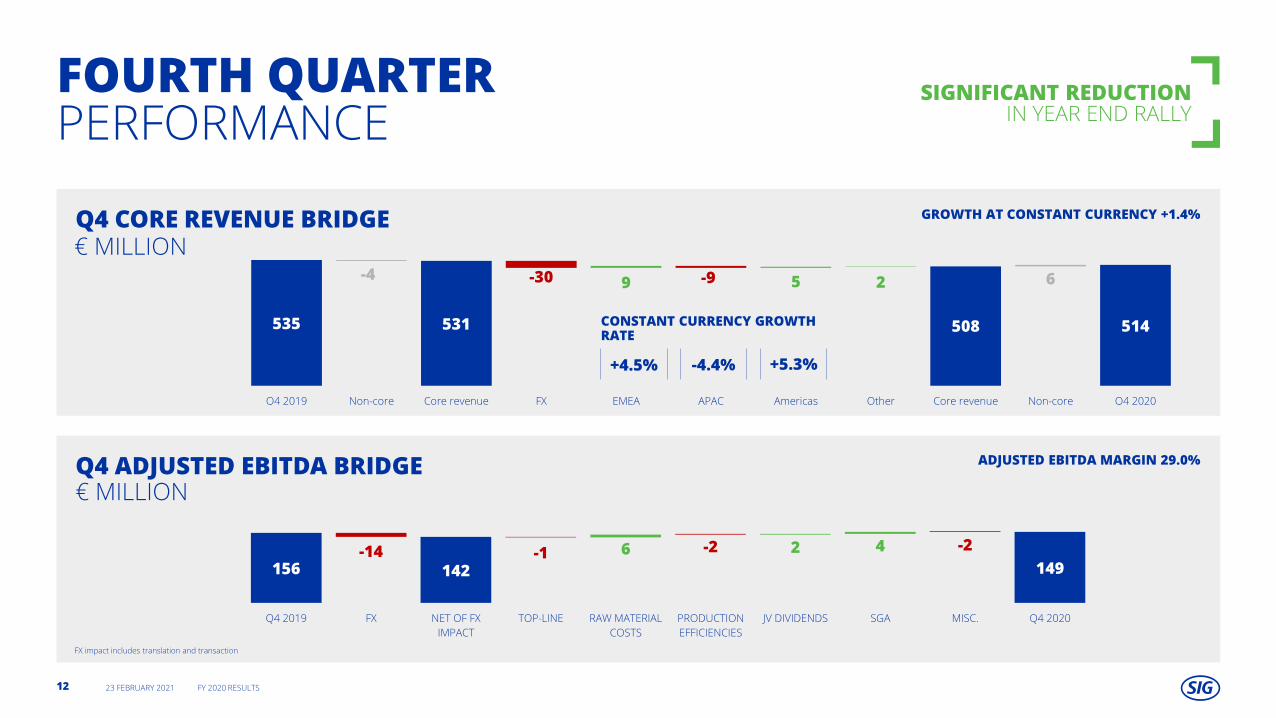
FOURTH QUARTERPERFORMANCE
SIGNIFICANT REDUCTIONIN YEAR END RALLY
Q4 CORE REVENUE BRIDGE€ MILLION
Q4 ADJUSTED EBITDA BRIDGE € MILLION
FX impact includes translation and transaction
535 531 508 514
-4 -30 9 -9 5 2 6
Q4 2019 Non-core Core revenue FX EMEA APAC Americas Other Core revenue Non-core Q4 2020
CONSTANT CURRENCY GROWTH RATE
+4.5% -4.4% +5.3%
156 142 149-14 -1 6 -2 2 4 -2
Q4 2019 FX NET OF FX
IMPACT
TOP-LINE RAW MATERIAL
COSTS
PRODUCTION
EFFICIENCIES
JV DIVIDENDS SGA MISC. Q4 2020
23 FEBRUARY 2021 FY 2020 RESULTS12
GROWTH AT CONSTANT CURRENCY +1.4%
ADJUSTED EBITDA MARGIN 29.0%
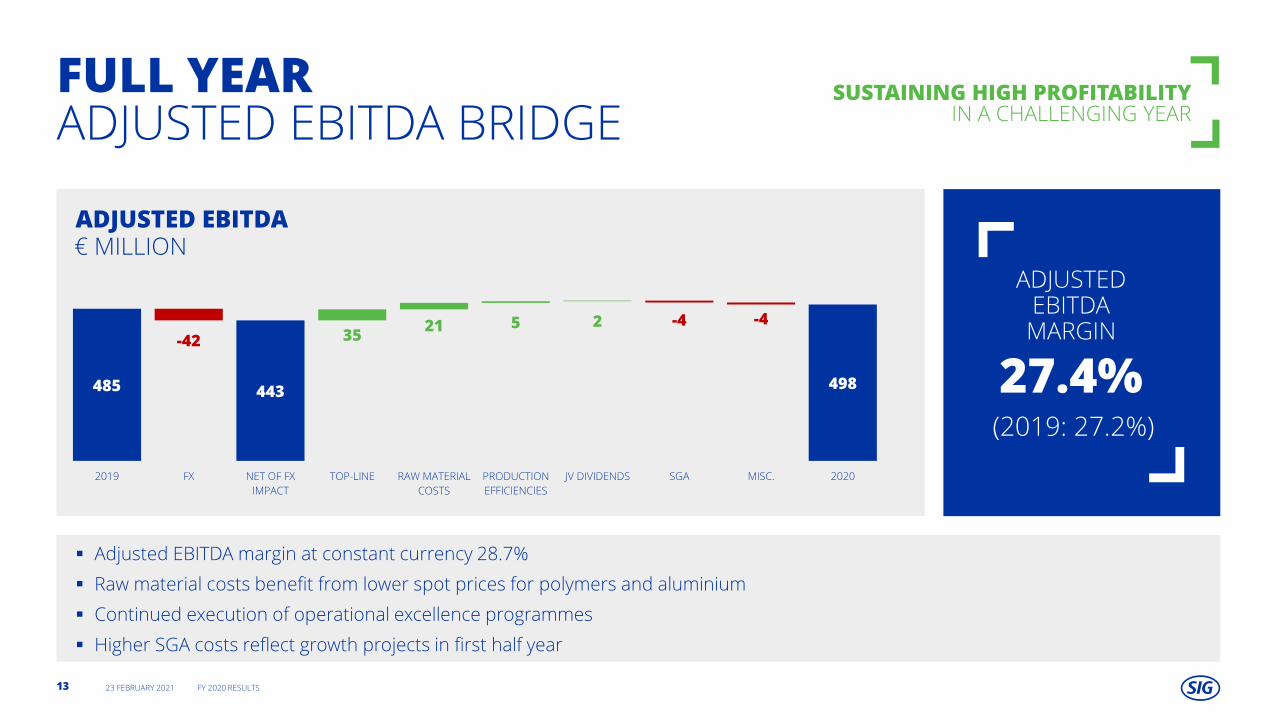
▪ Adjusted EBITDA margin at constant currency 28.7%
▪ Raw material costs benefit from lower spot prices for polymers and aluminium
▪ Continued execution of operational excellence programmes
▪ Higher SGA costs reflect growth projects in first half year
ADJUSTED EBITDA
FULL YEARADJUSTED EBITDA BRIDGE
SUSTAINING HIGH PROFITABILITY IN A CHALLENGING YEAR
€ MILLION
485 443 498
-42 3521 5 2 -4 -4
2019 FX NET OF FX
IMPACT
TOP-LINE RAW MATERIAL
COSTS
PRODUCTION
EFFICIENCIES
JV DIVIDENDS SGA MISC. 2020
27.4%
ADJUSTED EBITDAMARGIN
(2019: 27.2%)
23 FEBRUARY 2021 FY 2020 RESULTS13
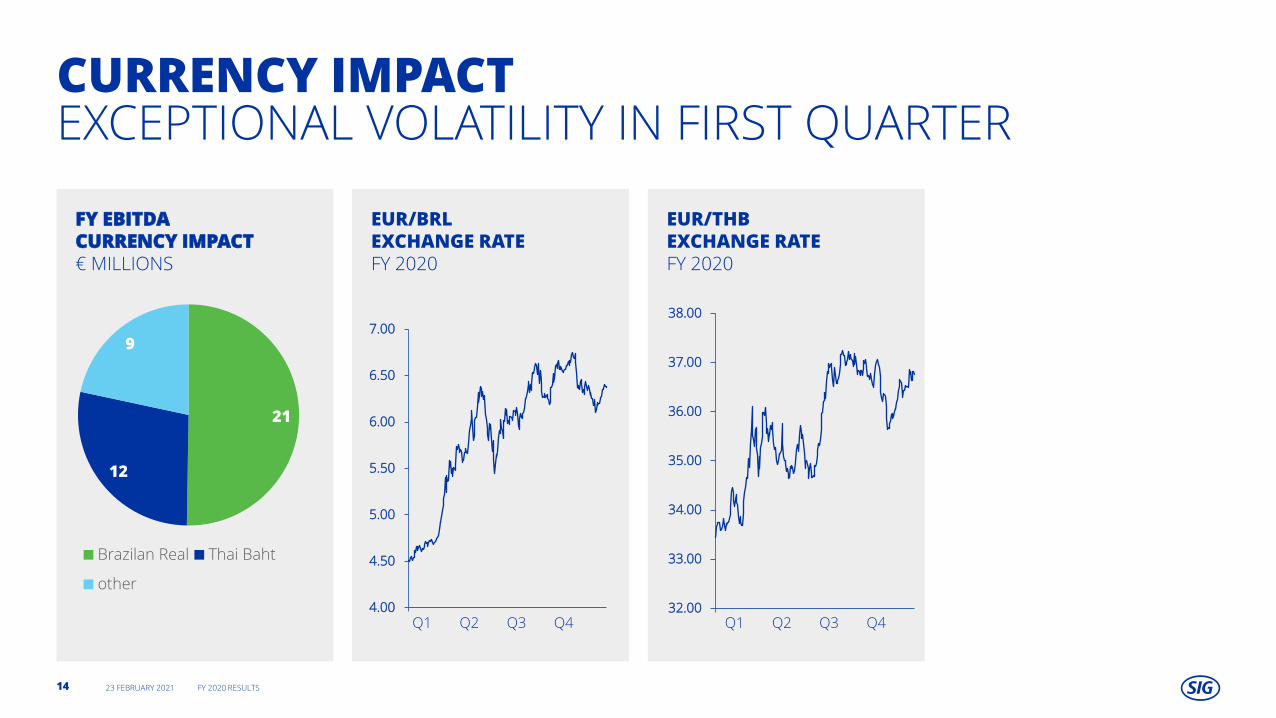
EUR/BRL EXCHANGE RATEFY 2020
CURRENCY IMPACTEXCEPTIONAL VOLATILITY IN FIRST QUARTER
FY EBITDA CURRENCY IMPACT€ MILLIONS
21
12
9
Brazilan Real Thai Baht
other
23 FEBRUARY 2021 FY 2020 RESULTS14
EUR/THB EXCHANGE RATEFY 2020
4.00
4.50
5.00
5.50
6.00
6.50
7.00
Q1 Q2 Q3 Q4 Q1 Q2 Q3 Q432.00
33.00
34.00
35.00
36.00
37.00
38.00
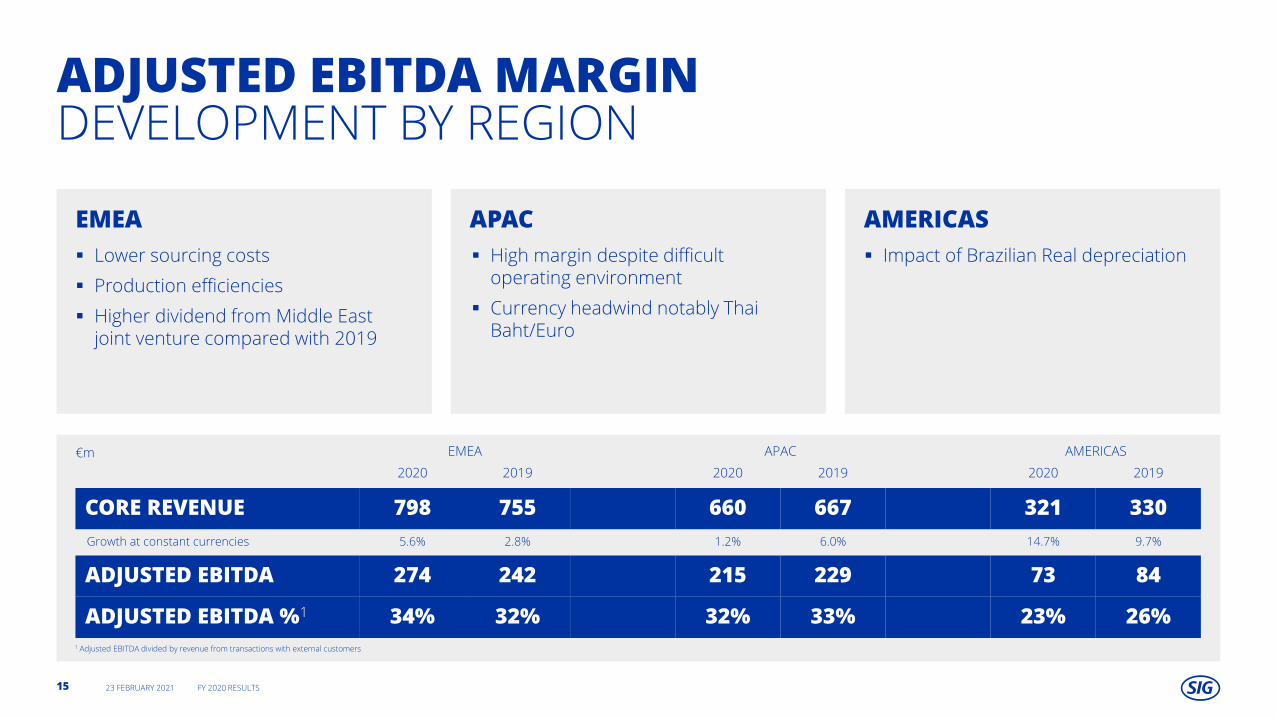
EMEA APAC AMERICAS
ADJUSTED EBITDA MARGINDEVELOPMENT BY REGION
▪ Lower sourcing costs
▪ Production efficiencies
▪ Higher dividend from Middle East joint venture compared with 2019
€m EMEA APAC AMERICAS
2020 2019 2020 2019 2020 2019
CORE REVENUE 798 755 660 667 321 330
Growth at constant currencies 5.6% 2.8% 1.2% 6.0% 14.7% 9.7%
ADJUSTED EBITDA 274 242 215 229 73 84
ADJUSTED EBITDA %1 34% 32% 32% 33% 23% 26%
▪ High margin despite difficult operating environment
▪ Currency headwind notably Thai Baht/Euro
▪ Impact of Brazilian Real depreciation
1 Adjusted EBITDA divided by revenue from transactions with external customers
23 FEBRUARY 2021 FY 2020 RESULTS15
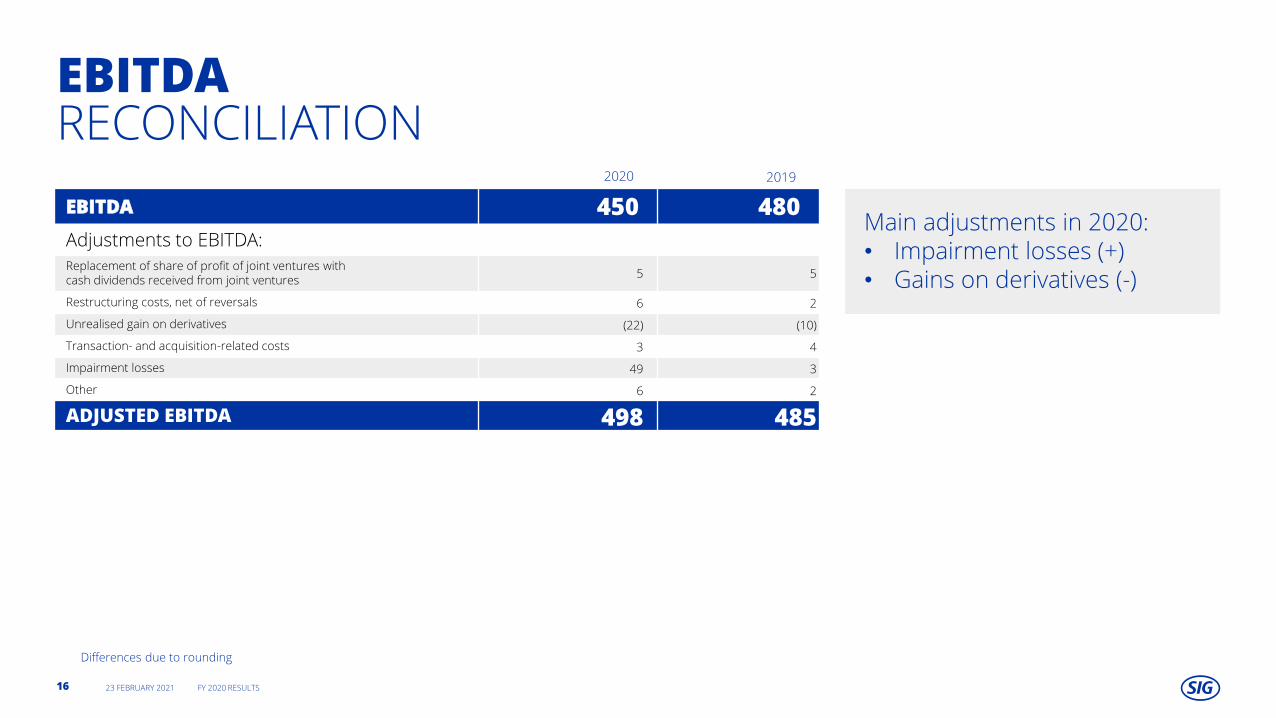
EBITDARECONCILIATION
23 FEBRUARY 2021 FY 2020 RESULTS16
EBITDA 450 480
Adjustments to EBITDA:
Replacement of share of profit of joint ventures withcash dividends received from joint ventures
5 5
Restructuring costs, net of reversals 6 2
Unrealised gain on derivatives (22) (10)
Transaction- and acquisition-related costs 3 4
Impairment losses 49 3
Other 6 2
ADJUSTED EBITDA 498 485
Main adjustments in 2020:• Impairment losses (+)• Gains on derivatives (-)
Differences due to rounding
2020 2019
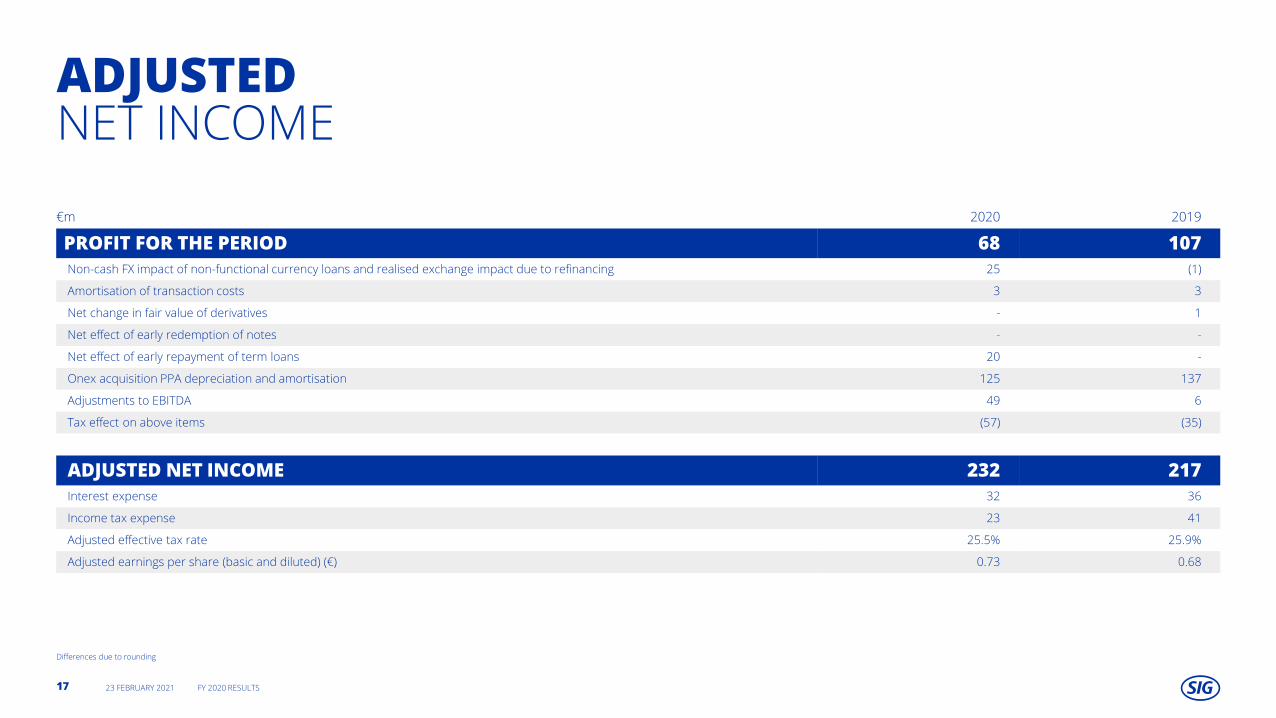
ADJUSTEDNET INCOME
€m 2020 2019
PROFIT FOR THE PERIOD 68 107
Non-cash FX impact of non-functional currency loans and realised exchange impact due to refinancing 25 (1)
Amortisation of transaction costs 3 3
Net change in fair value of derivatives - 1
Net effect of early redemption of notes - -
Net effect of early repayment of term loans 20 -
Onex acquisition PPA depreciation and amortisation 125 137
Adjustments to EBITDA 49 6
Tax effect on above items (57) (35)
ADJUSTED NET INCOME 232 217
Interest expense 32 36
Income tax expense 23 41
Adjusted effective tax rate 25.5% 25.9%
Adjusted earnings per share (basic and diluted) (€) 0.73 0.68
Differences due to rounding
23 FEBRUARY 2021 FY 2020 RESULTS17
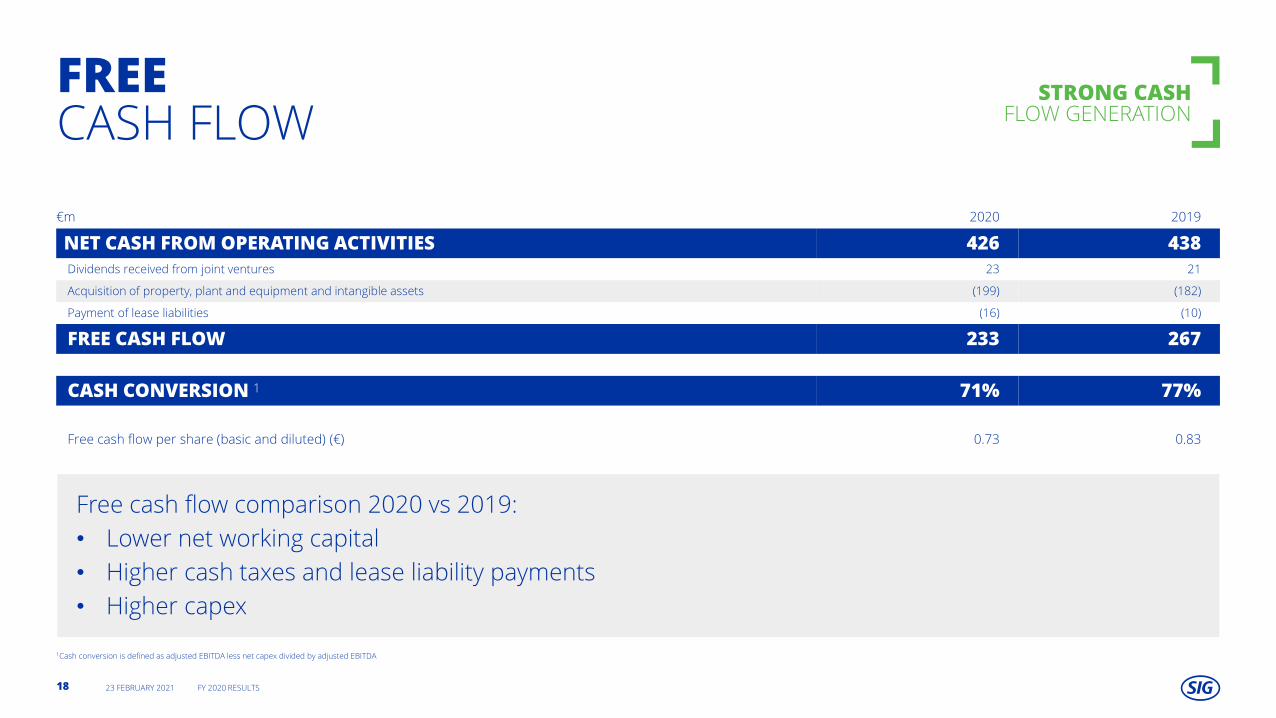
FREECASH FLOW
€m 2020 2019
NET CASH FROM OPERATING ACTIVITIES 426 438
Dividends received from joint ventures 23 21
Acquisition of property, plant and equipment and intangible assets (199) (182)
Payment of lease liabilities (16) (10)
FREE CASH FLOW 233 267
CASH CONVERSION 1 71% 77%
Free cash flow per share (basic and diluted) (€) 0.73 0.83
STRONG CASHFLOW GENERATION
1Cash conversion is defined as adjusted EBITDA less net capex divided by adjusted EBITDA
23 FEBRUARY 2021 FY 2020 RESULTS18
Free cash flow comparison 2020 vs 2019:
• Lower net working capital
• Higher cash taxes and lease liability payments
• Higher capex

WORKING CAPITAL
(1) Including accruals for volume bonuses to customers settled in following year
€m 2020 2019
INVENTORY 171 167
TRADE RECEIVABLES 102 162
TRADE PAYABLES (164) (180)
NET WORKING CAPITAL 109 150
% REVENUE 6.0% 8.4%
OTHER RECEIVABLES / PAYABLES1 (256) (226)
OPERATING NET WORKING CAPITAL (146) (76)
% REVENUE (8.1%) (4.3%)1 Including liabilities for volume bonuses and other incentives to customers settled in following year
NET WORKING CAPITALWELL CONTROLLED
Differences due to rounding
23 FEBRUARY 2021 FY 2020 RESULTS19
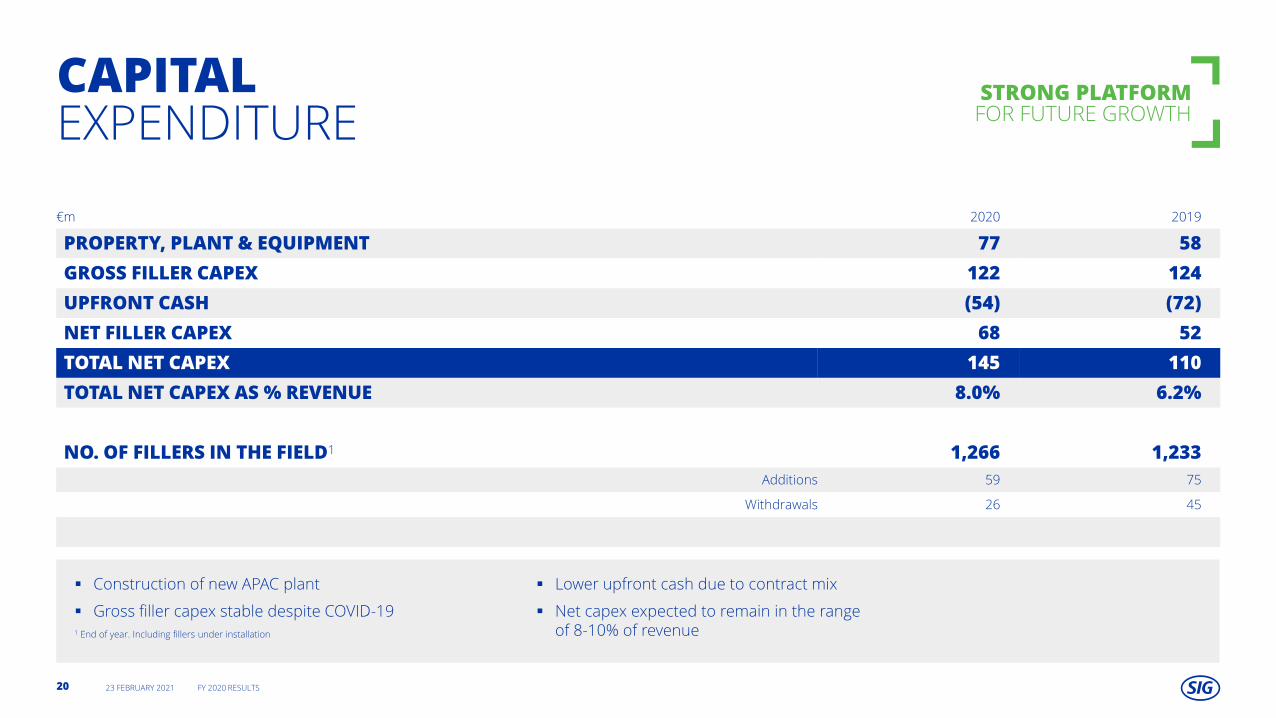
CAPITALEXPENDITURE
€m 2020 2019
PROPERTY, PLANT & EQUIPMENT 77 58
GROSS FILLER CAPEX 122 124
UPFRONT CASH (54) (72)
NET FILLER CAPEX 68 52
TOTAL NET CAPEX 145 110
TOTAL NET CAPEX AS % REVENUE 8.0% 6.2%
NO. OF FILLERS IN THE FIELD1 1,266 1,233
Additions 59 75
Withdrawals 26 45
STRONG PLATFORMFOR FUTURE GROWTH
▪ Construction of new APAC plant
▪ Gross filler capex stable despite COVID-191 End of year. Including fillers under installation
▪ Lower upfront cash due to contract mix
▪ Net capex expected to remain in the range of 8-10% of revenue
23 FEBRUARY 2021 FY 2020 RESULTS20

LEVERAGE
€m 2020 2019
CASH1 355 261
TERM LOAN 550 1’561
NOTES ISSUES 1’000 -
LEASE LIABILITIES 147 54
NET TOTAL DEBT 1’342 1’353
TOTAL NET LEVERAGE RATIO 2.7x 2.8x
LEVERAGE GUIDANCE TOWARDS 2x MID-TERM
▪ Increase in lease liabilities due to new APAC plant
▪ Debt refinancing in June 2020: shift to unsecured structure
▪ Cost of debt 1.6% at end December 2020
(1) Including €2 million restricted cash in 2020 (2019: €6 million)Differences due to rounding
23 FEBRUARY 2021 FY 2020 RESULTS21
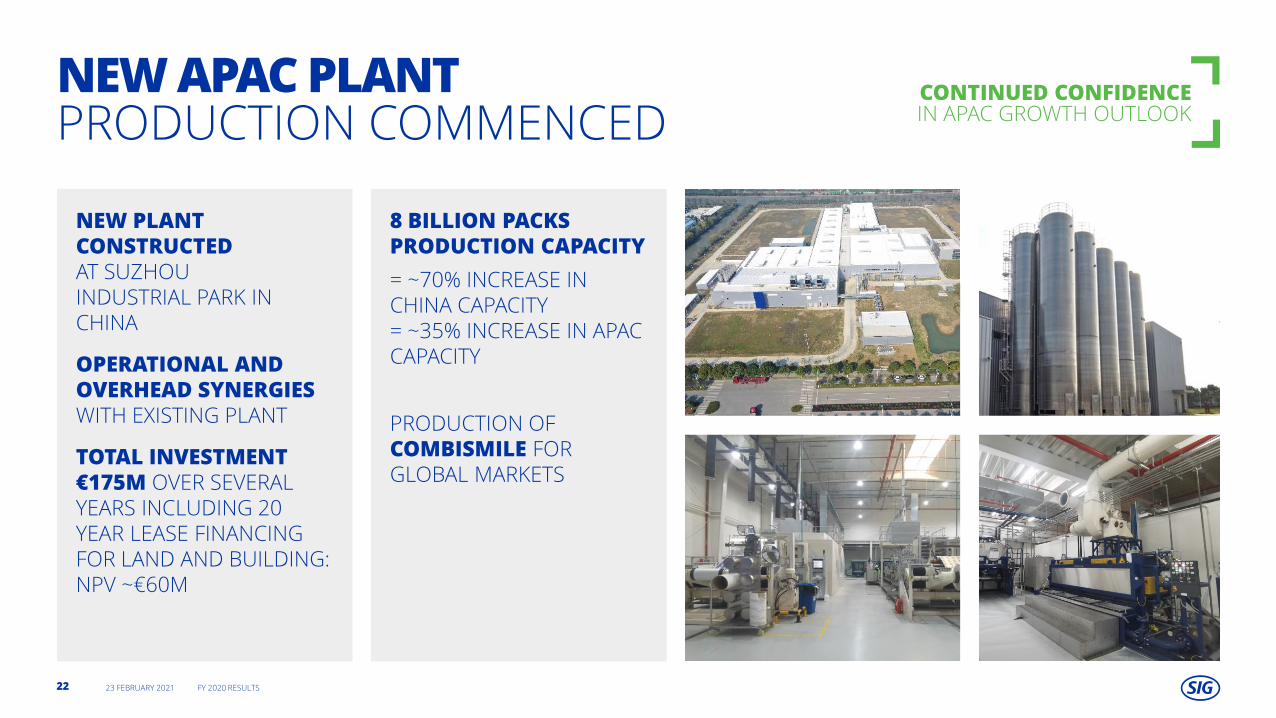
NEW APAC PLANTPRODUCTION COMMENCED
NEW PLANT CONSTRUCTED AT SUZHOU INDUSTRIAL PARK IN CHINA
OPERATIONAL AND OVERHEAD SYNERGIES WITH EXISTING PLANT
TOTAL INVESTMENT €175M OVER SEVERAL YEARS INCLUDING 20 YEAR LEASE FINANCING FOR LAND AND BUILDING: NPV ~€60M
8 BILLION PACKS PRODUCTION CAPACITY
= ~70% INCREASE IN CHINA CAPACITY= ~35% INCREASE IN APAC CAPACITY
PRODUCTION OF COMBISMILE FOR GLOBAL MARKETS
CONTINUED CONFIDENCEIN APAC GROWTH OUTLOOK
23 FEBRUARY 2021 FY 2020 RESULTS22
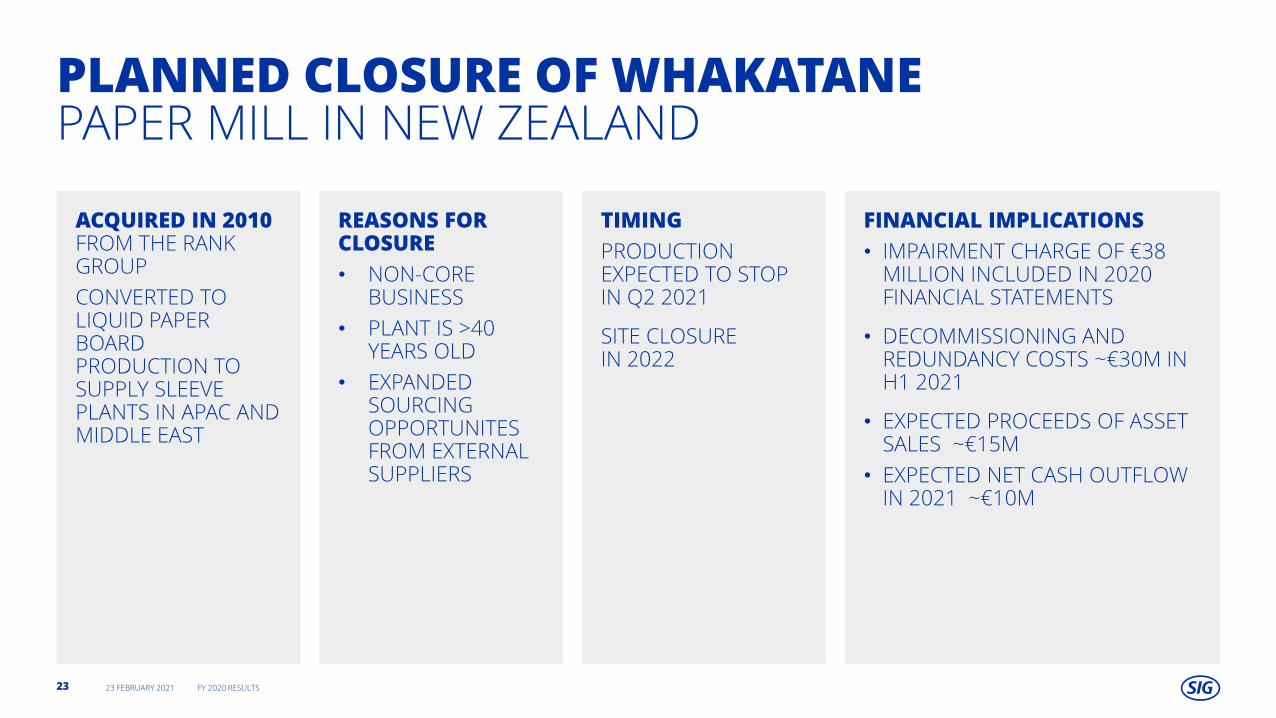
PLANNED CLOSURE OF WHAKATANEPAPER MILL IN NEW ZEALAND
ACQUIRED IN 2010 FROM THE RANK GROUP
CONVERTED TO LIQUID PAPER BOARD PRODUCTION TO SUPPLY SLEEVE PLANTS IN APAC AND MIDDLE EAST
REASONS FOR CLOSURE
• NON-CORE BUSINESS
• PLANT IS >40 YEARS OLD
• EXPANDED SOURCING OPPORTUNITES FROM EXTERNAL SUPPLIERS
TIMING
PRODUCTION EXPECTED TO STOP IN Q2 2021
SITE CLOSURE IN 2022
FINANCIAL IMPLICATIONS
• IMPAIRMENT CHARGE OF €38 MILLION INCLUDED IN 2020 FINANCIAL STATEMENTS
• DECOMMISSIONING AND REDUNDANCY COSTS ~€30M IN H1 2021
• EXPECTED PROCEEDS OF ASSET SALES ~€15M
• EXPECTED NET CASH OUTFLOW IN 2021 ~€10M
23 FEBRUARY 2021 FY 2020 RESULTS23
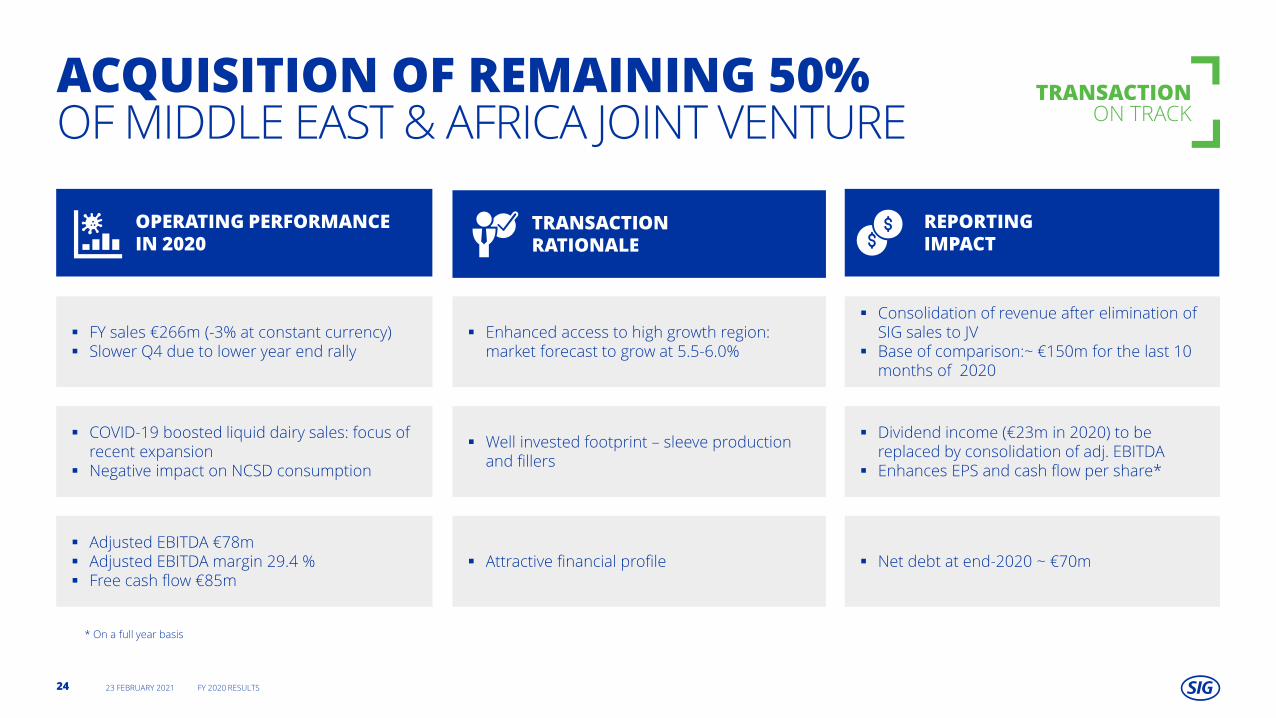
ACQUISITION OF REMAINING 50%OF MIDDLE EAST & AFRICA JOINT VENTURE
REPORTING IMPACT
OPERATING PERFORMANCE IN 2020
▪ FY sales €266m (-3% at constant currency)▪ Slower Q4 due to lower year end rally
▪ COVID-19 boosted liquid dairy sales: focus of recent expansion
▪ Negative impact on NCSD consumption
▪ Attractive financial profile
▪ Enhanced access to high growth region: market forecast to grow at 5.5-6.0%
▪ Consolidation of revenue after elimination of SIG sales to JV
▪ Base of comparison:~ €150m for the last 10 months of 2020
▪ Dividend income (€23m in 2020) to be replaced by consolidation of adj. EBITDA
▪ Enhances EPS and cash flow per share*
TRANSACTION RATIONALE
▪ Well invested footprint – sleeve production and fillers
▪ Net debt at end-2020 ~ €70m▪ Adjusted EBITDA €78m▪ Adjusted EBITDA margin 29.4 %▪ Free cash flow €85m
* On a full year basis
23 FEBRUARY 2021 FY 2020 RESULTS24
TRANSACTION ON TRACK

RETURN ONCAPITAL EMPLOYED
23 FEBRUARY 2021 FY 2020 RESULTS25
€m 2020 2019
INCOME STATEMENT ITEMS
Adjusted EBITDA 498 485
Depreciation of PP&E¹ (160) (177)
Dividends received from joint ventures (23) (21)
ROCE EBITA 315 288
BALANCE SHEET ITEMS
Current assets (excluding cash and cash equivalents) 424 462
Current liabilities (excluding interest-bearing liabilities) (663) (653)
PP&E² 987 1,073
CAPITAL EMPLOYED 748 882
Pre-tax ROCE³ 42.2% 32.6%
ROCE tax rate (%)4 30% 30%
Estimated post-tax ROCE 29.5% 22.8%
(1) Includes the depreciation related to the “stepped-up” property, plant and equipment asset base resulting from the purchase price allocation related to the 2015 acquisition by Onex
(2) Includes the purchase price allocation step-up
(3) Pre-tax Return on Capital Employed (“ROCE”) represents ROCE EBITA divided by Capital Employed
(4) Post-tax ROCE is calculated by adjusting pre-tax ROCE by applying a 30% tax rate (which management has determined reflects a reference tax rate to provide comparability between years and takes into consideration the post IPO capital structure).
Differences due to rounding
• Increase in adjusted EBITDA• Lower net working capital• Whakatane asset impairments
(150bps benefit)
ROCE at adjusted effective tax rate: 31.4%
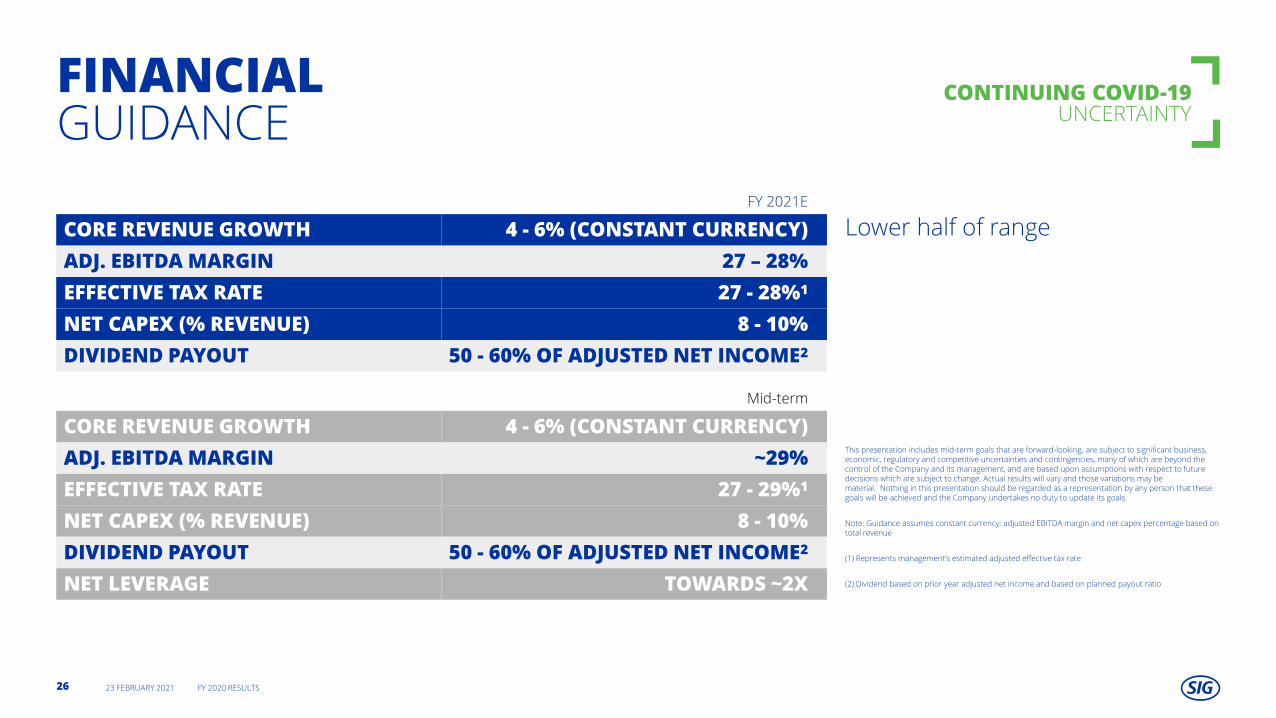
FINANCIALGUIDANCE
CONTINUING COVID-19 UNCERTAINTY
This presentation includes mid-term goals that are forward-looking, are subject to significant business, economic, regulatory and competitive uncertainties and contingencies, many of which are beyond the control of the Company and its management, and are based upon assumptions with respect to future decisions which are subject to change. Actual results will vary and those variations may be material. Nothing in this presentation should be regarded as a representation by any person that these goals will be achieved and the Company undertakes no duty to update its goals.
Note: Guidance assumes constant currency; adjusted EBITDA margin and net capex percentage based on total revenue
(1) Represents management’s estimated adjusted effective tax rate
(2) Dividend based on prior year adjusted net income and based on planned payout ratio
Mid-term
CORE REVENUE GROWTH 4 - 6% (CONSTANT CURRENCY)
ADJ. EBITDA MARGIN ~29%
EFFECTIVE TAX RATE 27 - 29%1
NET CAPEX (% REVENUE) 8 - 10%
DIVIDEND PAYOUT 50 - 60% OF ADJUSTED NET INCOME2
NET LEVERAGE TOWARDS ~2X
FY 2021E
CORE REVENUE GROWTH 4 - 6% (CONSTANT CURRENCY)
ADJ. EBITDA MARGIN 27 – 28%
EFFECTIVE TAX RATE 27 - 28%1
NET CAPEX (% REVENUE) 8 - 10%
DIVIDEND PAYOUT 50 - 60% OF ADJUSTED NET INCOME2
Lower half of range
23 FEBRUARY 2021 FY 2020 RESULTS26
CONCLUSION
TOP LINE PERFORMANCE IN 2020 DEMONSTRATES RESILIENCE OF BUSINESS
CONTINUING TRACK RECORD OF GROWTH AND CASH GENERATION
BEST-IN-CLASS PROFITABILITY
STRONG RETURN PROFILE: ROCE 29.5%
FURTHER EXPANDING GEOGRAPHIC FOOTPRINT
INSTALLED FILLER BASE IS A STRONG PLATFORM FOR FUTURE GROWTH
AUGMENTED BY ONGOING INVESTMENT
STRONG BUSINESS FUNDAMENTALS
ATTRACTIVE ENVIRONMENTAL PROFILE
23 FEBRUARY 2021 FY 2020 RESULTS27

THANK YOU
CEO SAMUEL SIGRISTCFO FRANK HERZOG 23 FEBRUARY 2021


