Download - Side by Side comparison using XBRL data
Mission – Help investors unlock the
intrinsic value of XBRL by DevelopingInvestment analysis tools based on XBRL data.
1visit http://www.analyze10k.com

S&P 500
• S&P 500 is one of the most tracked indexes in the investmentworld. It consists of 500 companies covering over 90 differentindustries.
• Knowledge of these 500 companies is a very valuable assetsfor any investor.
• Presently there are no FREE tools that help investors inanalyzing these 500 companies.
2visit http://www.analyze10k.com
S&P500 COMPARISON TOOL
Analyze10k has come-up with a FREE tool that will help investors do side byside comparison of S&P 500 companies in a fast and efficient manner. Tools isavailable online at http://www.analyze10k.com
With just a few mouse clicks an investor can do side by side comparison ofany two peer companies belonging to S&P 500 index.
The comparison report can further be saved in excel format for furtheranalysis.
3visit http://www.analyze10k.com
HOW DOES THE TOOL WORK?
• The tool makes use of the XBRL technology. Based on the user’s inputs it goes and queries http://www.sec.gov database that has the interactive financial reports based on the XBRL data
Main parts of the tool
GUI based input panel where user selects parameters for the comparison report.
PHP based processing engine that takes in the input from the GUI based panel , further queries the SEC database and then generates the comparison report.
4visit http://www.analyze10k.com
DEMO OF A SAMPLE COMPARISON
SCENARIO : Let us say that one is exploring the P&C Industry and wants tocompare the latest balance sheet of 10-Q reports for two leading P&CInsurance companies Chubb and Traveler’s inc.
Following are the four steps one needs to take to get to the comparisonreport
STEP-1 : Got to http://www.analyze10k.com and click on S&P500 comparison tool
5visit http://www.analyze10k.com
DEMO OF A SAMPLE COMPARISON
5visit http://www.analyze10k.com
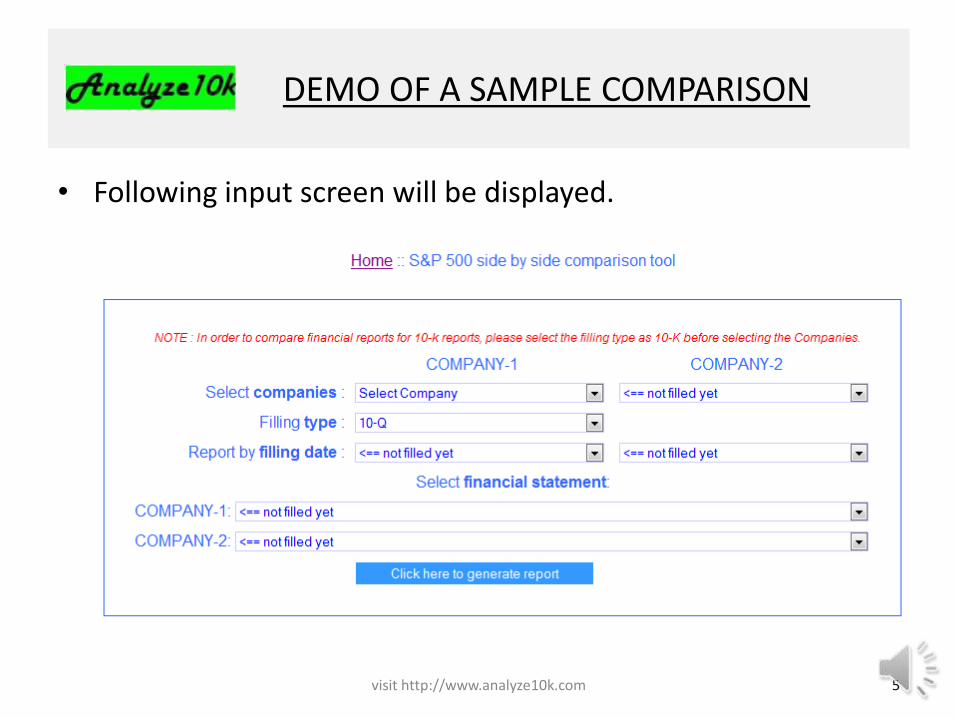
• Following input screen will be displayed.

DEMO OF A SAMPLE COMPARISON
5visit http://www.analyze10k.com
• STEP-2 Select the appropriate values from the drop downs boxes as shown below.
DEMO OF A SAMPLE COMPARISON
5visit http://www.analyze10k.com
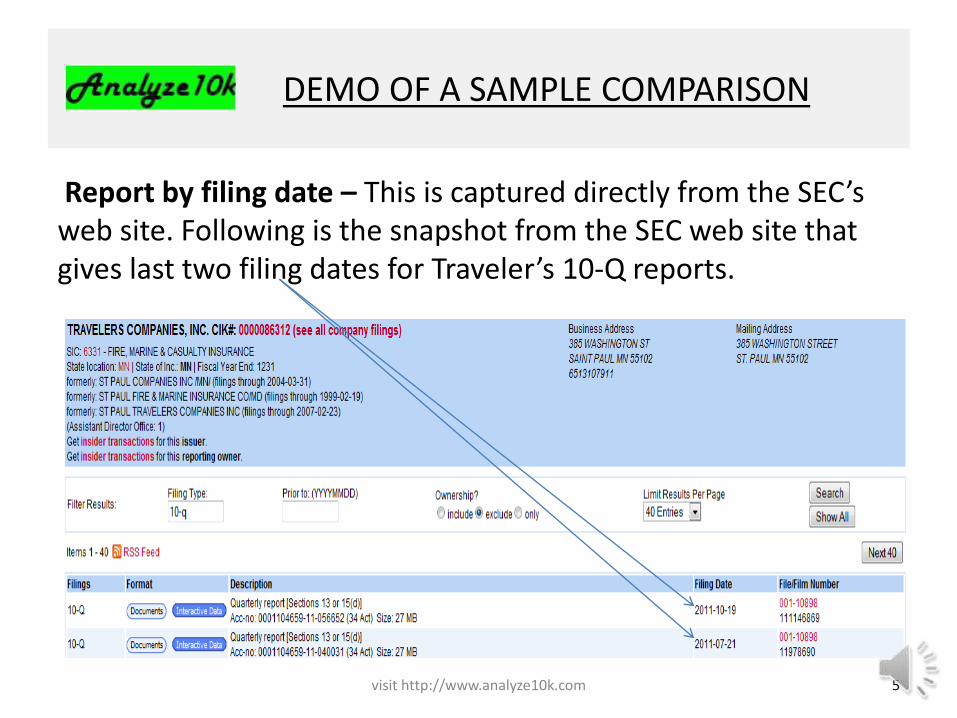
Report by filing date – This is captured directly from the SEC’s web site. Following is the snapshot from the SEC web site that gives last two filing dates for Traveler’s 10-Q reports.
DEMO OF A SAMPLE COMPARISON
5visit http://www.analyze10k.com
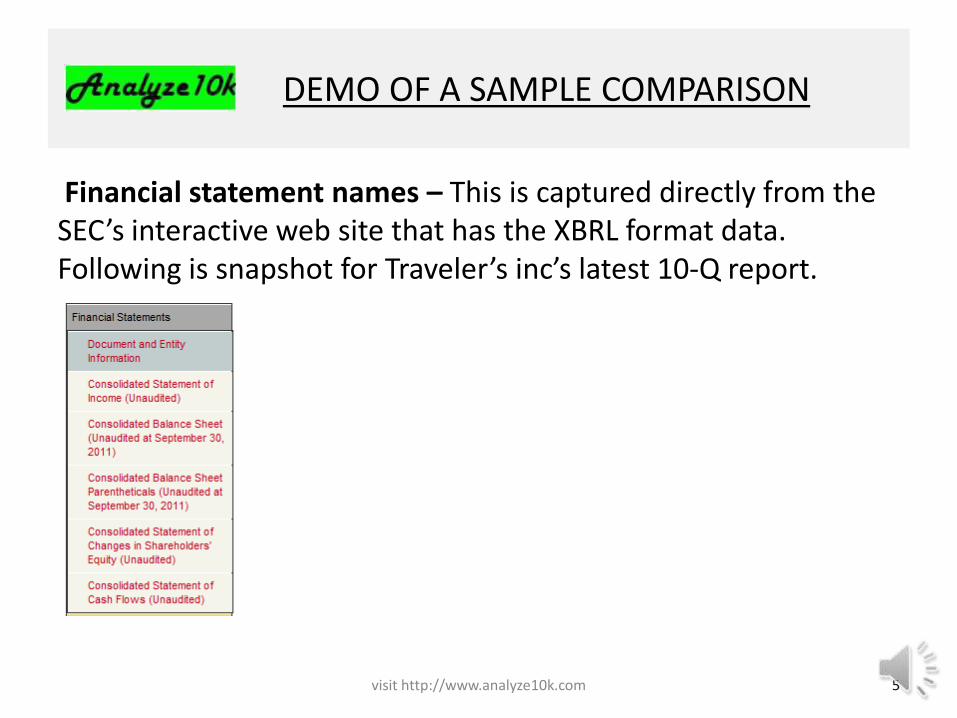
Financial statement names – This is captured directly from the SEC’s interactive web site that has the XBRL format data. Following is snapshot for Traveler’s inc’s latest 10-Q report.
DEMO OF A SAMPLE COMPARISON
5visit http://www.analyze10k.com
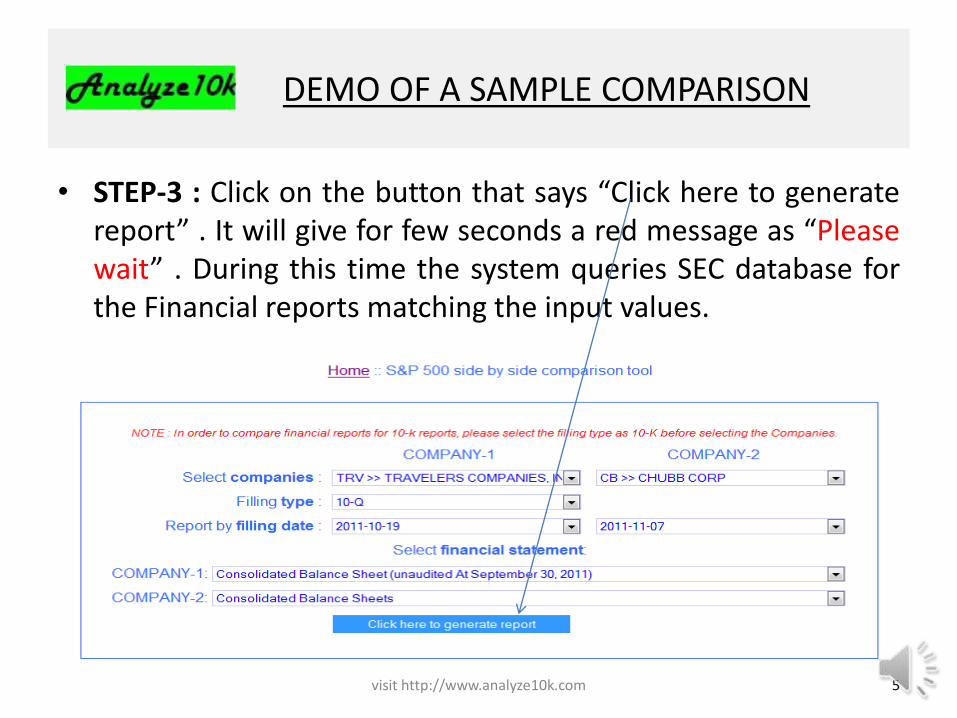
• STEP-3 : Click on the button that says “Click here to generatereport” . It will give for few seconds a red message as “Pleasewait” . During this time the system queries SEC database forthe Financial reports matching the input values.

DEMO OF A SAMPLE COMPARISON
5visit http://www.analyze10k.com
This is how the final comparison report looks like. Its displayed in two slides here because the comparison report could not fit in one slide.

DEMO OF A SAMPLE COMPARISON
5visit http://www.analyze10k.com
• Comparison report continued from previous page
DEMO OF A SAMPLE COMPARISON
5visit http://www.analyze10k.com
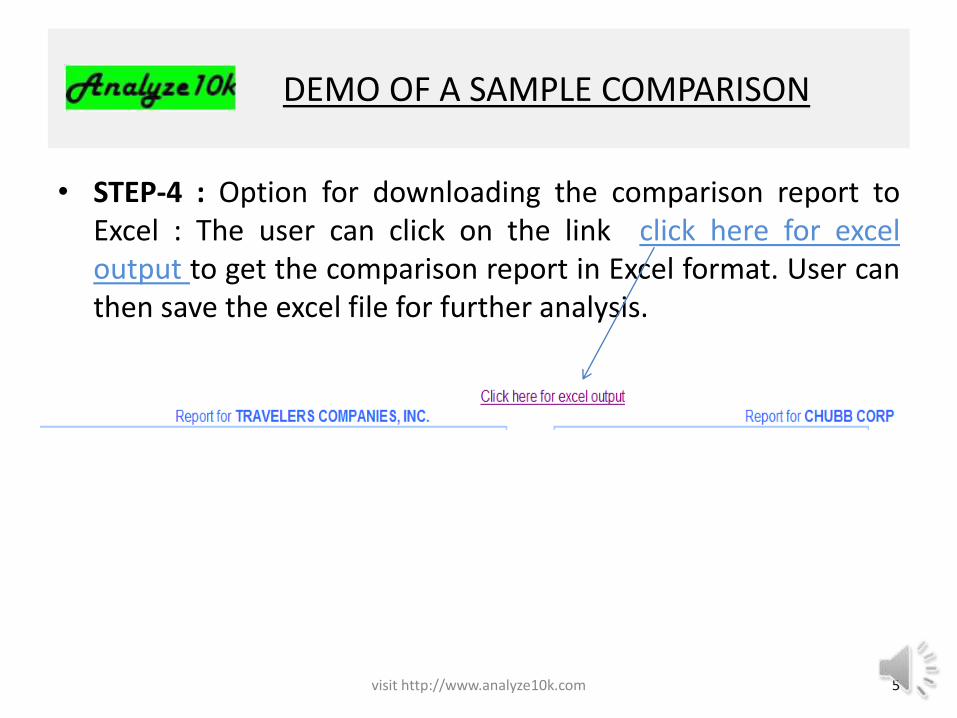
• STEP-4 : Option for downloading the comparison report toExcel : The user can click on the link click here for exceloutput to get the comparison report in Excel format. User canthen save the excel file for further analysis.

DEMO OF A SAMPLE COMPARISON
5visit http://www.analyze10k.com
• In order to view the sample comparison report in excel please log in to http://www.analyze10k.com/sample.xls
THANK YOU!!!
5visit http://www.analyze10k.com
In case of any questions please e-mail [email protected]
We will be more than happy to assist you.


