
NBER WORKING PAPER SERIES
SHANGHAI’S TRADE, CHINA’S GROWTH:CONTINUITY, RECOVERY, AND CHANGE SINCE THE OPIUM WAR
Wolfgang KellerBen Li
Carol H. Shiue
Working Paper 17754http://www.nber.org/papers/w17754
NATIONAL BUREAU OF ECONOMIC RESEARCH1050 Massachusetts Avenue
Cambridge, MA 02138January 2012
The views expressed herein are those of the authors and do not necessarily reflect the views of theNational Bureau of Economic Research. Part of this research was done while Keller and Shiue werevisiting Princeton; the hospitality of the International Economics Section and the Department of Economicsis gratefully acknowledged. Keller and Shiue also thank NSF for support (grants SES 0453040 and1124426). We thank Debin Ma, Maarten Prak, Albrecht Ritschl, Alwyn Young, and seminar participantsat LSE and the CESifo trade conference in Munich, December 2011 for comments. Excellent researchassistance was provided by Xavier Gitiaux and Yibei Liu.
NBER working papers are circulated for discussion and comment purposes. They have not been peer-reviewed or been subject to the review by the NBER Board of Directors that accompanies officialNBER publications.
© 2012 by Wolfgang Keller, Ben Li, and Carol H. Shiue. All rights reserved. Short sections of text,not to exceed two paragraphs, may be quoted without explicit permission provided that full credit,including © notice, is given to the source.

Shanghai’s Trade, China’s Growth: Continuity, Recovery, and Change since the Opium WarWolfgang Keller, Ben Li, and Carol H. ShiueNBER Working Paper No. 17754January 2012JEL No. F10,F22,F23,N81,N83,N85,N95,O43
ABSTRACT
In this paper, we provide aggregate trends in China’s trade performance from the 1840s to the present.Based on historical benchmarks, we argue that China’s recent gains are not exclusively due to thereforms since 1978. Rather, foreign economic activity can be understood by developments that wereset in motion in the 19th century. We turn our focus to Shanghai, currently the world’s largest port.Shanghai began direct trade relations with western nations starting in 1843. By 1853, Shanghai alreadyaccounted for more than half of China’s foreign trade. In tracking the levels and growth rates of thecity’s net and gross imports and exports, foreign direct investment, and foreign residents over morethan a century, we find that Shanghai’s level of bilateral trade today with the United States, the UnitedKingdom, or Japan, for example, are by no means high given Shanghai’s 19th century experience. Thispaper argues that a regional approach that embeds national trading destinations within an internationaltrading system provides a meaningful approach to understanding the history of China’s trade.
Wolfgang KellerDepartment of EconomicsUniversity of Colorado-BoulderBoulder, CO 80309-0256and [email protected]
Ben LiDepartment of EconomicsBoston College140 Commonwealth AvenueChestnut Hill MA 02467-3806 [email protected]
Carol H. ShiueDepartment of EconomicsUniversity of Colorado-BoulderBoulder, CO 80309-0256and [email protected]

2
1. Introduction Currently, China is the largest exporter in the world, and one of the top three importers.1
Its trade has increased by almost 18% per year on average in the last couple of decades, a
performance that is routinely described as “astonishing” and “breathtaking.”2 China’s
economy has implications not only for production, incomes and current accounts in
individual countries, but China’s influence is felt globally.3 Forecasts of China’s economic
prospects typically focus on the reforms since the year 1978 (Perkins 2007, Lin 2011). We
push the quantitative knowledge frontier back in time by 150 years. This paper shows that
while some features of China’s recent performance are truly extraordinary, others are not.
By distilling similarities and differences between the 19th century trade opening and
China’s current rise in global trade, our analysis sheds new light on China’s strong recent
performance and future prospects. More generally, the case of China provides new policy
lessons on the relation between openness and economic performance over the long‐run,
and on the extent to which pro‐openness policies can actually affect a country’s role in the
world economy.
Shanghai is a good starting point for understanding China’s recent trade dynamics,
not least because the city has had the world’s largest port since the year 2005.4 Focal port
cities such as Shanghai may be more appropriate spatial units with which to examine trade
liberalization, because foreign trade does not diffuse to all regions of a country at one point
in time when the country opens to world trade. Although Shanghai had been engaged in
significant foreign trade for several centuries within Asia, for most of its history the town
was overshadowed by several nearby administrative cities that were each more populous
1 Based on data from United Nations COMTRADE and the National Bureau of Statistics of China. 2 “China’s average trade growth measured in constant US dollar between 1990 and 2010 was an astonishing 17.6%”,( Lin 2011),and ”[T]he pace of China’s integration into world trade has been nothing short of breathtaking” (di Giovanni, Levchenko, and Zhang 2011). 3 China’s impact on more developed countries is analyzed by Bloom, Draca, and van Reenen (2011), who examine the implications of import competition from China on employment and information technology investments of European firms; and Autor, Dorn, and Hanson (2011) who study the effects of competition from China in the labor market of the United States. China’s impact on less developed countries is analyzed by Devlin, Estevadeordal, and Rodriguez‐Clare (2005) in the case of Latin America. di Giovanni, Levchenko, and Zhang (2011) study China’s impact on global welfare, while Ju, Shi, and Wei (2011) analyze global current account ‘imbalances’ as they relate to China’s current account surplus and the U.S. trade deficit. Finally, Feenstra and Wei (2010) edit a collection of contributions on China’s growing role in world trade.. 4 By total tonnage of cargo volume, based on statistics from www.aapa‐ports.org.

3
and influential than Shanghai. In the mid‐19th century, under the demands of British
gunboats, Shanghai, along with a handful of other Chinese ports, was forced to open to
foreign merchants seeking wider markets in China. During the late 19th century, Shanghai
gained importance for China as its center of foreign trade, the recipient of the lion’s share of
foreign direct investment (FDI), and generally as a hub that linked the world with China.5
Goods from the hinterlands were exported to Shanghai and re‐exported to foreign
countries; conversely foreign goods that arrived in Shanghai were channeled domestically
to regional Chinese markets. During the treaty port era, Shanghai handled about 50% of
China’s gross (including re‐exports) foreign trade.
In this paper, we introduce a formal historical benchmark by quantifying
international economic activity at Shanghai, including over the treaty port era, which we
take to be the start of the opening of Shanghai in 1843 to the occupation of Shanghai by
Japan in 1941. This provides a benchmark for China’s recent trade performance. Today,
Shanghai is again a connection between the rest of China and the rest of the world, as well
as a catalyst for Chinese regional and national economic development. In some ways,
Shanghai has taken on its historical role anew. By focusing on Shanghai, we put the
domestic hub—key to China’s foreign trade—at the center of the analysis.
A better understanding of the history of China’s trade is important for
understanding her overall economic performance, which remains somewhat of a puzzle
(Rawski 1999, Sachs and Woo 2000). While high growth today is in part due to improved
factor allocation post reforms (Hsieh and Klenow 2009, Song, Storesletten, and Zilibotti
2011), China’s institutions (a non‐democratic political regime, weakly enforced property
rights, slow privatization, heavy public spending, as well as highly managed interest and
exchange rates) and China’s late industrialization make it difficult to judge how temporary
growth bursts will carry over into sustained welfare increases. In fact, even China’s current
trade performance can be remarkably difficult to gauge. While the observed "surge" stems
in part from the release of the state control in the early 1980s, without a benchmark level
5 Shanghai, like other Chinese ports opened by treaty to foreign trade, was also exposed to new institutions, for example the abolition of old monopoly trading systems and certain aspects of the Western legal system. While taken as given in the present paper, this issue will be central in some of our future work.

4
of trade it is impossible to tell whether China's recent trade performance is a real
breakthrough or a recovery from distortionary policies.
We provide a historical benchmark in this paper by linking the post‐1978 period to
China’s liberalization of foreign trade in the 1840s. To do so, we employ new data
originally collected by the Chinese Maritime Customs (CMC) service, the Western‐led
organization that ran China’s customs system from the years 1854 to 1948, and connect
those data to present‐day statistics and international activity in Shanghai. We also
undertake a comprehensive comparison between what historical data predict and what
actually happened, not only in terms of Shanghai’s trade but also FDI as well as
international migration. This makes plain how a forecast of future trade growth that takes
as the starting point the year 1978 would vastly overestimate China’s future trade
performance. The current rates of growth may reflect a recovery to an underlying
“natural” level of globalization, but it is not itself a good indicator of that level.6
We also show that in some respects there is a great deal of continuity over time. For
example, the value of trade per capita in Shanghai during the treaty port era was
comparable to its level as recently as in the year 2000. As a fraction of China’s net foreign
trade, Shanghai today accounts for only slightly less than it did during the treaty port era
(13%, versus 20%). In addition, the fraction of Shanghai’s exports that are produced
elsewhere in China—that is, re‐exports through Shanghai—was about 60% both for the
years 1870 to 1930 and 1990 to 2009, showing that Shanghai retains much of its historical
role as a hub for China’s overall trade.
Our analysis clarifies the long‐run impact of temporary trade policies. While
Shanghai was among the regions hardest hit by the highly restrictive foreign economic
policies of the early planned economy regime, we show that Shanghai in many respects has
reclaimed its historical position since the 1978 reforms. This attests to the resilience of the
Shanghai economy and suggests that temporary policies are unlikely to overcome regional
6 This paper is not the first to take a longer view on China’s recent economic reforms. Keller and Shiue (2007), e.g., have noted that the degree of regional market integration in the 18th century is highly correlated with today’s income per capita across provinces.

5
fundamentals that are reinforced by foreign trade.7 A complementary interpretation is that
the institutional basis of Shanghai’s strong position that it attained during the treaty port
era was not fully wiped out during the years under the command and control economy.
The history of world trade essentially consists of the records left behind by port
cities in major economies: Alexandria, Istanbul, London, Rotterdam, New York, Kobe, and
Shanghai. Nearly all major cities in the world are still global trade hubs that connect
domestic economies to the world, but this function is largely ignored by existing studies.
Moreover, since there is a large amount of variation between regions within a large country
such as China, country‐level statistics may confound important issues, especially over long
time spans.8 Our approach unifies the viewpoints of urban economics, including ‘new’
economic geography, and international trade.9 Along these lines, it has been argued that in
order to understand the welfare effects of Chinese‐style industrial localization today one
needs a model in which external economies of scale at the national level are embedded in a
wider international trading system (Krugman 2009, 2010). This paper provides crucial
evidence on such domestic‐international links, based on comprehensive records on
Shanghai’s trade with other Chinese ports and foreign countries.10
Very little is known on how national localization advantages embedded in an
international trade system change as the traded goods, industrial structure, and world
incomes change over time. Re‐exports also feature prominently in the analysis of trade
intermediation and entrepôt trade (Feenstra and Hanson 2004, Ahn, Khandelwal, and Wei
2011, Antras and Costinot 2011). While Shanghai may have cost advantages in matching
buyers and sellers, Shanghai’s function as a hub appears to have had also dynamic
implications for production and growth of the city. Consistent with that, Shanghai’s
population share in China dramatically increased towards the end of the treaty port era,
7 See also Davis and Weinstein (2001) on Japan. 8 Similarly, given the size difference the question why China did not industrialize at the same time England did may be misleading (Pomeranz 2000). Shiue and Keller (2007) provide a more nuanced analysis. 9 The urban literature tends to look at cities as agglomeration economies within a country that is internationally isolated, while cities have typically no role in international trade, where the country is the spatial unit of analysis, see for example Glaeser and Gottlieb (2009) and Feenstra (2004), respectively. Ottaviano and Puga (1997) present an early survey of work on new economic geography. 10 For some analysis for the late 19th century, see also Keller, Li, and Shiue (2011b).
6
overall moving from around 0.07% in the year 1870 to around 1% in the year 2009.
Moreover, Shanghai’s involvement with foreign trade may thus have contributed to the
mobilization of resources in other Chinese regions since the 19th century trade
liberalization. We show below that China’s share in world GDP since the year 1870 is
closely related to the trade openness of Shanghai, in fact more so than to the trade
openness of China.
The remainder of the paper is as follows. The following section 2 gives a brief
historical account on Shanghai’s role in China’s trading system since the mid‐19th century.
Section 3 provides an overview of the data, most importantly of the 19th century source.
Empirical results are in section 4; in addition to analyzing foreign trade, this section
examines the evolution of bilateral trade partners, international migration (foreign
residents), and international capital movements in FDI to Shanghai. The final section 5
provides a concluding discussion.
2. Shanghai and the Foreign Trade of China
This section summarizes the role of Shanghai within the broader context of China’s foreign
trade since the 16th century. We will see that its special role today has emerged from
Shanghai’s unique geographical position together with foreign trade interests of other
countries during the 19th century. This section describes the main features while we turn
to the quantitative analysis in section 4.
At the conclusion of the Opium Wars, Shanghai was opened to Western trade as
stipulated in the Treaty of Nanjing on November 17, 1843.11 Before this time, Shanghai
was overshadowed by nearby administrative capital cities such as Suzhou, Hangzhou, and
Nanjing, and foreign trade was subject to restrictions and bans. As a result, China’s foreign
trade on the whole since the mid‐15th century was fairly restrictive.12 Shanghai’s foreign
trade consisted mainly of interactions with non‐Western areas—especially Korea, Japan 11 For more details on China’s trade opening in the 19th century, see Keller, Li, and Shiue (2011a) as well as the references cited therein. 12 Emperors for the most part avoided the business of trying to resolve conflicts between merchants. Not infrequently, imperial bans on foreign trade would follow as a measure to subdue a disorderly episode involving the loss of Chinese lives and property.
7
and the Nanyang (traders from Southeast Asia, the Arab Peninsula, Africa, and India).
Western goods, if they arrived in Shanghai, had to come by way of Guangzhou, since by a
decree of 1760, Guangzhou was the only Chinese port open to western traders.
Shanghai was one of a handful of Chinese ports selected by western countries to be
opened in the 1840s. The location was attractive because of its geographical position at the
mouth of the Yangzi River, with potential access to seafaring routes as well as the traffic on
the Yangzi River (see Map 1).13 This location of the city had long been considered
promising, for example by the British East India Company, which suggested already in the
year 1756 that a new factory—that is, a trading post—ought to be opened in Shanghai.
Within weeks of the official opening of Shanghai in 1843, no less than 11 foreign
firms had begun operating in the city (CMC 2001, v.159, 36), in anticipation of the profits to
be had from Shanghai. A high‐ranking British official, Sir John Davis, reported in 1844 that
Shanghai was the most promising of the newly opened Chinese ports and possessed all the
elements of commercial success (CMC 2001, v.159, 37).14 In fact, Shanghai’s trade growth
was initially disappointing and limited by the fact that foreign ships were not permitted to
go further along the Yangzi River to tap effectively into the trunk lines of the inland traffic,
which was where the source of China’s markets lay. The forced opening of further ports
inland on the Yangzi in the early 1860s partially improved western traders’ access to
internal markets. The city’s advantages as a bridge to the Western world was notable to
contemporaries. In the words of a Christian missionary: “if China is ever to be opened, if
the spirit of exclusiveness is ever to be effectually broken down, that process will begin
here. The rays will diverge from Shanghai”.15 In 1869, a newspaper, the NorthChina
Herald, would write:
13 The Yangzi is about 6,300 kilometers and the third‐longest river in the world. It starts in the Tibetan plains and flows towards Chongqing (Sichuan province), from where it flows another 2,400 kilometers before emptying into the East China Sea at Shanghai. On the booming domestic trade of the Yangzi River Valley, see Pomeranz and Topik (2005), p. 63. 14Davis was Governor of Hong Kong and British Plenipotentiary and Chief Superintendent of Trade. 15 Davis (1852). Christian missionaries were spread between Hong Kong, Fuzhou, Xiamen, and Shanghai.
8
“The heart of foreign trade is Shanghai, and the outports mere blood vessels.” (June 2, 1869; CMC 2001, v.159, 79).16
To assess the merits of this claim, the size and the structure of Shanghai’s foreign trade will
be detailed quantitatively in section 4 below. We now turn briefly to the institutional
structure in which this trade took place, which is important in its own right.
The British were officially permitted, in 1848, to establish a foreign settlement in
Shanghai. Separating the foreign population from the Chinese city was a solution the
Chinese government preferred over having the foreigners reside in the city itself. British
consuls and foreign merchants, on their part, also realized that the city lacked the means to
secure their goods. A section of wasteland less than a mile from the city and close to
anchorage points in the harbor was selected for the building of foreign residences and
warehouses. Outwardly, there were some similarities between the foreign settlement
policy of the treaty port era and the practice from 1760 to 1842 when European traders
were cordoned off in an enclave, and forced to reside within a specified location outside of
the city of Guangzhou. During the treaty port era, however, foreigners came to have a much
more active role in the wider economy than in earlier times, including not only hundreds of
firms but also banks and a shipyard, for example.
In addition to the right to trade, the British and later other Western nations
proclaimed other rights, including the right to own land and buildings (Willoughby 1920).
There they were able to build roads, factories, and housing all according to their own
preferences.17 Moreover, by the right of extraterritoriality, foreigners were subject not to
local but the laws governing their own lands. Although the Chinese were not permitted to
own property in the foreign settlement, they could and increasingly did, rent property in
the foreign settlements.
In the area of trade, the key organization created by Western countries was the
Imperial Maritime Customs service (after 1911, the Chinese Maritime Customs service, or
CMC). It was formed in the year 1854 by Western consuls because rebel forces of the Triad
16 By outports the writer means the other ports in China’s treaty port system; see below. 17 The American Settlement was established in 1863, forming with the British area the “International Settlement.” The French Settlement was independent of the International Settlement.

9
Society that merged later with the Taiping Rebellion put the official Qing customs house out
of action (Murphey 1977, 198). The Qing government had established customs stations
along the south coast to organize the collection of tariffs on both Chinese and foreign trade
in the late 17th century, and by 1730 Shanghai had taken over from Suzhou as the main
customs station of Jiangsu province.18 During the years 1853 and 1854 however these
customs duties went unpaid.
The CMC took charge of the collection of tariffs and duties on foreign trade, and it
also oversaw the increase in the number of the Chinese ports open to foreign trade, or
“treaty ports” (see Map 2 for their location).19 While the service was formally under the
Chinese Foreign Service it was de facto led by Western (initially mostly British) individuals.
Nevertheless, the CMC’s long‐time leader, Robert Hart, stressed that each member of the
CMC was “a paid agent of the Chinese government for the performance of specified work”.20
The CMC produced its flagship publication, the annual Report on Trade with detailed
figures on the trade at each treaty port from the year 1859 to the year 1948; we will rely on
it in section 4 below.
A juncture came for Shanghai in the year 1941 with the Japanese occupation. This
year marks the end of the treaty port era for Shanghai. The occupation was the final phase
of Japan’s colonization attempt of China that reached back to the First Sino‐Japanese War
(1894/95), intermittent warfare (1931‐37) and full‐scale invasion by Japan in 1937. Japan
was the one country that together with Britain had the most substantial interests in China
during the 19th century. Like Britain, Japan was interested in the potential market of China.
However, while British interests in China were spread between Shanghai and Hong Kong,
18 Notably, the imperial edict designated Shanghai a “superior” customs station for foreign commerce, an indication that Qing officials also recognized that Shanghai had potential to be profitable for trade. 19 For more on the CMC and the foreign presence in China, see Bickers (2006), van de Ven (2006), and Brunero (2006), as well as Keller, Li, and Shiue (2011a). 20 Circular No. 8 , June 21, 1864, by Robert Hart, “The Customs Service, the spirit that ought to animate it, the policy that ought to guide it, the duties it ought to perform; general considerations and special rules” in Documents illustrative of the Origin, Development, and Activities of the Chinese Customs Service, vol. 1 p. 36‐47. Murphey (1977) claims that the CMC “stood out among foreign groups in China as freer of special interest, exploitative behavior, or blind arrogance toward things Chinese,” p.198.
10
Japanese business interests were based primarily in Shanghai.21 In addition, Japan had
territorial designs on China, specifically in occupying Manchuria and Shandong.
In the years before, the 1911 revolution had ended the Qing Dynasty. The
Republican period from 1912‐1937 brought a temporary period of industrial expansion
and prosperity, as the industrialization of the 1920s was centered in Shanghai.22 One of the
foremost aims of the Nationalist Party (the Guomingdang) was to take back China’s national
sovereignty from foreign countries.23 The Nationalist regime, however, also acted in ways
that were fundamentally detrimental to private industries and by 1937, war with Japan,
government corruption, labor strikes, and the rise of the Communist Party of China (CPC)
had turned the tide in terms of China’s domestic politics. The Japanese invasion was
repelled in the context of Japan’s loss in World War II, while domestically the Chinese
Communist Party emerged victorious over the Nationalists when the civil war ended in
1949.
In the following, we summarize Shanghai’s evolution during the communist period.
The evolution of Shanghai’s trade for the period from 1949 until now can be broadly
divided into the years before and after the market reforms of 1978.24 Prior to this time, all
of Shanghai’s trade was held under central government control through state‐owned
Foreign Trade Companies (FTC’s), more tightly so for imports than for exports. Shanghai
was in the initial set of five former treaty port cities that was given permission to fulfill
exports according to central plan by the year 1956. Generally, heavy industry was favored
over the textile and light industries that were important in Shanghai (see Tian 1996, 11‐
19). The city was also required to remit large amounts of resources in order to support
21 The only Chinese port that may have rivaled Shanghai’s importance at the time was Hong Kong. The latter had become a British colony since 1842, with the consequence that imports from and exports to Hong Kong were counted as foreign trade from China’s point of view (which is the viewpoint of the CMC statistics). While Hong Kong remained nevertheless closely integrated with the Southern part of China’s economy, in Hong Kong there was no production comparable to the silk and tea production in areas near Shanghai, and not nearly the access to inland provinces as Shanghai had. As a consequence Hong Kong had much more the character of a transshipment point—entrepôt trade—than ever was the case for Shanghai. The role of Hong Kong as entrepôt for China’s trade is discussed in Keller, Li, and Shiue (2011a). 22 This is a period that Bergere (2009) calls the “golden age of Shanghai capitalism.” 23 In fact, China did regain tariff autonomy between 1929 and 1934. 24 For an overview of general developments in China, see Keller, Li, and Shiue (2011a). More details especially for the post‐1978 reform period can be found in Lardy (2002), Branstetter and Lardy (2008).
11
investments in the interior regions to reduce regional inequalities and make the interior
regions more economically self‐reliant. Shanghai’s exports were procured from provinces
according to central plan, and Shanghai’s share of total exports rose rapidly because of the
simultaneous expansion of the industrial output in China and the need to pay back loans
owed to the Soviet Union.25
China re‐established its relationships with Western countries soon after the Cultural
Revolution (1966 to 1970), which triggered a period of trade growth, in particular of
imports.26 During the 1970s, more and more regions of China were given permission to
export directly to foreign countries. This affected the share of Shanghai’s gross exports
relative to China’s total, not unlike to what had happened during the treaty port era with
the opening of additional treaty ports. We will return to Shanghai’s re‐exporting activity
and how its function as a hub has evolved over time below.
The liberalization of China’s foreign trade and investment regime followed on the
1978 decision of the CPC to reform.27 While Shanghai was not in the first batch of Special
Economic Zones of the year 1980—they were all located in Guangdong and Fujian
provinces—it was one of the 14 Coastal Port Cities in the year 1984. FDI, which was closed
during the early reign of the CPC, was once again welcomed as part of China’s reforms. As a
Coastal Port City, the goal for Shanghai was to attract capital investments and technology
transfers from foreign countries, as well as to help spur growth of the region, by means of
tax and profit incentives. In the early 1990’s the Pudong policy granted even more special
privileges than Special Economic Zones had to Shanghai and the nearby Pudong area.
Finally, a major step towards China’s international economic liberalization was taken when
China joined the World Trade Organization in the year 2001.
We conclude this overview with three observations. First, China is now relatively
accessible to foreign trade. In the year 2005, its average statutory tariff was 8.9%, not far
25 Tian (1996), 18. 26 Shanghai’s annual import growth between 1970 and 1975 was three times the annual growth during the years 1957 to 1970, see Tian (1996, 19). 27 The measures included the decentralization of the right to import and export to local areas, the loosening of controls on foreign exchange, and the use of tariffs, quotas and licenses in place of planned economy controls on imports and exports. See Lardy (2002).
12
in fact from the maximum of 5% that China was compelled to charge during the treaty port
era. Second, starting from 1999, foreign firms in China can be fully foreign‐owned—they
no longer have to form a joint venture with a Chinese company. This recent policy actually
corresponds to the policy during the treaty port era, when foreigners could establish
wholly foreign‐owned enterprises in China. Third, China’s regime today privileges firms
engaged in foreign trade and investment relative to firms that do not. Differential
treatment of firms, depending on whether it was engaged in foreign markets, might be seen
as a vestige of the treaty port era, when goods destined for export or foreign goods
imported into China were in effect given preferential treatment relative to domestic trade.
During the treaty port era, preference was given through the relatively efficient and
consistent CMC policy towards foreign goods (and Chinese goods destined for foreign
markets), and, through the payment of one relatively low duty on foreign goods, which
should serve to increase the incentives to trade. It thus appears that China’s trade and FDI
policies today are in some major ways similar to those that China had to follow under
pressure from Treaty Powers in the mid‐19th century.
The following section describes the data that will be used below.
3. Data The major source of information regarding trade of Shanghai and of China during the treaty
port era is the reports produced by the Chinese Maritime Customs organization (CMC for
short). We rely on the 170‐volume compilation of the annual Returns to Trade and other
Chinese Maritime Customs documents, cited as CMC (2001). The source covers the years
1859 to 1948 and contains information on (1) China’s exports and imports and (2)
Shanghai’s exports and re‐exports of Chinese goods, as well as imports and re‐exports of
foreign goods. All trade flows except re‐exports of foreign goods are available by foreign
partner country.
Information on Shanghai’s trade in the communist period from 1949 onwards
comes primarily from the Shanghai Statistical Yearbooks, cited as Shanghai YB (2010),
which we have accessed via China Data Online (http://chinadataonline.org/ ). Parallel to
the data available for the treaty port era, these yearbooks contain information on the

13
foreign trade of firms located in Shanghai proper (denoted local trade). This covers the
years 1953 to 2009 for exports and 1955 to 2009 for imports. They also have data on the
total trade through the Shanghai customs for the years 1990 to 2009 (denoted customs
trade). This contains foreign trade activity of firms located in Shanghai as well as firms
located elsewhere in China. We compute re‐exports as customs trade minus local trade.28
Trade data for China as a whole comes from China Statistical Yearbooks and China
Compendium of Statistics 19492008, compiled by Department of Comprehensive Statistics,
National Bureau of Statistics of China. These figures include trade using any mode of
transportation (including air).
Trade figures for the treaty port era are given in current values, typically Haiguan
Liang, but later also in (customs) dollars and gold denominated currency. We have
converted all values into U.S. dollars using exchanges rates given in CMC (2001) and Hsiao
(1974). The current U.S. dollar values are converted into constant 2006 U.S. dollars by
linking two series on U.S. inflation available from the NBER Macro History database
(http://www.nber.org/macrohistory/ ).29 These are also applied to the values on trade
during the communist period, which are given in 100 million current U.S. dollars.
The figures on trade of major countries other than China and on world trade comes
from Maddison (2001), the Groningen Growth and Development Centre of the University of
Groningen (www.ggdc.net), as well as the World Bank’s Development Indicators database.
Information on the number of residents by various foreign countries is available for the
years 1872, 1891, 1901, 1911, and 1921 (sources: CMC 1873 Vienna World Exhibition, as
well as CMC 2001, various volumes). The figures include men, women, and children, where
it is reasonable to believe the large majority were men. The figures do not include
temporary residents, such as seamen staying in the city between the arrival and departure
of their ship. During the modern period, foreign resident data is based on information on
visa requirements, and it is available in Shanghai YB (2010).
28 Customs trade also includes relatively small amounts of trade in form of foreign aid and gifts. 29 NBER Macro History Series m04051, from 1860 to 1939, and U.S. Consumer Price Index from the Bureau of Labor Statistics, from 1913 to 2009.

14
Data on the number of firms from various foreign countries in Shanghai for the
period 1872 to 1921 is available from the same sources as the foreign resident data. In the
early years, foreign firms mainly engaged in importing and exporting, whereas especially
after the turn of the 20th century they increasingly undertook manufacturing activities as
well. For the modern period we estimate the number of foreign firms in Shanghai for a
given foreign country by allocating the total number of foreign firms in proportion to the
value of foreign capital absorbed, which is available by foreign country for the years 1995
to 2009. Both data series come from the Shanghai Statistical Yearbooks. As an alternative,
we have also allocated the total number of foreign firms according to the number of
contracted FDI projects with each foreign country; this gives similar results.
Data on the Chinese population of Shanghai during the treaty port era comes from
CMC (2001) and Mitchell (1998). For the post‐1949 period it comes from the Shanghai
Statistical Yearbooks (Shanghai YB 2010). GDP of foreign countries is from the online
database of the Groningen Growth and Development Centre (GGDC, http://www.ggdc.net ),
University of Groningen. The GGDC database reports all GDP data consistently using the
1990 International Geary‐Khamis dollars. Historical GDP, if unavailable for a particular
year, is estimated using data on the years 1870 and 1913. GDP of these two years are
available for all countries in our sample. To estimate data for missing years, we compute
the growth rate of a given country's GDP during this 43‐year period and project its GDP for
years using this growth rate. Distance between countries is available from the website
www.searates.com. The website provides distance of ocean shipping in nautical miles
between Shanghai and the major ports in the countries included in the analysis below.
In the following section we present the results of this paper.
4. Empirical Analysis
In this section the main findings of this paper are presented. We begin by
summarizing the main consequences of the 19th century liberalization for China as a whole.
Next, we quantitatively assess the importance of Shanghai for China’s overall foreign
economic relations starting in the 19th century. This is followed by examining the evolution
15
of Shanghai’s foreign economic activity in terms of foreign imports, exports, re‐exports,
international migration and FDI. Our discussion covers both overall developments as well
as trends relative to individual foreign countries. Further, we examine the changing
pattern of Shanghai’s foreign economic activity by employing gravity regressions.
The analysis focuses on two issues. First, we are interested in how well Shanghai’s
foreign economic activity today can be understood by developments that were set in
motion with the 19th century liberalizations. Second, we want to better understand
Shanghai’s long‐run function in connecting the rest of China to the rest of the world. To
that end we conclude the section by comparing Shanghai’s importance relative to other
parts of China in the 19th versus the 21st century, and provide some evidence on how
Shanghai mattered for China’s growth in the world economy.
4.1 China’s Trade Opening in the 19th Century
China’s trade opening in the 19th century, as noted above, was the consequence of the First
Opium War which concluded with the Treaty of Nanjing of the year 1842. Although there
are no complete records of China’s foreign trade at that time, we have information on the
trade of individual countries with China before and after 1842. In Figure 1 we show the
value of China’s imports from Britain between 1828 and 1860. Two points stand out. First,
there is an increase in trade after 1842, immediately following the opening of additional
ports (including Shanghai). This however was reversed in the early 1850s. The second
instance of trade growth, starting around 1854, is more substantial. The most plausible
explanation for this is the Western‐led Chinese Maritime Customs (CMC) service, which
was founded in 1854 to take over China’s customs system from the imperial authorities
(see section 2).
While the level of China’s foreign trade in the 1860s was several times its level in the
1830s, the growth of China’s foreign trade in the initial decades of the treaty port era was
not particularly high. As Figure 2 shows, only after the year 1885—a period of general
commercial expansion and the absence of wars in the U.S. and Europe—does one see
additional and sustained growth in China’s foreign trade. Also notice that China typically
ran a trade deficit versus the rest of the world during this period.
16
It is interesting to see how China’s trade at the time compared to other countries in
the world. Table 1 presents the shares for China and five other countries in foreign trade,
starting with the year 1870. In that year, China’s share of world exports was 2.78%. This
value is considerably larger than that of Japan, which opened just about at that time to
foreign trade. At the same time, China’s share in world trade is much smaller than India’s,
which traded relatively more as part of the British Empire. The relatively high shares for
the three Western countries, among them the United Kingdom with almost a quarter of
world exports, are mainly due to the fact that these countries had already begun their
process of industrialization. In Table 1 on the right, one notes that in the year 2008 China
is the world’s largest exporter with close to 10%, followed by Germany and the U.S.
Table 2 shows how the countries compared in terms of GDP over time. Note that
China’s share in world GDP in 1870 was around 17%, very similar to its share in the year
2008. India’s GDP share has evolved in a similar but less pronounced U‐shaped pattern.
The share of the U.S. in world GDP peaked around the year 1950, around the same time
China’s share reached its low point of about 4.5%. Japan’s share in world GDP peaked
around the year 1990, at 8.5% according to Table 2. The population shares of these
countries have evolved over time, with less dramatic swings than either GDP or export
shares (Table 3).
We also show two measures of trade openness over time for these countries, namely
exports to GDP (Table 4) and exports per capita (Table 5). While for some countries there
are major differences between these, such as Britain for which exports relative to GDP has
increased whereas exports per capita has declined, in the case of China the two measures
tell a similar story: openness bottomed out around the year 1970 before increasing to its
historically highest value today. We will return to these developments in section 4.8 below.
After this first look at China’s foreign trade during the treaty port era, we now turn
to quantifying Shanghai’s role in this.
17
4.2 Shanghai’s Role in the Foreign Trade of China
In the following we take a first step at pinning down Shanghai’s position for China’s foreign
trade more precisely. Figure 3 shows the development of exports in China and Shanghai
between the years 1870 and the most recent year for which data are available, 2009.30 We
choose the year 1870 as our initial year in part because by that time the treaty port of
Shanghai had been up and running for more than two decades, so that the observed growth
of trade is not mainly a start‐up phenomenon. Even though the years 1932 to 1952 are
omitted from the analysis because of unavailability of comparable data, we know that
foreign trade severely contracted during this period, essentially extending the downward
trend that is visible in the figure from 1925 onwards.31
We first note that China’s and Shanghai’s exports have evolved similarly over this
period of nearly one and a half centuries. Figure 4 shows the analogous developments for
imports over the period of 1870 to 2009.32 Also here, there is a broad congruence in how
foreign imports of China and Shanghai have changed over time.
The figures also confirm a number of factors that we have noted in section 2 above.
First, there is the relatively fast growth in exports in the 1950s, mainly due to trade with
the Soviet Union, which is not present for imports. Second, while during the period from
1960 to 1980 China’s growth in exports and imports was comparable to that of the treaty
port era, after 1980, the growth of trade has accelerated. During the treaty port era,
China’s exports grew annually at about 1.9% per year, faster than Shanghai’s exports which
grew at a rate of 1.1% per year (Figure 3). China’s exports surpassed the level of exports
projected with the treaty port era trend by the year 1975, whereas Shanghai’s exports
already in 1960 were well above what would have been expected based on the treaty port
trend. This is consistent with the idea that Shanghai was particularly important for
30 Figure 3 shows log exports of Chinese‐(respectively, Shanghai‐) produced goods to foreign countries; other trade flows will be discussed below. 31 These factors included the Great Depression, Japan’s invasion of China, World War II, and the restrictive stance on foreign trade put in place by China’s government. 32 Shown in Figure 4 is (the log of) China’s imports of foreign‐produced goods, as well as imports of foreign‐produced goods that stayed in Shanghai (net foreign imports).

18
achieving China’s export goals in the early post‐World War II period. Shanghai’s imports
during the treaty port era grew noticeably faster than China’s imports (3.6% versus 2.3%,
see Figure 4). Third, projecting Shanghai’s level of imports from the treaty port era shows
that its level was actually surpassed only around the year 2000. This is in part due to
Shanghai’s low levels of imports in the early years of communist rule that was noted above.
Turning to the post‐World War II developments, before the year 1990 China’s
exports had grown faster than Shanghai’s, with 6.8% per year compared to Shanghai’s
4.8% per year. China’s trade during the last two decades has grown exceptionally fast, due
to a number of well‐known factors—including reductions in trade barriers, new
information and communication technologies and offshoring, together with income growth.
The rise in Shanghai’s exports has outpaced that of China’s (close to 15%, compared to
13%, respectively). This suggests that recent changes in world trade have been
particularly beneficial for Shanghai as an exporter. In terms of imports, Shanghai grew
faster than China throughout the post‐WWII period. While in the 1970s and 1980s this
might have been in part because Shanghai recovered from depressed levels during the first
decades of the communist reign, the figure shows that the relatively high rate of import
growth for Shanghai continued in recent years (an annual rate of 19% per year since the
year 1990).
Today Shanghai accounts for almost 15% of China’s imports and exports. The fact
that a city with about 1% of China’s population accounts for close to 15% of China’s foreign
trade is in itself quite remarkable. Moreover, to the extent that China’s high GDP growth is
currently fueled by foreign trade, Shanghai is surely important for rising economic welfare
in China as a whole. Nevertheless, Shanghai’s role for China’s development would still be
underestimated. A closer look at Shanghai’s involvement in foreign trade during the treaty
port era shows why.
In fact, Shanghai accounted for roughly half of China’s foreign trade between the
years 1870 and 1930. On average, the import share of Shanghai was about 55% while its

19
export share was around 45%.33 In contrast to what is shown in Figures 3 and 4, these
numbers are gross in the sense that they include re‐exports. As such, they measure the
activity at the port of Shanghai. On the export side, they include goods shipped through
Shanghai that were produced elsewhere in China, while on the import side they include
foreign goods that are sent from Shanghai onwards to other Chinese regions.34
Figure 5 shows how Shanghai’s import and export shares have changed over time.
The import share falls from above 70% in 1870 to around 40% in 1910 before climbing
back to over 50% by the year 1930. On the export side, Shanghai’s share was highest in the
early years, about 50% from 1895 to 1915, and then falling to around 35% by the year
1930.
Why is the share of Shanghai in China’s exports falling over this period? One reason
is the expansion of the treaty port system. The number of ports open to foreign trade was
increasing over time. For regions far away from Shanghai, exports were less likely to go
through Shanghai before being shipped to a foreign country, which tends to reduce
Shanghai’s share in China’s total exports. Because the same logic applies to the import
share, this makes it more significant that the import share actually rose from around 40%
to more than 50% between the years 1910 and 1930. The increase in import share reflects
the increase in Shanghai’s consumption of foreign goods, which is due to Shanghai’s
growing size and income relative to other parts of China.
The notion that Shanghai was the “heart” of foreign trade of China during the treaty
port era (see the quote above), captures the idea that Shanghai was key for all of China’s
foreign trade. In order to assess Shanghai’s role for China it is crucial to include not only
33 China’s foreign trade refers to the trade in the CMC statistics; this excludes Hong Kong and the small amount of foreign trade that was not recorded by the CMC, see Keller, Li, and Shiue (2011b) for a discussion. 34 One particularly noteworthy aspect of the data collected by the CMC is that it captures re‐exports with great detail. This has been a frequent source of misunderstanding, and some observers have erroneously concluded that the CMC statistics massively overstate the actual trade that took place. For example, Murphey (1977) argues that by tracing the same goods as they are imported in Shanghai, then re‐exported from Shanghai (to Tientsin), then imported by Tientsin (from Shanghai), and finally exported from Tientsin to some location of final demand, the CMC data would create a “statistical illusion” by “quadruple counting”; he then concludes that “the recorded figures probably inflated the real import and export of goods by close to 100 percent,” pp. 213‐214. In fact, there is neither double‐counting nor quadruple‐counting in the CMC trade data. The records do however, allow gross trade flows and net trade flows to be distinguished.

20
Shanghai’s net trade, but also its gross trade. The latter is paramount for gauging the
contribution of the trade at Shanghai for mobilizing other regions of China. We will turn to
this in the next section, before moving from trade to other aspects of international
economic activity such as foreign direct investment and international migration.
4.3 Shanghai’s Exports, Imports, and Reexports of Foreign Trade
We have just shown that during the treaty port era Shanghai was very active in connecting
foreign markets with China’s hinterland, both by re‐exporting Chinese goods abroad and by
re‐exporting foreign imports to other regions of China. Here we describe some key aspects
of this trade in more detail.
Shanghai’s Foreign Exports To begin with, consider the exports of Shanghai that are destined to foreign countries;
these trade flows are typically called foreign exports. While a negligible portion of these
exports are produced in foreign countries—during the treaty port era mostly in Japan—the
large majority of these goods are produced in China. Among these China‐produced goods
destined for foreign markets, one part is produced in Shanghai while another is produced
outside of Shanghai (but still in China). For the latter set of goods, Shanghai serves solely
as the transshipment point, and from the point of view of Shanghai this trade is a re‐export.
In contrast, the former goods are exports in the typical sense of the word—produced in
Shanghai and shipped from there to foreign countries.35
A natural question is the importance of these re‐exports compared with exports of
goods produced in Shanghai, and how it has changed over time. There is consistent
information to examine this question both during the treaty port era (years 1870 to 1925)
as well as for the last twenty years (1990 to 2009). During the treaty port era the re‐
exports share in Shanghai’s total foreign exports was, with 58%, more than half, as shown
in Figure 6A on the left. Interestingly, the share of re‐exports in Shanghai’s foreign exports
between the years 1990 and 2009 is almost exactly the same (56%), as shown on the right
in Figure 6A. This continuity is striking. Relatively little is known on the determinants of
35 Produced in Shanghai here means in the greater Shanghai area. The exact location of production is unknown to us, but for the good to be counted as export rather than re‐export, the location must be closer to the port of Shanghai than to any other open port.
21
such re‐export activity.36 But from Figure 6A it is clear that vast changes in the nature of
the traded goods, the general economic conditions in Shanghai, China, and overseas, the
number of open ports, and also political factors do not need to affect the extent to which a
particular port specializes in re‐exporting goods for other regions.37
Another question is whether after China’s mid‐19th century trade liberalization and
its late 20th century trade liberalization the relative importance of re‐exports held steady or
changed with the passing of time since the liberalization. For the treaty port era we see in
Figure 6B that re‐exports grew at a higher rate than exports, with an annual rate of 2.7%
versus 1.6%. While during the period of 1990 to 2009 the export growth rates were much
higher, also here Shanghai’s re‐exports grow at a higher rate than its exports, with about
20% versus 17% (see Figure 6C). We conclude that in both trade liberalizations, although
some 100 years apart, Shanghai’s indirect contribution in form of exporting non‐local
Chinese goods was larger than Shanghai’s direct contribution by exporting locally
produced goods, and the indirect effect also grew relative to the direct effect after the time
of liberalization.
Shanghai’s Foreign Imports Shanghai imported foreign goods almost exclusively from foreign countries.38 These goods
were either re‐exported to other foreign countries (small amounts), or they were re‐
exported to other Chinese regions, or they were locally consumed. Here we focus on
foreign imports that were locally consumed (net foreign imports) and on re‐exports to
other Chinese areas.
Figure 7A shows that on average during the treaty port years of 1870 to 1925,
almost 60% of the foreign imports arriving at Shanghai were re‐exported to other Chinese
regions, while 40% stayed for final consumption in Shanghai. In contrast, in the last two
decades, around 70% of foreign imports remained in Shanghai, and only around 30% were
36 While this trade shares some features with entrepôt trade, such as that at Hong Kong (Keller, Li, and Shiue 2011a, Feenstra and Hanson 2004), little is known on how far the similarities go. 37 For the year 1956, Tian (1995, 86) reports 52% for the re‐export share in Shanghai; it is not entirely clear that the figures are comparable though. 38 In contrast, other treaty ports imported foreign goods in significant number also from Chinese treaty ports, in particular from Shanghai.

22
re‐exported to other Chinese regions. That is, while on the export side the share of re‐
exports was similar in the earlier and the recent period, on the import side re‐exports have
generally lost in importance relative to net foreign imports to Shanghai. If we think of re‐
exporting as arising from the specialization of trade intermediaries in matching buyers and
sellers, then these findings suggest that the search costs of foreign sellers to China relative
to the intermediaries in Shanghai have fallen over time, while there is no decline in search
costs relative to Shanghai intermediaries for Chinese sellers to foreign markets.
How about changes in the extent of re‐exporting foreign imports over time? During
the treaty port years, while re‐exports have initially a higher level they grow slower than
net foreign imports (1.3% versus 3.7% per year, Figure 7B). The difference in these trends
is qualitatively the same in recent years, with re‐exports growing at a lower rate than net
foreign imports (Figure 7C). In the aftermath of both the 19th century and the 20th century
trade liberalization Shanghai’s re‐exports of exports grow faster than local exports, while
the re‐exports of imports grow slower than net foreign imports. One possibility is that on
the export side the developed port infrastructure of Shanghai always triggers relatively fast
export growth from other Chinese regions. At the same time, the growing population and
income of Shanghai that goes hand in hand with the developed port infrastructure means
that an increasing fraction of Shanghai’s total foreign imports will be consumed in the city
itself.
We now turn to the bilateral trade pattern of Shanghai.
4.4 Shanghai’s Bilateral Trade
In this section the composition of trade at Shanghai across foreign countries, and how that
has changed over time, will be considered. We first discuss foreign imports.39
Shanghai’s Import Composition
During the late 19th century, Shanghai imported mostly from Britain and its colonies. Figure
8A shows the top 5 sources of imports for the years 1870 to 1900; 37% of Shanghai’s
imports came from Britain proper, 27% from India and 16% from Hong Kong, making for a
39 The following are figures on gross imports from foreign countries; we have more bilateral information on gross rather than net imports.

23
total of 80% from possessions of the British Empire. Compared with China as a whole,
Hong Kong plays a smaller role for Shanghai’s imports; this is likely due to the fact that
Hong Kong and Shanghai were alternative entry ways for imports to China.40
Other significant sources of imports were the U.S. and Japan. Note that foreign trade
at the time was highly concentrated in the sense that all countries outside the top 5 import
sources of Shanghai at the time accounted only for 8% of its imports. This degree of
concentration follows from the relatively high degree of income inequality across countries
at the time—only 100 years after the first country had begun its industrialization—which
implied that only relatively few countries had the technological capacity as well as the
resources to engage in large‐scale foreign trade.
The top five sources of Shanghai’s imports for the years 1990 to 2009 are shown in
Figure 8B. Not only Britain but also its former colonies are absent in this figure, which
strongly suggests that Britain’s late 19th century role in Shanghai had been driven to some
extent by its early industrialization and successful empire‐building. Some continuity is
preserved through the major roles of Japan (21%) and the USA (12%), which in the 19th
century were ranked 4th and 5th, respectively. Other major sources of imports in Shanghai
today include, with Taiwan and the Republic of Korea, two of the so‐called “Asian Tigers” of
the 1980s. Note that the top‐five countries now account for much less of Shanghai’s
imports than in the 19th century (62%, versus 92%).
Figure 8C gives a direct comparison of Shanghai’s import shares for virtually all
economies that were significant sources in the late 19th century.41 The shares of
Continental Europe, Japan, and the United States have strongly increased at the expense of
Britain and its former colonies.42 At the same time, relatively nearby countries like
Australia, Thailand, and the Philippines now take a sizable share of Shanghai’s trade.
40 See also Table 1 in Keller, Li, and Shiue (2011a). 41 Continental Europe in the 19th century means mostly France, followed by Germany and Italy; in the modern period, we compute it as trade with Europe less Britain. There is no data for 1990‐2009 on imports from India, but it is reasonable to assume that the amounts are small as shown. 42 Singapore is an interesting special case of a British colony whose share of trade has increased over time. In the CMC statistics this is Singapore Straits, a British crown colony consisting of Singapore, Penang, and

24
Shanghai’s Export Composition
The major export destination for Shanghai in the late 19th century was Continental Europe,
with 45% (see Figure 9A). Britain accounted for 24% of Shanghai’s exports, followed by
the USA and Japan with 12% and 10%, respectively. These economies held more than 90%
of Shanghai’s exports during the years 1870 to 1900.
In the recent past, the U.S. and Japan have each accounted for 21% of Shanghai’s
exports, followed by Hong Kong with 13% (Figure 9B). Among the European countries,
Germany now receives about 4% of Shanghai’s exports, whereas Britain and France are not
in the top five Shanghai export destinations anymore (each receives about 2% of
Shanghai’s exports). As in the case of imports, non‐top 5 exporters account for about 38%
of Shanghai’s trade, indicating that the set of countries with which Shanghai trades has
become much larger over time. Figure 9C shows the change in export composition in direct
comparison. Mostly trade shares have been reallocated away from Europe and in favor of
the USA, Japan, as well as a number of smaller but geographically closer economies.
In sum, the composition of Shanghai’s trade, both historically and today, captures a
number of aspects including market size and geographic location, with the latter becoming
more important over time. We will return to this in our gravity equation analysis below.
The following section discusses current levels of the bilateral trade of Shanghai in the light
of the trade liberalization during the treaty port era.
The Evolution of Shanghai’s Bilateral Imports
In this section we consider the following scenario. Suppose that there would have been a
forecaster living in the year 1900, trying to predict Shanghai’s imports from Britain today.
The forecaster was naïve, which is to say that she knew nothing other than the levels of
Shanghai’s imports from Britain between the years 1870 and 1900. What would that
forecaster’s prediction have been for Shanghai’s imports from Britain today? In hindsight it
is clear that the forecaster’s task was not an easy one, as she was not aware of the fall of the
Qing dynasty, two world wars, Japanese invasion, the Great Depression, and the restrictive
Malacca. Its share may have increased over time as shown in the figure because we sum Shanghai’s imports from Singapore and Malaysia, which is likely somewhat of an overestimate.

25
trade policy during the early years under the CPC government, as well as the opening in the
years after 1978. Neither did the forecaster know about the growth of world incomes,
falling trade costs, vertical specialization and offshoring, which also affect the level of trade
that we see today.
It turns out that the forecaster would have gotten today’s level of imports almost
exactly right. To be precise, she would have predicted the level that was actually reached in
the year 2000, see Figure 10A. Britain’s exports to Shanghai during 1870 to 1900 did not
grow much, but their levels were relatively high (37% of Shanghai’s total imports, see
Figure 8A above). Conversely, in recent years Shanghai’s imports from Britain have grown
at a rate of about 12%, but the level of trade had to be built up from its collapse after the
year 1930. Together this means that Shanghai’s imports from Britain today are quite close
to what a simple forecast from the treaty port era would give.
At the same time, a backward projection using today’s imports to tell us the level of
historical imports would be far off, as Figure 10A indicates as well. The current rate of
growth of imports from Britain is high by historical standards, suggesting that one should
not expect it to last for very long.
In the following, we will employ this forecasting scenario to assess the evolution of
Shanghai’s trade over time also for other countries. In the case of imports from Continental
European countries, a somewhat different picture emerges (see Figure 10B). Shanghai’s
imports from these countries during the late 19th century grew at about 8% per year, which
leaves the projected value using the treaty port era trend considerably above the actual
value of imports today. At the same time, currently Shanghai’s imports from Continental
Europe grow at about 13%, higher than the historical trend, and for this reason the naïve
forecasting rule would yield roughly the year 2075 in which Shanghai’s projected imports
from the treaty port era will equal its actual imports from Continental Europe. A similar
calculation for Japan yields virtually today (the year 2015, to be exact, see Figure 10C),
while for the U.S. we obtain the year 2234 (Figure 10D). The later dates for Western
countries reflect the higher growth rates of trade during the treaty port era, which itself is
26
due to the fact that Western countries, having industrialized, could provide more advanced
products than Japan at the time.
The Evolution of Shanghai’s Bilateral Exports
On the export side, Shanghai’s trade during the treaty port era grew slower than on the
import side overall (recall Figures 3 and 4 above). The relatively slow growth of trade is
largely due to trade to Britain, which fell substantially between the years 1870 to 1900, see
Figure 11. While exports to Britain in fact grew slowly if at all, the stark pattern in the
figure is mainly a reflection of the fact that London’s role as entrepôt in Europe for trade
with China was diminished over time. Goods from Shanghai were increasingly shipped
directly to Amsterdam, Hamburg, and other European ports whereas before they had been
destined to London first before being re‐shipped to their ports of final destination. If we
add Shanghai’s exports to Britain and Continental Europe, it is essentially flat over the
period of 1870 to 1900.
The U.S. is a country where such entrepôt trade matters much less. During the treaty
port era, Shanghai’s exports to the USA grew at around 6% per year (see Figure 12A). Since
1972, the year from which we have data, Shanghai’s exports to the USA have grown at a
much higher rate (around 16%). However, given the level of Shanghai’s exports to the USA
during the treaty port era, the actual exports in 2009 amounted only to about 40% of the
projected exports using the historical trend of Shanghai’s exports to the USA. Another
interesting case is Japan. During the years 1870 to 1900, Shanghai’s exports to Japan grew
at a higher rate than after World War II (see Figure 12B), so that, technically speaking, the
naïve forecasting rule would yield infinity as the time at which actual exports would equal
the exports projected with the treaty port era trend.
Overall, our forecaster would typically overestimate today’s bilateral exports of
Shanghai. The Western countries in particular had relatively high GDP and experienced fast
growth during the treaty port era, which meant a high growth rate of imports from
Shanghai. If this growth rate is projected over a century then today’s trade is
overestimated. This is consistent with the idea that, seen from the viewpoint of Shanghai,
China’s trade today is not extraordinary.

27
It may be the case that our forecasting model is too simple. We therefore examine in
the next section whether Shanghai’s trade, today and in the past, follows across countries
the typical patterns predicted by the gravity equation of trade.
Shanghai’s Trade and Gravity We use the gravity equation of trade to examine Shanghai’s bilateral trade with foreign
countries, both during the treaty port era and in recent years. The use of the gravity
equation is here compelling for two reasons. First, the gravity equation is a good
benchmark for trade. Not only is the gravity equation usually highly successful in
explaining bilateral trade in a statistical sense (with R2’s upwards of 0.70 the norm), it is
also well‐known that many micro‐founded trade models imply the gravity equation.43
Second, the gravity equation allows us to directly investigate if Shanghai’s bilateral trade
patterns during the treaty port era were unusual. The fact that trade treaties were
imposed upon China may give rise to doubts as to whether a model of trade based on
voluntary exchange can fit the data.
The gravity equation of trade is, in its simplest form,
(1) a ba ,b
ab
GDP GDPTRADE
DIST
,
where a and b are two trading economies, TRADE is either bilateral exports or imports,
GDP is gross domestic product, and DIST is shipping distance. In its usual log regression
form, it is
(2) 'ab a b ab ab ablnTRADE lnGDP lnGDP lnDIST X ,
where X refers to a set of control variables, and εab is a regression error. The expected signs
of coefficients are ˆ 0 , ˆ 0 , and ˆ 0 .
Here, economy a is a particular trade partner of Shanghai, and economy b is
Shanghai. Our gravity regression also has a time dimension: a pair of trade partners
presents itself multiple times over years. We have data on years 1869 to 1904 (the History
sample) and 1953 to 2009 (the Modern sample). To reduce problems arising from 43 See Anderson (2010) for a review of the literature.

28
autocorrelation, we use five‐year averages of the data. Since data on Shanghai's GDP for
much of our sample period are unavailable, we use population instead. Population is the
most natural replacement because GDP and population are interchangeable in measuring
the size of an economy in many theories that provide micro‐foundations for the gravity
equation.
As Shanghai's trade partners we have the following countries: Continental Europe,
Egypt, Hong Kong, Japan, Philippines, Singapore, Thailand, and United States.44 Among
those, Hong Kong and Singapore were major entrepôts, with unusually voluminous inflows
and outflows of goods that are transshipments rather than goods locally consumed or
manufactured. To control for these peculiarities, we include a dummy variable specifically
for Hong Kong and Singapore.
We first run the gravity regression using data on the treaty port era. Results are
reported in columns 1‐2 of Table 6. There are positive coefficients on the GDP of trade
partners and negative coefficients on shipping distance, while the population variable does
not enter significantly.45 Notably, the coefficients of GDP and distance are both around one,
a finding that is in line with results reported in studies using a wide range of data sources.46
This provides additional evidence for the generality of the gravity equation, considering
that the treaty port era was more than a century ago and was initiated by China's defeat in
the Opium War.47
Next, we run gravity regressions using the same set of countries but with modern
data. Here, “modern” refers to the era starting after 1949, when the CPC took control of
mainland China and established a new government.48 The new government abolished all
44 Trade here is net not gross trade of Shanghai because data including re‐exports become available only after 1990, which would reduce our “modern” sample. 45 The latter may be because the sample has quite limited variation in terms of population, with only Shanghai. Also, we considered including time fixed effects, which are, however, highly collinear with the Population variable. 46 See Chaney (2011) for a review on the coefficient estimates of the gravity equation. 47 The gravity equation in a historical context is applied by Estevadeordal, Frantz, and Taylor (2003) as well as Jacks and Pendakur (2010), for example. 48 Data on the years 1949‐1952 are unavailable, such that the modern time in our analysis actually starts with the year 1953.

29
the trade treaties with Western powers. What interests us is the connection between the
historical and modern gravity regressions.
To ensure comparability between historical and modern‐time gravity regressions,
we use, as before, five‐year averages, Shanghai's population in place of its GDP, and the
entrepôt dummy variable. Columns 3 and 4 in Table 6 report the results. The modern
gravity regression results differ from the historical ones in a number of ways. First, the
GDP of trade partners now has coefficients smaller in magnitude, in part because Western
countries in the sample become less dominant than in the treaty port era. In other words,
China currently trades with a more diversified set of countries than it did in the past (recall
Figures 8 and 9).49
Second, Shanghai's population in the modern gravity regression has a positive and
significant coefficient, consistent with results in the literature. Third, the coefficient of
distance becomes smaller in absolute value, which is different from the common belief that
the effect of distance on trade remains stable over time (e.g., Leamer and Levinsohn 1995).
Fourth, the entrepôt dummy has a much smaller coefficient. Singapore and Hong Kong
underwent rapid industrialization after World War II,50 and they became independent from
Britain in 1963 and 1997, respectively. Such changes have likely reduced the
transshipments through these entrepôts.51 Finally, note that the gravity regression for the
treaty port sample has an R2 around 0.85, whereas for the modern period the R2 is lower,
around 0.70. Thus, income and distance variation across countries determines the volume
of Shanghai’s bilateral trade. Not only is this relationship just as expected, but the effect is
even stronger in the historical than in the modern sample.
The modern time is a six‐decade period, during which Shanghai, China, and the
world changed in dramatic ways. In particular, in 1978, China began its transition to a
market economy; in 1984, Shanghai was designated by China's central government as a
Coastal Port City which was given flexible regulations, business‐friendly policies, and trade‐ 49 This effect is actually underestimated in Table 6, because only Shanghai's trade partners in the treaty port era are included in the regression. 50 They are two out of the four "Asian Tigers"; the other two are Taiwan and South Korea. 51 Also, Feenstra and Hanson (2004) find that starting from the 1990s, Chinese products made in regions that are far from Hong Kong are less re‐exported via Hong Kong.

30
promotion measures (see section 2). To account for these structural changes, we
specifically examine the post‐1978 and post‐1984 periods in Table 7. Several of the
aforementioned changes to the gravity regression become more pronounced in Table 7.
Notably, population now has a sizable coefficient, which may be due to slow population
growth following the nationwide enforcement of the one‐child policy,52 as well as the
contemporaneous rapid trade growth.
As above, we again want to know how history predicts modern trade. Our focus
now, however, is on the bilateral trade pattern. To this end, we plug modern country
characteristics into the historical gravity equation (columns 1 and 2 in Table 6), and then
compare actual patterns with the projected bilateral trade patterns. The comparison will
demonstrate how far modern trade patterns deviate from historical ones.
The results are reported in Figure 13. The upper and lower rows of the figure
correspond to exports and imports, respectively. Diagonals in all the graphs of Figure 13
are 45‐degree lines, any point on which denotes a perfect match between projected
(horizontal) and actual (vertical axis) trade volumes. Column 1 of Figure 13 shows
projected export and import patterns in 1904, the latest year with available historical
bilateral trade data. This column serves as a benchmark, given that the projected pattern,
by construction, fits well the actual pattern. Column 2 of Figure 13 does the projection and
comparison using data on the year 1974, 70 years after 1904. The projected exports are
similar to the actual volume, while the projected imports are higher than the actual volume.
This contrast is most likely politically driven by the Cultural Revolution and state planning.
Column 3 of Figure 13 does the projection and comparison using data on the year
2004, 30 years after 1974, and three years after China's accession into the World Trade
Organization in 2001. Now, the projected exports are slightly lower than the actual
volume, while the projected imports are quite close to the actual volume. Exceptions are
Singapore and Hong Kong, which are as discussed above, economies with fading roles as
entrepôts. Column 4 uses data on 2009, the latest year with available bilateral trade data,
52 The annual growth rate of Shanghai's population between 1984 and 2009 is approximately 0.6% on average.

31
when the pattern shown in column 3 becomes clearer still. Projected exports further
deviate from the actual volume, while projected imports are close to the actual volume. In
sum, the cross‐sectional pattern of Shanghai’s trade during the treaty port era as pinned
down by a gravity equation fits quite well the recent past.
Another measure of foreign economic integration is the movement of people, to
which we turn now.
4.5 International Migration: Foreign Residents in Shanghai
The relationship between international migration and other aspects of economic
integration is multi‐faceted. Research has emphasized that international labor movements
might be complementary to trade in that migration prepares the ground for international
trade relations (Poole 2010, Cristea 2011). It could be merchants following their goods or
meeting buyers. Alternatively, migration might substitute for trade because it relocates
factors of production that otherwise might have been traded embodied in goods
(Heckscher 1919, Ohlin 1933). Migration may also benefit the international flow of ideas
and innovation (Hovhannisyan and Keller 2011). The motives for migration might be
different during the treaty port era compared to today. In addition, international migration
may or may not be associated with the operation of multinational firms, a topic that will be
discussed in the next section.
There is information on the number of foreign residents for two time periods, the
years 1872 to 1921, and the years 2000 to 2009. During the roughly five decades between
1872 and 1921, the great majority of foreigners in Shanghai were nationals of the treaty
powers. The largest groups were Japanese (29%) and British (28%), respectively, followed
by 10% US American, 7% German, and 4% French, see Figure 14A. During these treaty port
era years, about 22% of foreign residents came from countries outside the top‐5 origins.53
A somewhat different picture emerges for the period from 2000 to 2009 (Figure
14B). First, the distribution of foreign residents in Shanghai has become more dispersed,
with almost half coming from countries not ranking in the top‐5 origins. Second, while
53 Russia became a major source of foreign residents especially in the Northern Chinese cities.
32
Japan, the USA, and France are again among the top‐5 sources, Britain and Germany are
replaced by two more geographically proximate countries, Singapore and South Korea
(Republic of Korea). This suggests that the 19th century pattern was more affected by
income and less by geography than the early 21st century pattern. Figure 14C shows the
change in the relative importance of residents from the major sources during the treaty
port era; the decline in the relative importance of British nationals is striking.
In addition to the composition, we are interested in the level and growth in the
number of foreign residents. To begin with, the total number of foreign residents in
Shanghai in the year 1872 was 2,074, of which 319 where U.S. American. For comparison,
in San Francisco there were 73,719 foreign‐born people in the year 1870, out of which
11,729 were from China.54 Thus the number of Chinese in a major U.S. city in the late 19th
century was about 35 times the number of U.S. Americans in Shanghai, the most
international Chinese city (outside of Hong Kong). The main reason for this difference in
the level of migrants presumably was income (wage) differences due to the U.S. becoming a
major industrialized country. In the year 1921, the number of foreign residents in Shanghai
was 31,893.55 This amounts to an annual average growth rate of 5.6%, which is faster than
Shanghai’s imports from foreign countries (3.6%, see Figure 4).
We now turn to the dynamics of international migration from some specific
countries. As seen above, Japan was and still is the major source of foreign residents living
in Shanghai. We return to the naïve forecaster’s problem during the treaty port era that
was discussed before, asking now what the level of Japanese residents in Shanghai would
be if our forecaster would only know the past change in residency.
As Figure 15A shows, the number of Japanese in Shanghai was increasing at about
12% per year. Given the treaty port era levels of Japanese residents in Shanghai, the
forecaster would decisively overestimate today’s Japanese in Shanghai. In fact, the number
of Japanese in Shanghai was around 17,000 both in the year 1915 and in the year 2004.
54 Data from Ninth Census of the United States. Statistics of Population, Table VIII. 55 Thus, the stock of foreign residents in Shanghai, which accounted for about a third of all foreign residents in China, increased by about 28,000 over roughly 50 years in Shanghai. For comparison, the flow of immigrants to the U.S. in a typical year between 1870 and 1910 was about 500,000 (US Senate document, Table 2).
33
One explanation for this result might be that Japan had colonial intentions during the treaty
port years but does not today.
Because the population of Shanghai in 1915 was around 1 million while in the year
2004 it was around 13.5 million, as a fraction of Shanghai’s total population the size of the
Japanese population in Shanghai has decreased. Note that the current rate of growth of
Japanese residents in Shanghai is only somewhat larger than the historical growth rate,
which implies that at the current trend it will be a long time until Shanghai’s Japanese
population is as large as the projection level based on the treaty port era trend.
The U.S. and Britain turn out to be similar qualitatively in how the levels of their
residency in Shanghai have evolved over time. For both U.S. and British residents we would
overestimate today’s levels by using the treaty port era trends (see Figure 15B and Figure
15C); for Britain for example the prediction of our forecaster for the year 2009 would be
about 68,000 residents, whereas in fact there were only about 5,000 of them. At the same
time, the growth rate of U.S. and British residents in Shanghai has been high recently
(about 17% per year), so that the actual number of residents should be equal to the
projected treaty port values fairly soon, around the year 2020 (see Figures 15B and 15C).
A slightly different picture emerges for Germany, where current foreign resident levels
already exceed the projected treaty port era values (Figure 15D). This is due to a lower rate
of growth during the historical period, likely a consequence of being on the losing side of
World War I with the consequent reduction of overseas power and ambition.
We also use the gravity equation to examine international migration that went to
Shanghai. Our gravity regression for international migration is analogous to that for
trade.56 Migration is measured by the number of residents from a particular foreign
country in Shanghai. In our sample, the countries are France, Germany, Japan, Britain, and
the U.S., and the sample years for the History sample are 1872, 1891, 1901, 1911, and
1921.57
56 While we know of no particular micro foundations for this gravity equation for international migration, foreign country GDP can be considered a ‘push’ factor while sea distance plausibly captures migration costs. 57 Data on some country‐year combinations are unavailable, and the number of observations is low.

34
Results are reported in Table 8. Columns 1 and 2 are the gravity regression for
foreign residents, where the coefficients are similar to those in the trade gravity regression.
The results are somewhat dependent on whether or not Japan is included in the sample.
When Japan is included, the coefficient of GDP is insignificant while when Japan is excluded,
the coefficient of GDP becomes positive and significant but the coefficient of distance
changes to be marginally positive. As a comparison, column 3 applies the same
specification to the modern data, where the coefficients are all in line with expectations.58
Since bilateral distances remain constant over time, the only difference between the
historical and modern Japan is its GDP relative to other countries.59
To summarize, the patterns of foreign residency in Shanghai basically follow the
gravity equation, with Japan as an influential observation. We now turn to international
capital movements in form of FDI to Shanghai as another indicator of international
economic integration.
4.6 Foreign Direct Investment in Shanghai
A distinguishing feature between the current era of globalization and the wave towards
more economic integration before World War I is the much smaller extent to which firms in
the earlier period operated multi‐country production networks. Setting aside the
commission agents of merchants and banks, which were around in the Middle Ages,
multinational production in manufacturing can be found not much earlier than the middle
of the 19th century, with substantial investments found only towards the end of the century
(Kindleberger 1985).60 Also in China during the treaty port era, it was firms associated
with foreign trade that were the first multinationals, before manufacturing activity became
58 The coefficient of Shanghai's population is large in magnitude, just as in the trade gravity regression with recent data (Table 7). 59 Japan's GDP was the smallest of all foreign countries in our 1911 sample, but was the second largest in the world starting from the 1960s until 2011. 60 Among the earliest investors known were several British who invested in Naples in the 1840’s, as well as the American Haviland producing fine China in France in 1842. The German Siemens company was established in 1847 and in the early 1850’s had a plant in Russia, and a plant in Britain by 1857; see Kindleberger (1985).

35
more important. At the same time, whatever FDI did exist might have been particularly
important.61 In this section we examine the volume and pattern of FDI in Shanghai.
The total number of foreign firms in Shanghai was 152 in the year 1872, which was
growing to 1,741 in the year 1921 (annual growth rate of about 5%). Figure 16A shows the
largest five source countries of these firms originated. Japan was the largest source,
accounting for 35%, followed by Britain with 30%. Other major sources were other treaty
powers, the USA, Germany, and France. Other countries accounted for 13% of the number
of foreign firms in Shanghai.
A look at the composition of FDI in Shanghai with recent data shows that while
Japan’s importance has remained, the U.S. has gained relatively while Britain’s importance
has declined (Figure 16B).62 This is confirmed by a direct comparison of the two time
periods (Figure 16C). Interestingly, the share of FDI by non‐top 5 sources has roughly
changed constant between the historical period and today (13% versus 11%, respectively).
Taking this as the measure of the concentration of international economic activity in
Shanghai, then the degree of concentration of FDI has remained unchanged while in
contrast that of international migration and trade has fallen over time.
Also here we examine the forecaster’s prediction for the number of foreign firms
based on the treaty port era trends. We find that typically the forecaster would
overestimate the number of firms today in Shanghai by a substantial margin. The exception
is Germany, presumably because its overseas ambitions were stunted because of its loss in
World War I (see Figure 17A). Moreover, for the USA FDI during the treaty port era grew at
a higher rate than in recent years, so the forecast based on the historic trend will be
increasingly off over time (Figure 17B). The rate of FDI growth from Britain is now higher
than it was between the years 1872 and 1921 (Figure 17C). The only country—apart from
Germany—for which actual FDI levels are forecasted to catch up with the projected
historical levels quite soon is France (Figure 17D).
61 We have not been able to locate complete information on the industry or the size of these firms. For a critical discussion of the foreign firm and resident data provided by the CMC, see Feuerwerker (1976, pp.16‐18). 62 These figures are derived from foreign capital actually absorbed, and they do not include capital from Hong Kong, Macao, and Taiwan.

36
Overall, while the forecaster will often overestimate FDI and foreign resident levels,
the levels of trade can be over‐ or underestimated. FDI and foreign resident flows into
Shanghai grew at a higher rate than Shanghai’s imports during the treaty port era because
trade was already more established than FDI and foreign residents at Shanghai. Thus the
difference may capture to some extent a start‐up effect.
As in the case of Shanghai’s trade and foreign residency, we examine Shanghai’s FDI
employing a gravity equation framework. At least since the mid‐1980s, it is well‐known
that FDI can have similar micro‐foundations as international trade, which lead to the
gravity equation.63 Keller and Yeaple (2011) have recently shown that gravity for FDI
across countries holds even at the level of individual multinational firms. Columns 4 and 5
in Table 8 turn to examine FDI. The FDI gravity regression, using either historical or
modern data, gives coefficients in line with expectations. The results are also consistent
with those of the trade gravity regression.64 One difference is that for FDI, the empirical fit
of the gravity equation during the treaty port era is lower than the FDI gravity fit in recent
years. The result appears to be primarily due to the much larger coefficient on Shanghai’s
population, which may be indicative of a relatively greater importance of the Chinese
market in the more recent years.
Our finding that FDI patterns in Shanghai around the year 1900 follow the gravity
equation prediction are important for understanding FDI. These results indicate that a
close similarity between trade and FDI patterns can empirically be traced back by more
than a century, far earlier than when empirical studies started paying attention to FDI in
the 1970s.65
We now turn to the question of the impact of trade and other forms of openness on
Shanghai and China as a whole.
63 See Helpman (1984), Markusen (1984). 64 The coefficient of Shanghai's population is large in magnitude, just as in the trade gravity regression and the migration gravity regression with recent data (Table 7 and columns 1‐2 of Table 8, respectively). 65 See Caves (2007, Chapter 1) for a summary of the early literature on FDI.

37
4.7 Shanghai as Cornerstone of China’s Integration into the World Economy
This section begins by summarizing Shanghai’s varying participation in foreign economic
activity over the last 150 years, before asking what this has done for economic
development in Shanghai as well as for China as a whole.
First, we examine Shanghai’s foreign trade per each one of its inhabitants. This can
be viewed as a measure of trade openness, similar to trade to GDP. The data for the period
1870 to 2009 is shown in Figure 18A.66 The figure suggests continuity in that the levels of
openness during the treaty port era are comparable to those of the year 2000. The
suppression of foreign trade during the early years of CPC rule appears to have no long‐
term impact. It also speaks of change in the sense that the post‐2000 levels of openness are
unprecedented in the history of Shanghai.
Next we turn to Shanghai’s share of China’s foreign trade as well as the city’s share
of China’s population since the year 1870; see Figure 18B. Two features stand out. First,
there is a difference in scale between Shanghai’s trade share and its population share. As
we have noted earlier, today Shanghai has about 1% of China’s population and it accounts
for close to 15% of China’s foreign trade. In fact, historically Shanghai’s importance for
foreign trade in per capita terms was far larger than today’s numbers suggest. Specifically,
around the year 1925, when the two series in Figure 18B cross, Shanghai’s share of trade to
population was 100 to 1.67 At the time, clearly, Shanghai was quite different from most
Chinese areas. And yet China’s status today as one of the world’s largest traders indicates
that over time, China has become more like Shanghai rather than the other way around.
Second, the figure shows important differences in the evolution of Shanghai’s trade
compared to its population share. The trade share has fallen over time from about 20% in
1870 to about 13% in 2009, largely due to the economic development of other parts of
China. What is most interesting is the speed at which Shanghai loses its share of China’s
trade: on average, Shanghai lost one half of a percent of trade for every decade. This fairly
66 Trade is measured here as the sum of locally produced foreign exports plus net foreign imports. 67 The scale on the left is 1/100 of the scale on the right.

38
gradual pace suggests a great deal of persistence in the position of Shanghai for China’s
trade.
At the same time there is a large increase in Shanghai’s population share. The year
1930 appears to be a watershed for Shanghai. Notice that both for the earlier period and
the later period there is a positive relationship between Shanghai’s trade and Shanghai’s
population (see Figure 18C), as one would expect from the gravity equation. However,
what explains the upward shift in the population share by almost an order of magnitude?68
While a number of factors may have been at work, one explanation is that the foreign trade
with industrialized countries had benefited Shanghai in a number of ways.
Finally, there is the question to what extent the evolution of Shanghai’s foreign
exchange might have mattered for China’s economic development at the country level. To
be sure, a city of about 250,000 people cannot be expected to determine the fate of a vast
country with about 350 million inhabitants (both figures for the year 1870). At the same
time, the strong recent trade performance is frequently mentioned as one of the primary
reasons for China’s recent high growth rates. Thus it is worth asking how Shanghai, the
city that is the “heart” of China’s foreign trade system, fits into this.
To what extent can we trace out China’s economic growth with Shanghai’s
involvement in foreign trade? First, in Figure 19 China’s share of world GDP since the year
1870 is shown (recall Table 2). Today, China is with about 17.5% of world GDP the world’s
second largest economy, after the U.S. In the year 1870, China was almost as large relative
to the world, with 17.1%. In between is a dip with a low point in the GDP share of around
4.5% for the years 1950 to 1970. Also shown in Figure 19 are two measures of openness.
The first is for China, the second is for Shanghai. The correlation between the two
openness series is more than 90% high, which underlines that Shanghai accounts for an
important part of China’s foreign trade. However, note that China’s share in world GDP
follows more closely the Shanghai openness measure than the China openness measure.
68 Before 1930, Shanghai’s population share averages 0.15% while after 1955 the mean population share of Shanghai is 1.2%.

39
The correlation of Shanghai’s openness with China’s world GDP share is 0.74, whereas it is
only 0.50 with the China openness variable.69
While China’s long‐run growth performance is driven by a number of factors, there
is evidence that the foreign trade conducted at Shanghai has played a major role in it. The
results are consistent with the idea that Shanghai’s integration into the world economy
during the treaty port era has, through re‐exporting and other activities, contributed to the
trade and development of other Chinese areas.
5. Conclusions
Recent observers have routinely characterized China’s growth in trade and income with
superlatives, so much so that it would be easy to believe that China has entered a new
period in the history of its trade. In this paper, we attempt to see which part is hyperbole
and which is not, using historical benchmarks that extend back to the treaty port era, which
we define as the period from 1843 to 1941. Since Shanghai is currently the largest port in
the world, and the most important port in China, we use this city as a lens with which to
better understand China’s trade.
We find that while some features of China’s recent performance are extraordinary,
others are not. First, there is evidence of historical continuity in some important
dimensions. We find that the level of openness in Shanghai at the turn of the 21st century
was the same as what it was at the end of the 19th century. Moreover, Shanghai not only
receives a large share of provincial re‐exports, but this share in recent years is comparable
to the share of the late 19th century when it was established as an open port under the
control of Western powers. Specifically, the share of re‐exports in Shanghai’s foreign
exports between the years 1990 and 2009 is almost exactly the same, at 56%. This is true
even though quite evidently many events have occurred in China, Shanghai, and the world
in the intervening years between the Opium Wars and today.
69 Data availability necessitates defining openness slightly differently. China’s openness is exports to GDP whereas for Shanghai it is exports plus imports over population. First of all, for Shanghai we have no GDP data during the historical period. We have experimented with using trade to population for the China openness measure; this leads to similar results. Also, we use only exports in the China openness measure because the Groningen database, the source of the GDP data, has no information on imports.

40
Implied by the continuity is an underlying tendency towards recovery. China’s trade
was severely suppressed during the early planned economy years relative to historic
trends. The depression of foreign trade in the communist period, however, appears to have
had no long‐term impact. Shanghai has to a large extent reverted back to its historical role
in channeling the foreign trade of China. The implication of this is that it would be wrong
to believe that recent trends could continue indefinitely, or that recent gains are mainly due
to the reforms since 1978. In fact, Shanghai’s imports from Britain today are quite close to
what a naïve forecast using trends from the treaty port era would give. Our gravity
regressions, in which we plug modern country characteristics into the historical gravity
relationship and then compare the projected bilateral trade pattern with the actual pattern
also show that today’s trade patterns are not far off the mark from what might be expected
based on historical patterns.
Some of the continuities may be policy induced. There are certainly similarities in
trade and FDI policy between the treaty port era and China’s current trade liberalization
regime. Today, as well as in the 19th century, low tariffs are enforced, preferential
treatment is given to foreign firms, and foreign firms can wholly own businesses in China.
The difference is that these policies were imposed upon China in the 19th century by
foreigners, while in the recent era of reform, it is the Chinese government that has
implemented policies such as the Special Economic Zones, which are oriented towards
foreign markets—strikingly, virtually all of these modern zones selected by the Chinese
government were former treaty ports or in areas closely neighboring former treaty ports.70
Despite similarities in policy, we suspect, nevertheless, that other factors besides
policy, such as geography and the accumulation of experience play a part too in explaining
why China has been able to return so swiftly to a market‐economy after three decades of
central planning. China’s inherent comparative advantage historically was in its large labor
pool, and this may still be the case even as China assembles and exports electronics and
information technology products. Future research will allow us to use the quantitative
70 We may include Hong Kong in this list, although it is technically a former colony.

41
information in the CMC records to further investigate the commodity composition of trade
in order to provide a clearer view on this.
Second, there are several notable changes in trade patterns between the 19th
century and the performance of Shanghai during the last decade. The most evident
differences are Shanghai’s import and export composition. Whereas British and Japanese
interests in Shanghai were predominant a century ago, Shanghai’s trade today has
normalized in the sense that much of its trade is with geographically proximate places. We
do find that growth in trade has reached extraordinary levels, but only since the year 2000.
At the same time, the greater Shanghai area has become, perhaps as a result of its success
in trade, a very large urban metropolis with over 20 million permanent residents. Another
change, related to the context of the 19th century is that Shanghai’s trade, FDI, and foreign
residency is now spread among a larger set of countries than what was the case during the
19th century. Shanghai also retains a larger share of foreign imports than it did in the mid‐
19th century, a reflection of the fact that there are more ports of entry for foreign goods into
China today.
Finally, our regional approach to trade seems to make sense in the case of China.
The growth of Shanghai raises questions about the dynamic implications of re‐exporting on
Shanghai and the Yangzi Delta region. Examining foreign trade at the sub‐national level
may usefully identify the relationship between foreign trade and domestic trade, and
permit a better understanding of the sources of trade and growth. Shanghai and the wider
Yangzi Delta area have served as central locations for China’s domestic trade long before
the arrival of Western gunboats. Given the important relation between international and
domestic trade, Shanghai’s accession today in the international arena would appear to
crucially depend on its access to the domestic networks within China, which in this paper
we capture with the re‐exports variable. Other ports in China, also opened under western
force, did not attain the same level of trade and modernization because they had more
limited access to domestic networks than did Shanghai. Guangzhou, for example, although
already trading with Europe for a century longer than Shanghai, had primary access only to
a southern network of domestic trade.

42
For a large country like China, where not all regions are equally trading
internationally, an aggregate analysis of trade may not make as much sense as asking
where the trading cities are. The importance of looking at localization in trade is
emphasized in our quantitative measures related to growth. Shanghai’s trade, for instance,
seems to capture better the relationship between trade and growth in China than an overall
measure of China’s trade. The correlation between Shanghai’s trade openness and China’s
share in world GDP over a century and a half is 0.74 while the correlation between China’s
openness and China’s share in world GDP over the same period is only 0.50. The key role
that Shanghai has in China’s trade suggests that a better understanding of trends in China’s
trade requires examining persistence in the patterns of within‐country trade. There may
be persistence despite the fact that transport costs, production, goods, and China’s main
trading partners have all changed over time. Our finding of this striking persistence in
Shanghai’s trade highlights such empirical patterns must be a plausible outcome in any
theoretical framework that integrates domestic trade within the international trading
system.

43
References Ahn, JaeBin; Khandelwal, Amit K. and Wei, Shang‐Jin (2011), "The role of intermediaries in
facilitating trade," Journal of International Economics, 84(1): 73‐85.
Anderson, James E (2010), "The Gravity Model." NBER Working Papers 16576.
Antras, Pol and Costinot, Arnaud (2011), “Intermediated Trade,” Quarterly Journal of
Economics, 126, No. 3: 1319‐1374.
Autor, David; Dorn, David and Hanson, Gordon (2011). "The China Syndrome: Local Labor
Market Effects of Import Competition in the United States." Working paper.
Bergère, Marie‐Claire (2009), Shanghai, China’s Gateway to Modernity. Stanford: Stanford
University Press.
Bickers, Robert (2006), “Chinabound: Crossing borders in treaty port China”, History in
Focus, 11 (Autumn).
Bloom, Nicholas; Draca, Mirko and Van Reenen, John (2011), “Trade induced technical
change? The impact of Chinese imports on innovation, IT and productivity”, Stanford
mimeo.
Branstetter, Lee and Lardy, Nicholas R. (2008), “China’s Embrace of Globalization” in
China’s Great Economic Transformation, eds. Loren Brandt and Thomas G. Rawski.
Brunero, Donna (2006), Britain’s Imperial Cornerstone: The Chinese Maritime Customs
Service, 18541949. New York: Routledge Curzon.
Caves, Richard E. (2007), Multinational Enterprises and Economic Analysis, 3rd ed.,
Cambridge University Press, New York, NY.
Chaney, Thomas (2011), "The Gravity Equation in International Trade: an Explanation."
Working paper.
Chinese Maritime Customs (CMC; 2001), Chinese Old Customs Documents (Zhongguo jiu
hai guan shi liao) (1859‐1948). Publisher: Beijing: Jinghua Chuban She, 2001.
Cristea, Anca D. (2011), “Buyer‐Seller Relationships in International Trade: Evidence from
U.S. States’ Exports and Business‐Class Air Travel”, Journal of International
Economics 84(2), 207‐220.

44
Devlin, Robert; Estevaeordal, Antoni and Rodriguez‐Clare, Andres (2005), eds, The
Emergence of China: Opportunities and Challenges for Latin America and the
Caribbean, Cambridge, Mass.: Harvard University Press.
Davis, John Francis (1852), China, During the War and Since the Peace. Longman, Brown,
Green, and Longmans. Original from Oxford University.
Davis, Donald R. and Weinstein, David E. (2002), "Bones, Bombs, and Break Points: The
Geography of Economic Activity," American Economic Review, 92(5): 1269‐1289.
di Giovanni, Julian; Levchenko, Andrei and Zhang, Jing (2011), "The Global Welfare Impact
of China: Trade Integration and Technological Change." Working paper.
Documents illustrative of the origin, development, and activities of the Chinese Customs
Service. Shanghai: Statistical Department of the Inspectorate General of Customs.
Vol. 1‐7.
Estevadeordal, Antoni; Frantz, Brian and Taylor, Alan M. (2003), "The Rise And Fall Of
World Trade, 1870‐1939." Quarterly Journal of Economics, 118(2): 359‐407.
Feenstra, Robert C. and Hanson, Gordon H. (2004), "Intermediaries in Entrepot Trade:
Hong Kong Re‐Exports of Chinese Goods." Journal of Economics & Management
Strategy, 13(1): 3‐35.
Feenstra, Robert C. and Wei, Shang‐jin. (2010), eds, China’s Growing Role in World Trade,
Chicago, IL: University Of Chicago Press.
Feuerwerker, Albert (1976), The Foreign Establishment in China in the Early Twentieth
Century, Ann Arbor: University of Michigan.
Fung, Ka‐Iu; Yan, Zhong‐Min and Ning, Yue‐Min (1992), “Shanghai: China’s World City.” In
Yue‐man Yeung and Xu‐wei Hu, eds., China’s Coastal Cities:Catalysts for
Modernization. Honolulu: University of Hawaii Press.
Glaeser, Edward L. and Gottlieb, Joshua D. (2009), "The Wealth of Cities: Agglomeration Economies and Spatial Equilibrium in the United States," Journal of Economic Literature 47(4): 983‐1028.

45
Heckscher, Eli (1919), Utrikeshandelns verkan på inkomstfördelningen. några teoretiska grundlinjer. Ekonomisk tidskrift, 21, 1−32.
Helpman, Elhanan (1984), "A Simple Theory of International Trade with Multinational
Corporations," Journal of Political Economy, 92(3): 451‐471.
Hovhannisyan, Nune and Keller, Wolfgang (2011), “International Business Travel: An
Engine of Innovation?” NBER Working Paper.
Hsiao, Liang‐lin (1974), China’s Foreign Trade Statistics, 1864–1949, Cambridge, MA:
Harvard University Press.
Hsieh, Chang‐Tai and Klenow, Peter J. (2009), "Misallocation and Manufacturing TFP in
China and India," Quarterly Journal of Economics, 124(4): 1403‐1448.
Huang, Huchen (1986), “Qingdai qianqi haiwai maoyi de fazhan” [The development of
foreign commerce during the early Qing]. Lishi yanjiu 4(2): 151‐70.
Jacks, David S. and Pendakur, Krishna (2010), "Global Trade and the Maritime Transport
Revolution." Review of Economics and Statistics, 92(4): 745‐755.
Johnson, Linda Cooke (1995). Shanghai: From Market Town to Treaty Port, 10741858.
Stanford: Stanford University Press.
Ju, Jiandong; Shi, Kang and Wei, Shang‐Jin (2011). " Are Trade Liberalizations a Source of
Global Current Account Imbalances," NBER Working Papers 17549.
Keller, Wolfgang; Li, Ben and Shiue, Carol H. (2011a), “China’s Foreign Trade: Perspectives
from the Past 150 Years”, The World Economy Vol. 34, 6, pp. 853‐892.
Keller, Wolfgang; Li, Ben and Shiue, Carol H. (2011b), “The Evolution of Domestic Trade
Flows When Foreign Trade is Liberalized: Evidence from the Chinese Maritime
Customs Service”, working paper, University of Colorado‐Boulder, October.
Keller, Wolfgang, and Shiue, Carol (2007), “Market Integration and Long‐run Development:
A Long‐Run Comparison”, Review of Development Economics
Keller, Wolfgang, and Yeaple, Stephen R. (2011), “The Gravity of Knowledge”, mimeo,
University of Colorado, December.
46
Kindleberger, Charles P. (1985), Keynesianism vs. Monetarism: And Other Essays in Financial
History, G. Allen & Unwin, London and Boston.
Krugman, Paul R. (2010), “The New Economic Geography, Now Middle‐Aged”, paper
prepared for presentation to the Association of American Geographers, April 16,
2010.
Krugman, Paul R. (2009), “Increasing Returns in a Comparative Advantage World”, in
Comparative Advantage, Growth, and the Gains from Trade and Globalization, R. M.
Stern (editor), World Scientific Studies, Vol. 16.
Lardy, Nicholas R. (2002), Integrating China into the Global Economy, Brookings Institution,
Washington, D.C.
Leamer, Edward E. and Levinsohn, James (1995), "International trade theory: The
evidence," in: G. M. Grossman & K. Rogoff (ed.), Handbook of International
Economics, edition 1, volume 3, chapter 26, 1339‐1394. Elsevier.
Lin, Justin Yifu (2011), “China and the Global Economy”, Remarks at the 20th Anniversary of
the University of Science and Technology, Hong Kong, March 2011.
Lyons, Thomas (2003), China Maritime Customs and China's Trade Statistics, 18591948.
Trumansburg, NY: Willow Creek Press.
Maddison, Angus (2001), The World Economy. A Millenial Perspective, OECD: Paris.
Markusen, James (1984), "Multinationals, Multi‐Plant Economies, and the Gains from
Trade." Journal of International Economics, 16: 205‐22.
Mitchell, B.R. (1998), International Historical Statistics. Africa, Asia & Oceania 1750 1993,
3rd edition, London: Macmillan.
Murphey, Rhoads (1977), The Outsiders. Ann Arbor: University of Michigan Press.
Nield, Robert (2010), The China Coast: Trade and the First Treaty Ports. Hong Kong: Joint
Publishing.
Ohlin, Bertil (1933), Interregional and International Trade. Cambridge: Harvard University
Press.
47
Ottaviano, Gianmarco I. P. and Puga, Diego (1997), "Agglomeration in a global Economy: A
Survey," CEP Discussion Papers dp0356, Centre for Economic Performance, LSE.
Pan, Junxiang and Chen, Liyi (1986). “Shijiu shiji houbanqi Shanghai shangye de yanbian”
[Evolution of commerce in Shanghai in the latter half of the 19th century]. Lishi
yanjiu, 1: 154‐65.
Perkins, Dwight H. (2007), The Challenges of China’s Growth. Washington, D.C.: AEI Press.
Pomeranz, Ken (2000), The Great Divergence: China, Europe, and the Making of the Modern
World Economy. Princeton: Princeton University Press.
Pomeranz, Kenneth and Steven Topik (2005), The World that Trade Created: Society, Culture, And the World Economy, 1400 to the Present (Sources and Studies in World History). New York: M.E. Sharpe.
Poole, Jennifer Pamela (2010), "Business Travel as an Input to International Trade."
Working paper.
Rawski, Thomas G. (1980), China’s Transition to Industrialism: Producer Goods and
Economic Development in the Twentieth Century. Ann Arbor: University of Michigan
Press.
Rawski, Thomas G. (1999), “Reforming China's Economy: What Have We Learned?” The
China Journal No. 41: 139‐156.
Rozman, Gilbert (1982), Population and Marketing Settlements in Ch’ing China. Cambridge:
Cambridge University Press.
Sachs, Jeffrey D. and Woo, Wing Thye (2000), “Understanding China's Economic
Performance,” Journal of Policy Reform 4, 1 (2000): 1‐50.
Schindler, John W. and Beckett, Dustin H. (2005), “Adjusting Chinese Bilateral Trade Data:
How Big is China’s Trade Surplus?” Board of Governors of the Federal Reserve
System International Finance Discussion Papers, Number 831,.
Shanghai YB (2010), Shanghai Statistical Yearbook, various years,
Shiue, Carol H. and Keller, Wolfgang (2007), “Markets in China and Europe on the Eve of the
Industrial Revolution”, American Economic Review, 97(4): 1189‐1216.

48
Song, Zheng; Storesletten, Kjetil and Zilibotti, Fabrizio (2011), "Growing Like China,"
American Economic Review, 101(1): 196‐233.
Tian, Gang (1996), Shanghai’s role in the Economic Development of China: Reform of Foreign
Trade and Development. Praeger: Westport, Ct.
van de Ven, Hans (2006), “Robert Hart and the Chinese Maritime Customs Service”, special
issue of Modern Asian Studies, vol. 40:3 (July).
Willoughby, Westel W. (1920), Foreign Rights and Interests in China. Baltimore: The Johns
Hopkins University Press.
Yan, Zhongping (1955), Zhongguo mian fangzhi shigao. [A brief history of cotton spinning and weaving in China]. Beijing: keshe chubanshe.
Yeung, Y.M. and Sung Yun‐wing, eds., (1996), Shanghai: Transformation and Modernization under China’s Open Policy. Hong Kong: Chinese University Press.
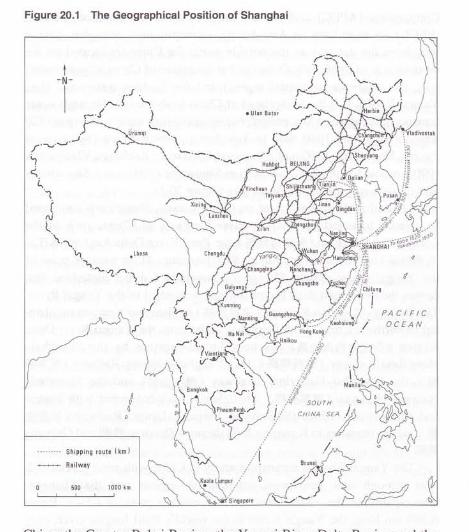
532 Shi Peijun, Lin Hui and Liang Jinshe
Figure 20.1 The Geographical Position of Shanghai
China: the Greater Bohai Region, the Yangzi River Delta Region and the
Pearl River Delta Region. Of these, the first region is close to the KoreanPeninsula. Historically, there were frequent contacts between the North-east, Shandong t.l.lF , Beijing/Tianjin (JhH/Xi#) of China and Japan.
Therefore, it is not unreasonable to expect the formation, from a
geographical point of view, of a Northeast Asia Economic Region, because
the establishment of the European Union and the North America Free
Trade Area will likely stimulate similar developments in eastern Asia.Table 20.1 presents an assessment of the investment environment in
=B
=
Oo
o
,:a.=.=
.=,Y
6=
'\ =
o9C,I
otr =cE3=
! C:
@ -:-o !,jo5::'->:o;=
uJa =
Or=+=:O-=Oc:>-:o=:
(\tol)6F
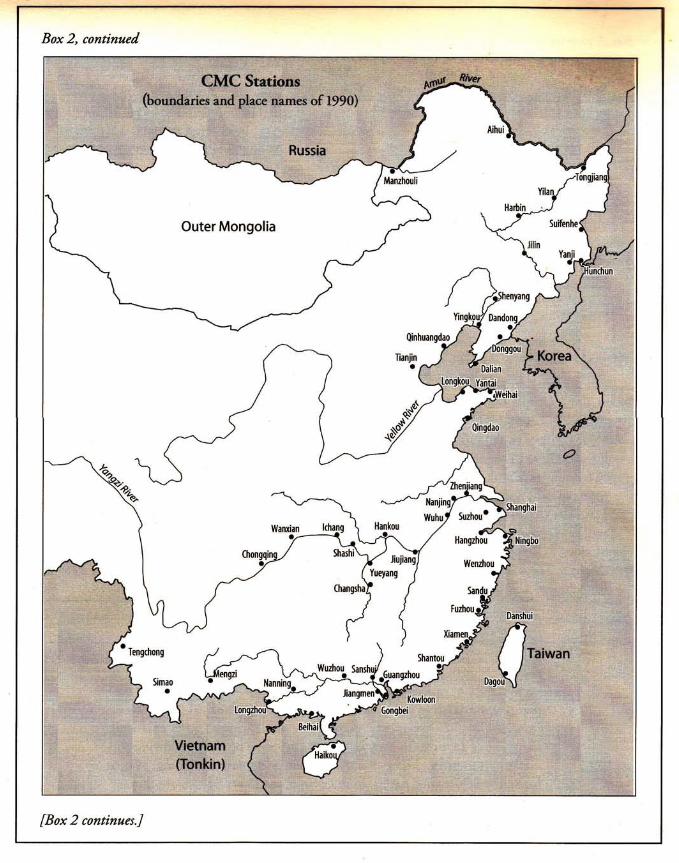
Box 2, continued
[Box 2 continues.J
I
L

51
Table 1: China’s Share of World Merchandise Exports in Comparison, 1870 to 2009
(In percent)
1870 1913 1929 1950 1960 1970 1980 1990 2000 2009 China 2.78 1.98 2.50 2.14 2.08 0.76 0.92 1.79 3.86 9.62Germany 13.43 17.98 14.03 4.46 9.23 11.27 9.77 12.12 8.55 9.02United Kingdom 24.31 18.52 12.80 10.00 8.58 6.40 5.58 5.33 4.42 2.82United States 4.96 9.04 12.15 14.58 16.66 14.24 11.43 11.33 12.11 8.45India 6.88 4.46 3.28 1.86 1.08 0.67 0.44 0.52 0.66 1.30Japan 0.10 0.79 1.74 1.20 3.28 6.36 6.61 8.28 7.42 4.65
Table 2: China’s Share of World GDP in Comparison, 1870 to 2008
(In percent)
1870 1913 1929 1950 1960 1970 1980 1990 2000 2008 China 17.10 8.83 7.05 4.59 5.24 4.63 5.20 7.83 11.77 17.48Germany 6.50 8.68 6.74 4.97 6.62 6.12 5.52 4.66 4.24 3.36United Kingdom 9.03 8.22 6.46 6.52 5.37 4.35 3.64 3.48 3.30 2.84United States 8.87 18.93 21.68 27.29 24.27 22.39 21.12 21.39 21.89 18.61India 12.15 7.47 6.23 4.16 3.88 3.41 3.18 4.05 5.18 6.70Japan 2.29 2.62 3.29 3.02 4.45 7.36 7.83 8.55 7.16 5.70

52
Table 3: China’s Share of World Population in Comparison, 1870 to 2009
(In percent)
1870 1913 1929 1950 1960 1970 1980 1990 2000 2009 China 28.06 24.38 22.55 21.63 21.93 22.17 22.10 21.54 20.78 19.68Germany 3.08 3.63 3.00 2.70 2.38 2.11 1.76 1.51 1.35 1.22United Kingdom 2.46 2.55 2.11 1.98 1.72 1.51 1.27 1.09 0.98 0.90United States 3.15 5.44 5.66 6.02 5.94 5.56 5.13 4.75 4.64 4.54India 19.83 16.94 15.42 14.20 14.27 14.66 15.29 15.92 16.52 17.10Japan 2.70 2.88 2.93 3.32 3.09 2.83 2.63 2.34 2.09 1.88
Table 4: China’s Trade Openness in Comparison, 1870 to 2008
Merchandise Exports to GDP, in percent
1870 1913 1929 1950 1960 1970 1980 1990 2000 2008 China 0.74 1.74 2.28 2.59 2.57 1.22 2.76 2.92 4.38 9.75Germany 9.37 16.10 13.37 4.97 9.03 13.68 27.68 33.30 26.90 51.24United Kingdom 12.22 17.52 12.73 11.00 10.35 10.93 23.99 19.60 17.88 19.29United States 2.54 3.71 3.60 2.96 4.44 4.73 8.46 6.78 7.39 8.24India 2.57 4.64 3.39 2.47 1.80 1.45 2.14 1.64 1.69 3.46Japan 0.20 2.35 3.39 2.20 4.77 6.42 13.19 12.39 13.84 16.35World 4.54 7.77 6.43 5.54 6.47 7.43 15.63 12.80 13.36 19.20
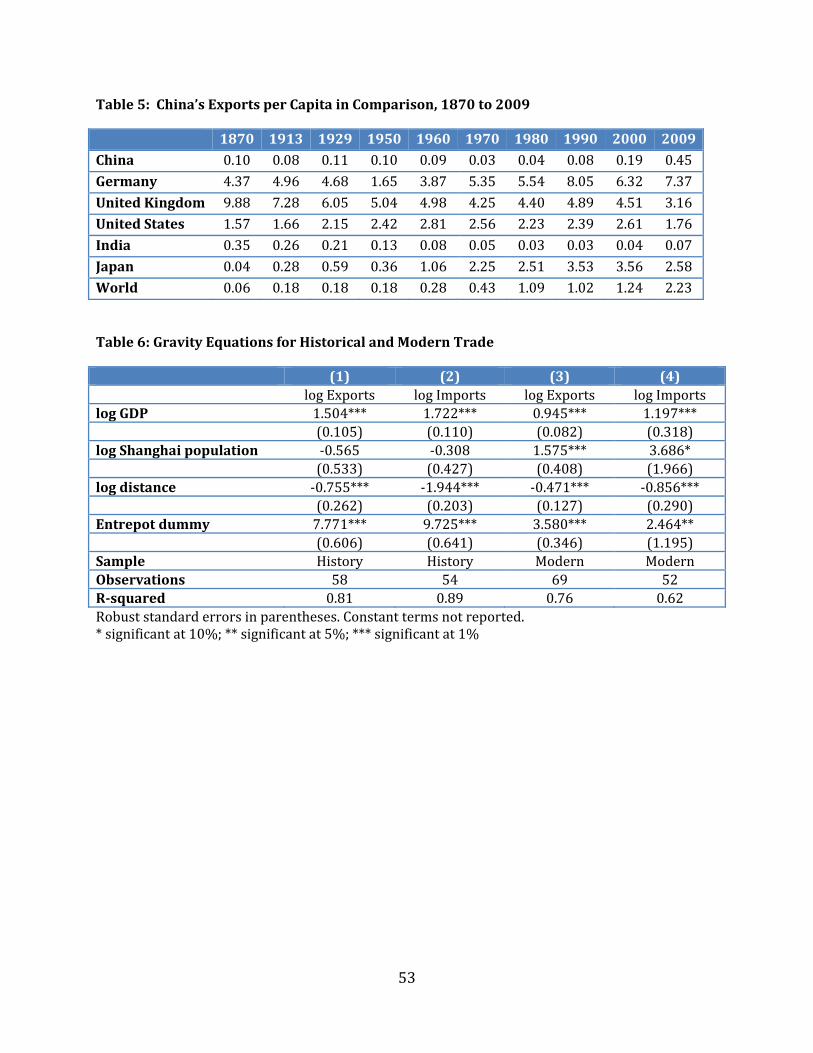
53
Table 5: China’s Exports per Capita in Comparison, 1870 to 2009
1870 1913 1929 1950 1960 1970 1980 1990 2000 2009 China 0.10 0.08 0.11 0.10 0.09 0.03 0.04 0.08 0.19 0.45Germany 4.37 4.96 4.68 1.65 3.87 5.35 5.54 8.05 6.32 7.37United Kingdom 9.88 7.28 6.05 5.04 4.98 4.25 4.40 4.89 4.51 3.16United States 1.57 1.66 2.15 2.42 2.81 2.56 2.23 2.39 2.61 1.76India 0.35 0.26 0.21 0.13 0.08 0.05 0.03 0.03 0.04 0.07Japan 0.04 0.28 0.59 0.36 1.06 2.25 2.51 3.53 3.56 2.58World 0.06 0.18 0.18 0.18 0.28 0.43 1.09 1.02 1.24 2.23
Table 6: Gravity Equations for Historical and Modern Trade
(1) (2) (3) (4) log Exports log Imports log Exports log Importslog GDP 1.504*** 1.722*** 0.945*** 1.197*** (0.105) (0.110) (0.082) (0.318)log Shanghai population ‐0.565 ‐0.308 1.575*** 3.686* (0.533) (0.427) (0.408) (1.966)log distance ‐0.755*** ‐1.944*** ‐0.471*** ‐0.856*** (0.262) (0.203) (0.127) (0.290)Entrepot dummy 7.771*** 9.725*** 3.580*** 2.464** (0.606) (0.641) (0.346) (1.195)Sample History History Modern ModernObservations 58 54 69 52Rsquared 0.81 0.89 0.76 0.62Robust standard errors in parentheses. Constant terms not reported. * significant at 10%; ** significant at 5%; *** significant at 1%

54
Table 7: Gravity Equations for Modern Trade, Different Periods
(1) (2) (3) (4) log Exports log Imports log Exports log Importslog GDP 1.030*** 1.141*** 1.161*** 1.125*** (0.092) (0.242) (0.052) (0.237)log Shanghai population 5.273*** 21.530*** 23.475*** 28.432*** (1.841) (2.941) (2.418) (5.863)log distance ‐0.526*** ‐0.740*** ‐0.621*** ‐0.570*** (0.147) (0.192) (0.084) (0.194)Entrepot dummy 3.172*** 2.229** 3.208*** 2.299** (0.368) (0.928) (0.211) (0.922)Sample Post‐1978 Post‐1978 Post‐1984 Post‐1984Observations 49 39 35 29Rsquared 0.83 0.85 0.96 0.79Robust standard errors in parentheses. Constant terms not reported. * significant at 10%; ** significant at 5%; *** significant at 1%.
Table 8: Gravity Equations for Resident and FDI Movements to Shanghai
(1) (2) (3) (4) (5) Residents Residents Residents FDI FDIlog GDP 0.014 0.852*** 0.376*** 0.772** 1.232*** (0.217) (0.192) (0.039) (0.325) (0.119)log Shanghai population 2.436*** 1.135** 49.967*** 1.235** 15.167** (0.717) (0.355) (5.615) (0.567) (5.329)log distance ‐0.656** 0.673* ‐0.627*** ‐0.488** ‐0.776*** (0.228) (0.350) (0.042) (0.205) (0.077)Sample History History Modern History Modern All No Japan All All AllObservations 14 11 8 19 15Rsquared 0.80 0.91 0.99 0.59 0.95Robust standard errors in parentheses. Constant terms not reported. * significant at 10%; ** significant at 5%; *** significant at 1%.

55
0
500
1000
1500
2000
2500
3000
3500
4000
4500
5000
1825 1830 1835 1840 1845 1850 1855 1860 1865
Value of Trad
e (Brit. Pounds, 1000s
Figure 1. China's Imports from Great Britain, 1828 to 1860
0
500000
1000000
1500000
2000000
1860 1870 1880 1890 1900 1910 1920 1930 1940
Haekw
an Taels (000s)
Figure 2. China's Foreign Trade, 1865 to 1940
Imports Exports
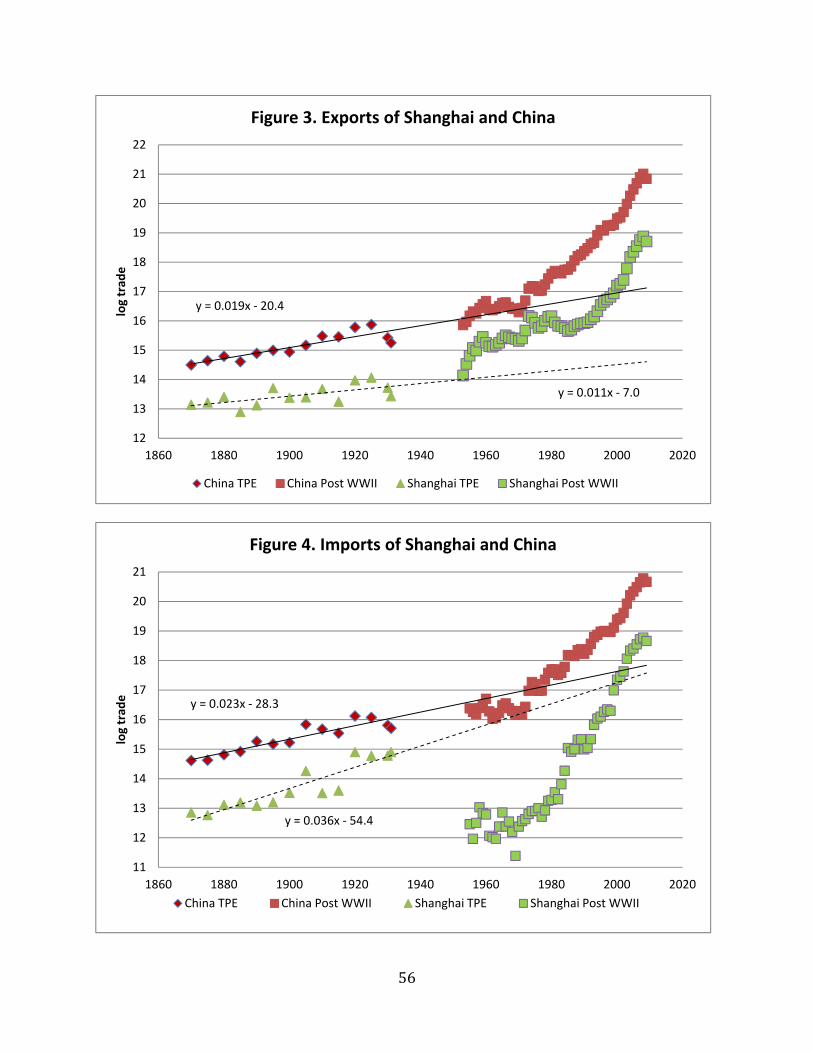
56
y = 0.019x ‐ 20.4
y = 0.011x ‐ 7.0
12
13
14
15
16
17
18
19
20
21
22
1860 1880 1900 1920 1940 1960 1980 2000 2020
log trad
eFigure 3. Exports of Shanghai and China
China TPE China Post WWII Shanghai TPE Shanghai Post WWII
y = 0.023x ‐ 28.3
y = 0.036x ‐ 54.4
11
12
13
14
15
16
17
18
19
20
21
1860 1880 1900 1920 1940 1960 1980 2000 2020
log trad
e
Figure 4. Imports of Shanghai and China
China TPE China Post WWII Shanghai TPE Shanghai Post WWII

57
0
0.1
0.2
0.3
0.4
0.5
0.6
0.7
0.8
1870 1875 1880 1885 1890 1895 1900 1905 1910 1915 1920 1925 1930
Figure 5. Shanghai's Share in China's Trade including Re‐Exports, 1870 to 1930
Share of China's imports of foreign goods
Share of China's Exports and Re‐Exports Going Abroad
0%
10%
20%
30%
40%
50%
60%
70%
80%
90%
100%
1865 ‐ 1925 1990 ‐ 2009
Figure 6A. Shanghai's Foreign Exports: Breakdown into Local Production and Re‐exports By Time Period
Re‐exports Exports of Local Production

58
y = 0.027x ‐ 37.0
y = 0.016x ‐ 17.1
12.6
12.8
13
13.2
13.4
13.6
13.8
14
14.2
14.4
14.6
1860 1870 1880 1890 1900 1910 1920 1930
log trad
e ($US 2006)
Figure 6B. Shanghai Re‐Exports and Exports Abroad, 1870 to 1925
Shanghai Re‐Exports Shanghai Local Production Exports
y = 0.199x ‐ 373.1
y = 0.169x ‐ 313.0
22
22.5
23
23.5
24
24.5
25
25.5
26
26.5
1985 1990 1995 2000 2005 2010 2015
log trad
e
Figure 6C. Shanghai Re‐Exports and Exports Abroad, 1990 to 2009
Re‐exports Exports Linear (Re‐exports) Linear (Exports)
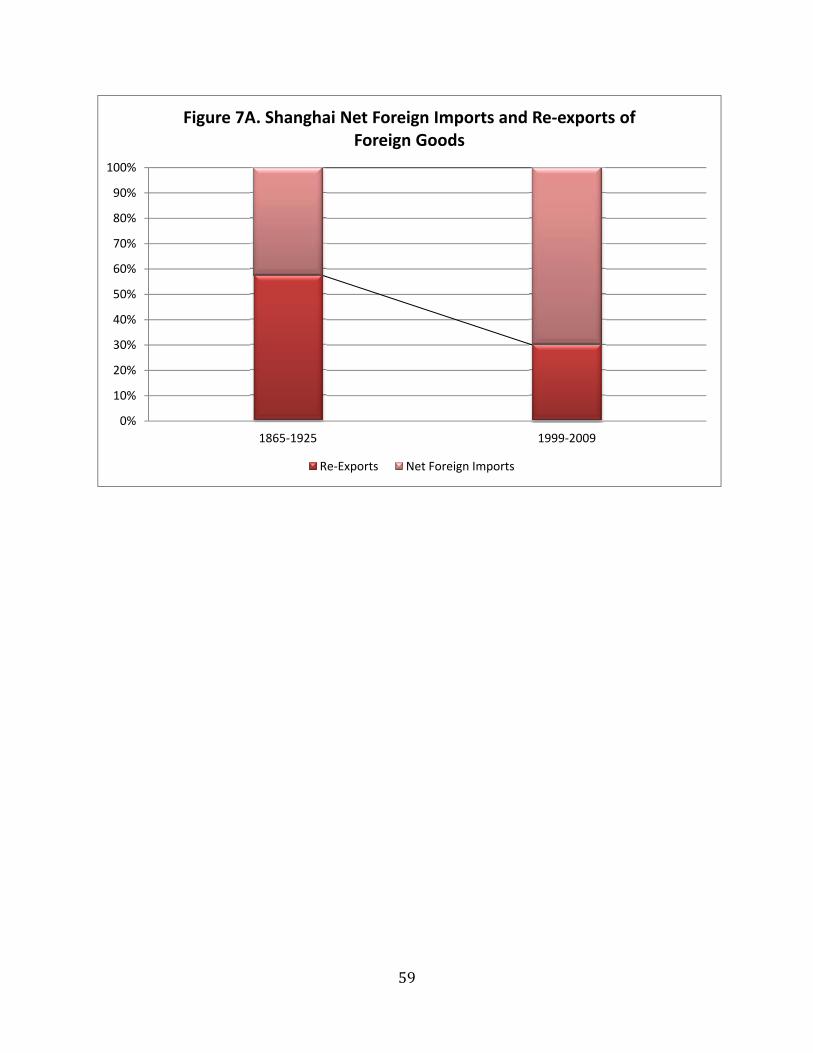
59
0%
10%
20%
30%
40%
50%
60%
70%
80%
90%
100%
1865‐1925 1999‐2009
Figure 7A. Shanghai Net Foreign Imports and Re‐exports of Foreign Goods
Re‐Exports Net Foreign Imports

60
y = 0.013x ‐ 10.8
y = 0.037x ‐ 55.8
12
12.5
13
13.5
14
14.5
15
15.5
1860 1870 1880 1890 1900 1910 1920 1930
log trad
e ($2006)
Figure 7B. Shanghai Net Foreign Imports and Re‐exports, 1870 ‐ 1925
Re‐exports of Foreign Imports Net Foreign Imports
Linear (Re‐exports of Foreign Imports) Linear (Net Foreign Imports)
y = 0.134x ‐ 244.1
y = 0.182x ‐ 340.5
23
23.5
24
24.5
25
25.5
26
26.5
1998 2000 2002 2004 2006 2008 2010
log trad
e ($US 2006)
Figure 7C. Shanghai Net Foreign Imports and Re‐exports, 1999 ‐ 2009
Re‐Exports Net Foreign Imports
Linear (Re‐Exports) Linear (Net Foreign Imports)
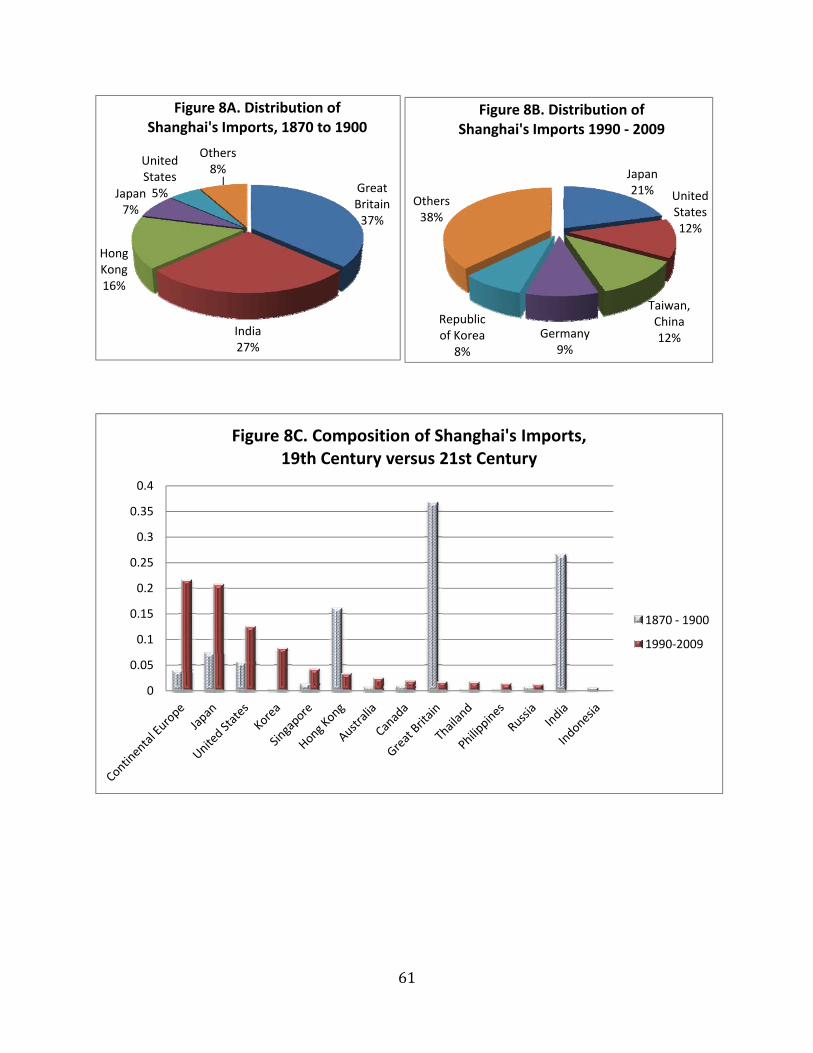
61
Great Britain37%
India27%
Hong Kong16%
Japan7%
United States5%
Others8%
Figure 8A. Distribution of Shanghai's Imports, 1870 to 1900
Japan21% United
States12%
Taiwan, China12%Germany
9%
Republic of Korea
8%
Others38%
Figure 8B. Distribution of Shanghai's Imports 1990 ‐ 2009
0
0.05
0.1
0.15
0.2
0.25
0.3
0.35
0.4
Figure 8C. Composition of Shanghai's Imports, 19th Century versus 21st Century
1870 ‐ 1900
1990‐2009
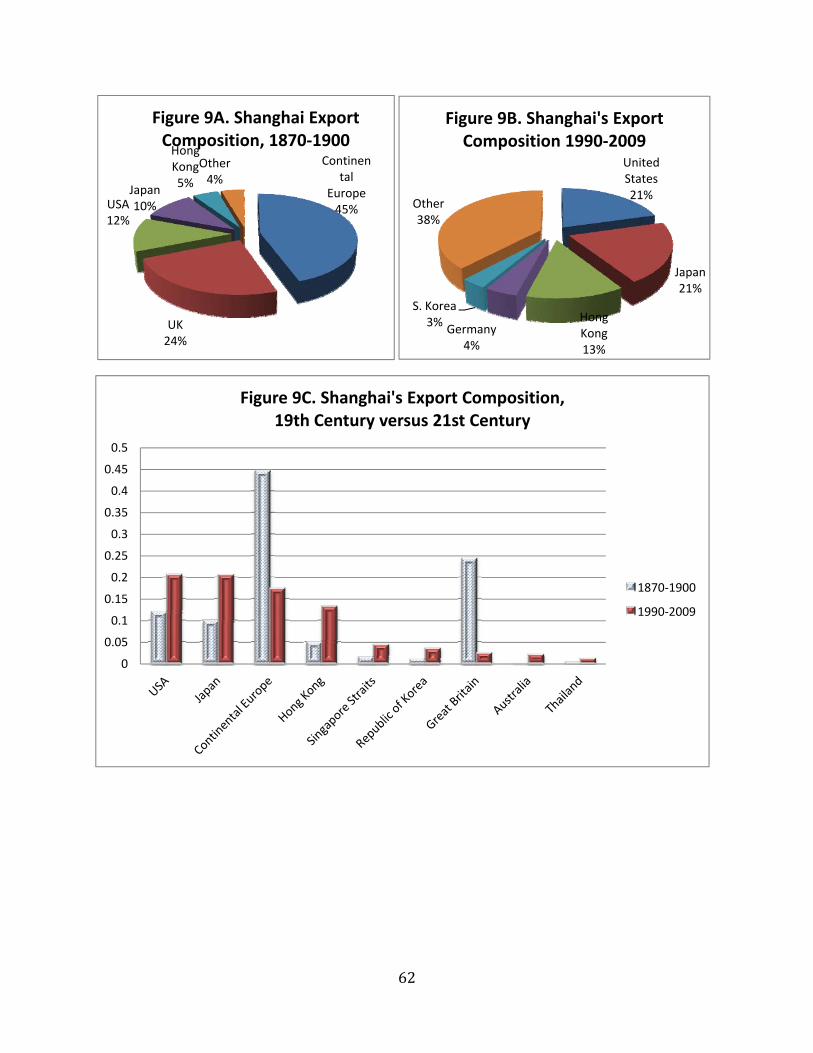
62
Continental
Europe45%
UK24%
USA12%
Japan10%
Hong Kong5%
Other4%
Figure 9A. Shanghai Export Composition, 1870‐1900
United States21%
Japan21%
Hong Kong13%
Germany4%
S. Korea3%
Other38%
Figure 9B. Shanghai's Export Composition 1990‐2009
0
0.05
0.1
0.15
0.2
0.25
0.3
0.35
0.4
0.45
0.5
Figure 9C. Shanghai's Export Composition,19th Century versus 21st Century
1870‐1900
1990‐2009

63
y = 0.0004x + 19.7
y = 0.12x ‐ 215.3
5
7
9
11
13
15
17
19
21
23
1860 1880 1900 1920 1940 1960 1980 2000 2020
log gross im
ports ($US 2006)
Figure 10A. Shanghai Imports from Great Britain, 1865 to 2009
Great Britain_H Great Britain_M
y = 0.081x ‐ 134.9y = 0.133x ‐ 242.5
0
5
10
15
20
25
30
35
40
1850 1900 1950 2000 2050 2100
log gross im
ports ($US 2006)
Figure 10B. Shanghai's Imports from Continental Europe
Continental Europe_H Continental Europe_M
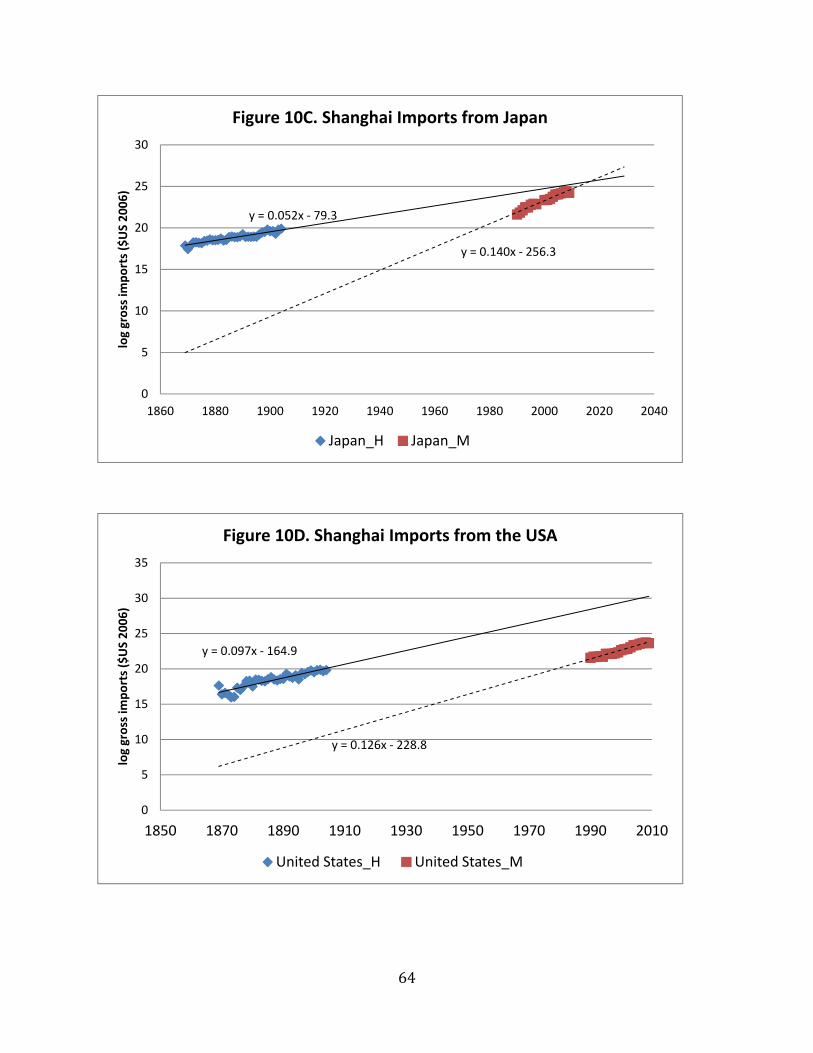
64
y = 0.052x ‐ 79.3
y = 0.140x ‐ 256.3
0
5
10
15
20
25
30
1860 1880 1900 1920 1940 1960 1980 2000 2020 2040
log gross im
ports ($US 2006)
Figure 10C. Shanghai Imports from Japan
Japan_H Japan_M
y = 0.097x ‐ 164.9
y = 0.126x ‐ 228.8
0
5
10
15
20
25
30
35
1850 1870 1890 1910 1930 1950 1970 1990 2010
log gross im
ports ($US 2006)
Figure 10D. Shanghai Imports from the USA
United States_H United States_M

65
y = ‐0.089x + 185.3
16.5
17
17.5
18
18.5
19
19.5
20
20.5
1860 1865 1870 1875 1880 1885 1890 1895 1900 1905
Locally produced exports, logs, in $US 2006
Figure 11. Shanghai Exports to Great Britain, 1865 to 1900

66
y = 0.063x ‐ 100.3
10
12
14
16
18
20
22
24
26
28
1840 1860 1880 1900 1920 1940 1960 1980 2000 2020
Shan
ghai Direct Exports, $ US (2006), in
logs
Figure 12A. Shanghai Exports to USA, 1865 to 2009
USA Treaty Port Era USA Post WWII
Actual exports in 2009 about 40% of projected exports
y = 0.129x ‐ 226.7
y = 0.109x ‐ 194.4
10
15
20
25
30
35
1840 1860 1880 1900 1920 1940 1960 1980 2000 2020
locally produced exports, $US (2006), logs
Figure 12B. Shanghai's Exports to Japan, 1865 to 2009
Japan_H Japan_M

67
Figure 13: Projected and Actual Bilateral Trade Patterns
UK
USA
Singapore
Continental Europe
HK
Philippines
Japan
Mexico
Thailand
Egypt
1214
1618
20
12 14 16 18 20Fitted values
Exports 1904
Singapore
Continental EuropeHK
Japan
USA
UK
1416
1820
22
14 16 18 20 22Fitted values
Exports 1974
Japan
Egypt
Thailand
Singapore
Continental EuropeUSA
UK
HK
1618
2022
2426
16 18 20 22 24 26Fitted values
Exports 2004
Singapore
Japan
Thailand
HK
Egypt
Continental EuropUSA
UK
1618
2022
2426
16 18 20 22 24 26Fitted values
Exports 2009
UKUSA
Singapore
Continental Europe
HK
Philippines
Japan
ThailandEgypt
1214
1618
20
12 14 16 18 20Fitted values
Imports 1904
Singapore
HK
Japan
USA
UK
1015
2025
30
15 20 25 30Fitted values
Imports 1974
Japan
Thailand Singapore
Continental EuropeUSA
UKHK
1520
2530
15 20 25 30Fitted values
Imports 2004
Singapore
Japan
ThailandHK
Continental EuropeUSA
UK
1520
2530
15 20 25 30Fitted values
Imports 2009
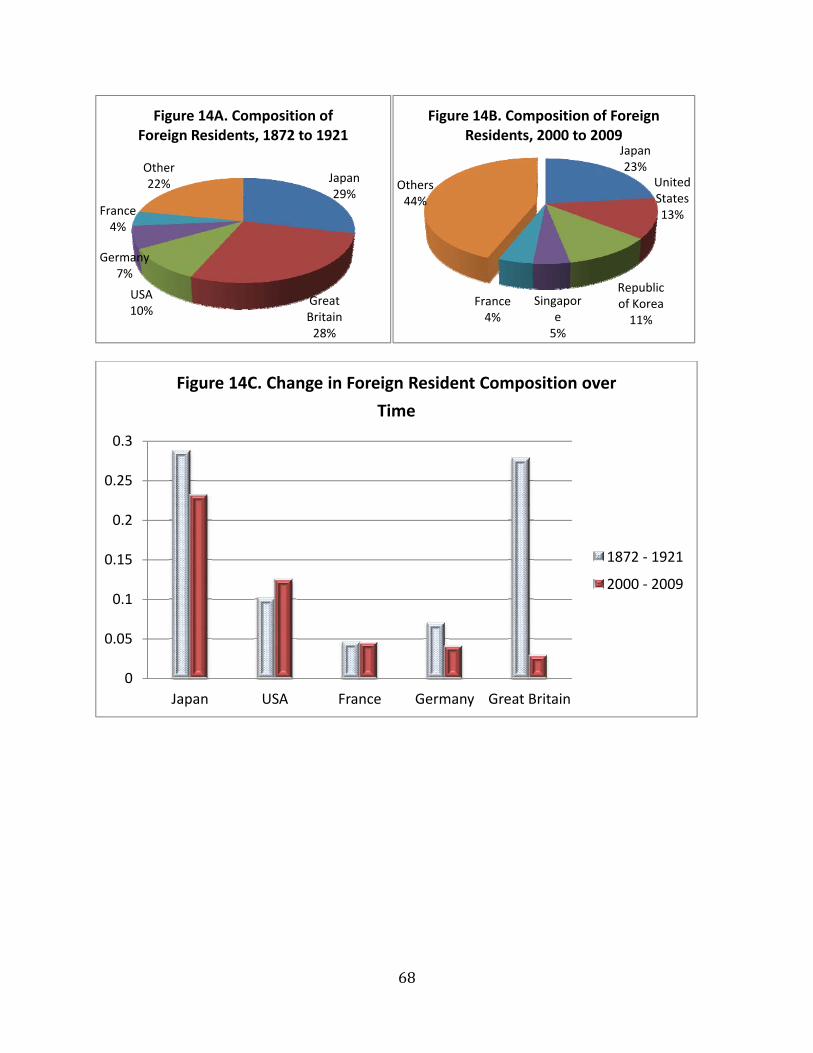
68
Japan29%
Great Britain28%
USA10%
Germany7%
France4%
Other22%
Figure 14A. Composition of Foreign Residents, 1872 to 1921
Japan23%
United States13%
Republic of Korea11%
Singapore5%
France4%
Others44%
Figure 14B. Composition of Foreign Residents, 2000 to 2009
0
0.05
0.1
0.15
0.2
0.25
0.3
Japan USA France Germany Great Britain
Figure 14C. Change in Foreign Resident Composition over
Time
1872 ‐ 1921
2000 ‐ 2009

69
y = 0.118x ‐ 216.4
0
5
10
15
20
25
1860 1880 1900 1920 1940 1960 1980 2000 2020
Number of Japan
ese Residents, logs
Figure 15A. Japanese Residents in Shanghai, 1891 to 2009
Japan Treaty Port Era Japan 2000s
y = 0.046x ‐ 80.3
y = 0.171x ‐ 332.6
4
5
6
7
8
9
10
11
12
13
14
1860 1880 1900 1920 1940 1960 1980 2000 2020 2040
Number of US Residents, logs
Figure 15B. U.S. Residents in Shanghai, 1872 to 2009
USA Treaty Port Era USA 2000s

70
y = 0.031x ‐ 50.6
y = 0.167x ‐ 326.4
4
5
6
7
8
9
10
11
12
13
1860 1880 1900 1920 1940 1960 1980 2000 2020 2040
British Residents in
Shan
ghai, logs
Figure 15C. British Residents in Shanghai, 1872 to 2009
Britain Treaty Port Era Britain 2000s
predicted 2009 number: 68,251actual 2009 number: 5,137
y = 0.022x ‐ 36.2
4
5
6
7
8
9
10
1860 1880 1900 1920 1940 1960 1980 2000 2020
Number of Germ
an residents, logs
Figure 15D. German Residents in Shanghai, 1872 to 2009
Germany Treaty Port Era Germany 2000s
predicted 2009 number: 6,238actual 2009 number: 7,253

71
Great Britain30%
Germany7%
USA11%
France4%
Japan35%
Other13%
Figure 16A. Share of Foreign Firms, 1872 to 1921
USA32%
Japan31%
Singapore
10%
Germany9%
UK7%
Others11%
Figure 16B. Composition of FDI between 1995 and 2009
0
0.05
0.1
0.15
0.2
0.25
0.3
0.35
USA Japan Germany Great Britain France
Figure 16C. Change in FDI Composition at Shanghai
1872 ‐ 1921
1995 ‐ 2009
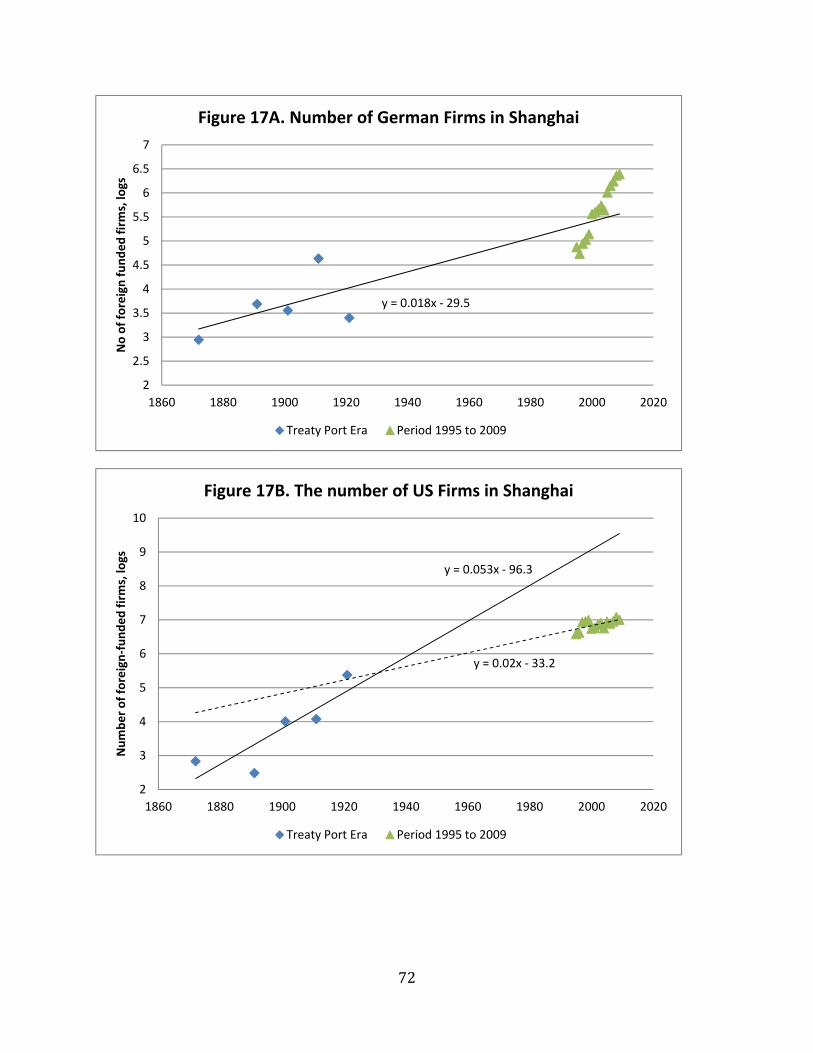
72
y = 0.018x ‐ 29.5
2
2.5
3
3.5
4
4.5
5
5.5
6
6.5
7
1860 1880 1900 1920 1940 1960 1980 2000 2020
No of foreign funded firms, logs
Figure 17A. Number of German Firms in Shanghai
Treaty Port Era Period 1995 to 2009
y = 0.053x ‐ 96.3
y = 0.02x ‐ 33.2
2
3
4
5
6
7
8
9
10
1860 1880 1900 1920 1940 1960 1980 2000 2020
Number of foreign‐funded firms, logs
Figure 17B. The number of US Firms in Shanghai
Treaty Port Era Period 1995 to 2009

73
y = 0.021x ‐ 34.3
y = 0.038x ‐ 70.2
0
1
2
3
4
5
6
7
8
1860 1880 1900 1920 1940 1960 1980 2000 2020
No of foreign funded firms, logs
Figure 17C. The Number of British Firms in Shanghai
Treaty Port Era Period 1995 to 2009
y = 0.032x ‐ 56.5
y = 0.104x ‐ 204.8
‐15
‐10
‐5
0
5
10
15
1850 1900 1950 2000 2050
No of foreign funded firms, logs
Figure 17D. The Number of French Firms in Shanghai
Treaty Port Era Period 1995 to 2009

74
‐1.5
‐1
‐0.5
0
0.5
1
1.5
2
2.5
3
3.5
1860 1880 1900 1920 1940 1960 1980 2000 2020
Exports plus Im
ports per Cap
ita, log
Figure 18A. Shanghai's Per‐Capita Foreign Trade, 1870 to 2009
Ratio of Trade to Population 2 per. Mov. Avg. (Ratio of Trade to Population)
0
0.2
0.4
0.6
0.8
1
1.2
1.4
1.6
0
0.002
0.004
0.006
0.008
0.01
0.012
0.014
0.016
1870
1875
1880
1885
1890
1895
1900
1905
1910
1915
1920
1925
1930
1955
1960
1965
1970
1975
1980
1985
1990
1995
2000
2005
2009
Trad
e Share
Population Share
Year
Figure 18B. Shanghai's Trade and Population Share of China over Time
Shanghai's Population Share Shanghai Trade Share

75
0
0.002
0.004
0.006
0.008
0.01
0.012
0.014
0.016
0 0.05 0.1 0.15 0.2 0.25 0.3 0.35
Population Share
Trade Share
Figure 18C. Shanghai's Trade versus its Population Share
1870 to 1930
1955 to 2009
0
2
4
6
8
10
12
14
16
18
20
1860 1880 1900 1920 1940 1960 1980 2000 2020
Figure 19. China's Share of World GDP Explained by Openness
China Openness China's Share in World GDP Shanghai Openness


