
1
SESAME-KM3 Cruise Report 11 – 25 March 2008
Edited by K. Schroeder and M. Borghini
Consiglio Nazionale delle Ricerche - IAMC
Consiglio Nazionale delle Ricerche - IBF
Stazione Zoologica Anton Dohrn
Ente Nazionale Energia e Ambiente
CNR ISMAR – Istituto di
Scienze Marine

Cruise Report SESAME-KM3
2

Cruise Report SESAME-KM3
3
Contents
Cruise Details 4
Scientific Staff 5
Scientific Objectives 6
Scientific Background 7
General Description
The Ionian Sea
The Sicily Strait
Cruise Plan 9
Cruise Maps 11
Cruise Stations 12
Sampling Strategy 14
Onboard Operations 15
CTD casts
LADCP
Inorganic Nutrients
DOC-CDOM
Chlorophyll and pigments
POC
POP
DOP and DON
Mesozooplankton
Optical Profiles
Ichthyoplankton
Caesium-137
Recovering and deployment of moorings
Vessel-mounted ADCPs
Preliminary results 20
Weather conditions
Hydrology
The Sicily Strait
The Ionian Sea
Eulerian measurments
Cruise Report SESAME-KM3
4
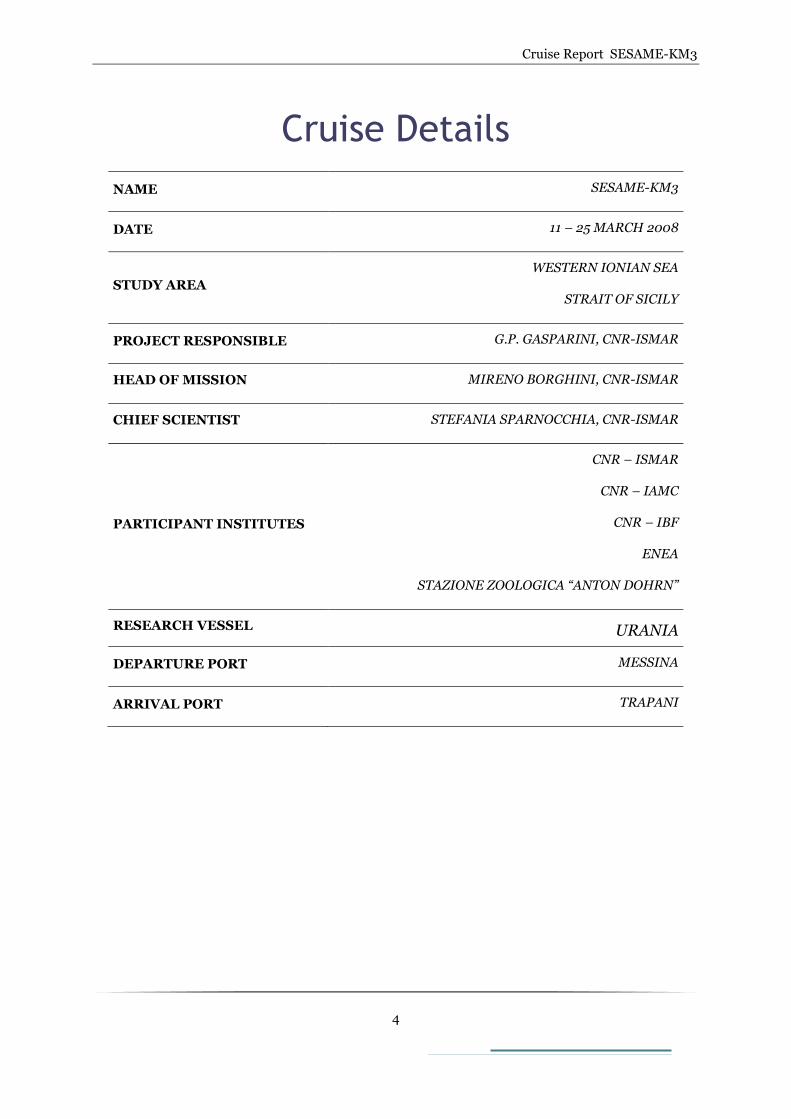
Cruise Details
NAME SESAME-KM3
DATE 11 – 25 MARCH 2008
STUDY AREA
WESTERN IONIAN SEA
STRAIT OF SICILY
PROJECT RESPONSIBLE G.P. GASPARINI, CNR-ISMAR
HEAD OF MISSION MIRENO BORGHINI, CNR-ISMAR
CHIEF SCIENTIST STEFANIA SPARNOCCHIA, CNR-ISMAR
PARTICIPANT INSTITUTES
CNR – ISMAR
CNR – IAMC
CNR – IBF
ENEA
STAZIONE ZOOLOGICA “ANTON DOHRN”
RESEARCH VESSEL URANIA
DEPARTURE PORT MESSINA
ARRIVAL PORT TRAPANI

Cruise Report SESAME-KM3
5
Scientific Staff
CNR-ISMARSezione La Spezia c/o ENEA–Santa Teresa I-19036 Pozzuolo di Lerici (SP) tel: +39.0187.978300 fax: +39.0187.970585
Sezione Talassografico viale Romolo Gessi 2 34123 Trieste, Italia tel. +39 040 305617 fax: +39.040 308941
Borghini Mireno Technician
Bacciola Domenico Technician
Gasparini Gian Pietro Researcher
Schroeder Katrin Researcher
Polonelli Francesca Researcher
Sparnocchia Stefania
Researcher
CNR-IAMCVia Vaccara 61 91026 Mazara del Vallo Italia tel: +39. 0923/948966 fax: +39. 0924/906634
CNR-IBF
ENEA
STAZIONE ZOOLOGICA ANTON DOHRN
Patti Carlo Researcher
De Luca Biagio Researcher
Via G. Moruzzi 1 -San Cataldo 56124 Pisa Italia tel. +39.050 - 3152578/3 fax. +39.050 - 3152760
Nannicini Luciano Technician
ENEA–ACS ClimMed Forte Santa Teresa 19036 Pozzuolo di Lerici (SP) tel: +39.0187.978204 fax: +39.0187273
Difesca Vito Technician
Villa Comunale 80121 Napoli tel: +39.0815833111 fax: +39.0817641355
Mazzocchi Maria Grazia Researcher
Prato Oleana Student

Cruise Report SESAME-KM3
6
Scientific Objectives
This report presents the preliminary results obtained during the SESAME-KM3 cruise, carried out
from 11th – 25th March 2008, on board of the Italian R/V URANIA in the Western Ionian Sea and in
the Strait of Sicily.
The cruise was addressed to acquire information on physical, biological and geochemical processes of
the water column. It was planned in the framework of two different projects:
1. KM3Net: During the last years, the European Commission has approved the funding for the
project stage of an enormous astronomic telescope, based on the detection of the neutrino. The
Italian collaboration Nemo has the aim to present a competitive solution of the whole detector,
called Nemo Km3. There are also other European proposals, like Nestor in Greece and Antares
in France, which lay on the same physical principle and has developed for the past ten years
the independent project VLVNT (very large volume neutrino telescope). Only recently a
European collaboration has started, which is called Km3net, in which the research experiences
of the three solution are integrated and which is funded by the EC.
2. SESAME – Southern European Seas: Assessing and Modelling Ecosystem changes: SESAME
aims to assess and predict changes in the Southern European Seas (Mediterranean and Black
Sea) ecosystems and in their ability to provide key goods and services with high societal
importance, such as tourism, fisheries, ecosystem biodiversity and mitigation of climate
change through carbon sequestration in water and sediments. In particular we are involved in
the workpackage WP3, which deals with data collection for model definition and validation in
sub-regional seas. In this particular case the area investigated was the Sicily Strait.
In this two frameworks, the cruise was planned in order to achieve the following objectives:
1. The physical cruise in the western Ionian is intended to provide updated information on the
hydrology in the KM3 area and to recover for maintenance three moorings, and to redeploy
them immediately.
2. The multidisciplinary cruise along a transect from Tunisia to Sicily is intended to provide CTD,
nutrients, chlorophyll, phytoplankton, zooplankton and ichthyoplankton data. Current-meter
moorings along the western sill of the Sicily Straits, which permit continuous monitoring of
the surface and the deep currents, had to be recovered and re-deployed.

Cruise Report SESAME-KM3
7
Scientific Background
General Description
The Ionian Sea The Ionian Sea is one of the eastern basins. It is bordered by Italy, Greece, Libya and Tunisia and has a
volume of 10.8 x 10⁴ km3. The basin is connected to the Cretan Sea through the Straits of Kithira
(depth 160 m and width 33 km) and of Antikithira (depth 700 m and width 32 km), to the Levantine
Basin through the Cretan Passage, to the Adriatic Sea through the Otranto Strait (depth 780 m and
width 75 km) and to the Western Mediterranean through the Sicily Strait.
The thermohaline circulation of the eastern basin is composed of two cells. The first one is an internal
cell, deep and vertical, which involves the Ionian and the Levantine Basins. This deep thermohaline
cell, the “conveyor belt” of the Eastern Mediterranean, is maintained by a deep water source in the
Adriatic Sea, with the Eastern Mediterranean Deep Water (EMDW) reaching the Levantine Basin with
a renewal time of 126 years (Roether and Schlitzer 1991; Schlitzer et al., 1991; Roether et al., 1994).
During the 90’s it was observed also an other deep water source, located in the Aegean Sea (Roether et
al. 1996). The external cell comprises water exchanges between the eastern and the western basin and
with the North Atlantic. The Atlantic Water (AW), which enters the Mediterranean through the Strait
of Gibraltar, moves eastward, spreading through the entire Mediterranean Se, after passing the Sicily
Strait, occupying a layer of about 200 m depth. At the same time, the Levantine Intermediate Water
(LIW), which forms mainly in the north-eastern Levantine Basin, moves westward, in a layer between
200 and 600 m depth, exiting the Mediterranean towards the North Atlantic, where it constitutes the
well-known MOW (Mediterranean Outflow Water). In the Ionian Sea there are water and property
exchanges with the Levantine Basin, in the East, and with the Aegean Basin, in the North. It is
therefore considered a transition basin for all eastern water masses, where they are subject to
important mixing and transformation processes during their pathway.
The main Ionian water masses are the Atlantic Water (AW), which moves eastward from the Sicily
Strait, in the surface layer and is normally identified by a subsurface salinity minimum, between 30 m
and 200 m depth. Below the AW, there is the Levantine Intermediate Water (LIW), which enters the
Ionian Sea through the Cretan Passage, spreading westward from its formation site, the north-eastern
Levantine Basin. The LIW is identified by its salinity maximum, between 200 and 600 m depth. The
abyssal layer, below 1600 m, is occupied by the Eastern Mediterranean Deep Water (EMDW), colder
and less saline, that forms mainly in the Adriatic Sea. In the layer comprised between 700 m and 1600
m, we find a transition water mass, with intermediate properties between the LIW and the EMDW. To
these water masses, we have to add the Ionian Surface Water, ISW, which is clearly distinguishable
from the AW in summer in the surface layer, being warmer and saltier than the AW.
The deep EMDW has well-defined core properties, because it is less influenced by the transformation
processes. On the other hand, the distinguishing properties of the AW and the LIW has modified
during their pathway, and depend on the distance from their formation sites. In the table, the AW and
LIW properties in the eastern sub-basins are indicated (from literature, Manzella et al., 1988; De Maio

Cruise Report SESAME-KM3
8
et al., 1990; Moretti et al., 1993; Ozsoy et al., 1993; Theocharis et al., 1993; Malanotte-Rizzoli et al.,
1997).
The Sicily Strait The Sicily Strait, which present the connection between western and eastern sub-basins has a central
role in the Mediterranean circulation. The Strait is a topographically complex region consisting of two
sill systems separated by an internal deep basin (fig. 1): the eastern sill with a maximum depth of
about 540 m connects the Strait with the Ionian Basin, the central basin presents deep trenches
deeper than 1700 m, while the western sill is composed of two narrow passages, which have a
maximum depth of 530 m. The entire region has a minimum width of 140 km and a total length of 600
km. The width of the Strait, significantly large at the surface, sensibly reduces in depth.
Dynamically, the Strait is a two layer system: the surface layer (about 200 m thick) is occupied by the
Atlantic Water (AW), moving eastward, while the deep layer, occupied by the Levantine Intermediate
Water (LIW), flows in the opposite direction. The dynamics of the Strait is rather complex: the surface
layer (AW) is dominated by mesoscale processes, while for the underlying layers the topography plays
a key role. The Bernoulli effect associated to the high LIW velocity permits the Ionian deep water,
laying at a greater depth, to cross the eastern and the western sills and to reach the western basin
(Astraldi et al., 2001). In literature this water mass is called the transitional Eastern Mediterranean
Deep Water (tEMDW). The high depth permits the central region to act as an intermediate reservoir
between the eastern and the western sills, especially for the subsurface waters. Important mixing is
also observed in correspondence of the sills, where high velocities induce significant entrainment
effects with the surrounding waters (Iudicone et al., 2003; Stansfield et al., 2003).
Figure 1 Bathymetry of the investigated area (data from GEBCO, British Oceanographic Data
Centre).

Cruise Report SESAME-KM3
9
Cruise Plan
The following table summarizes the parameters that have been measured and the sampling group
involved in the operation, while table 2 lists the sampling equipment and the methods of analysis.
Parameters/Instruments Working Group
CTD/O2/Fluorescence/Trasmissometer/rosette CNR-ISMAR
Salinity CNR-ISMAR
Dissolved Oxygen CNR-ISMAR
NO3, PO4, SiO4 ENEA
DOC-CDOM CNR-IBF
Chlorophyll a Stazione Zoologica
HPLC pigments Stazione Zoologica
POC ENEA
PON, POP ENEA
DON, DOP ENEA
mesozooplankton abundance, biomass and
biodiversity Stazione Zoologica
phytoplankton abundance and
composition Stazione Zoologica
Optical profiles (absorption m-1) Stazione Zoologica
Ichtyoplankton CNR-IAMC
Caesium-137 ENEA
ADCP CNR-ISMAR
LADCP CNR-ISMAR
Meteo station on board CNR-ISMAR
Table 1 Measured Parameters

Cruise Report SESAME-KM3
10
Small-Volume Sampling General Oceanics 24-place rosette with 10-liter bottles
CTD System CTD SBE 911 plus
Salinometer GUILDLINE AUTOSAL
Dissolved Oxygen Winkler titration
NO3, P04, SiO4 Samples only, no on board analyses
DOC-CDOM Water samples and filtration only, no on board analyses
Chlorophyll a Water samples and filtration only, no on board analyses
HPLC pigments Water samples and filtration only, no on board analyses
POC Water samples and filtration only, no on board analyses
PON, POP Water samples and filtration only, no on board analyses
DON, DOP Water samples and filtration only, no on board analyses
mesozooplankton
Net cast
phytoplankton Net cast
Optical profiles (absorption m-1) AC9 - Satlantic
Ichtyoplankton Net cast
Caesium-137 Water samples and fixation
ADCP RDI WH 300 kHz, RDI OS 75 kHz
LADCP RDI WH 300 kHz
Meteo station on board AANDERAA
The track is shown in Figure 2. We planned to spend 15 days at sea. The geographic boundaries of the
survey are 35.00 °N - 39 °N latitude and 10 °E - 17 °E longitude.
The station list is shown in table 3.
Table 2 Sampling equipment and analysis methods

Cruise Report SESAME-KM3
11
Cruise Maps
Figure 2 Station map (above) and navigation track (below)

Cruise Report SESAME-KM3
12
Cruise Stations
Station Lon (°E) Lat (°N) Depth (m) ACTIVITY
406 12.003 37.581 151 Ctd – Ladcp – Oxygen - Nutrients
432 12.333 37.732 169 Ctd – Ladcp – Oxygen - Nutrients
433 11.923 37.514 107 Ctd – Ladcp – Oxygen - Nutrients
434 11.744 37.416 87 Ctd – Ladcp
438 11.830 37.460 76 Ctd – Ladcp – Oxygen - Nutrients
kc1 16.091 36.316 3391 Ctd - Ladcp
km3 15.834 36.500 3383 Ctd – Ladcp-Caesium-Nutrients-Oxygen
km4 16.101 36.266 3426 Ctd - Ladcp-Nutrients-Oxygen
nk2 16.300 36.367 3408 Ctd - Ladcp
nk4 16.001 36.333 3418 Ctd - Ladcp-Salinity-Nutrients-Oxygen
nk5 15.833 36.375 3469 Ctd - Ladcp
nk6 15.656 36.402 3347 Ctd - Ladcp -Nutrients-Oxygen
nk7 15.583 36.417 1192 Ctd - Ladcp
nk8 15.516 36.434 1192 Ctd - Ladcp-Nutrients-Oxygen
nk9 15.466 36.433 343 Ctd - Ladcp
P01 11.921 37.012 111 Ctd – Ladcp – Oxygen - Nutrients
P02 11.866 36.966 452 Ctd – Ladcp – Oxygen - Nutrients
P03 11.800 36.914 662 Ctd – Ladcp – Oxygen - Nutrients
p04 11.741 36.858 666 Ctd – Ladcp - Nutrients
p05 11.683 36.816 448 Ctd – Ladcp – Oxygen - Nutrients
nk12 16.001 36.600 3233 Ctd - Ladcp-Salinity-Nutrients-Oxygen
nk13 15.833 36.668 3275 Ctd - Ladcp
nk14 15.642 36.716 2890 Ctd - Ladcp-Salinity-Nutrients-Oxygen
nk15 15.535 36.750 2927 Ctd - Ladcp
nk16 15.449 36.783 2460 Ctd - Ladcp-Salinity-Nutrients-Oxygen
nk17 15.258 36.863 512 Ctd - Ladcp-Salinity-Nutrients-Oxygen
nk18 15.366 36.819 2306 Ctd - Ladcp-Salinity-Nutrients-Oxygen
nk40 15.290 36.850 943 Ctd - Ladcp
S-it3-001 13.716 37.083 3470 Ctd - Ladcp
S_it3-002 13.649 36.999 465 Ctd – Ladcp - Doc- Zoo-Dop-Pop – Don –Pon –Poc-Ac9 – Satlantic.
S-it3-003 13.434 36.766 326 Ctd – Ladcp - Doc- Zoo-Dop-Pop – Don –Pon –Poc-Ac9 .
Cruise Report SESAME-KM3
13
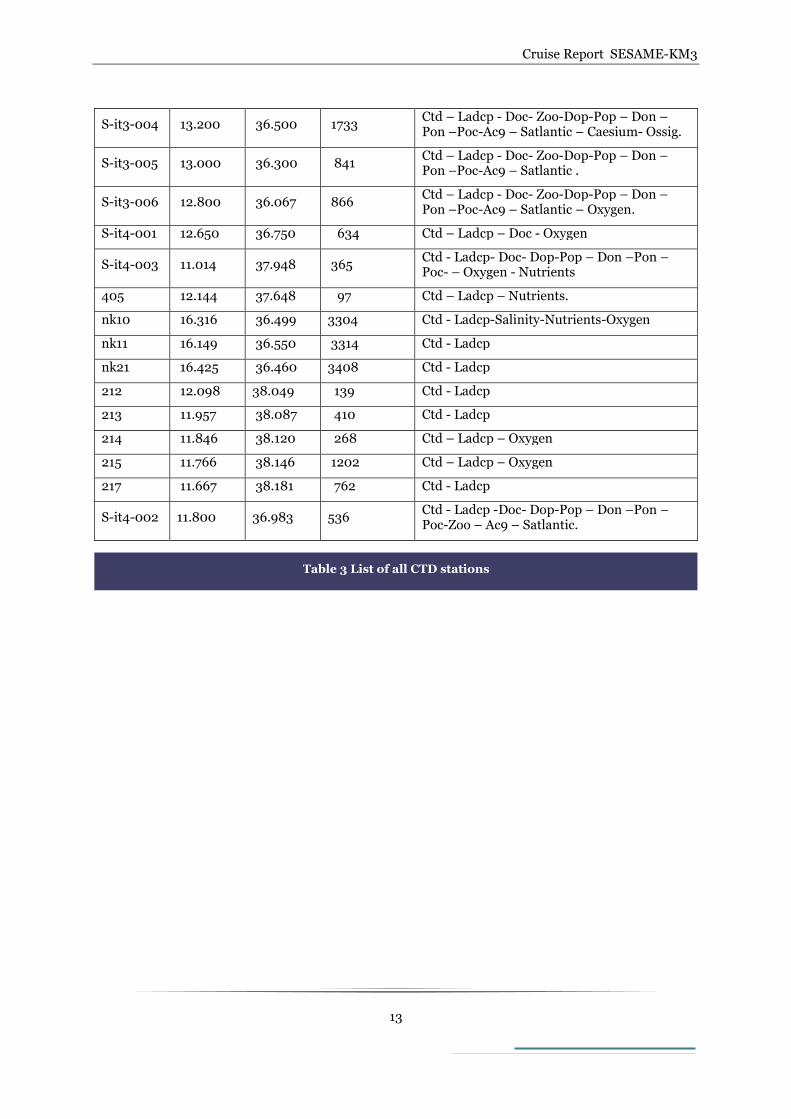
S-it3-004 13.200 36.500 1733 Ctd – Ladcp - Doc- Zoo-Dop-Pop – Don –Pon –Poc-Ac9 – Satlantic – Caesium- Ossig.
S-it3-005 13.000 36.300 841 Ctd – Ladcp - Doc- Zoo-Dop-Pop – Don –Pon –Poc-Ac9 – Satlantic .
S-it3-006 12.800 36.067 866 Ctd – Ladcp - Doc- Zoo-Dop-Pop – Don –Pon –Poc-Ac9 – Satlantic – Oxygen.
S-it4-001 12.650 36.750 634 Ctd – Ladcp – Doc - Oxygen
S-it4-003 11.014 37.948 365 Ctd - Ladcp- Doc- Dop-Pop – Don –Pon –Poc- – Oxygen - Nutrients
405 12.144 37.648 97 Ctd – Ladcp – Nutrients.
nk10 16.316 36.499 3304 Ctd - Ladcp-Salinity-Nutrients-Oxygen
nk11 16.149 36.550 3314 Ctd - Ladcp
nk21 16.425 36.460 3408 Ctd - Ladcp
212 12.098 38.049 139 Ctd - Ladcp
213 11.957 38.087 410 Ctd - Ladcp
214 11.846 38.120 268 Ctd – Ladcp – Oxygen
215 11.766 38.146 1202 Ctd – Ladcp – Oxygen
217 11.667 38.181 762 Ctd - Ladcp
S-it4-002 11.800 36.983 536 Ctd - Ladcp -Doc- Dop-Pop – Don –Pon –Poc-Zoo – Ac9 – Satlantic.
Table 3 List of all CTD stations

Cruise Report SESAME-KM3
14
Sampling Strategy
The stations have been selected mainly based on previous knowledge and available literature. The
hydrological characteristics of the study area have been determined by CTD cast. The CTD profiles
were analysed onboard to precisely define the sampling depth along the water column.
In order to achieve information about the spatial variability of nutrients, DOC and the other
biogeochemical parameters a high-resolution sampling has been applied, at the standard depths (table
4).
Level Standard depths (m) 1 0 2 25 3 50 4 75 5 100 6 200 7 300 8 400 9 500 10 750 11 1000 12 1250 13 1500 14 1750 15 2000 16 2500 17 3000
Table 4 Standard depths

Cruise Report SESAME-KM3
15
Onboard Operations
CTD Casts
At all the hydrological stations, pressure (P), salinity (S), potential
temperature (θ) and dissolved oxygen concentration (DO) were measured
with a CTD-rosette system consisting of a CTD SBE 911 plus, and a
General Oceanics rosette with 24 12-l Niskin Bottles. Temperature
measurements were performed with a SBE-3/F thermometer, with a
resolution of 10-3 °C, and conductivity measurements were performed
with a SBE-4 sensor, with a resolution of 3 x 10⁻⁴ S/m. In addition,
salinities of water samples were analysed on board using a Guildline
Autosal salinometer. Dissolved oxygen was measured with a SBE-13
sensor (resolution 4.3 µM), and data were checked against Winkler
titration. The vertical profiles of all parameters were obtained by
sampling the signals at 24 Hz, with the CTD/rosette going down at a
speed of 1 m/s. The data were processed on board, and the coarse errors
were corrected.
Laboratory: ISMAR-CNR
LADCP
Two Lowered Acustic Doppler Current Profilers (LADCP) were used to measure
velocity profiles. We used two RDI Workhorse 300 kHz ADCP. For data post-
processing we used the LDEO LADCP (versione 8.1) software.
Laboratory: CNR-ISMAR
Inorganic Nutrients
Seawater samples for nutrient measurements were collected at different depths, when the system CTD
/rosette was going up, according to the vertical profiles of salinity, potential temperature and dissolved
oxygen, recorded in real time. Samples of 100 ml of seawater were collected at different depths and
immediately filtered through a polycarbonate filters (0.47 µm Ø and pore size 0.4 µm) under slight
vacuum. The filtered samples were transferred in 20 ml polyethylene vials and frozen at -20°C. The
analysis of inorganic nutrients will be performed in the laboratory on land by the AutoAnalyser AAIII
Bran+Luebbe (Grasshoff,1999).
Laboratory: ENEA

Cruise Report SESAME-KM3
16
DOC-CDOM
Seawater samples for DOC measurements were collected at different depths, during the CTD/rosette
up cast, according to the vertical profiles of salinity, potential temperature and dissolved oxygen,
recorded in real time. They were immediately filtered on board, through sterile 0.2 µm membrane
filters (Sartorius, Minisart, SM16534 K) under low N2 pressure and stored in amber glass bottles at 4
°C in the dark until the analysis. The conditioning of the filters was performed by rinsing with a 200 ml
aliquot of the seawater to be collected. DOC measurements will be carried out, in the laboratory
ashore, with a Shimadzu 5000 TOC Analyser, equipped with quartz combustion column with 1.2% Pt
on silica pillows of approximately 2 mm diameter (Santinelli et al., 2002).
Seawater samples for CDOM measurements were collected at different depths (surface to bottom).
CDOM measurements will be carried out, in the laboratory ashore, with a Perkin Elmer Lambda 25
Spectrophotometer, equipped with 100 mm quartz cells, in 260-700 nm wavelength range.
Laboratory: CNR-IBF
Chlorophyll and pigments
A HPLC analysis of particulate matter was programmed to investigate pigment composition of the
phytoplanktonic community. Water was collected with 12 L Niskin bottles from 10 depths in the
euphotic layer at each station. 2.5 L of water were then filtered on GF/F filters 25 mm in diameter by
means of a filtration apparatus connected to a pressure pump. Filters were put in liquid nitrogen to
store them on board. HPLC analysis will be performed in the Laboratoire d'Océanographie de
Villefranche/Mer (LOV – CNRS).
Laboratory: Stazione Zoologica Anton Dohrn
POC
Samples of 1-5 litres of seawater were collected at different depths above and below the Deep
Chlorophyll Maximum (DCM) and immediately filtered through pre-ignited (450 °C) 0.7 µm glass
fiber filters (25 mm Ø) under slight vacuum. Then the filter was frozen at –20 °C. Analysis will be
performed in the laboratory on land with a CHN Analyzer (Grasshoff et al., 1983).
Laboratory: ENEA
POP
Samples of 4 liters of seawater were collected at different depths above and below the Deep
Chlorophyll Maximum (DCM) and immediately filtered through pre-ignited (450° C) 0.7 µm glass
fiber filters (25 mm Ø) under slight vacuum. The filter was frozen at -20°C. Analysis of particulate

Cruise Report SESAME-KM3
17
organic phosphorus will be performed in the laboratory on land, after digestion of the filter, by the
AutoAnalyser AAIII Bran+Luebbe (Grasshoff,1999).
Laboratory: ENEA
DOP and DON
Samples of 100 ml of seawater were collected at different depths and immediately filtered through a
polycarbonate filters (0.47 µm Ø and pore size 0.4 µm) under slight vacuum. The filtered samples were
transferred in 20 ml polyethylene vials and frozen at -20°C. The analysis of dissolved organic
phosphorus and nitrogen will be performed in the laboratory on land by the AutoAnalyser AAIII
Bran+Luebbe (mineralization on line).
Laboratory: ENEA
Mesozooplankton
Meso-zooplankton samples for taxonomic identification and counts of
animals (species abundance), and total biomass (as dry weight) were
collected during the cruise. Samples were collected by vertical tows with a
closing WP2 net (56 cm diameter, 200 µm mesh aperture) in the following
depth layers: 200-100 m, 100-50 m, 50-0 m. Sampling was always
performed in light hours (8:20-17:30 local time). Each complete sampling
series lasted for about 1 hour. The volume of filtered sea water was
calculated from a flowmeter applied to the mouth of the net.
After collection, each sample was split in two halves (1/2) after careful
mixing with graduated beakers. One half was immediately fixed and
preserved in a formaldehyde-seawater solution (4% final concentration) to
be successively analyzed at the dissecting microscope in the laboratory on
land for species composition and abundance. The other half was kept fresh and sieved in succession on
nitex of 1000 µm, 500 µm e 200 µm mesh, in order to obtain the following size fractions: >1000 µm,
500-1000 µm , 200-500 µm. Each size fraction was then filtered on GF/C (pre combusted and
weighed) for biomass measurements as dry weight and carbon content (at CHN). Each filter with
zooplankton material was placed in a small plastic petri dish, dried in the oven at 60°C for a few hours
and then frozen at -20 °C until further processing in the lab.
Further meso-zooplankton samples were collected for DNA analyses of species to be successively
selected and sorted. At three stations a sample was collected in the layer 200-0 m with a vertical tow
performed with the same WP2 net (200 µm). The samples were successively concentrated on 1000 µm
(to separate jellies) and 200 µm nitex and the two size fractions (> 1000 µm and 200-1000 µm) were
separately preserved in ethyl alcohol (96%). After 24 and 48 hours, alcohol was drained off and
replaced with fresh alcohol. All samples were kept in the dark.
Laboratory: Stazione Zoologica Anton Dohrn
Cruise Report SESAME-KM3
18
Optical profiles
AC-9 was used to measure absorbance and total attenuation along vertical profiles in the water column
on 9 wavelengths between 410 and 680 nm. The instrument permits to obtain very useful data
connected with both biological parameters (phytoplanktonic biomass, dissolved organic material) and
hydrological ones (water masses). At each station 2 casts of the instrument were performed till an
approximate depth of 85 meters with a velocity of 0.4 m/s. Considering that the instruments acquires
both in the downcast and in the upcast, it was possible to obtain 4 profiles for each station.
A Satlantic spectroradiometer is used for spectral measurements of downwelling irradiance and
upwelling radiance, covering wavelengths from infrared to ultraviolet. It is a passive instruments (in
the sense that it doesn’t emit light) so it was necessary to acquire data in the central hours of the day,
when sunlight was at its maximum intensity. The instrument was cast manually from stern taking care
that ship shadow did not intercept the path. Data acquisition was limited to the downcast when
instrument tilt and velocity were more controlled. Generally two casts were made at each station to a
depth of about 100 meters or greater.
Laboratory: Stazione Zoologica Anton Dohrn
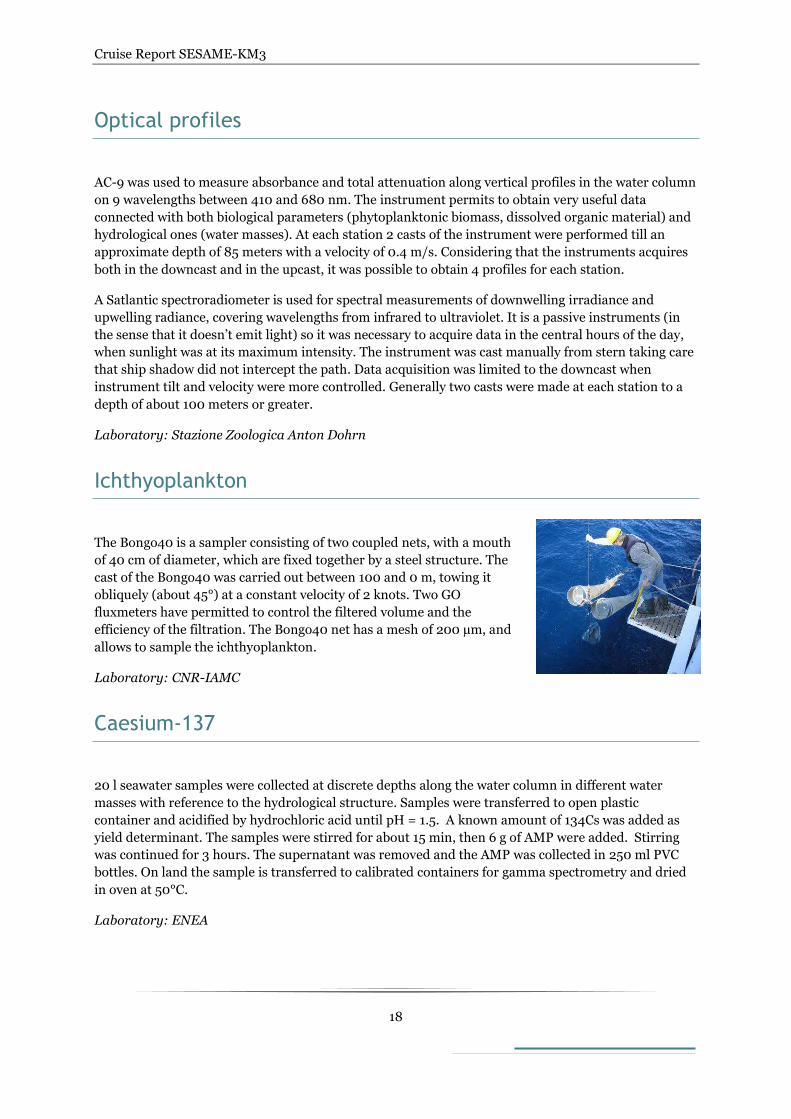
Ichthyoplankton
The Bongo40 is a sampler consisting of two coupled nets, with a mouth
of 40 cm of diameter, which are fixed together by a steel structure. The
cast of the Bongo40 was carried out between 100 and 0 m, towing it
obliquely (about 45°) at a constant velocity of 2 knots. Two GO
fluxmeters have permitted to control the filtered volume and the
efficiency of the filtration. The Bongo40 net has a mesh of 200 µm, and
allows to sample the ichthyoplankton.
Laboratory: CNR-IAMC
Caesium-137
20 l seawater samples were collected at discrete depths along the water column in different water
masses with reference to the hydrological structure. Samples were transferred to open plastic
container and acidified by hydrochloric acid until pH = 1.5. A known amount of 134Cs was added as
yield determinant. The samples were stirred for about 15 min, then 6 g of AMP were added. Stirring
was continued for 3 hours. The supernatant was removed and the AMP was collected in 250 ml PVC
bottles. On land the sample is transferred to calibrated containers for gamma spectrometry and dried
in oven at 50°C.
Laboratory: ENEA
Cruise Report SESAME-KM3
19
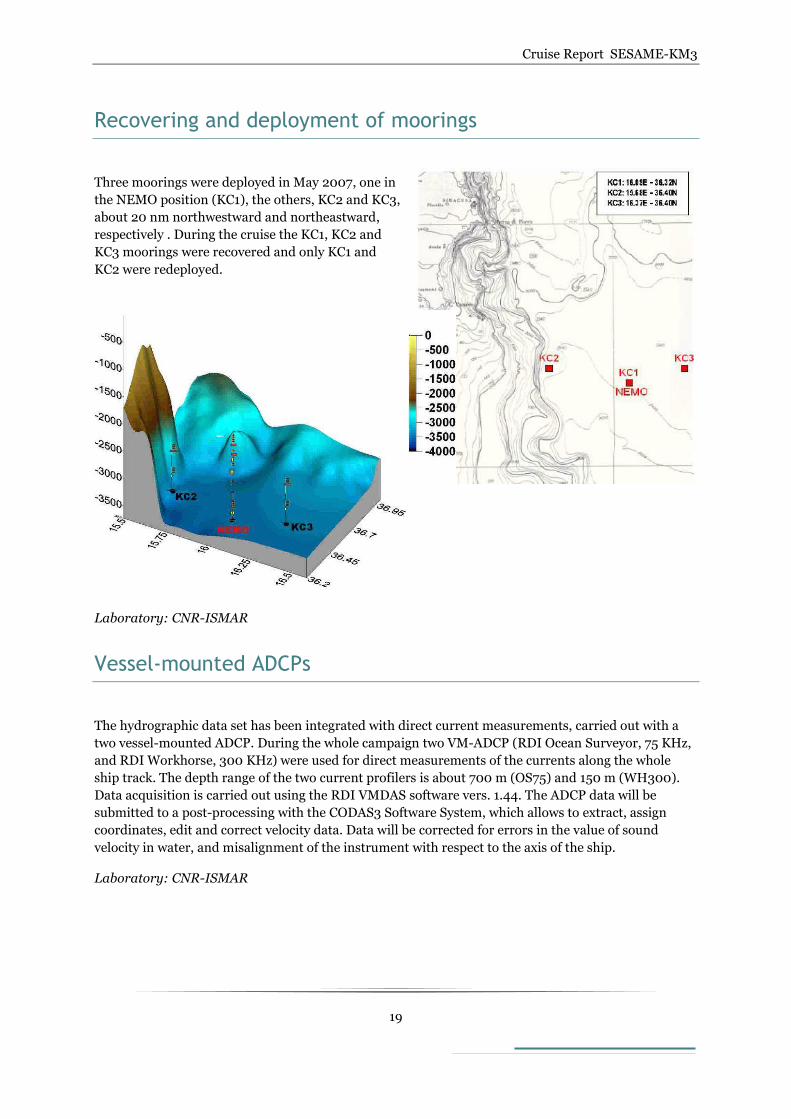
Recovering and deployment of moorings
Three moorings were deployed in May 2007, one in
the NEMO position (KC1), the others, KC2 and KC3,
about 20 nm northwestward and northeastward,
respectively . During the cruise the KC1, KC2 and
KC3 moorings were recovered and only KC1 and
KC2 were redeployed.
Laboratory: CNR-ISMAR
Vessel-mounted ADCPs
The hydrographic data set has been integrated with direct current measurements, carried out with a
two vessel-mounted ADCP. During the whole campaign two VM-ADCP (RDI Ocean Surveyor, 75 KHz,
and RDI Workhorse, 300 KHz) were used for direct measurements of the currents along the whole
ship track. The depth range of the two current profilers is about 700 m (OS75) and 150 m (WH300).
Data acquisition is carried out using the RDI VMDAS software vers. 1.44. The ADCP data will be
submitted to a post-processing with the CODAS3 Software System, which allows to extract, assign
coordinates, edit and correct velocity data. Data will be corrected for errors in the value of sound
velocity in water, and misalignment of the instrument with respect to the axis of the ship.
Laboratory: CNR-ISMAR

Cruise Report SESAME-KM3
20
Preliminary Results
Weather conditions
The diagrams in figure 3 show the sea and weather conditions during the cruise.
Figure 3 Evolution of the weather conditions between 11th and 21th March 2008 (air
temperature, sea temperature, relative humidity, air pressure, wind rose, irradiance)

Cruise Report SESAME-KM3
21
Hydrology
The Sicily Strait In the following some preliminary hydrological data and current measurements (LADCP data) of the
Sicily Strait are presented.
Hydrographic sections
Figure 4 Distribution of potential temperature, salinity, potential density and oxygen along the
transect 217-212 (above) and transect 434-432 (below)

Cruise Report SESAME-KM3
22
Figure 5 Distribution of potential temperature, salinity, potential density and oxygen along the
transect P5-P1 (above) and transect S-IT3-006 – S-IT3-001 (below)

Cruise Report SESAME-KM3
23
Potential Temperature vs Salinity Diagrams
Currents (U and V components)
Figure 7 Distribution of the measured velocity components U and V in m/s along transect
S-IT3-oo6 – S-IT3-001
Figure 6 Theta-S diagram of all station in the whole water column. Colours indicate oxygen
concentrations

Cruise Report SESAME-KM3
24
The Ionian Sea In the following some preliminary hydrological data and current measurements (LADCP data) of the
western Ionian Sea are presented.
Hydrographic sections
Figure 8 Distribution of potential temperature, salinity, potential density and oxygen along the
transect NK17-NK21 (above) and transect NK9-KM4 (below)
Cruise Report SESAME-KM3
25
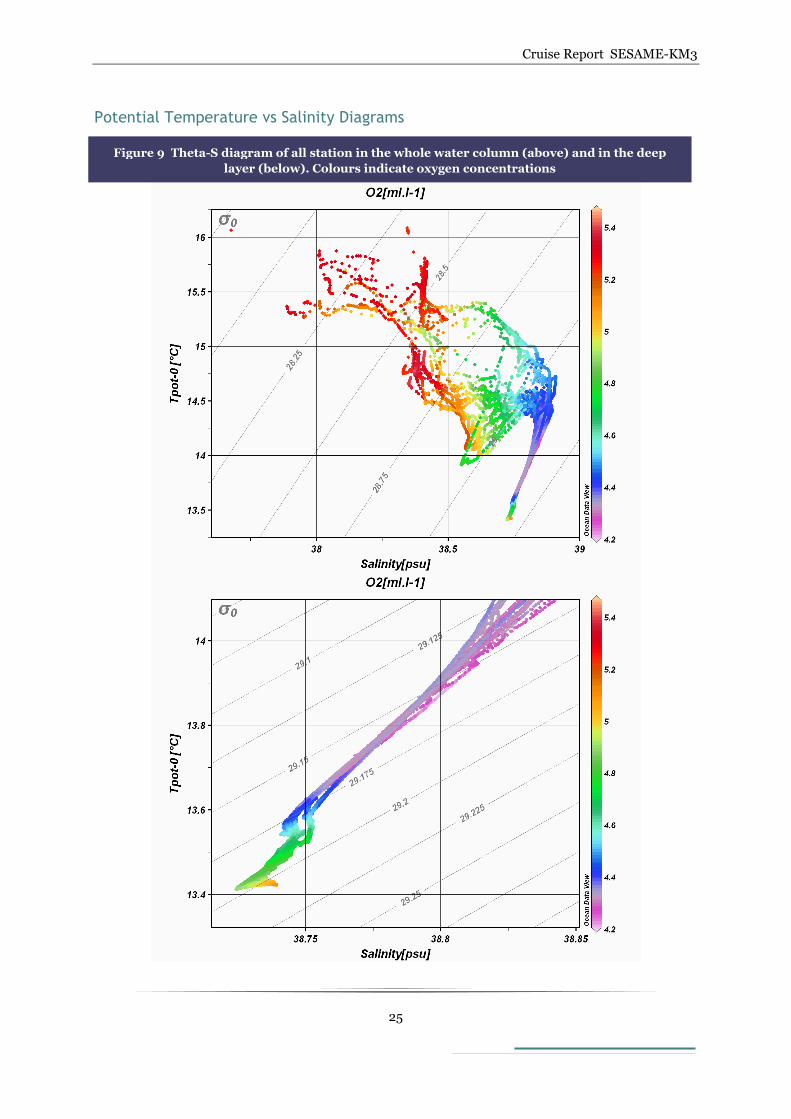
Potential Temperature vs Salinity Diagrams
Figure 9 Theta-S diagram of all station in the whole water column (above) and in the deep
layer (below). Colours indicate oxygen concentrations
Cruise Report SESAME-KM3
26
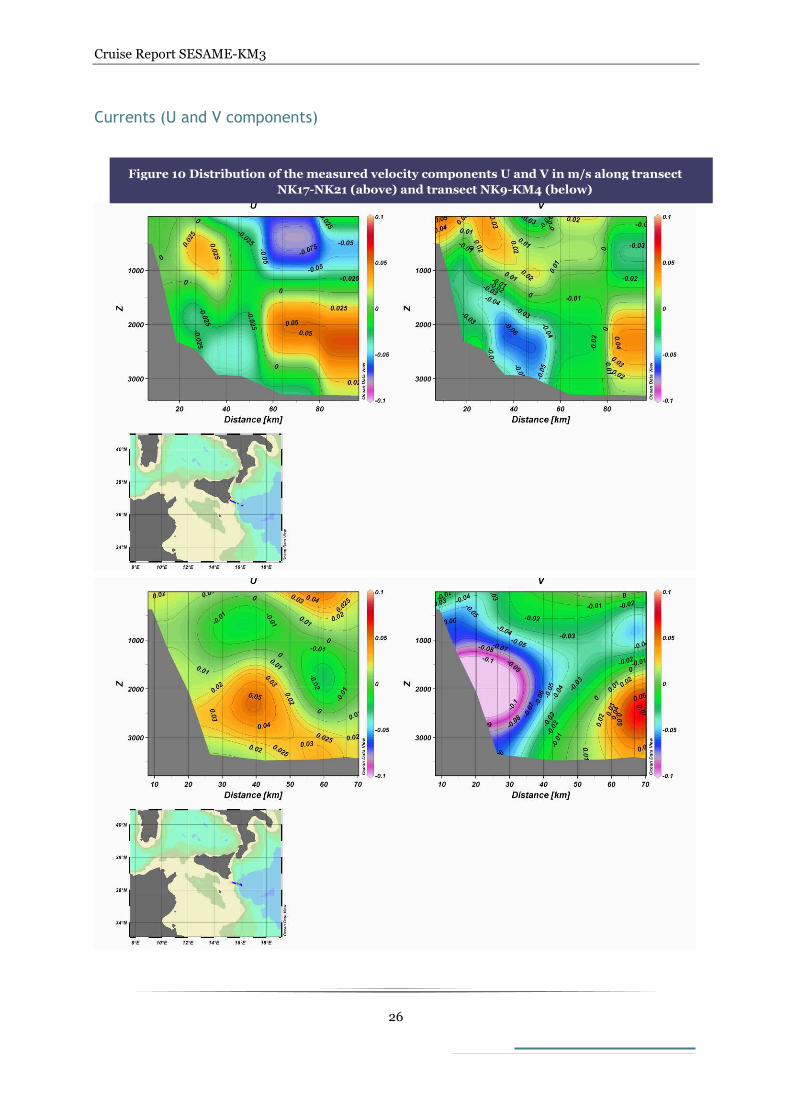
Currents (U and V components)
Figure 10 Distribution of the measured velocity components U and V in m/s along transect
NK17-NK21 (above) and transect NK9-KM4 (below)

Cruise Report SESAME-KM3
27
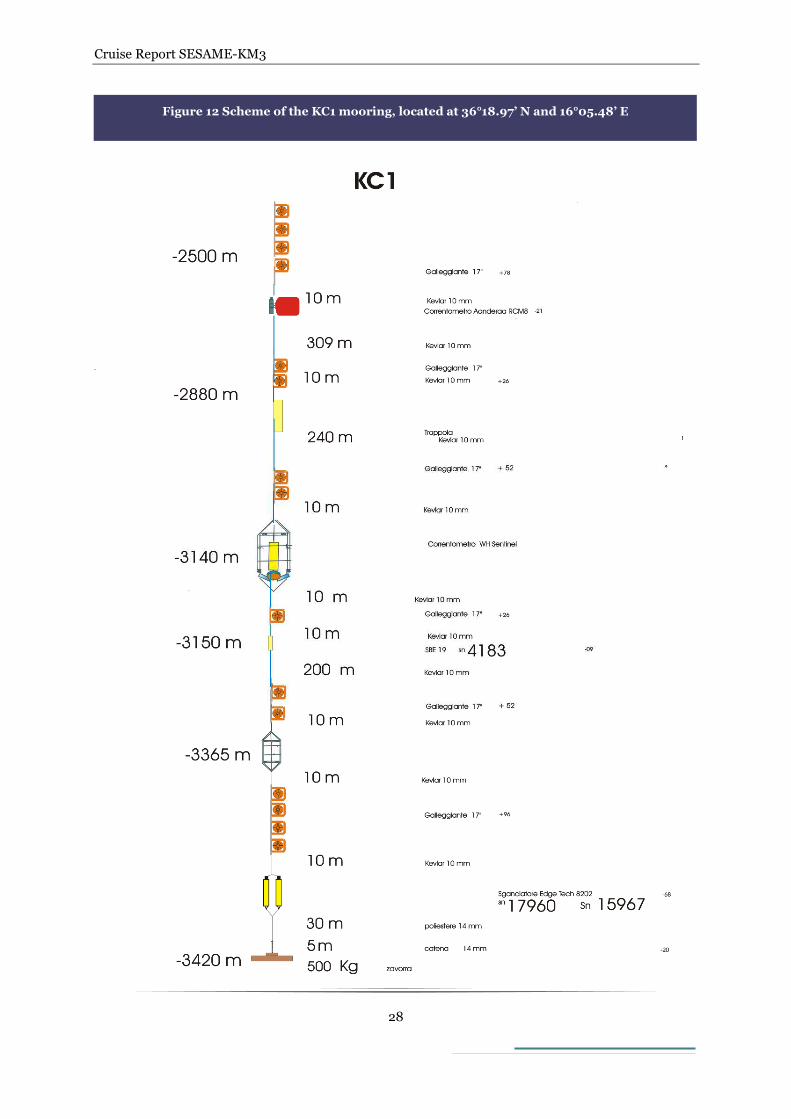
Eulerian measurements Three moorings were deployed in May 2007, one in the NEMO position (KC1), the others, KC2 and
KC3, about 20 nm northwestward and northeastward, respectively . During the cruise the KC1, KC2
and KC3 moorings were recovered and only KC1 and KC2 were redeployed. Figure 11 shows some
moments of the recovering, while figures 12-14 represent the schemes of the three moorings.
Figure 11 (a) recovering of the corrosion-test cage, (b) detail of the corrosion effects on
different metals, (c) recovering of the sediment trap, (d) huge presence of the “cannizzi”,
which made the recovering of KC1 very difficult, (e) the “cannizzi” wrapping an Aanderaa
currentmeter
a)
c)
b)
d) e)
Cruise Report SESAME-KM3
28
Figure 12 Scheme of the KC1 mooring, located at 36°18.97’ N and 16°05.48’ E

Cruise Report SESAME-KM3
29
Figure 13 Scheme of the KC2 mooring, located at 36°24.03’ N and 15°40.93’ E

Cruise Report SESAME-KM3
30
Figure 14 Scheme of the KC3 mooring, located at 36°23.94’ N and 16°21.98’ E
Cruise Report SESAME-KM3
31
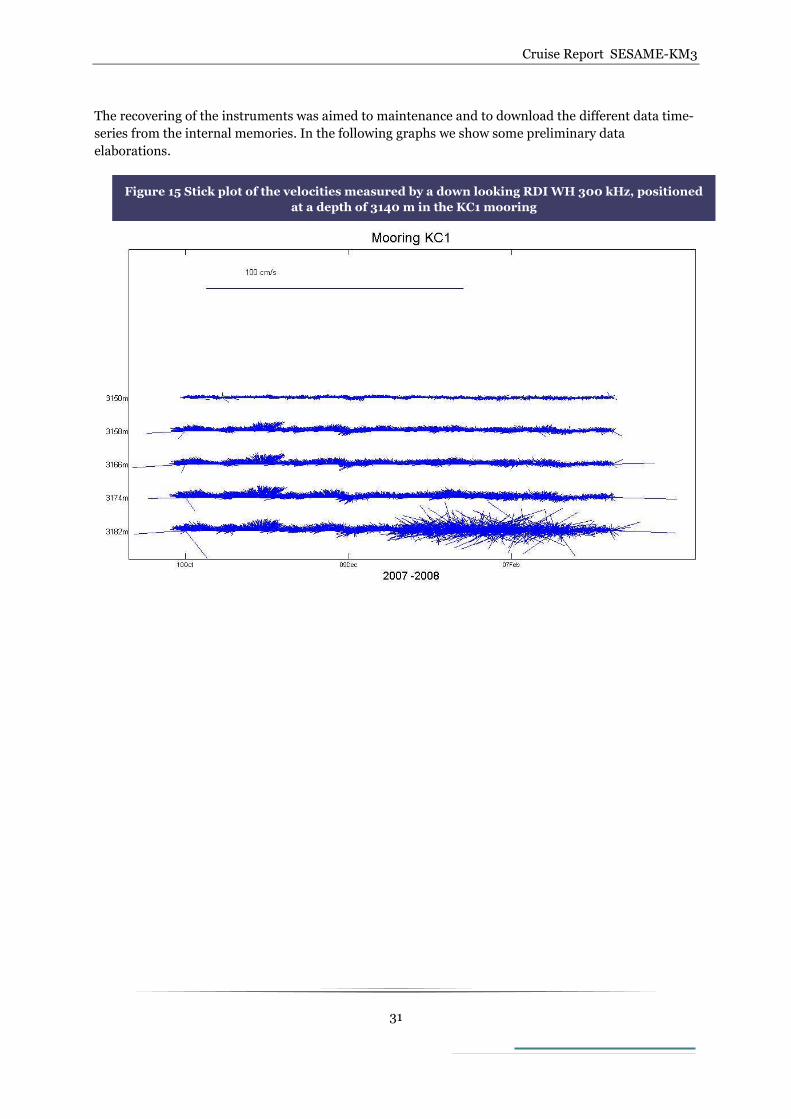
The recovering of the instruments was aimed to maintenance and to download the different data time-
series from the internal memories. In the following graphs we show some preliminary data
elaborations.
Figure 15 Stick plot of the velocities measured by a down looking RDI WH 300 kHz, positioned
at a depth of 3140 m in the KC1 mooring

Cruise Report SESAME-KM3
32
Figure 16 Currentmeter AANDERAA RCM8 at 2500 m depth in the KC1 mooring: velocity
(m/s), stick plot and progressive vector diagram

Cruise Report SESAME-KM3
33
Figure 17 Temporal evolution of potential temperature and salinity measured by an SBE19 at
3150 m depth in the KC1 mooring

Cruise Report SESAME-KM3
34
Figure 18 Currentmeter AANDERAA RCM8 at 3150 m depth in the KC2 mooring: velocity
(m/s), stick plot and progressive vector diagram

Cruise Report SESAME-KM3
35
Figure 19 Temporal evolution of potential temperature and conductivity measured by an
SBE37 at 3150 m depth in the KC2 mooring

Cruise Report SESAME-KM3
36
Figure 20 Currentmeter AQUADOPP at 3400 m depth in the KC3 mooring: velocity and angle
histogram

Cruise Report SESAME-KM3
37
Figure 21 Temporal evolution of potential temperature and conductivity measured by an
SBE37 at 3150 m depth in the KC3 mooring


