
#AnalyticsXC o p y r ig ht © 201 6, SAS In st i tute In c. A l l r ig hts r ese rve d.
Self-Service Data Management for Analytics Users Across the Enterprise
Ken PikulikSAS Solutions ManagerTeradata
Bob MatseySenior Analytics ConsultantTeradata

Meet Your Presenters
Ken Pikulik
Two-decades of experience with data driven and Cloud applications including work with solutions for the Analytics, Supply Chain, Security, IoT and more.
Bob Matsey
29+ years of IT experience in Database Design & Implementation, Data Warehousing, Data Modeling, Analytics, Business Intelligence and ETL field.

#analyticsx
C o p y r ig ht © 201 6, SAS In st i tute In c. A l l r ig hts r ese rve d.
The Evolution of Analytics
Report
Analyze
React
Predictive
Ba s i c knowledge of wha t ha ppened
Unders ta nding of the rel a tionships to determi ne ca us e a nd effect
The a bi lity to ta ke a c ti on to mi nimize i mpa ct or ma ximize res ul ts
The a bi lity to i nfl uence future beha vi or or res ults –BEFORE events occur
Real-Time Data Interaction

#analyticsx
C o p y r ig ht © 201 6, SAS In st i tute In c. A l l r ig hts r ese rve d.
A Self Fulfilling Prophecy
The successful use of analytics is changing the expectations for what analytics can and should do
• Customer service
• Personalization
• Product availability & customization
• Information access and availability

#analyticsx
C o p y r ig ht © 201 6, SAS In st i tute In c. A l l r ig hts r ese rve d.
Perception is Reality

#analyticsx
C o p y r ig ht © 201 6, SAS In st i tute In c. A l l r ig hts r ese rve d.
Perception Shaping Analytics at Work
Board Room
Data Scient ists
Operat ionalManagers

#analyticsx
C o p y r ig ht © 201 6, SAS In st i tute In c. A l l r ig hts r ese rve d.
Perception Shaping Analytics at Work
Board Room
Data Scient ists
Operat ionalManagers
Operat ionalManagers
Operat ionalManagers
Operat ional
Operat ionalManagers

#analyticsx
C o p y r ig ht © 201 6, SAS In st i tute In c. A l l r ig hts r ese rve d.
The Analytics Data Challenge
Existing Analytics Processes

#analyticsx
C o p y r ig ht © 201 6, SAS In st i tute In c. A l l r ig hts r ese rve d.
Why Solving This Challenge is Important?
The value of information decreases over time and organizations need to react quickly to maximize its value through the use of analytics
Time
Va
lue
of
Info
rma
tio
n
Value of the
Analytics

#analyticsx
C o p y r ig ht © 201 6, SAS In st i tute In c. A l l r ig hts r ese rve d.
How Are Organizations Responding?
• Centralizing Data for Analytics
• Enabling Localized Analytics
• Streamlining the ETL process
• Adding More User Friendly Tools
• Focusing on Enabling Faster Analytics Processes

#analyticsx
C o p y r ig ht © 201 6, SAS In st i tute In c. A l l r ig hts r ese rve d.
What Benefits are Being Achieved?
• Single view of all the data• Top to bottom view of the organization
• Drill down capabilities
• Increased data quality
• Minimized data duplication to lower cost
• Faster discovery, model development and deployment

#analyticsx
C o p y r ig ht © 201 6, SAS In st i tute In c. A l l r ig hts r ese rve d.
Obstacles of Progress
• IT Control verse Business Access
• ETL for new types of data
• Data governance and quality

#analyticsx
C o p y r ig ht © 201 6, SAS In st i tute In c. A l l r ig hts r ese rve d.
How to Break Down These Barriers?
A Self Service Analytic Data Lab…
Individually manage and controlled…
Connected to your EDW…
Enabled and supported by IT!

#analyticsx
C o p y r ig ht © 201 6, SAS In st i tute In c. A l l r ig hts r ese rve d.
What is an Analytic Data Lab?
Collection of data on which in-depth analysis can be done to answer critical business questions
• Ideal for data exploration, data transformation, analytic development, POC and prototyping
• User allowed to drop data in for brief time periods without meeting production warehouse criteria
• Data is segregated from the production database
• Data has a limited shelf life ( Duration)
• Accessed by a set of known users making ad hoc request or process intensive analytic tasks
#analyticsx
C o p y r ig ht © 201 6, SAS In st i tute In c. A l l r ig hts r ese rve d.
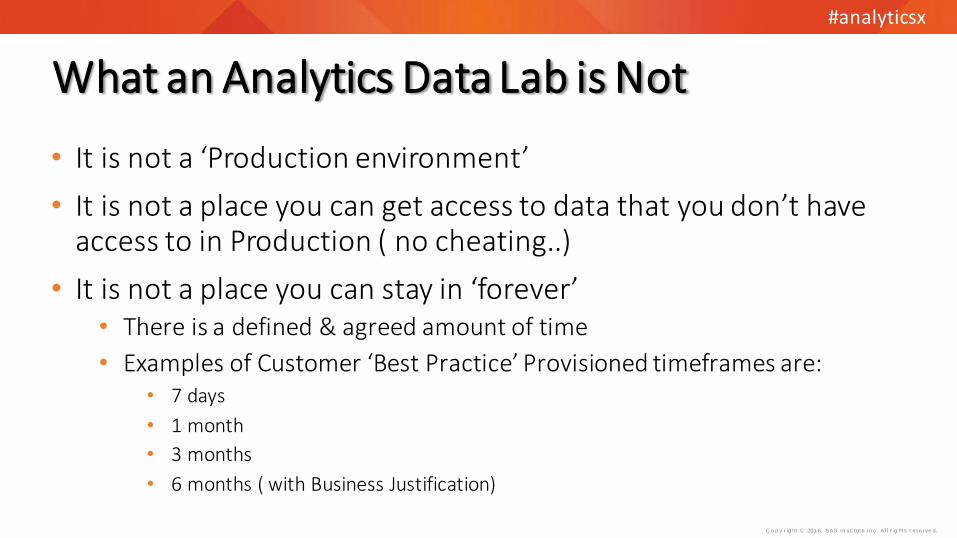
What an Analytics Data Lab is Not
• It is not a ‘Production environment’
• It is not a place you can get access to data that you don’t have access to in Production ( no cheating..)
• It is not a place you can stay in ‘forever’• There is a defined & agreed amount of time
• Examples of Customer ‘Best Practice’ Provisioned timeframes are:• 7 days
• 1 month
• 3 months
• 6 months ( with Business Justification)

#analyticsx
C o p y r ig ht © 201 6, SAS In st i tute In c. A l l r ig hts r ese rve d.
A Sand Box Infrastructure
IntegratedData Warehouse
External Data
CSV Data
System Data
Data ExtractionUser Specific Data
Individualized, Data Sets Running on Unsupported, Unmanaged Systems

#analyticsx
C o p y r ig ht © 201 6, SAS In st i tute In c. A l l r ig hts r ese rve d.
The Analytics Data Lab Infrastructure
External Data
CSV Data
System Data
BY NET
Hi g h -Spee d Co n ne ct ivi ty
IntegratedData WarehouseData Lab
Read only for Data Lab users
Read, write
Data Loaded by User into
Hadoop or Data Lab
Data Combined
with Enterprise Data for Model
Discovery
Data Integrated
into the DW
(Opt ional)

#analyticsx
C o p y r ig ht © 201 6, SAS In st i tute In c. A l l r ig hts r ese rve d.
A Sandbox Verse an Analytic Data Labs
Function Sandbox Data Labs
Runs Unsupported Production Apps Yes No
Environment Backup & Recoverable No Yes
Speed of Processing & Priority No Yes
DBA Support (agreement) No Yes
Users can impact & impact other users Yes No
Space is never cleaned up or reclaimed Yes No
Work load management set up No Yes
Users Trained on Optimal use No Yes

#analyticsx
C o p y r ig ht © 201 6, SAS In st i tute In c. A l l r ig hts r ese rve d.
Hierarchal Data Management by User Groups, Space and Workload
Data Labs
Workspaces for analysis
For a single user or
a number of users
Automated options for management
Ownership: Business User
Lab Group
Allocated space for a group of users to create data labs
• Distributed ownership
• Privacy option
• Multiples based on need
Ownership: DBA
Table
DB table for data storage
Users can create and
load data
Ownership: Development/
Modelers
Database
Database where the Lab Group resides
A Teradata user-database
Ownership: DBA

#analyticsx
C o p y r ig ht © 201 6, SAS In st i tute In c. A l l r ig hts r ese rve d.
Sample Lab Group Hierarchy
Database
Informatics
Lab Group
Lab1
Fraud
Lab Group
Marketing
Lab Group
Lab2
Lab1
Lab3
Lab2
Lab1
Lab2
Lab3

#analyticsx
C o p y r ig ht © 201 6, SAS In st i tute In c. A l l r ig hts r ese rve d.
Why Enable Self-Service Data Mgmt Across the Enterprise• Analyze quickly
• New Theory
• New Data
• Does the new data provide additional insight?
• Does the new insight cause a change in thinking or direction?
• Test Fast
• Was the theory right? (Success or Failure)
• Productionalize what works; discard what doesn’t!• Add the new application
• Add the new data
• Or delete and move on!

#analyticsx
C o p y r ig ht © 201 6, SAS In st i tute In c. A l l r ig hts r ese rve d.
Mixing Test and Product Data
• Join with IDW data (No data exports!)
• New or experimental data quickly loaded into your data lab
• Used for rapid prototyping, experimentation, and exploratory analysis
• Easy to use self-provisioning and management
• Extend analytics to more users
• Minimal IT support required after initial setup
• Eliminate the need to move, extract and duplicate data for analytics

#analyticsx
C o p y r ig ht © 201 6, SAS In st i tute In c. A l l r ig hts r ese rve d.
Data Labs Enables In-Database Analytics
• Minimize the need to move the data
• Faster modeling times (months/weeks to hours/minutes)
• Improve data quality, availability and consistency
• Improve data security while still improving access
• Work with entire data sets, including enabling an end-to-end view of data from across the enterprise
• Free up staff to focus more time on value-adding activities

#analyticsx
C o p y r ig ht © 201 6, SAS In st i tute In c. A l l r ig hts r ese rve d.
Results from Teradata’s Data Lab Solution
Before After Gains
Core Process /ROI Modeling Tools Measure Tools Measure Difference Improvement
Data Aggregation Base SAS / SPDS
1200 Minutes SQL / SAS DI /In-DB
2Minutes
-1198 59900%
Model Execution Base SAS / SPDS
1800 Minutes SQL / SAS /In-DB
30Minutes
-1770 5900%
Model Fit/QC Base SAS / SPDS
1200 Minutes SQL / SAS / In-DB
240Minutes
-960 400%
Manual QC Excel/SAS 3600 Minutes Data Lab / SAS / Excel
15Minutes
Total Time 130 Hours 5 Hours -125 2768%
FTE's 3 1 -2 200%
Brands 5 (18 Possible
combos)
5 (18 Possible
combos)

#analyticsx
C o p y r ig ht © 201 6, SAS In st i tute In c. A l l r ig hts r ese rve d.
The Advantages of Analytics Data Labs
• Enables self service data management
• Improved accuracy, consistency, and precision of results
• Eliminates duplicate data and resources needed to support it
• Adds security, governance and control w/out hindering access
• Encourages experimentation by reducing data prep

#analyticsx
C o p y r ig ht © 201 6, SAS In st i tute In c. A l l r ig hts r ese rve d.
Strategically Reallocate Resources
Core process
(70%)
(Strategic
10%)
Tactical
(20%)
Steps to be taken to reduce time in the core processes:
• Delivery process excellence• Accelerators
• Analytics toolkit• Large scales standardization:
e.g in the ROI and Marketing mix process high level of automation and
standardization has been achieved
Steps for expanding
the work-stream:
• Active focus on identifying projects
of Strategic value• Make more resources dedicated to this work-
stream
• Reduce the time spent in Core and Tactical projects through delivery process excellence and Accelerators
• Actively invest resources in Strategic projects
Core process
(30%)
Strategic
(60%)
Tactical
(10%)
Efficiencies gained in core process and tactical projects could be funneled
into doing more strategic projects

#analyticsx
C o p y r ig ht © 201 6, SAS In st i tute In c. A l l r ig hts r ese rve d.
Questions?
To contact the presenters, email [email protected]

C o p y r ig ht © 201 6, SAS In st i tute In c. A l l r ig hts r ese rve d.
#AnalyticsX


