
Selection of Geometrical Parameters for Discrete
Element Modeling of Rock Cutting
N. М. Tropin, А. V. Manakov, and О. B. Bocharov Russia, 630128 Novosibirsk, Kutateladze Str. 4а, office 211
Email: {nikita.tropin, artyom.manakov, oleg.bocharov}@bakerhughes.com
Abstract—Rock cutting is modeled using discrete element
modeling in which the cutter is defined by solid walls, while a
rock sample is approximated as a packing of bonded
spherical particles following certain interaction laws. This
paper presents analysis of the numerical effects on the
cutting force destroying the rock that are due to the elements
size and configuration of the model. The content includes the
computation results along with recommendations on
selection of the numerical model parameters of a sample to
obtain required accuracy of modeling.
Index Terms—discrete element method, rock cutting,
discrete element size
I. INTRODUCTION
The understanding the mechanics of rock cutting and
the development of an adequate model of the process are
crucially important for many industrial applications such
as wellbore drilling, mining and building of tunnels, etc.
When drilling wells for various purposes, bits with
polycrystalline diamond cutters (PDC) are widely applied.
The tool requires proper estimation of the forces affecting
the bit’s cutters. The information is essential for designing
various schemes of cutter placement on the bit body as
well as for designing new and improved cutter shapes.
The main concepts of DEM in application to porous
media are presented in [1]. The issues of particle
interaction mechanics are described in [2], [3]. The
general observation of the method can be found in [4]. The
fast development of computational technologies has made
it possible to model more complex systems that include
millions of particles. Therefore, DEM is a popular and
effective technique for solving various engineering
problems in the mechanics of granular materials and rocks.
The DEM was used for the modeling of rock
deformation processes since the end of the nineties [5], [6].
The modeling parameters are selected from the correlation
Manuscript received February 6, 2015; revised July 10, 2015.
between the results of numerical modeling and
experimental data from the main tests that determine the
mechanical features of rocks (such as the uniaxial and
triaxial compression tests and the Brazilian test to
determine tensile strength).
Developing the approaches presented in [6], in [7] the
author proposed the rock cutting algorithm for a single
cutter that utilizes DEM via Particle Flow Code (PFC)
software (Fig. 1). The main objective of such modeling is
estimating the reaction forces affecting the cutter’s surface
under various cutting conditions.
Drilling a certain part of rock mass is affected not only
by the cutters, but also by the stresses from the
surrounding rock and by the pressure of the drilling fluid.
To model such conditions an algorithm to describe the
confining pressure acting on the sample and presented as a
set of boundary conditions must be applied.
II. ROCK CUTTING: KEY STAGES OF DEM MODELING
The following are the key stages of modeling a rock
cutting process with a single cutter in the PFC3D package.
In the first stage, a discrete sample is generated. For
each of the sample’s microparameters such as particle
elasticity modules, friction coefficient and bonding forces,
the calibration is performed using a triaxial compression
test. The microparameters are selected in such a way that
the elasticity module and maximum compressive strength
correspond to the experimental data obtained from real
samples [6], [8]. To further strengthen the sample a certain
amount of ‘indestructible bonds’ between the particles
should be created and their amount serves as an additional
calibration parameter.
Figure 1. Discrete element modeling of rock cutting.
Y
X Z
International Journal of Structural and Civil Engineering Research Vol. 4, No. 2, May 2015
© 2015 Int. J. Struct. Civ. Eng. Res. 227doi: 10.18178/ijscer.4.2.227-230
The application of experimental methods for studying
rock cutting is limited by their high cost and complexity.
Therefore, it is necessary to develop new mathematical
models and algorithms to replace such experimental
studies and use experimental data for verification of the
models developed. The Discrete Element Method
(DEM)is a tool that enables rock cutting to be analyzed at
the local level by paying attention to details.
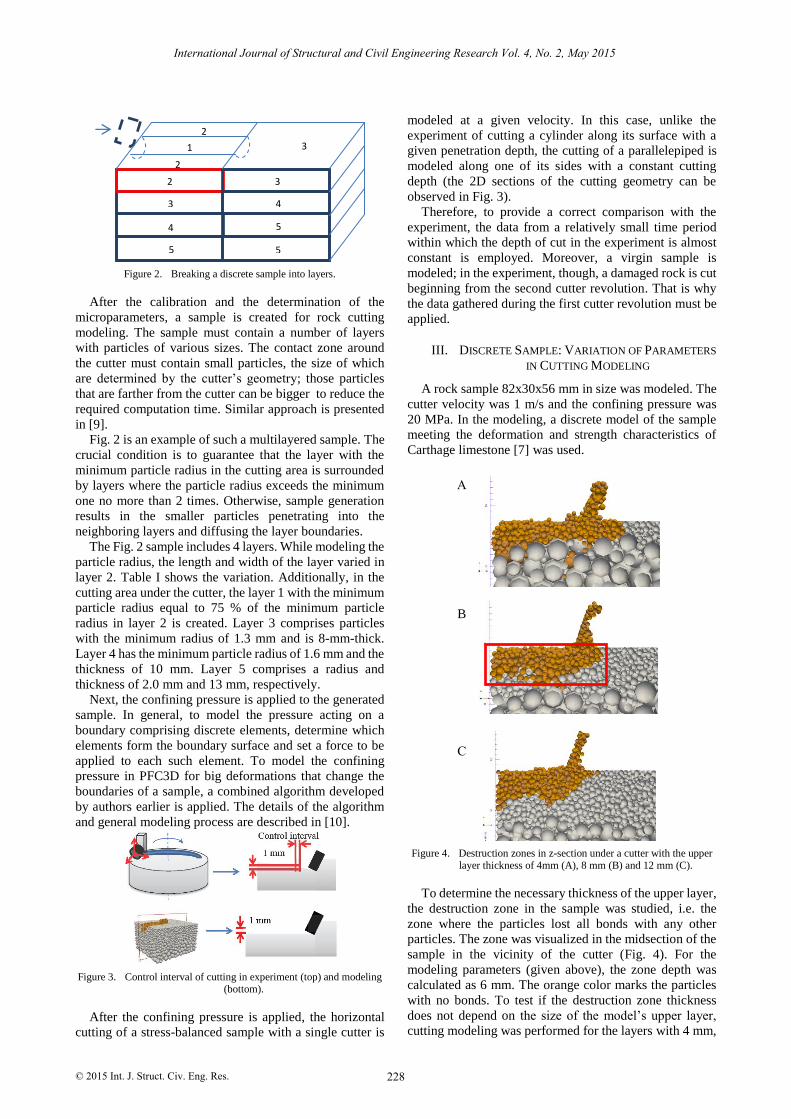
Figure 2. Breaking a discrete sample into layers.
After the calibration and the determination of the
microparameters, a sample is created for rock cutting
modeling. The sample must contain a number of layers
with particles of various sizes. The contact zone around
the cutter must contain small particles, the size of which
are determined by the cutter’s geometry; those particles
that are farther from the cutter can be bigger to reduce the
required computation time. Similar approach is presented
in [9].
Fig. 2 is an example of such a multilayered sample. The
crucial condition is to guarantee that the layer with the
minimum particle radius in the cutting area is surrounded
by layers where the particle radius exceeds the minimum
one no more than 2 times. Otherwise, sample generation
results in the smaller particles penetrating into the
neighboring layers and diffusing the layer boundaries.
The Fig. 2 sample includes 4 layers. While modeling the
particle radius, the length and width of the layer varied in
layer 2. Table I shows the variation. Additionally, in the
cutting area under the cutter, the layer 1 with the minimum
particle radius equal to 75 % of the minimum particle
radius in layer 2 is created. Layer 3 comprises particles
with the minimum radius of 1.3 mm and is 8-mm-thick.
Layer 4 has the minimum particle radius of 1.6 mm and the
thickness of 10 mm. Layer 5 comprises a radius and
thickness of 2.0 mm and 13 mm, respectively.
Next, the confining pressure is applied to the generated
sample. In general, to model the pressure acting on a
boundary comprising discrete elements, determine which
elements form the boundary surface and set a force to be
applied to each such element. To model the confining
pressure in PFC3D for big deformations that change the
boundaries of a sample, a combined algorithm developed
by authors earlier is applied. The details of the algorithm
and general modeling process are described in [10].
Figure 3. Control interval of cutting in experiment (top) and modeling (bottom).
After the confining pressure is applied, the horizontal
cutting of a stress-balanced sample with a single cutter is
modeled at a given velocity. In this case, unlike the
experiment of cutting a cylinder along its surface with a
given penetration depth, the cutting of a parallelepiped is
modeled along one of its sides with a constant cutting
depth (the 2D sections of the cutting geometry can be
observed in Fig. 3).
Therefore, to provide a correct comparison with the
experiment, the data from a relatively small time period
within which the depth of cut in the experiment is almost
constant is employed. Moreover, a virgin sample is
modeled; in the experiment, though, a damaged rock is cut
beginning from the second cutter revolution. That is why
the data gathered during the first cutter revolution must be
applied.
III. DISCRETE SAMPLE: VARIATION OF PARAMETERS
IN CUTTING MODELING
A rock sample 82x30x56 mm in size was modeled. The
cutter velocity was 1 m/s and the confining pressure was
20 MPa. In the modeling, a discrete model of the sample
meeting the deformation and strength characteristics of
Carthage limestone [7] was used.
Figure 4. Destruction zones in z-section under a cutter with the upper
layer thickness of 4mm (A), 8 mm (B) and 12 mm (C).
To determine the necessary thickness of the upper layer,
the destruction zone in the sample was studied, i.e. the
zone where the particles lost all bonds with any other
particles. The zone was visualized in the midsection of the
sample in the vicinity of the cutter (Fig. 4). For the
modeling parameters (given above), the zone depth was
calculated as 6 mm. The orange color marks the particles
with no bonds. To test if the destruction zone thickness
does not depend on the size of the model’s upper layer,
cutting modeling was performed for the layers with 4 mm,
5
4
3
2
Rmax/Rmin=1.5
5
Rmax/Rmin=1.66
5
4
3
3
2
Rmax/Rmin=1.5
2
Rmax/Rmin=1.5
1
Rmax/Rmin=1.5
А
B
С
International Journal of Structural and Civil Engineering Research Vol. 4, No. 2, May 2015
© 2015 Int. J. Struct. Civ. Eng. Res. 228

8 mm and 12 mm thickness. The modeling demonstrated
that if the upper layer thickness increases to more than 6
mm, the destruction zone thickness remains the same (Fig.
4). If the destruction zone thickness is bigger than
thickness of the upper layer (case A), the particles lose
their bonds even in the lower layers. Therefore the upper
layer thickness was set to 8 mm to include the entire
destruction zone.
TABLE I. DISCRETE SAMPLE PARAMETERS FOR CUTTING MODELING
Sample size 0.082 х 0.039 х 0.056 [m]
Minimum particle diameter
0.3 [mm] – 1 [mm]
rmax/ rminratio 1.6
Confining pressure 20е6 [Pa]
Cutter thickness 0.008 [m]
Cutter diameter 0.016 [m]
Chamfer 0.000406 [m]
Depth of penetration 0.001 [m]
Cutting velocity 1 [m/s]
Figure 5. Vertical (red) and horizontal (blue) forces affecting cutter’s
surfaces for a sample with the particle radius of 0.5 (upper) and
0.375 (lower) mm.
In DEM modeling, bigger particles must be utilized to
reduce computation time. On the other hand the smaller
the particles utilized, the more adequately the modeling
reflects the behavior of a real porous medium. Moreover,
the complex geometry of the cutter with a chamfer is
crucial for selecting an optimal minimum particle size. To
determine the optimum size, cutting modeling was
performed with particles with minimum radius of 0.3,
0.375, 0.5, 0.6, 0.7 and 1.0 mm. The cutting of first 16 mm
of the sample was modelled. Fig. 5 shows the vertical and
horizontal components of force acting on the cutter’s
surfaces for the minimum particle radius of 0.5 and 0.375
mm. The obtained data contains the peaks, of which the
amplitude is reduced in conjunction with the particle
radius.
One possible explanation of the peaks can be a particle
getting onto the cutter’s edge, increasing dramatically the
interaction force between the particle and the cutter. This
force in turn contributes to the joint force affecting the
cutter. It also explains why these peaks decrease with the
particle size.
TABLE II. RELATIVE MEAN-SQUARE DEVIATION OF MODELING
RESULTS.
Min. particle
radius [mm] , % MSE, % Num. of
particles
Time,
hours
1.0 86.98 36.16 3754 12
0.7 72.65 26.39 6679 24
0.6 66.28 15.79 9337 44
0.5 53.87 8.47 14632 55
0.375 48.64 -2.5 36053 180
0.3 39.88 1.45 43163 306
When processing the modeling results, it was found that
the mean-square deviation from the data’s average value is
also reduced with the particle size. The values of the
relative mean-square deviation are calculated using the
formula (1):
%100
2
2
xn
xx (1)
where x denotes the arithmetic average value and n is the
number of points(Table II, ).
The number of particles and computation time was
increased with decreasing particle radius almost
exponentially (Table II).
For comparing with experiment the results of the
modeling of cutting the rock sample 82x30x56 mm with a
cutter velocity of 1 m/s and a confining pressure 20 MPa
are provided. A discrete model of the sample corresponds
to the deformation and strength characteristics of Carthage
limestone [7]. The output parameters of the modeling are
the force acting on the cutter and mechanical-specific
energy (MSE). MSE is the amount of work required to cut
a unit volume of rock. Fig. 6 shows the comparison
between mechanical-specific energy measured in
experiment and estimated from modeling.
Figure 6. Mechanical-specific energy (MSE): experiment (red line) and
modeling results (blue markers).
As the minimal particle size in cutting area decreases,
the average value of MSE gets closer to the experimental
value (Table II, MSE). If the radius of the particle is
smaller than the cutter chamfer (0.4 mm), the difference
between modeling and experimental results is stable and
does not exceed 5%.
International Journal of Structural and Civil Engineering Research Vol. 4, No. 2, May 2015
© 2015 Int. J. Struct. Civ. Eng. Res. 229
IV. CONCLUSION
This paper analyses the effects of typical discrete
element sizes and discrete sample configuration on the
results of DEM of cutting modeling. The study shows that:
To optimize the computation time and preserve the
correctness of the modeling, a layered sample must
be employed with smaller particles in the cutting
area and with bigger particles at a particular
distance from it;
The thickness of the top layer with the smallest
particles must exceed the thickness of the
destruction zone;
The particle size in the bottom layers must not be
more than two times larger than the particle size in
the upper layers;
Reducing the minimum particle size in the upper
layer decreases the peaks in the modeling data as
well as their mean-square deviation;
Computation time was increased with decreasing
particle radius almost exponentially;
The error in mechanical-specific energy estimated
from modeling when the minimal radius of the
particle is smaller than the cutter chamfer (0.4
mm)is less than 5%.
ACKNOWLEDGMENTS
The authors thank Baker Hughes Incorporated for the
opportunity to publish the results of this study.
REFERENCES
[1] P. A. Cundall and O. D. L. Strack, “A discrete numerical model for granular assemblies,” Géotechnique, vol. 29, pp. 47–65, 1979.
[2] D. Zhang and W. J. Whiten, “The calculation of contact forces
between particles using spring and damping models,” Powder Technology, vol. 88, pp. 59–64, 1996.
[3] J. Schafer, S. Dippel, and D. E. Wolf, “Force schemes in
simulations of granular materials,” J. Phys. I France, vol. 6, pp. 5–20, 1996.
[4] H. Zhu, Z. Zhou, R. Yang, and A. Yu, “Discrete particle simulation
of particulate systems: Theoretical developments,” Chemical Engineering Science, vol. 62, 2007.
[5] H. Huang, E. Detournay, and B. Bellier, “Discrete element
modelling of rock cutting,” Rock Mechanics for Industry, pp. 123-130, 1999.
[6] D. O. Potyondy and P. A. Cundall, “A bonded-particle model for
rock,” International Journal of Rock Mechanics and Mining Sciences, vol. 41, pp. 1329-1364, 2004.
[7] L. W. Ledgerwood III, “PFC modeling of rock cutting under high
pressure conditions,” in Proc. 1st Canada-U.S. Rock Mechanics Symposium, Vancouver, 2007, pp. 511-519.
[8] Y. Wang and Y. F. Tonon, “Calibration of a discrete element model for intact rock up to its peak strength,” International Journal for
Numerical and Analytical Methods in Geomechanics, vol. 34, no. 5,
pp. 447-469, 2009. [9] J. A. Mendoza, I. K. Gamwo, W. Zhang, and J. S. Lin, “Discrete
element modeling of rock cutting using crushable particles,”
presented at the 44th US Rock Mechanics Symposium, Salt Lake City, UT, Jan. 2010.
[10] N. M. Tropin, O. B. Bocharov, and A. V. Manakov,
“Implementation of boundary conditions in discrete element modeling of rock cutting under pressure,” in Proc. Applied
Mechanics and Materials, 2014, vol. 598, pp. 114-118.
Nikita M. Tropin was born in Novosibirsk,
Russia in 1986. He received a master’s degree in mathematics and mechanics at the
Novosibirsk State University, Russia in 2009.
He has been with Baker Hughes for 10 years, currently on a position of Scientist and HPC
Project Leader at the Baker Hughes
Novosibirsk Technology Center, Russia and has more than 7 publications in international
journals. His research interests are in the area
of discrete element modeling, high-performance computing, and parallel computing.
Mr. Tropin is a member of EAGE.
Oleg B. Bocharov was born in 1952, obtained MS’s degree in Mechanics and Mathematics
from Novosibirsk State University (NSU) in
1975, PhD in Mathematics and Physics in 1989 (NSU), Associate Professor (NSU).
He worked in All Union Scientific Institute of
Oil and Gas (Moscow) as a senior researcher, Institute for Water and Environment Problems
(Novosibirsk) as a leading scientist. Now he is
a leader of Fluid Thermal Dynamic Department in Novosibirsk Technology Center of Baker Hughes. His
research interests deals with Mathematical Modeling of Continuous
Environment Problems and include: Fluid Dynamic, Fluid Filtration, Structural Mechanics, Partial Differential Equations, and Numerical
Methods.
Dr. Bocharov is the author of more than 160 publications.
Artyom V. Manakov was born in 1979, obtained MS’s degree in Mechanics and
Mathematics at the Novosibirsk State
University (NSU), Russia in 2001, PhD in 2015 at the Novosibirsk State Technical
University (NSTU).
He has been with Baker Hughes for 8 years, currently on a position of Scientist at the Baker
Hughes Novosibirsk Technology Center, Russia and has 5 publications in international
journals and 2 US Patents. His research interests are in the area of
scientific research in formation evaluation, rock mechanics (geomechanics), filtration processes in porous media, micro-structural
rock modeling and pore-scale modeling.
Dr. Manakov is a member of SPE.
International Journal of Structural and Civil Engineering Research Vol. 4, No. 2, May 2015
© 2015 Int. J. Struct. Civ. Eng. Res. 230


