
Evidence Report 50July 2012
Sector Skills Insights: Construction

Sector
i
Sector Skills Insights: Construction
Lynn Gambin, Terence Hogarth, Gaby Atfield, Yuxin Li and David Owen Institute for Employment Research, University of Warwick Zoey Breuer, Richard Garrett UK Commission for Employment and Skills
July 2012

Sector Skills Insights: Construction
i
Foreword The UK Commission for Employment and Skills is a social partnership, led by
Commissioners from large and small employers, trade unions and the voluntary sector. Our
mission is to raise skill levels to help drive enterprise, create more and better jobs and
promote economic growth. Our strategic objectives are to:
• Provide outstanding labour market intelligence which helps businesses and people make
the best choices for them;
• Work with businesses to develop the best market solutions which leverage greater
investment in skills;
• Maximise the impact of employment and skills policies and employer behaviour to
support jobs and growth and secure an internationally competitive skills base.
These strategic objectives are supported by a research programme that provides a robust
evidence base for our insights and actions and which draws on good practice and the most
innovative thinking. The research programme is underpinned by a number of core principles
including the importance of: ensuring ‘relevance’ to our most pressing strategic priorities;
‘salience’ and effectively translating and sharing the key insights we find; international benchmarking and drawing insights from good practice abroad; high quality analysis
which is leading edge, robust and action orientated; being responsive to immediate needs
as well as taking a longer term perspective. We also work closely with key partners to
ensure a co-ordinated approach to research.
This report contributes to the UK Commission’s work to transform the UK’s approach to
investing in the skills of people as an intrinsic part of securing jobs and growth. It outlines
the performance challenges faced in the Construction sector, the ‘real-life’ skills solutions
implemented by leading and successful businesses to overcome them, and the benefits from
doing so. Similar reports are available for the following sectors: Advanced Manufacturing;
Digital and Creative; Education; Energy; Health and Social Care, Professional and Business
Services; Retail; Tourism. Each report is summarised by an accompanying PowerPoint slide
pack. By understanding the key performance challenges employers face and the skills
solutions available to address them on a sector-by-sector basis the UK Commission can
make better use of its investment funds to support economic growth.

Sector Skills Insights: Construction
ii
Sharing the findings of our research and engaging with our audience is important to further
develop the evidence on which we base our work. Evidence Reports are our chief means of
reporting our detailed analytical work. Each Evidence Report is accompanied by an
executive summary. All of our outputs can be accessed on the UK Commission’s website at
www.ukces.org.uk
But these outputs are only the beginning of the process and we will be continually looking for
mechanisms to share our findings, debate the issues they raise and extend their reach and
impact.
We hope you find this report useful and informative. If you would like to provide any
feedback or comments, or have any queries please e-mail [email protected], quoting the
report title or series number.
Lesley Giles
Deputy Director
UK Commission for Employment and Skills

Sector Skills Insights: Construction
iii
TABLE OF CONTENTS
GLOSSARY ..................................................................................................................... VI EXECUTIVE SUMMARY ...................................................................................................... VII 1 THE ECONOMIC AND POLICY CLIMATE ........................................................................ 1
2 THE IMPORTANCE OF THE SECTOR ............................................................................. 4
2.1 Overall Output and Employment Performance .......................................................... 5
2.2 Employment Structure (for 2010)............................................................................... 9
2.3 Age structure of employment ................................................................................... 11
2.4 Self-employment ...................................................................................................... 13
2.5 Distribution of Employment by Nation and Region .................................................. 14
2.6 International Standing of the Sector ........................................................................ 16
2.7 Conclusion ............................................................................................................... 17
3 KEY CHALLENGES FACING THE SECTOR OVER THE MEDIUM-TERM.................... 18
3.1 Introduction .............................................................................................................. 18
3.2 The Recession and Recovery.................................................................................. 18
3.3 Investment, Innovation and R&D ............................................................................. 20
3.4 Technology .............................................................................................................. 22
3.5 Policy, Legislation and Regulation ........................................................................... 23
3.6 Environment and Low / Zero Carbon ....................................................................... 24
3.7 Global Competition .................................................................................................. 25
3.8 Migration .................................................................................................................. 26
3.9 The Role of Skills in Overall Competitiveness ......................................................... 26
3.10 Strategic Role of Management ................................................................................ 27
3.11 Conclusion ............................................................................................................... 28
4 EMPLOYMENT AND SKILL DEMAND IN THE SECTOR ............................................... 30
4.1 The Changing Demand for Employment ................................................................. 30
4.2 Factors Affecting the Demand for Skill .................................................................... 30
4.3 Changing Patterns of Skill Demand ......................................................................... 33
4.4 Replacement Demands ........................................................................................... 36
4.5 Conclusion ............................................................................................................... 38
5 SKILLS SUPPLY .............................................................................................................. 39
5.1 The Supply Infrastructure ........................................................................................ 39
5.2 Trends in Skill Supply: The Levy Scheme and Certification .................................... 45
5.3 Trends in Skill Supply: Individuals ........................................................................... 46
5.4 Employer Investment in Skills .................................................................................. 50
5.5 Migrant Labour Supply............................................................................................. 54
5.6 Conclusion ............................................................................................................... 55
6 SKILL MISMATCHES ...................................................................................................... 56
Sector Skills Insights: Construction
iv
6.1 Defining Skill Mismatches ........................................................................................ 56
6.2 Evidence of Relative Wage Growth ......................................................................... 57
6.3 Evidence of employer reported skill deficiencies ..................................................... 60
6.4 Other Evidence on Evidence of Skill Deficiencies ................................................... 62
6.5 Causes, Impacts and Remedies .............................................................................. 63
6.6 Conclusion ............................................................................................................... 70
7 CONCLUSION .................................................................................................................. 71
7.1 The Sector Today and Tomorrow ............................................................................ 71
7.2 The Performance Challenge .................................................................................... 72
7.3 Growth through Skills .............................................................................................. 73
7.4 Business Benefits .................................................................................................... 74
REFERENCES ..................................................................................................................... 76
CHARTS Chart 1.1 Employment and Gross Value-Added 1978 - 2020 ........................................ 3
Chart 2.1: Trends in Employment and Output ................................................................ 6
Chart 2.2 Occupational Structure of Employment .......................................................... 9
Chart 2.3a Size Structure of Employment (% of employment by employer size band) . 10
Chart 2.3b: Size Structure of Employment (% of employment by employer size band) . 10
Chart 2.4a: Age Structure of Construction Workforce ..................................................... 12
Chart 2.4b: Age Structure of UK Workforce (all sectors) ................................................ 12
Chart 2.5: Employment by Nation and Region .............................................................. 14
Chart 4.1: Replacement Demands ................................................................................ 37
Chart 5.1: Apprenticeship starts and achievements (all levels), 2002/03 to 2010/11 ... 48
Chart 5.2: Higher Education qualifications attained in UK HEIs, 2005/06 to 2009/10 .. 50
Chart 6.1 Occupational Distribution of Skill Shortages in Construction ....................... 62
Chart 6.2 Occupational Distribution of Skill Gaps in Construction ............................... 63
Chart 6.3 Reasons for Not Providing Vocational Qualifications ................................... 64

Sector Skills Insights: Construction
v
TABLES Table 1.1 Four recent periods of recession in the UK .................................................... 1
Table 2.1: Key Output and Employment Indicators ......................................................... 5
Table 2.2: Key employment indicators by sub-sectors in 2010 ....................................... 7
Table 2.3: Size Structure of Employment (% of employment by employer size band) . 10
Table 2.4: Age Structure of Workforce by sub-sectors in 2010 ..................................... 13
Table 3.1: Sector investment as a share of total investment ........................................ 21
Table 4.1 Changing Pattern of Skill Demand ............................................................... 34
Table 4.2 Changing Pattern of Skill Demand by Qualification ..................................... 36
Table 5.1: Main construction qualifications – levels and descriptions ........................... 41
Table 5.2 Number of employees in receipt of work-related training over the past 13 weeks ........................................................................................................... 47
Table 5.3: Construction Apprenticeship starts by level and age, 2002/03 to 2010/11 .. 48
Table 5.4: KPIs, 2005 to 2010....................................................................................... 50
Table 5.5: Employer Investments in Skill ...................................................................... 51
Table 5.6 Recruitment of young people ....................................................................... 51
Table 5.7 Recruitment of apprentices .......................................................................... 52
Table 5.8 Other Indicators of Training Activity ............................................................. 53
Table 6.1: Annual pay - Gross (£) - For full-time employee jobs: UK, 2010 .................. 57
Table 6.2: Annual pay - Gross (£) - For full-time employee jobs in Selected Occupations in Construction: United Kingdom, 2010 ................................... 58
Table 6.3a Incidence of Skill Deficiencies ...................................................................... 61
Table 6.3b Density of Skill Deficiencies ......................................................................... 62
Table 6.4 Investors in People Accreditation in IiP ........................................................ 66

Sector Skills Insights: Construction
vi
GLOSSARY
This report uses data from several sources and uses a definition of the sector depending upon which data sources are available.
PRINCIPAL DATA SOURCES Employer Perspectives Survey 2010 (EPS 2010) The UK Commission’s Employer Perspectives Survey 2010 (Shury et al., 2011) gathered the views of approximately 14,500 employers on the UK’s employment and skills system. The aim of the survey is to provide evidence to stakeholders operating in the system across the four UK nations to inform policy and improve service delivery. http://www.ukces.org.uk/publications/er25-employer-perspectives-survey The UK Commission’s UK Employers Skills Survey 2011 (ESS 2011) The UK Commission’s UK Employer Skills Survey (UK Commission, 2012) provides UK-wide data on skills deficiencies and workforce development across the UK on a comparable basis. It was undertaken at the establishment level and involved over 87,500 interviews, with a follow up survey of over 11,000 employers focusing on employers’ expenditures on training. http://www.ukces.org.uk/publications/employer-skills-survey-2011
Working Futures Database Working Futures 2010-2020 (Wilson and Homenidou, 2011) is the most detailed and comprehensive set of UK labour market forecasts available. The results provide a picture of employment prospects by industry, occupation, qualification level, gender and employment status for the UK and for nations and English regions up to 2020. The database used to produce the projections is held by the University of Warwick Institute for Employment Research and Cambridge Econometrics. http://www.ukces.org.uk/assets/ukces/docs/publications/evidence-report-41-working-futures-2010-2020.pdf
Labour Force Survey The Labour Force Survey (LFS) is a quarterly sample survey of households living at private addresses in the United Kingdom. Its purpose is to provide information on the UK labour market that can then be used to develop, manage, evaluate and report on labour market policies. It is conducted by the Office for National Statistics. Figures quoted in this report are based on a four quarter average. http://www.ons.gov.uk/ons/guide-method/surveys/respondents/household/labour-force-survey/index.html
SECTOR DEFINITIONS Two definitions of the sector have been employed in this report.
Standard Industrial Classification (SIC) Based Definition Construction is traditionally defined in SIC (2007) as Section F: construction of buildings; civil engineering, construction of specialised buildings.
Sector Skills Assessment (SSA) Definition Information from the SSA for construction is also used to inform the analysis in this report. For the purposes of the SSA construction is defined as SIC (2007) Section F plus 71 Architectural and engineering activities; technical testing and analysis.

Sector Skills Insights: Construction
vii
EXECUTIVE SUMMARY
This report considers the current situation of the UK construction sector, the challenges it faces over the medium-term and the implications for skills.
The Importance of the Sector
• Construction is a vital component of the UK economy, not only directly due to its
contribution to output and employment, but also strategically in its contribution to the
built environment and as part of various initiatives designed to stimulate growth.
• It also has a critical functional role in meeting the low-carbon agenda either through
retro-fitting buildings and ensuring that all new buildings meet energy saving
standards.
• The recent recession has adversely affected construction employment and
performance with the sector experiencing a sharp drop in the total value of contracts.
With cuts to public spending and low consumer confidence, the recession has
presented the sector with a number of challenges. Construction has been one of the
most affected sectors in terms of the relative decrease in employment with a decline
of around 8 per cent resulting from the 2008/09 recession.
• The sector rebounded faster than other sectors in the first three quarters of 2010, but
there have been contractions in construction output since. While construction is often
the sector which helps to pull the entire economy out of recession, it is slow in doing
so in the present global downturn.
• Employment in construction accounted for around 8.5 per cent of total employment in
the UK in 2010 and the sector contributed more than 9 per cent of the economy’s
output in the same year.
Key Challenges and Implications for Skills
• The severely cyclical nature of employment in construction is a feature of the sector
that has several implications for skills. In the most recent and previous recessions,
the sector’s workforce has dropped significantly. This has previously resulted in skills
shortages in the recovery period as workers who have secured employment in other
sectors are reluctant to re-join the construction workforce. The cyclical nature of
employment is also a deterrent for younger entrants into the sector as well as for
highly skilled workers, such as managers (including civil engineers) who seek more
stable employment in other sectors where their skills are sought after.
• Technological advances (including modern methods of construction (MMC)) and the
low carbon agenda are having significant impacts on the sector and its skills needs.

Sector Skills Insights: Construction
viii
These will grow in importance in future so that the sector must respond to these
challenges by acquiring the right quality and quantity of specific skills. Complying with
environmental regulations requires not only skills in using green materials and
methods in construction but also with managing construction sites in order to reduce
carbon footprints. Similarly, increased use of pre-fabrication and automation in
construction requires management of a different mix of labour on site as well as
management of significant workforce off-site (e.g. in factories making the building
components).
• Globalisation and increased international competition also require that employers in
construction consider a wider range of skills including language and managerial skills
in order to operate successfully in overseas markets, collaborate with international
partners and compete with international companies in the domestic market.
Employment and Skill Needs in the Sector
• The key drivers of change in construction have a variety of implications of skills
demand in the sector. Meeting low/zero carbon requirements, adopting new
technologies and satisfying various regulations requires particular specific skills and
alters the importance of particular occupations. Skills to fill replacement demand as
older workers leave the sector are particularly important in construction given the
nature of work and the age structure of the workforce.
• In order to meet these challenges, the skill profile of the sector has been changing
with an increased share of people working in higher level occupations (managers,
professionals, and associate professionals). This is matched by an increasing share
of people qualified at a high level (Level 4 and above).
• Within occupations too there is the changing content of the skills required given the
changes in construction processes and the use of new materials, and the need to
meet a wide range of market demands (such as the low carbon agenda).
Skills Supply
• There is a well developed skill supply system operated through the levy system and
ConstructionSkills amongst others, and a relatively high level of engagement by
employers with the training infrastructure (private providers and FE colleges).
• There is evidence of an increasing number of Apprenticeship starts at Level 2 and 3,
though this has tailed off over recent years due to a downturn in construction activity.
• It is apparent that construction employers are relatively sensitive to cost in relation to
their training activities. Where employers do not provide training leading to vocational

Sector Skills Insights: Construction
ix
qualifications they tend to provide reasons relating to cost more than employers in the
sector as a whole.
• There is also evidence that many employers report that the skills of their workforce
are under-utilised though less so than in the economy generally, which points to an
extant source of skills supply within many organisations.
Skill Mismatches
• The evidence shows that the sector has relatively high levels of skill shortages which
have a detrimental impact upon organisational performance. In part, the sharp
cyclical shifts in demand for construction, poses problems in relation to planning
employment and skill demand.
• The relatively large share of micro-employers and the number of self-employed
people in the sector means that some people can fall outside of existing skills supply-
mechanisms unless they are encompassed within industry supply chains which
require people to be trained and qualified.
• In order to meet the challenges facing the sector over the medium-term, there is a
clear need to continue to develop the skills of the workforce despite depressed
demand for construction. This includes continuing to invest in training at an
Apprenticeship level and at higher skill levels.
• There are a range of processes and programmes in place to assist construction
employers attain this goal. And all the case study evidence suggests that where
employers continue to invest in training there are substantial business benefits from
doing so which improve organisational performance and, crucially, are associated
with business survival.
• It needs emphasising that given the high levels of replacement demand, and the
associated expected growth in output over the medium-term, the sector, if it
effectively uses the employment and training infrastructure available to it, can,
potentially, provide a large number of entry level training positions over the medium
term which one would expect to go, predominantly, to young people. This would
contribute thereby to an important policy goal of assisting young people enter the
labour market.
Conclusion
Following previous recessions, output growth in the construction sector has risen
strongly. Often large-scale infrastructure projects have been used as a demand-side

Sector Skills Insights: Construction
x
fillip. It is notable currently that the Government is looking to bring forward a number of
previously planned and budgeted infrastructure projects to stimulate growth in the
economy and, in so doing, will stimulate demand in the construction sector.
The above is very much a short- to medium-term development. From a more long-term
perspective there are a number of challenges and opportunities facing the sector,
including:
• meeting the low carbon agenda (i.e. reducing carbon emissions and the carbon
footprint of buildings);
• raising productivity levels in order to retain, if not increase, the current share of the UK
and world markets held by UK-based companies;
• bringing about increased levels of innovation in the design (i.e. the product) and the
construction (i.e. the process) in order to increase productivity; and
• meeting changing regulatory standards relating to the construction of buildings and
health and safety on site.
The above challenges and opportunities place a number of demands on the sector’s skill
requirements:
• investing in management skills to adequately equip managers with the skills to meet
the performance challenges listed above;
• avoiding the skill-shortages which the sector encountered following previous
recessions which potentially dampen the sector’s growth potential. This points to the
need for the sector to continue to:
o provide initial vocational education and training to new entrants in order to
meet future skill demands;
o invest in the skills of the existing workforce to ensure they are prepared for the
challenges ahead.
There is a substantial training and skills development infrastructure of which employers
can utilise to meet their skill needs. The evidence indicates that where companies have
made use of such programmes as Apprenticeships they have been able to obtain a
number of business benefits from having done so.

Sector Skills Insights: Construction
1
1 The Economic and Policy Climate Increasingly, the competitiveness of advanced industrial nations is explained with
reference to the capabilities of their respective labour forces. Hence, national education
and training systems are seen as providing comparative economic advantages. It is
notable that over the recent past education and training have taken centre stage in
policies designed to foster the UK’s competitiveness and lie at the heart of the current
Government’s plans to kick start the recovery against a backdrop of challenging global
economic conditions. To understand the role skills development might play in stimulating
growth within the digital and creative sector requires some consideration of the current
economic situation and current skills policy.
In 2012 the UK economy, and indeed the global economy, is still coming to terms with the
repercussions of the 2008/09 economic recession. By comparison with previous
recessions, 2008/09 was relatively deep and it continues to cast a long shadow over the
country’s medium-term economic prospects (see Table 1.1). The economic climate at
the time of the 2008/09 recession and in the period afterwards has been characterised by
low interest rates and a depreciation of sterling against other currencies, notably the
dollar and the euro. Whilst these would usually be sufficient to give a fillip to the
economy by boosting demand and, given time, increasing output, the potential for export
led growth has been seriously undermined by continuing weak demand conditions across
the global economy, especially in the Eurozone and the USA. Also the difficulties
households and businesses have had gaining access to finance as the banks have
sought to increase their capital has restricted growth. Moreover, the markets’ continuing
disquiet over developments in the Eurozone has contributed further to the climate of
uncertainty in the global economy thereby further dampening demand.
Table 1.1: Four recent periods of recession in the UK
Start date Date of bottom of recession
Length of period from
start to bottom of recession
Total decline in GDP (%)
Time taken for GDP to
recover to level at start of
recession
1 1974 Q4 1975 Q3 4 Quarters 3.8 7 Quarters
2 1980 Q1 1980 Q4 4 Quarters 5.9 13 Quarters
3 1990 Q3 1992 Q2 8 Quarters 2.3 11 Quarters
4 2008 Q2 2009 Q1 6 Quarters 6.3 ?
Source: Office of National Statistics Quarterly Economic Accounts, 1975, 1981, 1993, 2010

Sector Skills Insights: Construction
2
As a consequence of the above developments, the rapid acceleration in growth observed
after the recessions of the early 1980s and 1990s has failed to materialise. Nevertheless
the economy is expected to resume its long-run growth path over time (see Chart 1.1) but
in order to do so there are specific steps the UK economy needs to take. The UK
Treasury has identified a number of weaknesses which need to be addressed if a
sustained recovery is to be achieved (BIS / HM Treasury 2011):
• the level of debt funded household consumption;
• the share of the economy accounted for by the public sector;
• weak business investment;
• an over-dependence upon financial and business services; and
• unbalanced regional growth.
Government has identified four ambitions which need to be realised in order to restore
long-term sustainable growth (BIS / HM Treasury 2011):
i. creating the most competitive tax system in the G20;
ii. making the UK one of the best places in Europe to start, finance and grow a
business;
iii. encouraging investment and exports as a route to a more balanced economy; and
iv. creating a more educated workforce that is the most flexible in Europe.
Therefore, the role of skills in national economic policy is clearly an essential one; to bring
about recovery and sustainability by creating jobs and growth.
From the employer’s perspective there is a need to adapt to both global demand side
conditions and the consequences which are likely to arise from policies designed to
rebalance the UK economy. Depending upon the sector there are likely to be a number
of skill-related performance challenges which employers will need to address as they
seek to consolidate existing markets, develop new ones, and introduce technical and
organisational changes to improve their competitiveness. The importance of these
challenges become even more apparent if one considers the role of skills in the economic
cycle. Evidence demonstrates that the recovery from previous economic recessions was
hampered by skills shortages, and that these skill shortages then contributed to further
downturns in the economy (Blake et al., 2000). Therefore, the message is clear: a failure
to invest sufficiently in skills now has the potential to dampen future growth.

Sector Skills Insights: Construction
3
Chart 1.1: Employment and Gross Value-Added 1978 - 2020
Source: Wilson and Homenidou (2011)
At a time when capital investments are constrained as a consequence of problems in the
global banking system, investments in skills, and human resources more generally, made
through programmes such as Apprenticeships and Investors in People, and funded
through initiatives such as the Growth and Innovation Fund, may be the most amenable
to employers.
Based on the latest evidence available, this report considers the specific situation in the
Advanced Manufacturing sector to provide:
• an overview of the size and structure of the sector and the principal drivers of change
over the medium term which are likely to have some bearing upon skill demand;
• an outline of current and expected patterns of skill demand in the sector;
• a description of skills supply and how this has adapted to changing patterns of skill
demand;
• an analysis of mismatches between the demand for, and supply of skills, and the
implications of this for the sector.
In conclusion, the report identifies the performance challenges faced by the sector and
highlights the skills solutions available to address them thereby delivering increased
levels of growth and contributing to the recovery of the UK economy.
20000
22000
24000
26000
28000
30000
32000
34000
400000
600000
800000
1000000
1200000
1400000
1600000
Empl
oym
ent (
000s
)
GVA
(£m
)
GVA (£2006m)Employment (000s)

Sector Skills Insights: Construction
4
2 The Importance of the Sector Construction was one of eight key sectors addressed in the Government’s first growth
review (HM Treasury, 2011). The construction sector is a fundamental part of the UK
economy. Not only is it responsible for the construction of the built environment, but
historically it has been an engine of growth following economic downturns. It is important
to note in this context that the current Government has earmarked £200 billion for
investment in public and private infrastructure investments over the next five years and,
recently, has outlined a number of actions to stimulate and support the sector. These
actions include:
• regular early identification of infrastructure projects and programmes in order to
provide a degree of stability in which employers can plan their activities;
• changes to public procurement processes in order to improve its efficiency;
• stimulating demand through a number of actions including support for first time house
buyers and reforming stamp duty land tax rules for bulk purchases;
• changes to various building regulations to reduce duplication and remove redundant
rules.
These actions are designed to have an impact on distinct segments of the construction
sector. It needs to be borne in mind that the construction sector is not homogeneous but
is comprised of a number of sub-sectors which vary across a number of dimensions. The
three main sectors of the UK construction industry, as set out in the UK Standard
Industrial Classifications 2007 (SIC2007) are:
(i) construction of buildings (41);
(ii) civil engineering (42);
(iii) specialised construction activities (43);
(iv) architectural and related (71).
Activity also varies within these broad sub-sectors, from small companies – including sole
traders – supplying specialist services to large, multi-national enterprises with
responsibility for delivery large-scale projects.

Sector Skills Insights: Construction
5
2.1 Overall Output and Employment Performance
Construction comprises the second largest sector of employment in the UK, accounting
for around 7.5 per cent of total UK employment. In addition, a significant number of
construction workers are employed in the informal economy whose numbers are not
readily captured in official statistics.
The sector had output of more than £99 billion in 2010 (2006 prices) which represents
significant growth of 2.4 per cent a year between 2000 and 2010 (see Table 2.1).
Business Population Estimates for 2011 (BIS) (private sector only) indicate that at the
start of the year there were 876,000 businesses operating in the sector, representing 19
per cent of all UK private sector enterprises.
Productivity in construction had risen steadily over the period 2002 to 2008 but fell from
£60,000 to £58,000 GVA per head between 2008-09 (Annual Business Inquiry (ABI) /
Business Register and Employment Survey (BRES) and Annual Business Survey, Office
National Statistics). This is a similar pattern to the economy overall but the economy aver
GVA per head is much lower at £37,000. The sector performs well compared to a number
of other sectors in terms of productivity (c.f. productivity in manufacturing is around
£49,000 GVA per head). In 2009, productivity in construction varied across the UK, from
£39,00 GVA per employed person in Wales, £53,000 in Scotland and £60,000 in Wales
(Sources: Annual Business Inquiry (ABI) / Business Register and Employment Survey
(BRES) and Annual Business Survey, Office National Statistics). There are also
variations in regional productivity; in 2007, productivity per head was £29,100 in the North
East, to £38,000 in the East of England, and £42,400 in London (ONS Blue Book, Labour
Force Survey).
Table 2.1: Key Output and Employment Indicators
Construction 2010 level
Growth rate: 2000-2010
(% p.a.) Changes (absolute)
Growth: 2010-2020
(%)
Growth rate: 2010-2020
(% p.a.) Changes (absolute)
Output (£2006m) 98,814 2.4 20,631 32.4 2.8 32,025
Employment 2,599,254 1.0 256,203 11.9 1.1 309,057
Part time employment 159,819 -1.4 -24,232 16.5 1.5 26,339
Full time employment 1,458,381 0.5 75,911 12.8 1.2 186,065
Self employment 981,054 2.4 204,524 9.9 0.9 96,653
Male employment 2,255,200 1.5 308,907 12.3 1.2 277,080
Female employment 344,054 -1.4 -52,704 9.3 0.9 31,977 Source: Wilson and Homenidou (2011) Base: SSA Definition

Sector Skills Insights: Construction
6
Employment and output in construction are both sharply cyclical and sensitive to
macroeconomic conditions. Employment in the sector was just under 3 million in 1990.
This decreased over the period to the mid-1990s to around 2.2 million in 1997. Between
1997 and 2008 there was steady growth in employment until numbers began to decrease
again in response to the global recession. Data from 2010 indicates that 36 per cent of
firms in the sector reported that they laid-off staff owing to the 2008/09 recession
(ConstructionSkills, 2010). Employment and output are expected to begin to grow again
in 2012 according to the latest Working Futures projections (Wilson and Homenidou,
2011). These estimate that over the 10 years to 2020, output will grow by 32 per cent –
from a relatively low base in a historical context (compared to 30 per cent across all
sectors) - and employment by 12 per cent (compared to 5 per cent across all sectors).
Again, official figures do not count employment in the informal economy so that these
figures are likely to be higher in reality.
Chart 2.1: Trends in Employment and Output
Source: Wilson and Homenidou (2011)
Base: SSA Definition
Output in the construction industry fell faster than total GDP during the recession and
rebounded more quickly than the economy during the first three quarters of 2010, but
output contracted again during the last quarter of 2010 and the first quarter of 2011
(Maer, 2011).
0
20,000
40,000
60,000
80,000
100,000
120,000
140,000
0
500
1,000
1,500
2,000
2,500
3,000
3,500
1990 1995 2000 2005 2010 2015 2020
Output (£2006m)
Employment (000s)
Construction
Employment Output
Sector Skills Insights: Construction
7
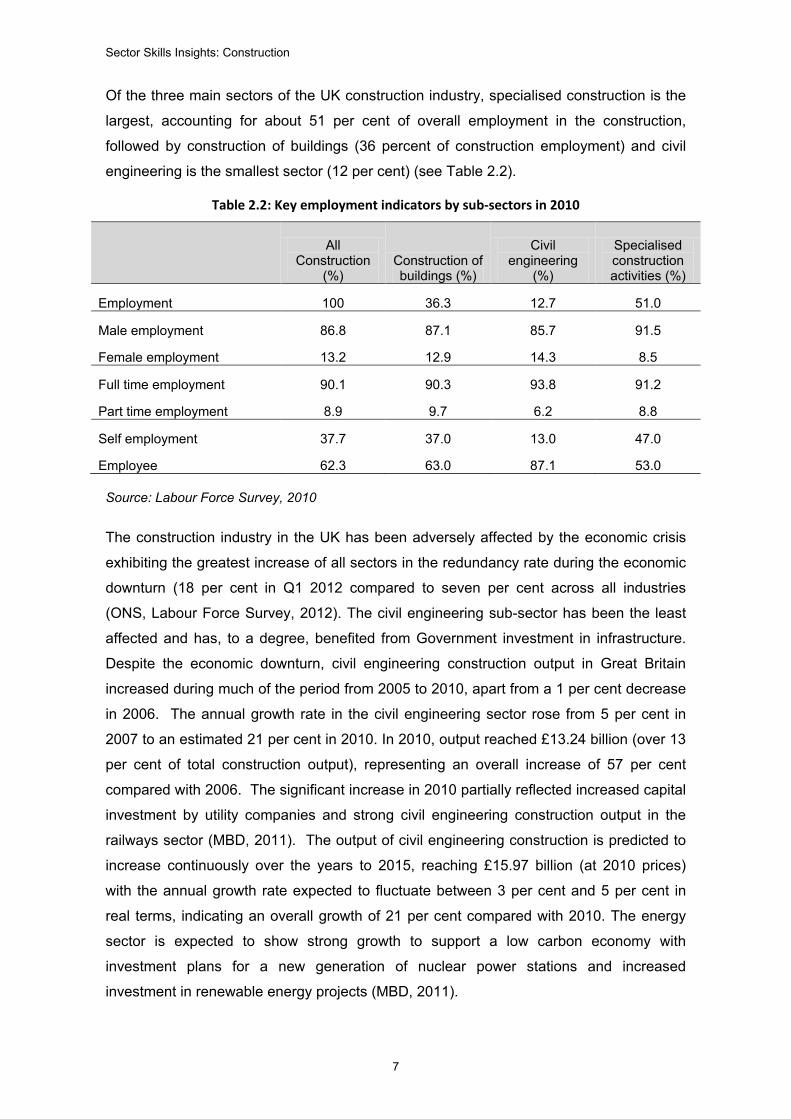
Of the three main sectors of the UK construction industry, specialised construction is the
largest, accounting for about 51 per cent of overall employment in the construction,
followed by construction of buildings (36 percent of construction employment) and civil
engineering is the smallest sector (12 per cent) (see Table 2.2).
Table 2.2: Key employment indicators by sub-sectors in 2010
All Construction
(%) Construction of buildings (%)
Civil engineering
(%)
Specialised construction activities (%)
Employment 100 36.3 12.7 51.0
Male employment 86.8 87.1 85.7 91.5
Female employment 13.2 12.9 14.3 8.5
Full time employment 90.1 90.3 93.8 91.2
Part time employment 8.9 9.7 6.2 8.8
Self employment 37.7 37.0 13.0 47.0
Employee 62.3 63.0 87.1 53.0
Source: Labour Force Survey, 2010
The construction industry in the UK has been adversely affected by the economic crisis
exhibiting the greatest increase of all sectors in the redundancy rate during the economic
downturn (18 per cent in Q1 2012 compared to seven per cent across all industries
(ONS, Labour Force Survey, 2012). The civil engineering sub-sector has been the least
affected and has, to a degree, benefited from Government investment in infrastructure.
Despite the economic downturn, civil engineering construction output in Great Britain
increased during much of the period from 2005 to 2010, apart from a 1 per cent decrease
in 2006. The annual growth rate in the civil engineering sector rose from 5 per cent in
2007 to an estimated 21 per cent in 2010. In 2010, output reached £13.24 billion (over 13
per cent of total construction output), representing an overall increase of 57 per cent
compared with 2006. The significant increase in 2010 partially reflected increased capital
investment by utility companies and strong civil engineering construction output in the
railways sector (MBD, 2011). The output of civil engineering construction is predicted to
increase continuously over the years to 2015, reaching £15.97 billion (at 2010 prices)
with the annual growth rate expected to fluctuate between 3 per cent and 5 per cent in
real terms, indicating an overall growth of 21 per cent compared with 2010. The energy
sector is expected to show strong growth to support a low carbon economy with
investment plans for a new generation of nuclear power stations and increased
investment in renewable energy projects (MBD, 2011).

Sector Skills Insights: Construction
8
After an annual growth of 15 per cent during the period from 2005 to 2007, the UK house
building sector declined by 17 per cent in 2008 and by an even stronger 28 per cent in
2009, taking output to £14.59 billion (MBD, 2010). The output of the house building
sector, which accounted for around 40 per cent of total construction output before the
economic crisis, declined to 34 per cent in 2008 and further to 31 per cent in 2009 due to
a significant downturn in the housing market caused by the financial crisis (MBD, 2010).
Table 2.2 describes the distribution of employment by gender, part-time work and self-
employment in the sector as well as for each of the sub-sectors. Overall, construction is
characterised by low participation of women in the workforce with only 13 per cent of
employment being held by women compared with nearly 50 per cent across the whole
economy. This varies across the main sub-sectors. The civil engineering sector had the
highest proportion of female employees in 2010 (14 per cent), followed by construction of
buildings sector (13 per cent) and specialised construction in which less than nine per
cent of employment was held by women. The exceptionally low participation of women in
construction is particularly pronounced in skilled trades occupations with only 2 per cent
of employment in manual occupations being held by women. Black and Minority Ethnic
people are under-represented in the construction industry, accounting for five per cent of
the workforce compared with nine per cent across all sectors (Labour Force Survey,
2010).
Part-time work is relatively uncommon in construction, a characteristic of the employment
structure which could, in part, affect female participation in the workforce. Overall, just
under ten per cent of employment in the sector is part-time compared to 27 per cent
across all sectors. The picture varies slightly across the sub-sectors; the share of
employment in the construction subsectors that is part-time ranges from six per cent in
civil engineering (SIC 42) to nearly 14 per cent in specialised construction activities (SIC
43).
The skill structure of the sector is described in detail in Section 4, but it is worth bearing in
mind with respect to employment the sector’s reliance upon skilled labour at both
intermediate and higher levels (see Chart 2.2).

Sector Skills Insights: Construction
9
Chart 2.2 Occupational Structure of Employment
Source: Labour Force Survey, 2010
2.2 Employment Structure (for 2010)
The construction sector is made up of a small number of large companies and a long tail
of small companies and self-employed individuals. Total turnover in the construction
sector was £184.13 billion in 2010. The top 100 construction companies in the UK
accounted for more than 37 per cent of the sector’s total turnover (£68.421 billion).
Amongst the top 100 construction companies by turnover in 2011, at least three were
non-UK companies.
As depicted in Charts 2.3a and 2.3b employment in construction is concentrated in firms
with less than 25 employees. These small employers account for nearly half of all
employment in the sector. Companies with 250 to 500 employees account for the
smallest share, 6 per cent, of employment in the sector whilst the largest employers (500
or more employees) make up 12 per cent of total employment. According to BIS Business
Population Estimates (2011a) (private sector only), across all sectors in the UK, 59 per
cent of employment is within SMEs (0-249 employees) while in construction 85 per cent
of employment is concentrated in firms with less than 250 employees. The heavy
concentration of small companies is an important feature of the sector which has
implications for skills and training investments and productivity. What is more, SMEs
account for 74 per cent of the turnover in the sector and is much higher than the all sector
figure of 48 per cent (BIS, 2011a) (again, this is based on private sector only).
9
15
9
8
45
0
2
7
4
0 10 20 30 40 50
Managers, directors and senior …
Professional occupations
Associate professional and …
Administrative and secretarial
Skilled trades occupations
Caring, leisure and other service
Sales and customer service
Process, plant and machine …
Elementary occupations
% of workforce

Sector Skills Insights: Construction
10
Chart 2.3a: Size Structure of Employment (% of establishments by employer size band)
Source: Inter-departmental Business Register (IDBR), ONS, 2010
Chart 2.3b: Size Structure of Employment (% of employment by employer size band)
Source: Labour Force Survey 2010
Table 2.3 indicates the size structure of employment by the three main sub-sectors in
2010. Firms with less than 25 employees, unsurprisingly, account for the largest
proportion of total employment across the three sub-sectors, while firms with 250 to 499
employees account for the smallest proportion within each sub-sector. Employment in
civil engineering is somewhat more evenly distributed across employers by size
compared to construction of buildings and specialised construction. Employment in
specialised construction activities is especially concentrated in smaller firms with almost
one-third in companies with less than 25 employees and just over 7 per cent of all
employment being in companies with 250 or more employees. The proportion of
employment within companies with less than 25 employees is less than 30 per cent in
civil engineering compared to more than 50 per cent in construction of buildings and more
than 60 per cent in specialised construction activities.
Table 2.3: Size Structure of Employment (% of employment by employer size band)
2-4, 67%
5-9, 18%
10-24, 10%
25-49, 3%
50-250, 2%
251+, 0%
Under 25
49%
25 to 4913%
50 to 24920%
250 to 5006%
500 or more12%

Sector Skills Insights: Construction
11
Number of employees All Construction
(%) Construction of buildings (%)
Civil engineering (%)
Specialised construction activities (%)
under 25 49 52.2 29.8 64.3
25 to 49 13 13.8 14.0 12.7
50 to 249 20 20.8 29.3 15.9
250 to 499 6 6.0 10.5 3.0
500 or more 12 7.2 16.4 4.1
Source: Labour Force Survey 2010
2.3 Age structure of employment
Construction employment is skewed towards the middle age groups indicated in Chart
2.4 with low employment of individuals aged 18 years or less and those aged 65 and
over. The majority of construction workers are between the ages of 25 and 59 years
(more than 80 per cent). The age distribution of workers in construction is not
dramatically different from the distribution of workers across all sectors in the UK. The
main difference is with regard to younger workers with a smaller proportion of workers in
construction being between the ages of 16 and 24 years (11 per cent) compared to the
whole economy (13 per cent). Employment of workers aged 18 years and younger is
relatively uncommon in the construction industry largely due to the increased regulations
imposed on their employment, including health and safety requirements on construction
sites. The age structure in the three sub-sectors is similar to construction overall. Civil
engineering has the lowest shares of employees aged 24 years and under (11 per cent)
and 65 years old and over (3 per cent).

Sector Skills Insights: Construction
12
Chart 2.4a: Age Structure of Construction Workforce
Source: Labour Force Survey 2010
Chart 2.4b: Age Structure of UK Workforce (all sectors)
Source: Labour Force Survey 2010
The age structure of the construction workforce has implications for replacement
demands (i.e. employment demand required to fill positions vacated due to retirement or
other reasons). The nature of work in the sector contributes to the relatively low share of
older workers with physically demanding work limiting perhaps limiting the age to which
workers are willing to continue thus contributing to replacement demand for particular
occupations.
0% 5% 10% 15% 20% 25% 30% 35% 40%
Under 16
16 to 18
19 to 24
25 to 34
35 to 44
45 to 59
60 to 64
65 and over
All
Female
Male
0% 5% 10% 15% 20% 25% 30% 35% 40%
Under 16
16 to 18
19 to 24
25 to 34
35 to 44
45 to 59
60 to 64
65 and over
All
Female
Male

Sector Skills Insights: Construction
13
Replacement demand for skilled construction and building trades over 2010 to 2020 is
expected to be 434,000 (making up over 43 per cent of the sector workforce in 2020
compared with ten per cent across all sectors) (Wilson and Homenidou, 2011). There are
concerns about the attractiveness of the sector to young people and the importance of
bringing in skills in the younger age groups in order to replace skills lost through older
workers leaving.
Table 2.4: Age Structure of Workforce by sub-sectors in 2010
Age of employees (years)
All Construction (%)
Construction of buildings (%)
Civil engineering (%)
Specialised construction activities (%)
16-18 1.3 1.5 0.8 1.6
19-24 9.6 10.2 8.4 11.5
25-34 21.7 21.2 21.1 21.8
35-44 24.4 24.5 27.7 23.3
45-59 33.1 32.6 33.5 32.7
60-64 7.1 7.1 7.0 7.0
65+ 2.8 2.8 1.5 2.2 Source: Labour Force Survey 2010
2.4 Self-employment
There is a high incidence of self-employment in construction compared to other sectors
and the UK economy as a whole. In construction, self-employment accounted for 38 per
cent of the sector’s total employment in 2010 (see Table 2.2) compared to around 14 per
cent across the whole economy. The trend towards increasing levels of self-employment
in construction is projected to continue with Working Futures projections indicating that
self-employment will comprise more than 41 per cent of total employment in construction
in 2020 (Wilson and Homenidou, 2011). Self-employment has been used as a means of
creating a flexible workforce, of particular appeal to large companies in the sector, and
has been attractive to many individual workers due to potential tax savings.
The prominence of self-employment and sub-contracting in the sector has caused
concerns that such organisation of labour does not incentivise employers to provide
training (Winch, 1998). Across the sub-sectors, self-employment is least common in civil
engineering (13 per cent of total employment) and most common in specialised
construction activities (47 per cent). Use of self-employed and sub-contracted labour is
largely a response to the sensitivity of the sector to cyclical variations and the long-term
nature of many construction projects (particularly large infrastructure projects) where

Sector Skills Insights: Construction
14
labour and skills needs vary over the project lifecycle. The Plan for Growth (HM Treasury,
2011) outlines a number of changes related to construction including publication of a
rolling two year programme of projects (where public funding is agreed) as well as
publication of a long-term forward view of infrastructure. In having advance information,
the confidence of employers and investors should increase and construction employers
may be able to plan their human resource strategies and workforce over longer periods
and in doing so reduce the cyclical nature of employment.
2.5 Distribution of Employment by Nation and Region
More than 80 per cent of employment in the UK construction sector is based in England,
9 per cent is in Scotland, 5 per cent in Wales and 3 per cent in Northern Ireland (see
Chart 2.5). Within England, construction employment is dispersed across the regions with
the greatest shares being based in the South East (18 per cent), London (15 per cent),
the East and North West (12 per cent each). The smallest share of construction
employment is based in the North East (5 per cent). The distribution of employment in
construction across the UK is not vastly different from that of employment in the economy
as a whole.
Chart 2.5: Employment by Nation and Region
Source: Wilson and Homenidou (2011) Base: SSA Definition
The distribution of construction employment by occupation differs across the regions (see
Table 2.5). For the whole of the UK, skilled trades accounts for the greatest share of
employment. This ranges from over a third in the East Midlands to well over half of the
construction workforce in the North East and Northern Ireland, and is above average in
London, the South West, West Midlands, Yorkshire and the Humber, North West and
Wales.
England, 2,164
Wales, 120
Scotland, 248 NI, 68
Construction
Employment (000s)
London, 313.6
South East, 394.
5
East, 266.0South
West, 198.1
West Mids, 222.
7
East Mids, 177.
6
Yorks/Hum, 215.2
North West, 263
.6
North East, 112.
7
Construction
Employment (000s)

Sector Skills Insights: Construction
15
The second largest category is professional occupations with the largest percentages in
the East Midlands, London and Scotland and the lowest in Northern Ireland, the North
East and Wales.
Table 2.5: Occupational profile of employment in construction, 2010 (% employed)
Man
ager
s, d
irect
ors
and
seni
or o
ffici
als
Prof
essi
onal
oc
cupa
tions
Asso
ciat
e pr
ofes
sion
al
and
tech
nica
l
Adm
inis
trativ
e an
d se
cret
aria
l
Skille
d tra
des
occu
patio
ns
Car
ing,
leis
ure
and
othe
r ser
vice
Sale
s an
d cu
stom
er
serv
ice
Proc
ess,
pla
nt a
nd
mac
hine
ope
rativ
es
Elem
enta
ry
occu
patio
ns
London 8.9 18.8 9.9 6.8 46.7 0.3 1.2 4.4 3.1
South East 11.3 16.3 8.9 8.9 42.7 0.2 1.5 6.3 3.9
East of England 10.6 14.7 8.8 8.4 42.7 0.2 1.8 7.7 5.1
South West 8.6 14.6 8.0 7.4 48.8 0.2 1.6 6.7 4.1
West Midlands 7.4 14.4 8.0 9.2 47.8 0.2 1.9 6.6 4.5
East Midlands 10.2 18.9 9.6 8.9 36.7 0.2 2.1 8.8 4.7 Yorkshire and the Humber 8.8 14.1 8.3 8.9 45.8 0.2 1.9 7.2 4.9
North West 9.0 13.2 8.7 7.4 49.8 0.2 1.7 6.8 3.3
North East 6.8 11.3 7.1 7.5 54.0 0.2 1.8 7.1 4.2
Wales 7.3 12.1 7.2 8.4 49.8 0.2 1.8 9.0 4.3
Scotland 10.0 15.7 10.8 10.1 38.3 0.3 1.8 8.1 4.8
Northern Ireland 6.0 9.8 5.2 7.3 56.5 0.2 1.3 8.1 5.7
UK 9.2 15.2 8.8 8.3 45.4 0.2 1.7 6.9 4.2
Source: Wilson and Homenidou (2011) Base: SSA Definition
The percentage of construction workers who are managers, directors and senior officials
is above average in the South East, East of England, East Midlands and Scotland and
the lowest in Northern Ireland, Wales and the West Midlands. The share of associate
professional occupations is largest in Scotland, London and the East Midlands. The
proportion of construction workers in semi-skilled occupations is lowest in London and
highest in Wales, the East Midlands, Scotland and Northern Ireland.
The representation of BMEs in the sector varies across the regions with BMEs
comprising 17 per cent of the construction workforce in London and 6 per cent in the
West Midlands. These figures are below the all sector averages in London and the West
Midlands (31 per cent and 12 per cent, respectively).

Sector Skills Insights: Construction
16
2.6 International Standing of the Sector
The UK construction industry is one of the largest in Europe by employment, number of
enterprises, and gross value added. In 2007, productivity per employed person (labour
productivity) for the UK construction sector was second highest in the EU at €75,500
(£61,000). This was notably higher than that found in Germany (€38,100/£30,800 per
employee) or France (€43,900/£35,500). Investment per head employed (€6,600/£5,300)
was also higher than the EU average. (Eurostat, 2010).
Although the sector is strong compared to other EU countries, productivity is lower than in
the USA, the country that is at the forefront of the global construction sector. There are
also weaknesses in particular subsectors, notably engineering construction, where
productivity is lower than in some other leading countries. In the EU there are around 16
million people employed in construction, 13 per cent of which is accounted for by the UK
(in 2008). In the EU, the UK is the second largest sector with respect to employment, just
behind Germany with 15 per cent of EU employment.
In 2005, the UK accounted for 21 per cent of construction activity in the EU-27 (Eurostat,
2011). UK-based construction companies perform relatively well in comparison to their
European counterparts. Thirteen UK based companies were amongst the top fifty
companies (by sales) identified as major players in Europe in 2010 (Deloitte, 2010).
These include 13 UK companies including Balfour Beatty PLC (8th), Carillion PLC (14th),
Taylor Wimpey Plc (21st) and Interserve Plc (27th). Average sales across these 13
companies was 9.766 € billion in 2010.
Construction accounted for 0.6 per cent of UK exports and for 0.5 per cent of imports in
2008 (UKCES Skills Almanac). More than £5 billion of construction products and
materials are exported from the UK annually (UKTI website). Ernst & Young recently
found construction services to be the sector with the greatest potential for average annual
growth in exports to 2020 with possible growth of 10.8 per cent (CBI, 2011). Construction
services currently accounts for 0.4 per cent of UK exports (CBI, 2011). UK construction
companies have also fared well in winning work abroad.
Engineering construction has been identified as an ‘emerging sector’ in New Industry,
New Jobs (BERR, 2009). The UK’s engineering construction sector is the largest of its
kind in Europe and globally is the second largest, behind the US. Whilst this sector is
likely to remain relatively small in terms of the size of its workforce, it is recognised as
vital to the regeneration of other sectors and to the delivery of major infrastructure
projects.

Sector Skills Insights: Construction
17
2.7 Conclusion
Construction makes a significant contribution to the UK economy, directly through output
and employment, as well as through underpinning and supporting growth in all other
sectors. The composition of the sector is varied, with a wide range of sub-sectors carrying
out a variety of activities and with wide-ranging requirements in terms of employment and
skills. The structure employment in the sector differs from the rest of the UK economy
with self-employment being far more common in construction and notably low
employment levels amongst women and ethnic minority groups. Section 3 looks at the
key challenges facing the sector over the medium-term, including implications for
employment.
Sector Skills Insights: Construction
18
3 Key Challenges facing the Sector over the Medium-term
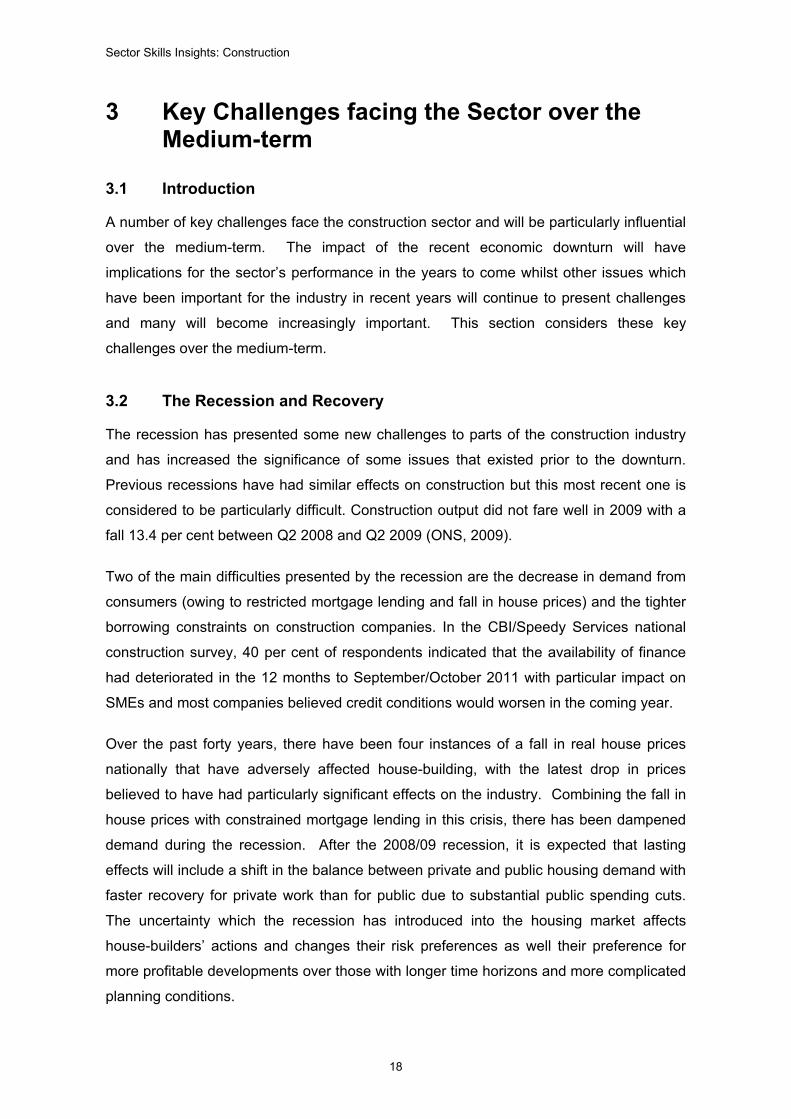
3.1 Introduction
A number of key challenges face the construction sector and will be particularly influential
over the medium-term. The impact of the recent economic downturn will have
implications for the sector’s performance in the years to come whilst other issues which
have been important for the industry in recent years will continue to present challenges
and many will become increasingly important. This section considers these key
challenges over the medium-term.
3.2 The Recession and Recovery
The recession has presented some new challenges to parts of the construction industry
and has increased the significance of some issues that existed prior to the downturn.
Previous recessions have had similar effects on construction but this most recent one is
considered to be particularly difficult. Construction output did not fare well in 2009 with a
fall 13.4 per cent between Q2 2008 and Q2 2009 (ONS, 2009).
Two of the main difficulties presented by the recession are the decrease in demand from
consumers (owing to restricted mortgage lending and fall in house prices) and the tighter
borrowing constraints on construction companies. In the CBI/Speedy Services national
construction survey, 40 per cent of respondents indicated that the availability of finance
had deteriorated in the 12 months to September/October 2011 with particular impact on
SMEs and most companies believed credit conditions would worsen in the coming year.
Over the past forty years, there have been four instances of a fall in real house prices
nationally that have adversely affected house-building, with the latest drop in prices
believed to have had particularly significant effects on the industry. Combining the fall in
house prices with constrained mortgage lending in this crisis, there has been dampened
demand during the recession. After the 2008/09 recession, it is expected that lasting
effects will include a shift in the balance between private and public housing demand with
faster recovery for private work than for public due to substantial public spending cuts.
The uncertainty which the recession has introduced into the housing market affects
house-builders’ actions and changes their risk preferences as well their preference for
more profitable developments over those with longer time horizons and more complicated
planning conditions.
Sector Skills Insights: Construction
19
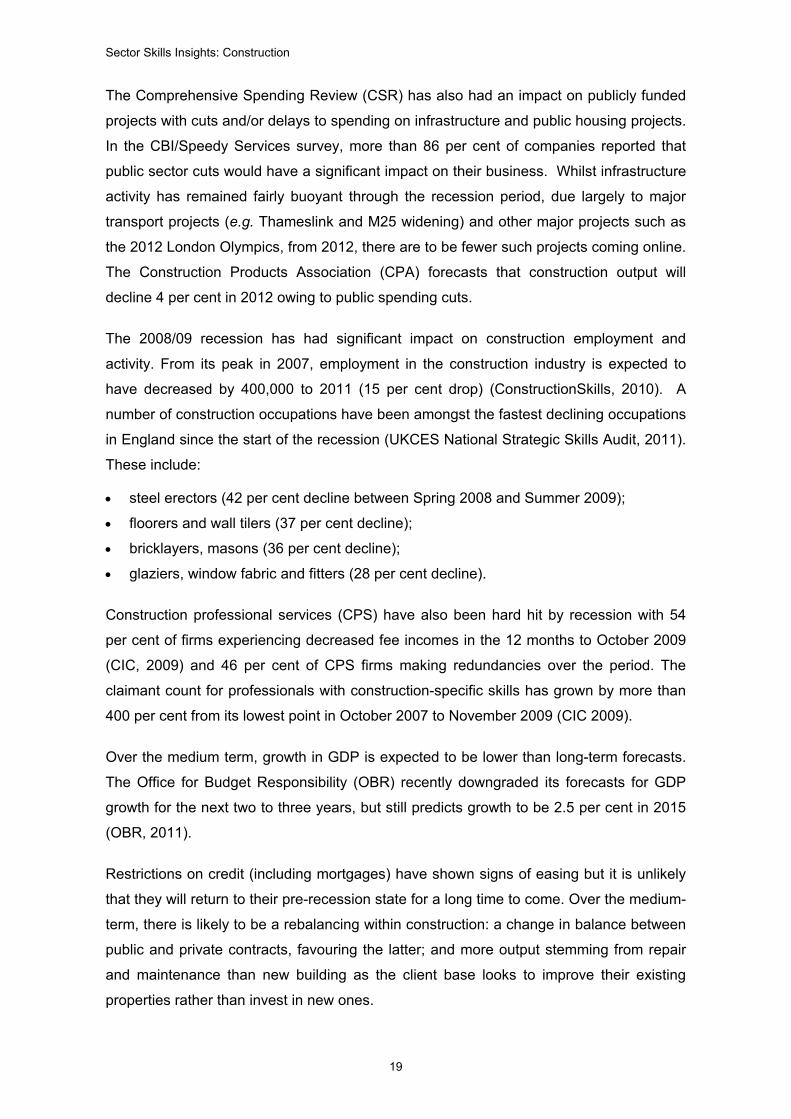
The Comprehensive Spending Review (CSR) has also had an impact on publicly funded
projects with cuts and/or delays to spending on infrastructure and public housing projects.
In the CBI/Speedy Services survey, more than 86 per cent of companies reported that
public sector cuts would have a significant impact on their business. Whilst infrastructure
activity has remained fairly buoyant through the recession period, due largely to major
transport projects (e.g. Thameslink and M25 widening) and other major projects such as
the 2012 London Olympics, from 2012, there are to be fewer such projects coming online.
The Construction Products Association (CPA) forecasts that construction output will
decline 4 per cent in 2012 owing to public spending cuts.
The 2008/09 recession has had significant impact on construction employment and
activity. From its peak in 2007, employment in the construction industry is expected to
have decreased by 400,000 to 2011 (15 per cent drop) (ConstructionSkills, 2010). A
number of construction occupations have been amongst the fastest declining occupations
in England since the start of the recession (UKCES National Strategic Skills Audit, 2011).
These include:
• steel erectors (42 per cent decline between Spring 2008 and Summer 2009);
• floorers and wall tilers (37 per cent decline);
• bricklayers, masons (36 per cent decline);
• glaziers, window fabric and fitters (28 per cent decline).
Construction professional services (CPS) have also been hard hit by recession with 54
per cent of firms experiencing decreased fee incomes in the 12 months to October 2009
(CIC, 2009) and 46 per cent of CPS firms making redundancies over the period. The
claimant count for professionals with construction-specific skills has grown by more than
400 per cent from its lowest point in October 2007 to November 2009 (CIC 2009).
Over the medium term, growth in GDP is expected to be lower than long-term forecasts.
The Office for Budget Responsibility (OBR) recently downgraded its forecasts for GDP
growth for the next two to three years, but still predicts growth to be 2.5 per cent in 2015
(OBR, 2011).
Restrictions on credit (including mortgages) have shown signs of easing but it is unlikely
that they will return to their pre-recession state for a long time to come. Over the medium-
term, there is likely to be a rebalancing within construction: a change in balance between
public and private contracts, favouring the latter; and more output stemming from repair
and maintenance than new building as the client base looks to improve their existing
properties rather than invest in new ones.

Sector Skills Insights: Construction
20
Reductions in construction employment tend to lag behind falls in output in a recession as
employers try to maintain their experienced and skilled staff as long as it is viable to do
so. This implies that in the recovery period, employment gains will again lag behind those
in output. Employment in construction is not expected to reach pre-recession levels until
after 2014.
In the 1990s recession, the sector’s workforce and training activity reduced dramatically.
Between 1990 and 1993 the total number of trainees in the construction sector decreased
by almost 30 per cent and the number of workers under twenty years of age fell by almost
50 per cent. This has had longer term impacts on the sector in terms of skills shortages.
Where young workers find work in other industries they do not as readily re-enter the
construction industry in the post-recovery period, typically waiting until wages in the
sector rise significantly. There have been indications that training activity has decreased
similarly owing to the 2008/09 recession with 26 per cent of construction employers
reducing their training activity in 2010 and 18 per cent planning to reduce training further
in 2011 (CITB-ConstructionSkills, 2011).
Policy in the face of the most recent recession has emphasised the need to avoid such
contraction in training in order to facilitate recovery and ensure sever skills shortages do
not hinder future growth in construction. Employers in the sector have also recognised
the importance of training staff to ensure recovery with 24 per cent considering it to be
more important to improve the skills of their workforce post-recession (ibid).
3.3 Investment, Innovation and R&D
Investment is a key driver of productivity – raising productivity by increasing the amount
of capital available per worker, or through the adoption of new, better technologies in
production and / or delivery processes. Construction investment, as a share of economy-
wide investment, fell from 2.3 per cent to 1.4 per cent in 2009 (Skills Almanac 2010)
representing the smallest sector share behind Agriculture which accounted for 2 per cent
of investment in 2009.

Sector Skills Insights: Construction
21
Table 3.1: Sector investment as a share of total investment
Sector 2006 2007 2008 2009 Agriculture 1.9 1.8 2.1 2.0 Mining and quarrying 3.1 3.5 3.1 3.5 Manufacturing 9.2 8.9 8.4 7.9 Electricity, gas and water supply 3.7 4.5 5.1 6.3 Construction 2.3 2.1 1.7 1.4 Distribution 12.1 12.4 10.9 10.1 Hotels and restaurants 4.1 4.2 4.2 3.6 Transport and communications 15.6 14.5 15.2 16.0 Financial intermediation 5.5 5.5 5.6 4.6 Real estate, renting & business services 14.0 15.4 13.8 11.5 Public administration and defence 7.9 7.9 9.1 10.8 Education 5.3 4.9 5.6 7.2 Health and social welfare 3.3 3.2 3.7 4.5 Other services 11.9 11.2 11.5 10.5 Total 100 100 100 100
Source: UK Commission (2011) Note: Percentage shares of total investment based on current price data.
Construction is typically seen as a ‘low-tech’ or ‘traditional’ industry. Studies have
indicated that construction firms tend to be: risk averse, low investors in R&D, and
dominated by suppliers in the development of new technology (see Reichstein et al.,
2008, for a summary). The market orientation of construction firms, typically focused on
local, regional and sometimes national markets, also contributes to low levels of
innovation. Salomon and Shaver (2005) showed that firms that compete in different
markets often need to develop more capabilities to innovate.
Many innovative practices in UK construction typically arise from outside the sector.
Building material and products manufacturers, professional service firms and overseas
construction industries are often the source of innovation rather than the large
construction firms themselves. Firms in construction however, have been found to exhibit
‘innovativeness’ that is not captured by conventional definitions of innovation and R&D.
Clients and suppliers may be considered sources of, or partners in, innovative activity in
construction. Conventional measures of innovation, such as patent rates, are considered
by many to miss much of the innovativeness of construction and often construction is
omitted from cross-industry studies of innovation and performance (NESTA, 2007).

Sector Skills Insights: Construction
22
NESTA identified different types of ‘hidden’ innovation that are at play in ‘low innovation’
sectors. Particularly relevant to construction is innovation “without a major scientific and
technological basis, such as innovation in organisational forms or business models. For
example, the development of new contractual relationships between suppliers and clients
on major construction projects” (NESTA, 2007, p.5). NESTA also identifies “Locally-
developed, small-scale innovations that take place ‘under the radar’, not only of traditional
indicators but often also of many of the organisations and individuals working in a sector.
For example, the everyday innovation that occurs in multidisciplinary construction teams”
(ibid, p. 5).
BIS (2009) identified a number of innovative practices across projects in engineering
construction including projects that have features only found in the UK such as the
Sellafield Product Residues Store which is the only one of its kind and contains bespoke
handing equipment manufactured in the UK.
Formal R&D expenditure tends to be low in construction but there is evidence that firms
can benefit from such investment. Research and development (R&D) is considered as an
important input for innovation activity. It is seen to enhance the effectiveness of
construction companies and to increase their international competitiveness through
technological advances and managerial development (Kalatunga, 2009). Investing in
R&D helps construction firms to find solutions to problems (both their own and those of
clients) and to meet client’s needs and expectations. R&D is considered to have a
number of important benefits to construction companies including increasing their
competitiveness through development of new and improved construction materials and
development of products with lower costs and higher quality. Collaborative R&D is also
found to generate important intangible benefits including creation of informal contacts and
facilitation of knowledge transfer (ibid).
3.4 Technology
The use of automation and adoption of new technologies in construction has impacted on
the sector in the past and will continue to do so in future. Powell (1996) indicated that the
traditional methods in the construction industry are more amenable to gradual evolution
rather than radical alteration which has been illustrated through the sector’s adoption of
prefabrication or modern methods of construction (MMC) over the past.
MMC (offsite prefabrication or offsite construction) is a particularly important technological
advance in the construction industry which has implications for the sector as a whole and

Sector Skills Insights: Construction
23
in particular, for the skill needs of the sector. In 2003, the Government (Parliamentary
Office, 2003) viewed use of MMC in building houses as a way not only to deal with
housing shortages but also with skills shortages in the sector. Prefabrication and offsite
construction have also been identified in recent literature as a means of improving the
often inefficient and wasteful practices of the construction industry (see Taylor (2010) for
a summary of related literature).
Adoption of MMC increased in the early 1990s and its use is now more common than
ever in the sector. The offsite construction industry is now a significant contributor to the
continuous improvement of construction processes and site procedures. The actual value
of offsite construction varies by the methods and definitions used to measure the
industry. Estimates range from: £800.9 million (GVA) in 2002 (Samuelsson Brown et al,
2003); £2.2 billion in 2005; £4 billion in 2007; to an estimated £6 billion in 2009 (Goodier
and Gibb, 2005, 2007). Taylor (2010) estimated the total value added of the offsite
construction sector to have increased from £731 million in 1998 to a peak of £2.08 billion
in 2007 and down to £1.537 billion in 2008. Based on CPA forecasts (2009) and
considering the 2008/09 recession, Taylor projected the offsite sector value added to be
£1.295 billion in 2013 which is equivalent to around 7 per cent of all construction output.
Taylor notes, however, that with increased emphasis on sustainable construction,
demands for efficiency in construction and expectation of improved quality standards,
growth in the offsite construction industry may outstrip that of the traditional construction
sector.
3.5 Policy, Legislation and Regulation
There are long term policy trends towards improving the quality of work, including health
and safety regulations, work-life balance policies and minimum wage legislation. Other
long term trends include reducing the environmental impact of construction and
promoting sustainability of buildings. These trends in policy have changed much in the
construction industry for the better - improvements to workers’ well-being, enhanced
image of the sector – but have also imposed additional constraints and thus costs on
employers.
Changes in health and safety legislation have resulted in improved working conditions
and deceased workplace hazards in construction over the years. Health and safety is a
key concern of the sector and thus improving conditions is vital to improving the
attractiveness of the sector for new workers. Increased levels of regulation related to H&S
also requires knowledge and skills to implement any changes and processes required for
compliance. Increased health and safety regulation has had some negative effect on the

Sector Skills Insights: Construction
24
age structure of employment in construction with very few companies employing workers
aged under 18 years (see IER Net costs studies, p. 43 of 2008) due to the increased
complications of meeting health and safety requirements specifically related to younger
people in the workplace.
3.6 Environment and Low / Zero Carbon
The current government has put energy and climate change high on its list of priorities.
There are a vast number of initiatives related to climate change, zero carbon and
sustainability which have implications for construction. These policy initiatives include:
• CRC Energy Efficiency Scheme 2010 – mandatory climate change and energy
efficiency scheme in which companies using more than 6,000 MWh per year of
electricity are required to register. Whilst larger companies are likely to be the only
ones directly affected by this scheme in the construction industry, SMEs will also be
affected indirectly as larger organisations seek to reduce their carbon footprint. The
CRC scheme will present opportunities for construction companies to increase their
competitiveness by providing cost-effective and energy-efficient services and
buildings to clients.
• Zero Carbon Homes – from 2016, every new home in the UK will be required to be
zero carbon. This implies a 100 per cent reduction in all carbon emissions covered by
Building Regulations. In order to meet this requirement, companies will need
expertise related to using particular technologies and materials in buildings as well as
skills in assessing buildings’ sustainability and carbon footprint.
• Green Deal provisions in the Energy Act 2011 – provides a financial mechanism
which will eliminate the need for consumers to pay upfront for energy efficiency
measures and instead, repayment will be based on the cost savings resulting from the
improvements. The Green Deal is to start in late 2012. Installers under this initiative
will need to be accredited and will be backed by the official Green Deal quality mark.
The aim is that the Green Deal will result in an increase in the number of energy
efficiency installations in homes and businesses. This will require supply chains to be
in place to manufacture, specify, and install solutions to accredited standards thus
there are opportunities for businesses in the construction sector to achieve the
accredited skills and take advantage of increased activity.
The drive towards finding sustainable alternative energy sources, particularly, the view of
nuclear energy as a viable option for the future is also an important environmental
challenge facing construction. Moving to alternative energy sources will require

Sector Skills Insights: Construction
25
substantial construction activity in building structures, for example, nuclear power plants,
wind turbines, as well as retrofitting existing buildings in order to accommodate these new
power sources.
The construction sector is believed to be already demonstrating, at least in parts, that it
has the capacity and inclination to play a significant role in meeting the challenge of
climate change and using this challenge as an opportunity for growth in the UK and in
other markets (HM Government 2010).
3.7 Global Competition
There are many potential benefits available to those UK construction companies able to
compete globally. Working overseas enables firms to diversify their risk profile and to
benefit from a rich and varied pipeline of new-build projects in high-growth areas (CBI
2011), though in the face of global economic downturn the degree to which this is
possible is diminished. The standards of UK construction are internationally recognised
so that the reputation of UK firms precedes them in foreign markets. The highest potential
for growth is in markets such as China, Russia, India, Nigeria and Vietnam.
International competition in construction has been increasing as more firms expand into
rapidly changing overseas markets in order to capitalise on opportunities in international
economies. The revenue of ENR's “Top 225 International Contractors” from international
construction contracts outside of their home countries has increased from US$110.2
billion in 1997 to US$224.4 billion in 2006 ([ENR, 1994–2007a] and [ENR, 1994–2007b] ).
Construction services are perhaps the part of the sector most open to global competition.
Ernst & Young recently found construction services to be the sector with the greatest
potential for average annual growth in exports to 2020 with possible growth of 10.8 per
cent. Construction accounted for 0.6 per cent of UK exports and for 0.5 per cent of
imports in 2008 (Almanac) whilst construction services currently accounts for 0.4 per cent
of UK exports. (CBI, 2011). International regulation, particularly EU regulations, in have
also contributed to increased levels of international competition in the sector.
Being competitive in the global construction market requires contractors to be capable of
managing many aspects of construction projects including design, engineering,
procurement, and construction (Han et al., 2010). Completing international projects

Sector Skills Insights: Construction
26
requires significant management skills and sustainable strategies and intensified
international competition can increase the burden of bid participation.
Firms competing in the global construction industry face a number of key challenges,
including: a shift from conventional price competition to a framework in which non-price
factors are increasingly important (e.g. offering technology transfer, embarking on joint
ventures with local businesses or guaranteeing employment for local citizens); delivery of
more phases of the construction project process from planning and developing through to
financing, engineering and construction; needing to exhibit financial capacity to offer
finance arrangements as part of the service to owners; and existence of more
complicated and varying risk factors stemming from economic instability and increasing
costs of materials, equipment and labour (Han et al., 2010).
3.8 Migration
Increased international competition results in demand for higher skills but at the same
time, globalisation has also increased the supply of labour and skills for the UK
construction. Increased international mobility of labour has permitted immigrant labour to
serve as a short-term solution to skills shortages in the UK (RICS, 2005) but policy
emphasis has been on ensuring the UK has its own supply of skills to meet the
construction sector’s future needs over the longer term.
In 2008, BERR (2008) estimated that more than of 1.8 manual workers in construction,
144,000 (8 per cent) were migrants. This figure does not account illegal workers. The
Health and Safety Executive estimates that overseas workers make up around 6 per cent
of the construction workforce in Great Britain and that the proportion of foreign or migrant
workers on larger sites in the bigger cities such as London, Birmingham or Glasgow, may
rise in excess of 25 per cent (HSE, website).
It should also be noted that UK workers are often engaged in construction works
overseas, especially in the engineering construction sector where there appears to be an
international labour market with workers moving from high paying major project to high
paying major project.
3.9 The Role of Skills in Overall Competitiveness
Skills are vital to the competitiveness of firms in any sector, including construction.
Construction firms need various skills in order to take advantage of opportunities currently
presented in the sector and those expected to come to the fore over the medium to long
term. These opportunities include major infrastructure activity for nuclear and other new

Sector Skills Insights: Construction
27
energy sources, implementation of low / zero carbon technologies in new and existing
buildings, movement into BRIC markets (particularly for construction services e.g.
architecture, project management) and moves towards increased repair and maintenance
relative to new building.
Within construction, increased regulation such as health and safety requirements and
zero carbon requirements, require compliance from companies and in order to ensure
that this is achieved efficiently and without delay, companies need to have knowledge
and understanding of the regulations. This requires particular skills for not only
understanding and managing compliance but also for on-the-ground implementation of
necessary processes.
Small firms play a key role in construction yet they are reluctant to take on trainees when
output demand is uncertain (ConstructionSkills, 2011). Many such firms do not plan for
the future and many consider themselves too small to do much about the challenges
posed by climate change directly (Revell and Blackburn 2007; Bradford and Fraser
2008). Such firms, however, often act as subcontractors of larger firms which are
implementing significant changes to meet environmental and regulatory challenges.
Insufficient skills capacity can lead to tender price inflation thereby reducing a firm’s
competitiveness. Having capacity in terms of skills also enhances a firm’s ability to
respond to tenders readily and to fulfil contracts in a timely fashion. In the face of
increased global competition, having the right amount of the right skills is especially
pertinent. While the increasing use of self-employed people and contractors can provide
flexibility so that employers do not have people within their organisation whose skills are
not being utilised at a particular point in time, the use of this form of working arrangement
can present challenges, for example, employers have less direct control over the
availability of such workers at times of high demand and must compete for their services,
potentially driving up costs.
Whilst most training in the sector is carried out within small firms, there are many in the industry, large firms and self-employed gangs, who rely on ‘pay and poach’ policies to obtain skilled labour (Briscoe 1993).
Large projects, such as the Olympics, often induce skilled workers onto sites, away from other companies, by pay incentive, resulting in costs escalating.
3.10 Strategic Role of Management
Management skills will play a key role in how well construction firms can respond to the
challenges presented above. Increasingly, management of construction projects,
particularly those in international markets, requires management of all aspects of the
Sector Skills Insights: Construction
28
project, from planning and development to sourcing to actual building. Alongside this,
management of human resources is vital to increase productivity and to ensure that
projects are completed within contract terms (e.g. on time).
Construction managers need to take a strategic view, particularly when working within an
environment of increased regulation and global competition. This includes considering
investment in skills in a strategic manner. There is evidence that the quality of
management in the construction sector has been improving. In 2007, 14 per cent of
management had no qualifications whilst in 2010/11 just 7 per cent had none. Employers
continue to develop their managers, with more than half providing training or
development for managerial staff over the last year (2010/11) (Labour Force Survey).
With increased automation in construction, including the use of prefabricated components
for homes, the role of management has changed with more need for managing workers
offsite as well as in overseeing the coordination of various aspects of the job onsite such
as the delivery of different components and trades during the building process. Whilst
automation (and other technological advances) reduces the need for manual trades
onsite, the need for management is not diminished and if anything becomes more
important.
The CITB-ConstructionSkills survey of Management and Supervisory Skills in 2007
highlighted that the skills that were insufficient amongst managers and supervisory staff
that were considered most important included: ensuring projects run to cost and
managing project finances; maximising productivity of staff; indentifying potential new
markets and clients and winding new business; and estimating costs accurately. Effective
resource management and effective people management of people have been found to
be critical success factors in collaborative research and development projects in
construction (Kalatunga, 2009).
3.11 Conclusion
A number of key challenges face construction over the medium term (as well as
immediately and in the long-run). The recent recession has had adversely affected the
sector and the recovery presents a number of challenges to all parts of the sector.
Adoption of new technologies and movements towards low/zero carbon building are
particular challenges for the sector that have implications for skills demand and the

Sector Skills Insights: Construction
29
sector’s performance. Operating in a sector with increasing levels of regulation in a
variety of areas (e.g., health and safety and sustainability) and with increasing global
competition presents further challenges to employers.
The UK construction sector is well placed to meet the challenges over the medium term.
Most employers have shown willingness (and readiness) to comply with various
environmental and sustainability requirements and many UK firms have been winning
international contracts and taking part in international collaborations. The role of higher
skills and in particular, management capabilities are vital in ensuring growth of the sector
in response to these challenges and others.
Section 4 considers the implications of these various drivers of change for employment
and skills demand.

Sector Skills Insights: Construction
30
4 Employment and Skill Demand in the Sector
4.1 The Changing Demand for Employment
Construction employment has reduced significantly since its peak in 2007. Since the
1990s, the share of the workforce working as self-employed individuals and / or as
labour-only sub-contractors has been increasing. Between 2002 and 2009, the self-
employed share of employment in construction has increased from 36.1 per cent to 37.3
per cent. This is compared to growth in self-employment across all sectors from 12.2 per
cent in 2002 to 13.4 per cent in 2009. Construction employment has remained male-
dominated with more than 90 per cent of workers being male compared to a reduction in
the male share of employment across all sectors of 0.2 percentage points to 53.9 per
cent in 2009. The share of employees in the sector who are on permanent contracts
increased from 95.6 per cent in 2002 to 97.1 per cent in 2009.
Factors that affect skills demand in the industry, while not unique to construction, have
different implications on the resulting demand for skills compared to other sectors. The
main factors affecting the demand for skills in the construction industry are explored in
section 4.2.
4.2 Factors Affecting the Demand for Skill
The National Strategic Skills Audit (UK Commission, 2010) identifies a number of key
drivers that will impact on the demand for skills in the future. These drivers are
interdependent and the dynamic interplay of these means that the future skill
requirements are not certain. ConstructionSkills (2011) commissioned research of
training and skills in the construction sector which indicated that, of those employers and
sole traders who expect to need new skills and / or knowledge to be acquired by at least
one person in the business over the next twelve months, almost half believed this need
would be stimulated by new legislative or regulatory requirements. Other main sources of
demand for skills/knowledge included introduction of new working practices (excluding
‘green’ practices); introduction of new technologies or equipment; development of new
products and services. Just less than 30 per cent of employers indicated that
environmental regulations and new eco or energy-saving design / build methods
stimulated the need for new skills / knowledge in the next 12 months.
Many of these drivers and their impacts on construction have been discussed in Section
3. The implications of these drivers for skills demand are explored further here.
Policy, regulation and legislation

Sector Skills Insights: Construction
31
Government policy, regulation and legislation (locally, regionally, nationally and
internationally), have significant implications for construction activity and hence for the
sector’s demand for skill. The UK Government has long been a major source of activity
for the construction sector with 30 to 40 per cent of construction output being driven by
the UK Government1.
Legislative changes and policy initiatives influence the demand for skills in the
construction sector in order to comply with regulations and legislation and thus to remain
competitive in the presence of increased regulation. In the case of environmental-related
regulations, there is a need for greater understanding of low carbon and zero carbon
technologies in particular thus demand for higher skills.
In the 2007 survey of management and supervisory skills, where employers indicated that
they had staff working in ‘green roles’ (e.g. solar panel installers, renewable energy
installers, carbon managers) in most cases, these staff members were developed from
within the business or the employer used specialist firms or self-employed staff to deliver
the activity. Green roles were not found to require significant training that was hard to
source.
Technology
With the use of MMC, new and upgraded skills are required by workers in the industry.
Increased use of off-site construction, for example, brings about a shift in the mix of skills
required onsite (e.g. more fitters, more site managers, fewer carpenters). Similarly,
greater use of automated tools requires new skills and makes other skills redundant.
In general, increased use of offsite construction requires fewer workers on construction
sites in the UK than more traditional forms of building but all is not lost in terms of overall
employment. With MMC, employment is created in areas away from the building site
including in the factory in which prefabricated components are manufactured and in the
design process (Taylor, 2009). Use of MMC also requires improved and new skills in
order to effectively build using such processes including technology-related skills (e.g.
CAD, automated tools) and places greater emphasis on the management of projects.
Globalisation
1 LEK Consulting, Construction in the UK Economy, 2009 (www.cbi.org.uk/lekreport)

Sector Skills Insights: Construction
32
Globalisation also has repercussions on regulation and legislation including international
agreements on climate change as well as a number of European regulations regarding
health and safety (e.g. working time), etc. In order to compete in overseas markets, UK
construction companies need the skills to meet regulatory requirements in other countries
as well as within the UK. Success internationally requires skills to ensure efficiency,
innovativeness and differentiation.
Whilst significant growth in global construction markets is expected, the benefits of such
growth will not necessarily accrue to the UK construction sector. Some construction
companies will benefit but more often, firms that are not part of the defined construction
sector will stand to gain.
The Review of Engineering Construction (Gibson, 2009) found that whilst some UK-
based companies are taking advantage of business opportunities overseas, there is
evidence that cultural and linguistic differences may pose significant barriers for UK
companies seeking and winning work in other EU member states. The Review found little
evidence that there are significant differences between the craft skills in the UK and other
countries. The skills required for international competition then are somewhat more
varied from those required for operation in only domestic markets.
Consumer demand
The construction sector, like all sectors, supplies goods and services to consumers –
individuals, private companies or the Government. The demand from consumers then is
ultimately the driver of the activities taking place in the sector and the types of outputs
produced. As the construction sector covers a wide variety of sub-sectors, including civil
engineering, engineering manufacturing and house building, consumer preferences vary
considerably across parts of the sector.
Overall, consumer uncertainty in the face of recession and restricted credit conditions has
increased overall uncertainty in the market and therefore has dampened consumer
demand for construction and overall. In the thirst quarter of 2011, construction workloads
remained broadly flat (RICS UK Construction Market Survey, Q3 2011).
There has been growing interest in property development in the UK over the past 25
years so that individuals place increasingly high demands on builders including
requirements for energy efficiency and high quality finishes. Preferences between urban
and rural dwellings and preferences regarding home ownership versus rental also have
important effects on the demands placed upon the sector.

Sector Skills Insights: Construction
33
All clients in the construction sector influence the demand for skills through their demand
for better performance, delivery and more importantly, value for money. Timely delivery is
especially important with moves towards use of contracts which explicitly set out
timescales and bonuses/penalties for early/late completion. Meeting these demands
requires that companies develop accurate plans and are able to predict the duration of
jobs. Being able to operate this way requires new and higher level skills, particularly non-
manual, professional and management skills.
Demographic change
Demographic change also drives demand in the sector. An ageing population and
changes in the overall health of the country has implications for needs in terms of
healthcare, housing education and infrastructure building. Lower average family sizes
and increased divorce rate have led to increased demand for single-person dwellings.
Increased life expectancy and the health of older people, impact on the need for hospitals
and care homes and thus their construction, repair and maintenance.
The ageing population also has implications for the construction sector workforce. The
age structure of the construction workforce has implications for the supply of skills in the
sector. Key skills can be lost through retirement and there is a need to attract younger
workers to the industry in order to replace lost skills. The often physically demanding
roles in construction also place restraints on workers as they age.
4.3 Changing Patterns of Skill Demand
Table 4.1 shows changing patterns of skill demand based on Working Futures forecasts.
The shares of total construction employment in the higher occupational groups
(managers, directors and senior officials, professional occupations and associate
professional and technical occupations) are expected to increase over the period 2010 to
2020 by 25.6 per cent. This is compared to 15 per cent for all sectors (see Table 4.1).
These increases are consistent with the drivers of skills demand and the key challenges
facing the sector discussed above. Increase in the demand for managers is consistent
with increased involvement in international construction markets and greater use of off-
site construction processes. Similarly, rising demand for professional occupations and
technical occupations is consistent with increased need for R&D and innovation in
construction which are key to maintaining competitiveness as well as supplying more
service-based products to both the domestic and export markets. The move towards low /
zero carbon building and sustainability is also a driving force behind these changes in
that taking advantage of the opportunities presented by such policies and regulations

Sector Skills Insights: Construction
34
requires specialist knowledge and expertise to design and construct suitable buildings
and provide retro-fit solutions and maintenance to existing structures.
Demand for caring, leisure and other service occupations is also projected to increase by
27.3 per cent over the 10 years to 2020 (compared to a 11.5 per cent increase across all
sectors) but the absolute change in employment in this occupation is small at only 2,000
jobs.
No change is expected in demand for process, plant and machine operatives but the
share of employment in this group is set to decrease in the face of growing demand for
other occupations (making up six per cent of the construction workforce in 2020
compared with five per cent across all sectors). A small change (4,000 jobs) is projected
for elementary occupations in construction but this occupation’s share of employment is
also set to decrease (making up four per cent of the construction workforce compared to
ten per cent across all sectors). Similarly, a relatively small increase in demand for sales
and customer service occupations is forecast. These changes are consistent with
technological advances in the construction industry including MMC and use of automated
tools. Pre-fabricated building reduces the use of manual labour on construction sites and
necessitates more use of automated tools for fitting components together. A significant
increase in skilled trades occupations of 84,000 jobs (7.2 per cent increase) is also
consistent with these trends in the sector and above that for the whole economy which is
estimate to decrease overall (6.5 per cent reduction).
The only occupation in which demand is expected to decrease between 2010 and 2020 is
administrative and secretarial for which the net change in employment is estimated to be
6,000 jobs or a 2.7 per cent decrease (whole economy comparison is 10.5 per cent
reduction).
Table 4.2 shows the level of skill demand by qualification level. It reveals the relatively
strong demand in the sector for people qualified to an intermediate level with 33 per cent
qualified at QCF 3-4 in 2010 compared with 24 per cent in the economy as a whole. By
2020 the respective figures are expected to decrease to 28 per cent and 22 per cent.
Table 4.1: Changing Pattern of Skill Demand
Employment Numbers (000s) % shares Change 2010-2020

Sector Skills Insights: Construction
35
Growth 2010-2020
Occupation 2010 2015 2020 2010 2015 2020 (000s) (%) All sectors
(%) Managers, directors and senior officials 240 274 312 9.2 10.0 10.7 72 30.1
18.0
Professional occupations 395 440 485 15.2 16.1 16.7 90 22.9
14.9
Associate professional and technical 228 256 283 8.8 9.3 9.7 55 24.0
14.0
Administrative and secretarial 217 212 211 8.3 7.8 7.3 -6 -2.7
-10.5
Skilled trades occupations 1180 1209 1264 45.4 44.2 43.5 84 7.2
-6.5
Caring, leisure and other service 6 7 8 0.2 0.3 0.3 2 27.3
11.5
Sales and customer service 43 47 51 1.7 1.7 1.7 7 16.4
0.1
Process, plant and machine operatives 180 181 180 6.9 6.6 6.2 0 0.0
-10.9
Elementary occupations 110 111 114 4.2 4.1 3.9 4 3.8
3.2
All occupations 2599 2737 2908 100.0 100.0 100.0 309 11.9 5.1 Source: Wilson and Homenidou (2011) Base: SSA Definition
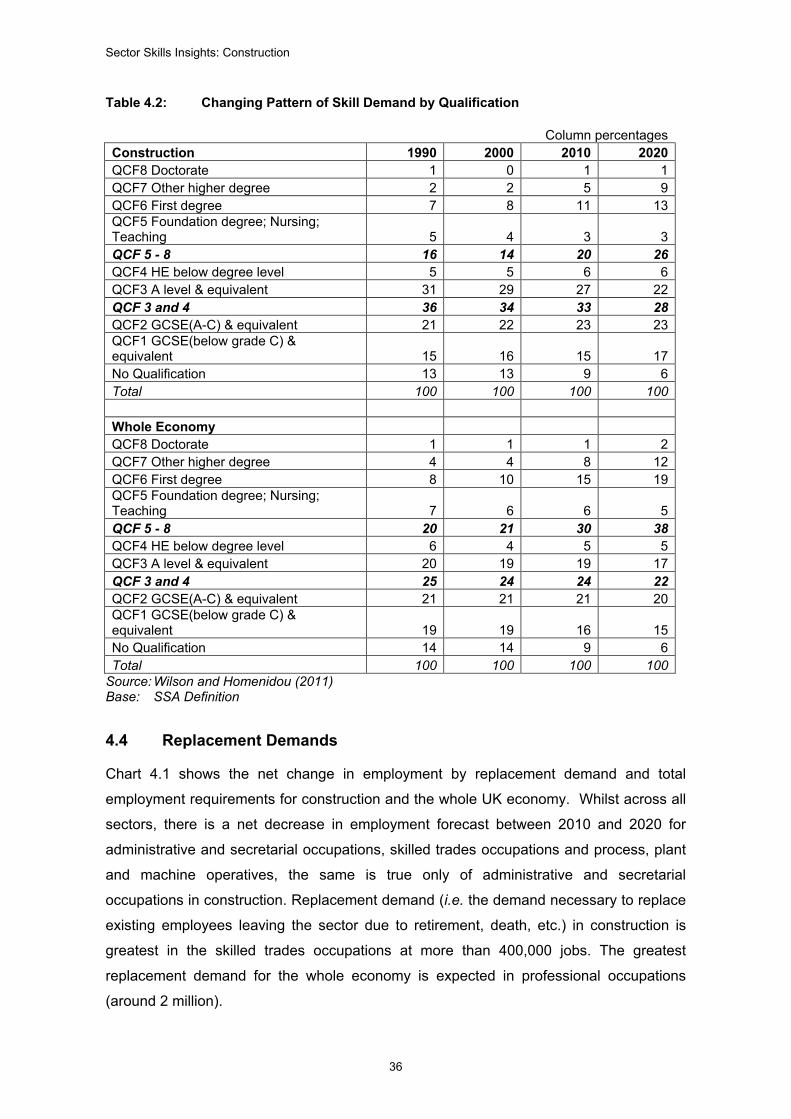
Sector Skills Insights: Construction
36
Table 4.2: Changing Pattern of Skill Demand by Qualification
Column percentages
Construction 1990 2000 2010 2020 QCF8 Doctorate 1 0 1 1 QCF7 Other higher degree 2 2 5 9 QCF6 First degree 7 8 11 13 QCF5 Foundation degree; Nursing; Teaching 5 4 3 3 QCF 5 - 8 16 14 20 26 QCF4 HE below degree level 5 5 6 6 QCF3 A level & equivalent 31 29 27 22 QCF 3 and 4 36 34 33 28 QCF2 GCSE(A-C) & equivalent 21 22 23 23 QCF1 GCSE(below grade C) & equivalent 15 16 15 17 No Qualification 13 13 9 6 Total 100 100 100 100
Whole Economy QCF8 Doctorate 1 1 1 2 QCF7 Other higher degree 4 4 8 12 QCF6 First degree 8 10 15 19 QCF5 Foundation degree; Nursing; Teaching 7 6 6 5 QCF 5 - 8 20 21 30 38 QCF4 HE below degree level 6 4 5 5 QCF3 A level & equivalent 20 19 19 17 QCF 3 and 4 25 24 24 22 QCF2 GCSE(A-C) & equivalent 21 21 21 20 QCF1 GCSE(below grade C) & equivalent 19 19 16 15 No Qualification 14 14 9 6 Total 100 100 100 100
Source: Wilson and Homenidou (2011) Base: SSA Definition
4.4 Replacement Demands
Chart 4.1 shows the net change in employment by replacement demand and total
employment requirements for construction and the whole UK economy. Whilst across all
sectors, there is a net decrease in employment forecast between 2010 and 2020 for
administrative and secretarial occupations, skilled trades occupations and process, plant
and machine operatives, the same is true only of administrative and secretarial
occupations in construction. Replacement demand (i.e. the demand necessary to replace
existing employees leaving the sector due to retirement, death, etc.) in construction is
greatest in the skilled trades occupations at more than 400,000 jobs. The greatest
replacement demand for the whole economy is expected in professional occupations
(around 2 million).

Sector Skills Insights: Construction
37
Replacement demand in professional occupations in construction is around 150,000 - the
second highest replacement demand in the sector. The highest net change in demand is
forecast for professional occupations in both the construction sector as well as in the
whole economy.
Chart 4.1: Replacement Demands
Source: Wilson and Homenidou (2011)
Replacement demand and the age structure of employment in construction are
interrelated. As discussed in section 2.3, younger (under 24 years of age) and older
workers (60+) account for relatively low shares of total employment in construction. The
tendency of workers over the age of 60 to leave the sector increases replacement
demand as vital skills held by older workers leave the sector. Meeting replacement
demand is a concern as many of the skills held by retiring workers are essential to the
sector and the sector is keen to attract younger workers in order to do this however, there
have been concerns over the attractiveness of the sector to younger workers. If
replacement demands are not met through the entry of young people initially in training
positions into the sector, then it is not clear where those skills will come from. The
danger then is that wage inflation is stimulated as companies scramble to recruit skilled
employees. Replacement demand in the sector is also affected by the tendency of many
workers with construction skills to move to other sectors. Recession in particular, tends to
drive such workers out of the industry and it is only with wage rises in construction that
they will return.
-100 0 100 200 300 400 500 600
Elementary occupations
Process, plant and machine operatives
Sales and customer service
Caring, leisure and other service
Skilled trades occupations
Administrative and secretarial
Associate professional and technical
Professional occupations
Managers, directors and senior officials
Construction
Net Change Replacement Demand Total Requirement
[thousands]-1000 0 1000 2000 3000
Elementary occupations
Process, plant and machine operatives
Sales and customer service
Caring, leisure and other service
Skilled trades occupations
Administrative and secretarial
Associate professional and technical
Professional occupations
Managers, directors and senior officials
Whole economy
Net Change Replacement Demand Total Requirement
[thousands]

Sector Skills Insights: Construction
38
4.5 Conclusion
The key drivers of change in construction (as discussed in Section 3) have a variety of
implications of skills demand in the sector. Meeting low/zero carbon requirements,
adopting new technologies and satisfying various regulations requires particular specific
skills and alters the importance of particular occupations. Skills to fill replacement
demand as older workers leave the sector are particularly important in construction given
the nature of work and the age structure of the workforce.
The interplay of the various key drivers means that there is a degree of uncertainty over
future skills demands, which can be problematic in encouraging employers to invest in
skills development. Amongst the key drivers, complying with regulatory changes, has
been found to be the most likely to stimulate demand for new skills and knowledge.
Remaining competitive in the face of increased regulation is a key challenge for
employers in the construction industry. There is immediacy in the need of employers to
develop skills that enable them to comply with regulatory demands. Whether employers
are able to be pro-active in meeting the demands posed by other key drivers of skills
development, such as technological change and globalisation, remains a key question.

Sector Skills Insights: Construction
39
5 Skills Supply In order to cope with the challenges facing construction over the medium-term and
resultant changes in demand for skills, adequate supply of skills (in terms of quantity and
type of skills) is essential. This section looks at the current infrastructure and trends in the
supply of skills in the UK construction sector.
5.1 The Supply Infrastructure
Organisations responsible for training supply
Skills supply is dependent upon the supply of labour, the skills infrastructure (including
compulsory education, further education and higher education), and employers’
investment in skills. A sufficient supply of skills is required to increase productivity and to
meet future demand for skills thus encouraging growth in construction.
Training in skills for the construction sector is provided by a range of institutions, including
private training providers and higher and further education institutions. The importance of
different institutions varies by sub-sector within the construction industry, and whether
training is designed for initial entry into the construction industry or is part of on-going
vocational education and professional development.
Private training providers are most commonly used by employers in the construction
sector to deliver training to their employees. In 2011, 63 per cent of employers said that
they used these organisations, with construction contracting employers being more likely
to use them than professional services employers. Higher Education institutions and
professional institutions were more important sources of training for professional services
establishments, in each case being used by at least half of the professional services
employers (ConstructionSkills, 2011:36).
Various bodies oversee training in the construction sector:
• ConstructionSkills covers the building and civil engineering aspects of construction
• Summit Skills represent building services engineering, including industries such as
electro-technical, heating, ventilation, air conditioning, refrigeration and plumbing.
Summit Skills oversees the qualifications in this sector, apprenticeship frameworks,
the quality assurance system for welders and the Engineering Services SKILL card
for experienced engineers
• The Engineering Construction Industry Training Board, which operates the grant-levy
system in the engineering construction sub-sector
• Similarly, Asset Skills covers housing, property and facilities management
Sector Skills Insights: Construction
40
• Proskills covers building materials, products and manufacturing
• LANTRA represents the environmental and land-based sector
• The Energy and Utilities sector has its own skills body.
Chan and Moehler (2008) find that this diversity of groups representing the construction
sector causes confusion with regard to who drives skills development from a policy-
making perspective and creates a lack of confidence in training provision amongst
construction sector employers.
The main training board for the construction sector in the UK is ConstructionSkills. It is
licensed as the Sector Skills Council (SSC) for construction through the UK Commission
for Employment and Skills (UKCES). ConstructionSkills is, uniquely amongst the SSCs, a
partnership comprised of three different organisations brought together to ensure
coverage of the whole of the construction industry and the whole of the UK: CITB-
ConstructionSkills, the Construction Industry Council (CIC) and CITB-ConstructionSkills
NI.
The responsibilities of ConstructionSkills include maintaining qualifications and standards
in the construction industry, including developing the National Occupational Standards
(NOS) (ConstructionSkills (Craft) in partnership with the CIC (Technical, Supervisory and
Management)), and overseeing the Qualifications and Apprenticeship Frameworks and
the Diploma in Construction and the Built Environment (C&BE). ConstructionSkills
collects an annual levy from all liable employers which is used to fund grants to
employers for training their workforce. Grants are available for: apprenticeships and craft
non-apprenticeships; work experience; off-the-job training; technical and professional
achievement and attendance; vocational qualifications achievements; training and
development plans and Independent Training Group; the Construction Plant Competency
Scheme (CPCS) and Site Safety Plus.
ConstructionSkills works alongside employers, training providers and the Government in
developing the ConstructionSkills Sector Skills Agreement to ensure that training is
appropriate for employers and individuals and that future skills needs are met. The other
organisations responsible for each sub-section of the construction industry undertake
similar activities for the occupations that fall under their remit.
Other interested parties can play a role in determining the direction of skills development
in the construction sector. These include groups like the Federation of Master Builders,
the Federation of Small Businesses and the Confederation of British Industry.
Outline of the qualifications structure
Sector Skills Insights: Construction
41
Training and education in the construction sector covers a wide range of qualification
types, levels and subjects, and is done both on- and off-the job. Currently there are at
least 20 awarding bodies which provide qualifications to different branches of the
construction industry.
A major reform of the vocational qualifications system has being undertaken, with the
introduction of the new Qualification and Credit Framework (QCF), which is designed to
make the system more intelligible. Prior to this, there was widespread concern that the
range of qualifications available was not understood by employers, and this, together with
the continual changes to the structure of the qualifications most relevant to the
construction industry, acted as a barrier to take-up of training. The different nations of the
UK have traditionally had different levels and credit systems. The QCF has three basic
levels and a further eight levels. The three entry levels cover basic skills and the further
eight levels range from the equivalent of GCSEs or Level 2 NVQs to PhD or Level 5 NVQ
standard. The main qualifications levels are outlined in Table 5.1.
There are additional qualifications aimed at demonstrating competencies in specific
areas. The Construction Skills Certification Scheme (CSCS) covers 220 occupations, and
different cards are available depending on job type, experience, qualifications and
membership of professional bodies. To qualify, applicants must pass an appropriate
CITB-ConstructionSkills health and safety test, and in some cases register for particular
qualifications.
Schemes aimed at particular occupations include: the Construction Plant Competence
Scheme (CPCS) which provides a competence card for the plant sector; the quality
assurance scheme for welding; and the Engineering Services SKILL card aimed at
advanced engineers. The Competent Persons Schemes (CPSs) require individuals to
complete an application and vetting process, after which they can self-certify that their
work meets building regulations.
Around a third of the construction employers who offer training provide training designed
to lead to a nationally recognised qualification. The majority of training is focussed at
Level 2, and professional service employers are more likely than construction contracting
employers to offer higher level training. Amongst the UK nations, achievement of Level 3
qualifications is highest in the sector in Scotland and lowest in England
(ConstructionSkills, 2011:35).
Table 5.1: Main construction qualifications – levels and descriptions

Sector Skills Insights: Construction
42
Qualification and level Description / examples
QCF - Entry, Levels 1, 2 and 3 Basic, key skills
QCF – Levels 1 and 2 Young Apprenticeships, Intermediate Apprenticeships, Specialist Apprenticeships, GCSE in Construction and the Built Environment, NVQ/SVQ Level 1 and 2, Scottish Skills For Work: Construction SCQF Level 4 or 5, Diploma in Construction and the Built Environment
QCF – Levels 3 – 5 Advanced Apprenticeships, HNC (Level 4), HND (Level 5), Foundation degrees, NVQ Level 3 and 4
QCF – Level 6 Degree level qualifications
QCF – Level 7 and 8 Higher degrees
Vocational Related Qualifications (VRQ)
Including craft construction awards and craft certificates, which can be at any QCF level
Other • Qualifications and training programmes aimed at progression into management and supervisory roles;
• Qualifications from professional institutions, often linked to an existing course, for example in the accreditation of degree courses
Source: Adapted from ConstructionSkills and UKCES (2007)
Apprenticeships
Although no formal pre-apprenticeship programmes exist, colleges in the UK offer
programmes designed to provide an introduction to the construction industry. The GCSE
in Construction and the Built Environment and the Scottish Skills for Work: Construction
SCQF Level 4 or 5, serve such a purpose, as did the now discontinued Young
Apprenticeships, which aimed at 14-16 year olds who study for a Level 2 qualification. At
the post-16 level, the Diploma in Construction and the Built Environment is also designed
to introduce young people to the construction sector.
Formal Apprenticeships are primarily aimed at those aged 16 to 19. These are work-
based training programmes undertaken with an employer in combination with off-the-job
learning. These Apprenticeships are designed to give apprentices practical work
experience while also gaining a nationally recognised qualification. Apprenticeships
usually last for two years (for an Intermediate Level Apprenticeship, giving a Level 2
qualification) or three years (for an Advanced Apprenticeship giving a Level 3
qualification). Apprenticeships are available in a range of areas, including:

Sector Skills Insights: Construction
43
• Construction, which is one of the broadest groups of apprenticeships, including
pathways covering job roles such as bricklaying, scaffolding, painting and decorating,
roofing, joinery and crane operation
• Electrical and Electronic Servicing
• Electro-technical, which covers installation and maintenance electricians
• Domestic Heating
• Plumbing
• Set crafts – carpenters, painters and plasterers working in theatres
• Surveying.
Specialist Apprenticeships have been designed for specific sectors, and these have a
larger component of on-the-job training while still providing a Level 2 equivalent
qualification. Occupations that offer Specialist Apprenticeships include: Diamond drilling
and sawing; Hire and rental desk operative; Resin flooring; Road safety marking;
Demolition site operative; and various types of roofer. The heritage construction sector
has pioneered Level 3 qualifications in a range of occupations, but there is scope for
growth of higher level apprenticeships more generally. There is a danger that the
emphasis on providing training for school leavers entering the sector results in higher
level Apprenticeships for those already working in the sector being neglected.
Employers have expressed concerns about the balance between on-the-job training and
of-the-job learning on apprenticeships, particularly the basic skills element of off-the-job
learning which employers feel should have been adequately addressed prior to the
apprenticeship and which some apprentices have found hard to pass while still
possessing the necessary technical or job specific skills to enable them to do their job
(Construction Skills and UKCES, 2007). The sector has been a key employer for school
leavers with relatively low qualification levels and basic skills, who could benefit most
from an apprenticeship programme but may be deterred by the perception that an
apprenticeship of this type will focus more on these areas than equipping them with job-
related skills, leading them to forgo the apprenticeship for informal on the job training.
There need to be clear progression routes from completion of a Level 2 apprenticeship to
further training at Level 3 and above to develop skills in the sector and retain trained
individuals.
On completing an apprenticeship, employees may progress onto an HNC, HND,
Foundation or undergraduate degree or alternatively seek further training designed to
enable them to progress into managerial or supervisory roles. Further or Higher
Sector Skills Insights: Construction
44
Education is most common in the sectors of the construction industry connected to
engineering and architecture, particularly civil engineering, building surveying and
property management and construction design. For these professions, course
accreditation by a professional institution is important.
Recruitment into the sector and initial and continuing vocational education and professional development
The construction sector has faced on-going problems of skills shortages (Chan and
Moehler 2008). The industry has traditionally not invested heavily in formal training, and
qualification levels have historically been low, with only around a third of the construction
workforce trained to Level 2 or higher. Train to Gain had a significant effect on publicly
funded training and qualifications in the construction sector. ConstructionSkills estimate
that nearly 50,000 construction related Level 2 NVQs were achieved in 2008-09
(ConstructionSkills Insight, 2010). The construction sector is also vulnerable to
fluctuations in the economy. Loss of workers during the recession has caused concern
about the sector’s ability to meet the demand for skills during a recovery, as well as
limiting investment in training aimed at long-term increases in skill levels in the sector.
It has been forecast that on average 88,000 new entrants per year are needed to meet
expected workloads 2008-2012 (ConstructionSkills 2008), but the sector has experienced
problems in attracting new entrants. ConstructionSkills and UKCES noted in 2007 that
young people applying to enter the construction sector were not of the right quality and
were poorly prepared, and that the construction sector was regarded as being most
suitable for those who had been unsuccessful in education (ConstructionSkills and
UKCES, 2007). The Aldersgate Group identify a lack of basic skills amongst new recruits
as being a problem for the construction sector, and highlights ICT skills as being
particularly important for new recruits given developments in the industry.
Over recent years, there has been a change to the way in which apprenticeships are
offered by employers. A higher proportion are now aimed at new recruits to the sector,
rather than, as had previously been the case, encouraging existing employees to
undertake this type of training (ConstructionSkills, 2010), and attempts have been made
to inform students about careers in construction, and the qualifications available to them,
while they are still at school.
At graduate level, Universities UK found that there has been an increasing demand for
graduates in the construction sector and that universities were working with employers to
address skills needs both in terms of the provision of courses for continuing professional
education and for new graduate entrants to the construction industry (UUK, 2007).

Sector Skills Insights: Construction
45
Despite this, skills gaps at higher levels have been identified, including those in
engineering, management and ICT and in SMEs (Aldersgate Group, 2009)
The focus on improving qualifications prior to entering employment has been a response
to the historically low levels of continuing vocational education and professional
development in the construction industry, and in particular a lack of formality both in
training provision and accreditation. A 2010 survey by ConstructionSkills found that
employers generally believed that on-going training and skills development was lacking in
the sector and that the training provided was not appropriate (ConstructionSkills Insight,
2010:17). In 2007 the median annual training days per full time equivalent employee was
just one day (BERR, 2007). This is exacerbated by the relatively high levels of self-
employment and high proportion of SMEs in the sector.
When training has taken place, it has tended to be informal and done on the job. Chan
and Moehler (2008) identify a lack of confidence in formal training as one barrier to
increasing training and qualification levels in the construction sector.
Some parts of the construction industry face particular problems due to a lack of skills
available and have specific training needs. As has been mentioned, a lack of higher level
skills has been noted in project management, planning and design, particularly in
architecture, civil and construction engineering and domestic house-building sectors. This
has been a problem for the sector for several years, being noted in reports from 2008
(BERR), 2009 (Gibson) and 2010 (ConstructionSkills). ConstructionSkills (2010:18) also
identified particular training needs in the areas of air tightness and thermal bridging for
which no training course was offered to address skills gaps. The renewables sector was
also identified as requiring higher level, specialist skills in planning and design.
5.2 Trends in Skill Supply: The Levy Scheme and Certification
Important in relation to skills supply is the industry’s use of a grant-levy scheme
administered at the sectoral level to ensure that certificated, industry approved training
(especially of new entrants) takes place, and the use of a card scheme so that skilled
workers can demonstrate their bona fides. In combination, these work to drive up skill
levels in the sector.
In the construction sector it is often the smaller firms which carry out training of new
entrants but it is the larger companies who often benefit from this training either through
subcontracting arrangements or recruiting fully experienced workers later in their careers.
In order to offset the negative impact this might have on training supply, the industry has
a grant-levy scheme whereby all employers within scope of Construction Skills with an

Sector Skills Insights: Construction
46
annual wage bill of over £80,000 a year pay a levy.2 Grants are then paid to employers
who engage in training. A similar scheme operates with respect to those employers in-
scope of the Engineering Construction Industry Training Board.
The sector has introduced a form of occupational licence through the Construction Skills
Certification Scheme (CSCS). This has been implemented by the industry to ensure that
people are competent to practice in their occupation and reduce the number of accidents.
They cards which are issued to people who satisfy the application criteria are provided
with a smart-card which is increasingly demanded as proof of occupational competence
by contractors in the public and private sectors. Successful applicants need to pass a
health and safety test and demonstrate their competence (such as demonstrating
qualifications possessed).
5.3 Trends in Skill Supply: Individuals
Table 5.2 indicates the number of employees in receipt of work-related training over the
past 13 weeks. The proportion of the construction workforce in receipt of such training
(18.2 per cent) is lower than the proportion across the whole economy (25.5 per cent).
The percentage of workers aged 25 years and under who have received such training,
however, is greater in construction (32.3 per cent) than across all sectors (29.5 per cent).
By major occupation groups, the construction sector provides more training to workers in
lower occupations (sales and customer service, process, plant and machine operatives
and elementary occupations) than is the case across the whole economy but for
administrative and secretarial and caring, leisure and other service occupations, in
particular, much less training is provided to workers in construction than across all
sectors.
The construction sector has a long standing history of participation in
Apprenticeships which form a core part of the development of future skilled workers
in the industry through combining off-the-job training and practical on-the-job
experience. Apprenticeships account for a large part of the skills supply in construction
with many employers viewing such training as a vital part of their skills planning and
indicating that Apprenticeships provide invaluable skills to workers (particularly in skilled 2 This is the Construction Skills Levy – it is levied at 0.5 per cent of the wage bill of directly employed workers and 1.5 per cent of labour only sub-contractors (data for 2011).
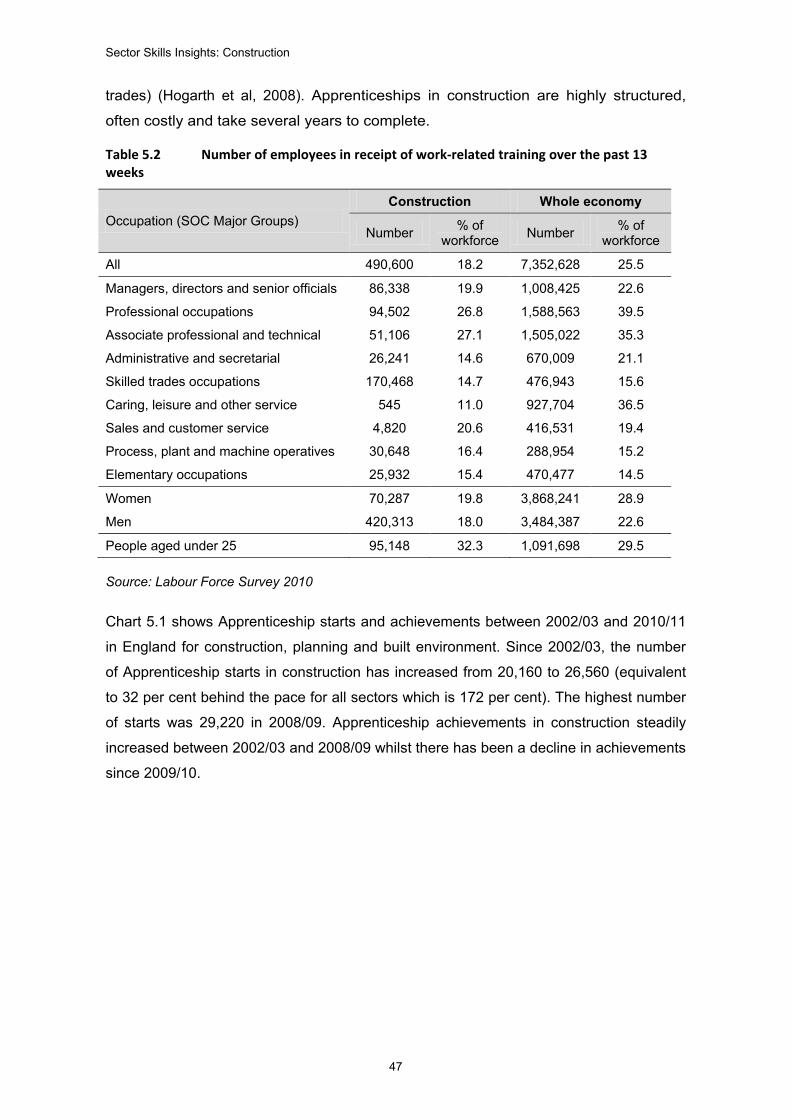
Sector Skills Insights: Construction
47
trades) (Hogarth et al, 2008). Apprenticeships in construction are highly structured,
often costly and take several years to complete.
Table 5.2 Number of employees in receipt of work-related training over the past 13 weeks
Occupation (SOC Major Groups) Construction Whole economy
Number % of workforce Number % of
workforce
All 490,600 18.2 7,352,628 25.5
Managers, directors and senior officials 86,338 19.9 1,008,425 22.6
Professional occupations 94,502 26.8 1,588,563 39.5
Associate professional and technical 51,106 27.1 1,505,022 35.3
Administrative and secretarial 26,241 14.6 670,009 21.1
Skilled trades occupations 170,468 14.7 476,943 15.6
Caring, leisure and other service 545 11.0 927,704 36.5
Sales and customer service 4,820 20.6 416,531 19.4
Process, plant and machine operatives 30,648 16.4 288,954 15.2
Elementary occupations 25,932 15.4 470,477 14.5
Women 70,287 19.8 3,868,241 28.9
Men 420,313 18.0 3,484,387 22.6
People aged under 25 95,148 32.3 1,091,698 29.5
Source: Labour Force Survey 2010
Chart 5.1 shows Apprenticeship starts and achievements between 2002/03 and 2010/11
in England for construction, planning and built environment. Since 2002/03, the number
of Apprenticeship starts in construction has increased from 20,160 to 26,560 (equivalent
to 32 per cent behind the pace for all sectors which is 172 per cent). The highest number
of starts was 29,220 in 2008/09. Apprenticeship achievements in construction steadily
increased between 2002/03 and 2008/09 whilst there has been a decline in achievements
since 2009/10.

Sector Skills Insights: Construction
48
Chart 5.1: Apprenticeship starts and achievements (all levels) for construction, planning and built environment, 2002/03 to 2010/11
Source: Data Service (2012)
Notes England data only, 2010/11 figures are provisional
Table 5.3 shows starts in Intermediate and Advanced Apprenticeships by age between
2002/03 and 2010/11 for Construction Planning and Built Environment in England. The
majority of starts were by apprentices under the age of 19 years at level 2 and this is also
true of the all-England figure for starts. Advanced Apprenticeship starts in Construction
have been more evenly distributed between under 19 years of age and 19 to 24 year
olds. A similar pattern exists at the all-England level but starts at 19-24 and 25 age
groups have grown substantially in recent years. Given the high proportion of young
apprentices in construction, particularly at level 2, increasing the proportion of the
construction workforce in younger age groups should be possible provided that
completion rates are sufficiently high.
20,160
26,68025,450
21,670
27,520 27,83029,220
25,21026,560
3,640
5,620
9,290
14,850
17,300 17,810
22,33020,830
15,260
0
5,000
10,000
15,000
20,000
25,000
30,000
2002/03 2003/04 2004/05 2005/06 2006/07 2007/08 2008/09 2009/10 2010/11
Starts Achievements
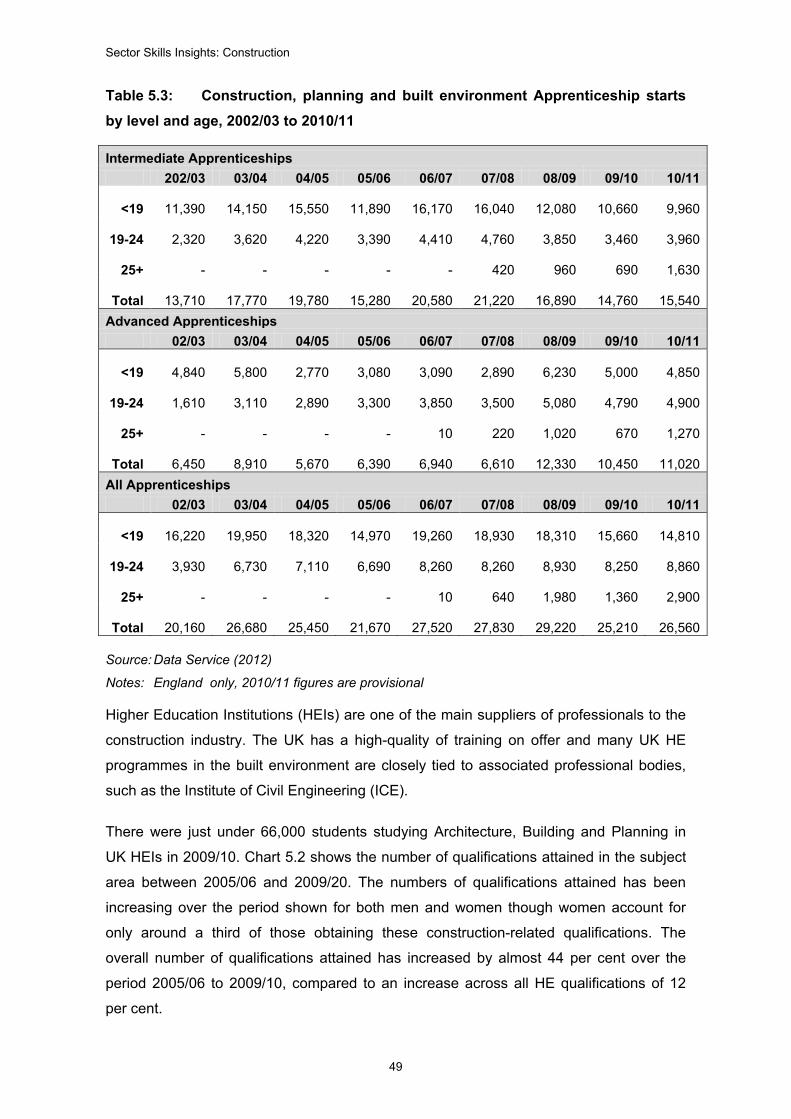
Sector Skills Insights: Construction
49
Table 5.3: Construction, planning and built environment Apprenticeship starts by level and age, 2002/03 to 2010/11
Intermediate Apprenticeships 202/03 03/04 04/05 05/06 06/07 07/08 08/09 09/10 10/11
<19
11,390
14,150
15,550
11,890
16,170
16,040
12,080
10,660
9,960
19-24
2,320
3,620
4,220
3,390
4,410
4,760
3,850
3,460
3,960
25+
-
-
-
-
-
420
960
690
1,630
Total
13,710
17,770
19,780
15,280
20,580
21,220
16,890
14,760
15,540 Advanced Apprenticeships
02/03 03/04 04/05 05/06 06/07 07/08 08/09 09/10 10/11
<19
4,840
5,800
2,770
3,080
3,090
2,890
6,230
5,000
4,850
19-24
1,610
3,110
2,890
3,300
3,850
3,500
5,080
4,790
4,900
25+
-
-
-
-
10
220
1,020
670
1,270
Total
6,450
8,910
5,670
6,390
6,940
6,610
12,330
10,450
11,020 All Apprenticeships
02/03 03/04 04/05 05/06 06/07 07/08 08/09 09/10 10/11
<19
16,220
19,950
18,320
14,970
19,260
18,930
18,310
15,660
14,810
19-24
3,930
6,730
7,110
6,690
8,260
8,260
8,930
8,250
8,860
25+
-
-
-
-
10
640
1,980
1,360
2,900
Total
20,160
26,680
25,450
21,670
27,520
27,830
29,220
25,210
26,560
Source: Data Service (2012)
Notes: England only, 2010/11 figures are provisional
Higher Education Institutions (HEIs) are one of the main suppliers of professionals to the
construction industry. The UK has a high-quality of training on offer and many UK HE
programmes in the built environment are closely tied to associated professional bodies,
such as the Institute of Civil Engineering (ICE).
There were just under 66,000 students studying Architecture, Building and Planning in
UK HEIs in 2009/10. Chart 5.2 shows the number of qualifications attained in the subject
area between 2005/06 and 2009/20. The numbers of qualifications attained has been
increasing over the period shown for both men and women though women account for
only around a third of those obtaining these construction-related qualifications. The
overall number of qualifications attained has increased by almost 44 per cent over the
period 2005/06 to 2009/10, compared to an increase across all HE qualifications of 12
per cent.
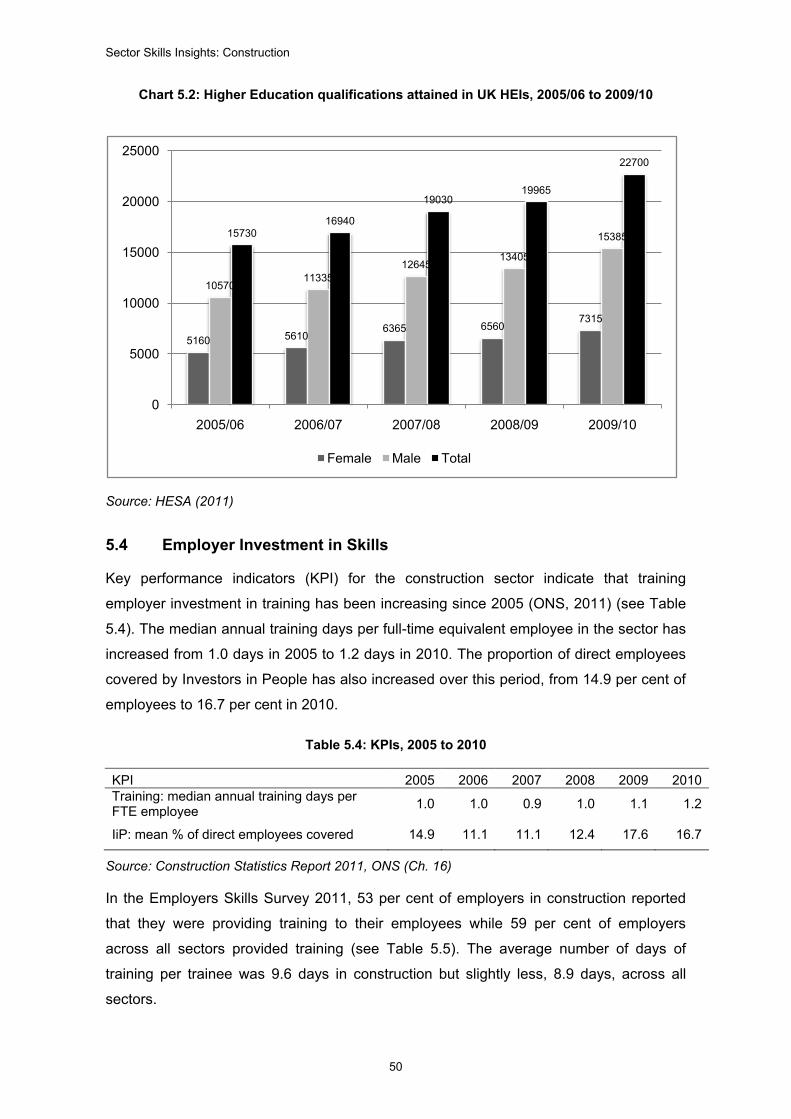
Sector Skills Insights: Construction
50
Chart 5.2: Higher Education qualifications attained in UK HEIs, 2005/06 to 2009/10
Source: HESA (2011)
5.4 Employer Investment in Skills
Key performance indicators (KPI) for the construction sector indicate that training
employer investment in training has been increasing since 2005 (ONS, 2011) (see Table
5.4). The median annual training days per full-time equivalent employee in the sector has
increased from 1.0 days in 2005 to 1.2 days in 2010. The proportion of direct employees
covered by Investors in People has also increased over this period, from 14.9 per cent of
employees to 16.7 per cent in 2010.
Table 5.4: KPIs, 2005 to 2010
KPI 2005 2006 2007 2008 2009 2010 Training: median annual training days per FTE employee 1.0 1.0 0.9 1.0 1.1 1.2
IiP: mean % of direct employees covered 14.9 11.1 11.1 12.4 17.6 16.7
Source: Construction Statistics Report 2011, ONS (Ch. 16)
In the Employers Skills Survey 2011, 53 per cent of employers in construction reported
that they were providing training to their employees while 59 per cent of employers
across all sectors provided training (see Table 5.5). The average number of days of
training per trainee was 9.6 days in construction but slightly less, 8.9 days, across all
sectors.
5160 56106365 6560
7315
1057011335
1264513405
153851573016940
1903019965
22700
0
5000
10000
15000
20000
25000
2005/06 2006/07 2007/08 2008/09 2009/10
Female Male Total

Sector Skills Insights: Construction
51
Table 5.5: Employer Investments in Skill
Construction Whole economy % of employers training 53 59
% of workforce receiving training 41 46
% average number of training days per trainee 9.6 8.9
Average expenditure on training per trainee £3,975 £3,275
Average expenditure on training per employee £1,925 £1,775
Source: Davies et al. (2012) Note: Based on SIC definition of sector Base for training: All establishments, 87,572 unweighted Base for expenditure: All trainers completing the Investment in Training Survey 11,117 unweighted
As the indicators in Table 5.5 reveal, employers in construction are major investors in
training by expenditure relative to the UK as a whole, but its recruitment of young people,
most of whom will be new entrants to the industry, is relatively low compared with the UK
as a whole with the exception of apprenticeships where the percentage of employers with
apprentices is relatively high compared with the UK. This is reinforced by data for the
EU-27 which reveals that 86 per cent of construction employers engage in training
compared with 53 per cent in the EU-27, and the average duration of training was longer
at 8 hours compared with 6 hours in the EU-27 (data for 2005).
A further indicator of employer engagement in training is the number of young people
taken on each year straight from school or college (see Table 5.6). As can be seen,
employers in construction recruit young people to a somewhat lesser extent than
employers across the economy as a whole. At least some of this difference reflects health
and safety considerations related to employing young people on construction sites.
Table 5.6: Recruitment of young people
Employers who have recruited young people
Construction Whole Economy (per cent) (per cent)
16 year olds recruited to first job from school
3 4
17 or 18 year olds recruited to first job from school
3 5
17 or 18 year olds recruited to first job from FE College
3 5
Recruited to their first job from University or other Higher Education institution
4 7
Source: Davies et al. (2012) Note: Based on SSA definition of sector Base: All establishments 86,069 unweighted (not asked in Scotland)

Sector Skills Insights: Construction
52
Table 5.7 gives an indication of the extent to which employers in construction engage in
initial vocational education and training with respect to Apprenticeships. The data clearly
reveal that relatively high percentages of employers engage in Apprenticeships: 12 per
cent of employers in construction participate in Apprenticeships compared with 5 per cent
in the economy generally. Importantly, relatively high percentages of employers in the
sector expect to continue supplying Apprenticeships in the future (12 per cent) compared
with all employers (8 per cent).
Table 5.7: Recruitment of apprentices
Construction (%)
All Employers (%)
Currently have staff undertaking Apprenticeships
12 5
Currently offer but have no staff on Apprenticeships
5 4
Plan to offer Apprenticeships in future
12 8
Source: Shury et al. (2011) Note: Based on based on SIC 41-43 only Base: All establishments 14,390 unweighted
Table 5.8 provides further information about employer engagement in training. Generally,
construction is characterised by less formality attached to training with relatively low
percentage of construction employers having a training plan or a training budget. It is
also the case that relatively few construction employers engage in an annual review of
skills, or assess the training provided to their employers.
With respect to the percentage of employers training to accredited qualifications at any
level, Table 5.8 reveals that there is not much difference with respect to the economy as
a whole.
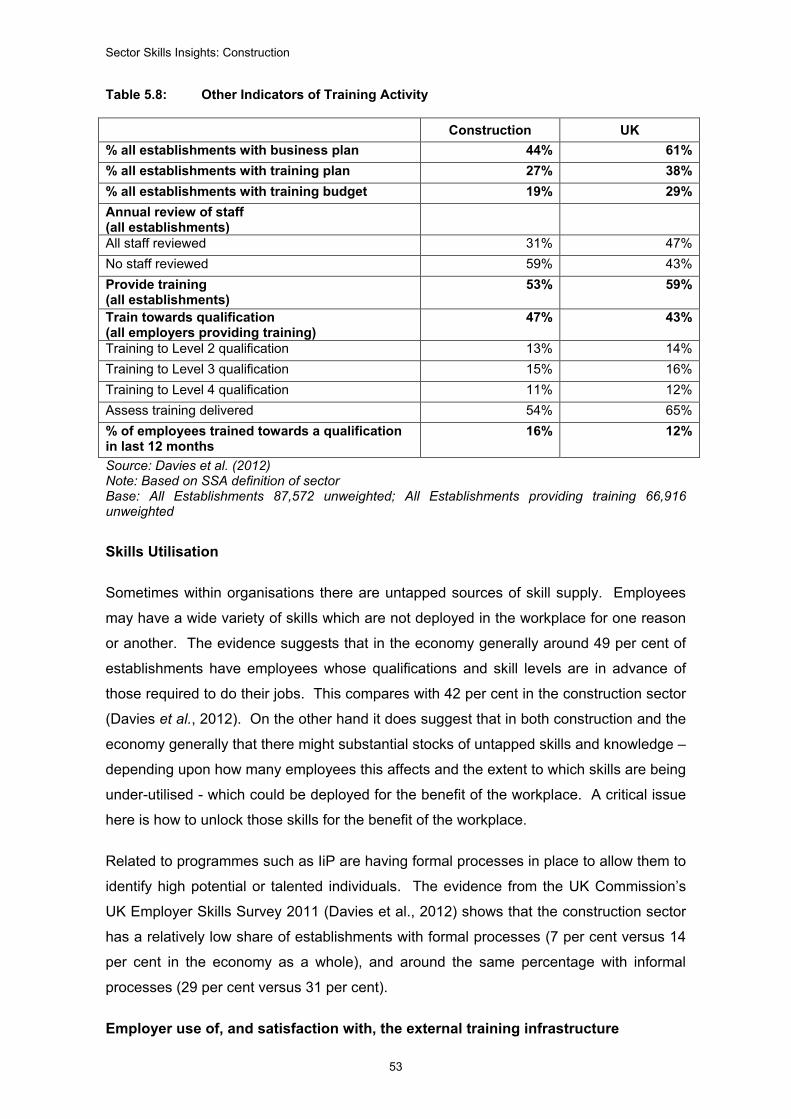
Sector Skills Insights: Construction
53
Table 5.8: Other Indicators of Training Activity
Construction UK % all establishments with business plan 44% 61% % all establishments with training plan 27% 38% % all establishments with training budget 19% 29% Annual review of staff (all establishments)
All staff reviewed 31% 47% No staff reviewed 59% 43% Provide training (all establishments)
53% 59%
Train towards qualification (all employers providing training)
47% 43%
Training to Level 2 qualification 13% 14% Training to Level 3 qualification 15% 16% Training to Level 4 qualification 11% 12% Assess training delivered 54% 65% % of employees trained towards a qualification in last 12 months
16% 12%
Source: Davies et al. (2012) Note: Based on SSA definition of sector Base: All Establishments 87,572 unweighted; All Establishments providing training 66,916 unweighted
Skills Utilisation
Sometimes within organisations there are untapped sources of skill supply. Employees
may have a wide variety of skills which are not deployed in the workplace for one reason
or another. The evidence suggests that in the economy generally around 49 per cent of
establishments have employees whose qualifications and skill levels are in advance of
those required to do their jobs. This compares with 42 per cent in the construction sector
(Davies et al., 2012). On the other hand it does suggest that in both construction and the
economy generally that there might substantial stocks of untapped skills and knowledge –
depending upon how many employees this affects and the extent to which skills are being
under-utilised - which could be deployed for the benefit of the workplace. A critical issue
here is how to unlock those skills for the benefit of the workplace.
Related to programmes such as IiP are having formal processes in place to allow them to
identify high potential or talented individuals. The evidence from the UK Commission’s
UK Employer Skills Survey 2011 (Davies et al., 2012) shows that the construction sector
has a relatively low share of establishments with formal processes (7 per cent versus 14
per cent in the economy as a whole), and around the same percentage with informal
processes (29 per cent versus 31 per cent).
Employer use of, and satisfaction with, the external training infrastructure

Sector Skills Insights: Construction
54
If it is possible to ratchet up the demand for skills and training within construction
employers then there is a need to ensure that training suppliers are in place to meet that
demand. In construction there is often a need to engage with external training providers
due to the fact that Apprenticeship programmes, for instance, often contain a significant
amount of block or day release typically at a local college. In fact, the evidence suggests
that employers in construction are slightly more likely engage with external training
providers than employers in general: 22 per cent of construction establishments had no
contact with external providers compared with 29 per cent of all employers. The extent
to which they are likely to use private training providers (67 versus 54 per cent) and FE
colleges (33 versus 23 per cent) shows, in general, that construction employers are more
likely to engage with these institutions than is the case for all employers in the economy.
Construction employers are less likely to use not-for-profit / third sector organisations for
training (14 per cent versus 19 per cent) and HE institutions (11 versus 13 per cent).
There overall satisfaction with the use of FE colleges – 7.2 out of 10 where a high score
indicates relative satisfaction – is not much different from the overall average of 7.4 for all
employers (Shury et al., 2011).
5.5 Migrant Labour Supply
Construction in many respects an industry which relies upon an itinerant workforce willing
to move to wherever the next project is taking place. It is apparent that parts of the sector
rely upon workers willing to move around the globe from contract to contract as is the
case in sub-sectors related to engineering construction. Accordingly, migration has
historically played a large role in meeting the industry’s labour requirements (Construction
Skills, 2010)
Data reveals that with the accession of countries from Eastern Europe to the EU, the
share of the construction industry’s workforce which is non-UK born has risen from 4.7
per cent in 1994, to 4.5 per cent in 2002, to 7.9 per cent in 2008 (MAC, 2010). It is also
possible to look at the pattern with selected construction occupations. The share of
construction trades works who were non-UK born stood at 3.8 per cent in 2002 and rose
to 8.5 per cent in 2008 (MAC, 2010). Construction Skills is of the view that the number of
migrant workers in the construction industry has peaked – at around 11,000 workers in
2006 - and that the relatively high inflows of migrant workers over the 2000s will decline
over the medium-term. In part this reflects the downturn in UK construction and the
improved prospects in the construction sector in other parts of Europe (e.g. in Poland
where the downturn in the EU economy has been much less marked).

Sector Skills Insights: Construction
55
Migration increases the flow of labour and skills into the construction sector, especially at
peaks in the economic cycle and the evidence indicates that it has improved skill supply.
The percentage of the workforce who possess the minimum level of qualification deemed
necessary to work in the sector is a Level 2 vocational one. In the UK, Construction Skills
estimates that around 40 per cent of UK construction workers and a third of migrant
workers have a highest qualification that is below Level 2,3 meaning that construction
workers who have migrated to the UK generally are better qualified than the indigenous
workforce.
In relation to managerial and professional workers, it is estimated that around 80 per cent
do not possess a Level 4 qualification (UK Commission, 2010). It is notable in this
regard, that the Civil Engineers, since 2008, has been an occupation which is open to
suitably qualified people from anywhere in the world and exempt from the immigration
restrictions which would otherwise apply (MAC, 2011).
5.6 Conclusion
The evidence demonstrates that the sector has a well developed training infrastructure,
which is supported by the grant-levy scheme which applies to most of the sector, and
which has seen improvements in the level of skills in the sector over the recent past.
A key issue for the sector is the development of higher level skills, particularly in
management, which will allow employers to respond positively to the challenges posed by
increased regulation, technological development and global competition and the flexibility
that these developments require.
Self-employment and the use of labour only contracts permit some construction firms to
utilise skills as and when necessary, but such organisation of labour can present an
obstacle to overall skills supply in the sector. Self-employed individuals are less likely to
engage in training, and employers are less likely to provide training for employees who
are not employed on permanent contracts with their organisation. Retention and
progression in the sector can be affected, because individuals see few opportunities to
develop their careers (Booth et al, 2002).
The next section will reveal that the highly cyclical nature of the construction industry
tends to impose limits on the extent to which employers invest in skills during periods of
downturn which in turn affects its capacity to fully capitalise upon the economic recovery.
3 The UK CES National Skills Audit for England (Figure 3.3) suggests that around 30 per cent of workers in the sector in England have a qualification below Level 2 in occupations other than managerial, professional, and associate professional ones.

Sector Skills Insights: Construction
56
6 Skill Mismatches
6.1 Defining Skill Mismatches
Previous evidence has demonstrated that mismatches between the demand for, and
supply of skills, can be damaging for organisational performance (Wilson and Hogarth,
2002). To some extent, skill mismatches will result from ongoing processes of technical
and organisational changes within firms, and shifts in the pattern of demand in external
markets. To some degree these will be transitional mismatches as the demand side
begins to fully articulate its skill requirements and the supply side responds accordingly.
But there are also likely to be structural mismatches where the demand for, and supply
of, skills remain out of kilter despite the market signally what skills are required. The
construction sector is one which has experienced relatively high levels of skill mismatch
over recent years. In part, this is because the year-on-year demand for construction has
increased so much. The nature of the employment relationship also contributes to
reported skills mismatch as employment tends to be on project-by-project basis. Long-
term employment relationships with continuing training and development are not as
commonplace as in other sectors.
As there is no direct measure of mismatches between the demand for, and supply of,
skills, at the sectoral level inferences about the balance between the two are typically
made through various means given that each measure provides only partial information.
The common methods of gauging the level of mismatch are:
• Observing trends in wages is a common method of measuring skills mismatches.
This assumes that employers respond to difficulties finding the skills they need by
increasing wages. In reality, not all employers respond in this way to an excess
demand for skills. Regulation regarding pay, collective bargaining, and job-related
risk factors will also affect wage rates, and non-wage incentives, including training,
may be offered to potential employees to attract them to an organisation. There is
also a more general question about the extent to which wage levels are responsive to
the market. Evidence suggests that nominal wage rates are relatively more
responsive in the UK than elsewhere, but this might be little more than a reflection of
the demand for overtime.

Sector Skills Insights: Construction
57
• Estimating the rate of return to obtaining sector related qualifications provides a
further indication of the extent to which a premium is attached to obtaining the skills
deployed in a given sector. Qualifications, however, are an imperfect measure of
skills and the rate of return to obtaining a given qualification and given that the
measure of return is based on wages all of the caveats which relate to this as a
measure of skills mismatch.
• Employer reports of skill mismatches in the form of hard-to-fill vacancies (HtFVs) and
skill-shortage vacancies (SSVs) which provide an indication of the difficulties
employers have in recruiting people from the external labour market with the skills
and attributes they require. Surveys also capture information about problems
employers experience with the skills of existing staff with respect to the extent they
lack full proficiency in their jobs (i.e. skill gaps).
Each of these is now considered in turn with respect to the construction sector.
6.2 Evidence of Relative Wage Growth
Wage levels and differentials
Table 6.1 provides a comparison of wage levels for full-time employees in the
construction sector compared with the economy as a whole. It should be noted that self-
employed workers, which comprise a significant part of the construction workforce, are
not included in these figures and data on earnings of self-employed individuals is not
readily available. In general, the median and mean wage in the construction sector is
slightly higher in construction than in the economy as a whole, but over the past year
wage levels have been falling in construction whilst there has been, by historical
standards, low positive growth in wage levels in the economy overall. As indicated in
previous sections the recession has adversely affected the construction industry with the
lay-off of many thousands of construction workers which, as a consequence, has
dampened wage rates.
Table 6.1: Annual pay - Gross (£) - For full-time employee jobs: UK, 2010
Description
Median
Annual Change (%)
Mean
Annual Change (%)
All Employees 25,882 0.3 32,204 1.0
Construction 27,492 -2.1 32,853 0.0
Source: Annual Survey of Hours and Earnings, Table 16.7a Note: Based on SIC 2007

Sector Skills Insights: Construction
58
Wage levels, however, vary significantly throughout the sector with the sub-sector
concerned with the development of building projects reported an average annual salary of
£56,000 (with a year-on-year rise of 17 per cent) compared with that of £24,000 (with a
year-on-year change of -23 per cent) in the construction of utility projects for electricity
and telecommunications. These differences will reflect the occupational composition of
each sub-sector as well as the state of overall demand for the output of these sub-
sectors. Wage levels in the overall construction sector also vary significantly around the
median and when employment levels start increasing in the sector, wages often respond
very strongly.
Table 6.2 shows the occupational distribution of wages in the construction sector. In
general, construction managers are paid more than managers overall in the economy, but
civil engineers are paid slightly less than professionals overall. The mean wage level of
construction managers has increased by around 6 per cent which is more than that for
managers overall who received a wage increase of 3 per cent. The situation in relation to
civil engineers, whose employment prospects have been affected by the slowdown in the
commissioning of public infrastructure projects, have seen their salaries decrease on
average by around 3 per cent.
Table 6.2: Annual pay - Gross (£) - For full-time employee jobs in Selected Occupations in Construction: UK, 2010
Description Median Annual
Change (%) Mean Annual
Change (%) Whole Economy 25,882 0.3 32,204 1.0 All managers and senior officials 38,000 1.3 51,210 2.6 Managers in construction 41,680 0.4 54,539 6.4 All professional occupations 36,528 0.7 41,764 0.9 Civil engineers 35,484 -2.8 38,558 -3.3 All skilled trades occupations 23,818 -0.6 25,113 -0.4 Skilled construction and building trades 23,420 -0.8 24,594 -0.7 Construction Trades 23,843 -0.7 24,904 -0.6 Steel erectors 22,914 -0.8 23,926 1.1 Bricklayers, masons 23,201 1.7 23,925 0.7 Roofers, roof tilers and slaters 21,665 1.4 23,280 2.2 Plumbers, heating and ventilating engineers 27,731 0.4 27,850 -0.7 Carpenters and joiners 23,398 -2.5 24,150 -2.9 Glaziers, window fabricators and fitters 20,082 2.4 20,716 0.8 Construction trades n.e.c. 24,039 1.3 26,238 4.6 Building Trades 22,092 -0.9 22,980 -1.2 Plasterers 21,648 -2.4 22,624 0.4 Floorers and wall tillers 21,217 -12.5 22,711 -8.6 Painters and decorators 22,337 0.6 23,138 0.7 Source: Annual Survey of Hours and Earnings, Table 14.8a Note: Based on SIC 2007

Sector Skills Insights: Construction
59
The situation with respect to skilled trades workers in construction reveals a mixed
pattern. Overall, skilled construction workers earned slightly less than the average for the
skilled trades occupation overall. Moreover their wage levels had fallen more over the
past year. But within this group there are occupations which either show relatively high
wage rates - such as plumbers and heating and ventilating engineers who earned around
£28,000 compared with £25,000 for skilled trades workers overall – and those which have
shown a relatively high year-on-year increase (such as roofers, roof-tilers and slaters who
experienced a wage increase of 2 per cent compared with -0.7 per cent amongst skilled
construction trade workers generally.
The above depicts the national picture but there are often local hotspots, typically in
London and the South East and related to large-scale infrastructure projects such as the
Olympics and Crossrail, which can result in localised skill shortages resulting in relatively
high wage rates designed to attract people from all over the UK and the EU.
The Returns to Acquiring Qualifications in Construction
The previous section has demonstrated that a relatively large part of the construction
sector’s workforce comprises people working in skilled trades occupations typically with a
vocational qualification at Level 2 or 3. In general, the evidence indicates that there are
significant marginal returns to obtaining qualifications at these levels compared with
qualifications at a lower level (Jenkins et al., 2007; McIntosh, 2009).
In relation to the construction sector specifically, the evidence points to their being a
relatively favourable return to the individual working in construction obtaining a Level 2
and 3 qualifications compared with other sectors. Whereas the overall wage return to
obtaining a qualification at Level 2 over and above a lower level qualification was around
4 per cent in the economy as a whole in Jenkins et al’s 2007 study, it was found to be 9
per cent in construction. Similarly, Dickerson and Vignoles (2007) found that the return to
a Level 2 qualification in construction was around 10 per cent compared with 2 per cent in
the economy generally. Specifically in relation to Apprenticeships, McIntosh (2006)
calculated that the net present value of an Apprenticeship in construction was £156,523
compared with engineering at £78,351 and retail at £31,928.
Much of the evidence on the returns to the individual predates the current period of
downturn in the construction sector. As noted above wage levels have been depressed
over the recent past in many construction occupations as a consequence of the 2008/09
recession. The earlier evidence is consistent with respect to the premium attached to
obtaining higher level vocational qualifications in the construction sector. Given that the

Sector Skills Insights: Construction
60
construction sector will revive over the longer-term, and will be critical to the success of
the recovery given that public infrastructure projects are likely to be used to kick-start the
economy, it is likely that the relatively positive returns to gaining Level 2 and 3
qualifications will re-emerge as the supply side tries to keep pace with demand.
Other research in relation to completing an Apprenticeship suggests relatively high
returns to the employer in sectors such as construction. McIntosh calculated the Net
Present Value (NPV)4 of Apprenticeships (at any level) in five different sectors of the
economy (McIntosh, 2006, 2009). The NPV was highest in construction (£156,523)
compared with the service sector where, in retail for instance, the NPV was £31,928
(McIntosh, 2006, 2009).
6.3 Evidence of employer reported skill deficiencies
Historically, the national Employers Skills Surveys periodically carried out in each of the
four nations of the UK have shown that the construction sector is relatively adversely
affected by recruitment problems. Given that the period of unbroken economic growth
over the 1990s and 2000s was based in part on the boom in construction the supply of
skills struggled to keep pace with the level of demand. Given the fall in employment
following the 1990/91 recession the sector had to quickly re-supply itself with the skills it
needed to meet the relatively strong growth in demand. In part, the supply side was
eased by skilled construction workers entering the UK from the EU (mainly Eastern
Europe) but skill shortages over the 2000s were relatively high compared with those
experienced in many other sectors.
The Employers Skills Survey (2011) provides an opportunity to gauge the current state of
recruitment problems at a time when demand in the construction sector has declined
substantially. The evidence suggests that the sector is still relatively adversely affected
by recruitment problems. Whilst employers in the sector are just as likely to report
vacancies compared with all employers (4 per cent of HTFVs of employers in both the
sector and the economy generally report HTFVs), they are more likely to report HtFVs
and more likely to report that HtFVs are due to a shortage of applicants with the required
experience, skills, or qualifications, i.e. due to skill shortages (see Tables 6.4a and 6.4b).
So the evidence points to skill shortages continuing to adversely affect the sector. If one
looks at the density of recruitment difficulties it is apparent that HTFVs form a relatively
high share of all vacancies at 40 per cent compared with 23 per cent in the economy as a
4 McIntosh (2009) estimates the marginal returns to Apprenticeships. The estimated wage returns are then combined with (i) the increased likelihood of apprentices being in employment; (ii) costs of providing the Apprenticeship by employers and government; (iii) and the costs to the individual (foregone earnings). The future results are then discounted to give a net present value (McIntosh, 2009, p. 59)

Sector Skills Insights: Construction
61
whole. As will be reported below recruitment problems, and in particular skill shortages,
have a considerable impact on the performance of the sector.
The evidence suggests that the construction sector is less affected by skill gaps. The
number of skill gaps per 1000 people employed is lower than in the economy generally at
44.4 per 1000 employees versus 54.1 in the economy as a whole. The percentage of
employers reporting skill gaps is also lower than in the economy as a whole.
Table 6.3a: Incidence of Skill Deficiencies
Construction UK Vacancies (total) 47,250 635,900 Vacancies / 1,000 employees 21.1 23.1 % of establishments with at least one vacancy
7% 12%
HtFVs (total) 19,100 143,550 % of establishments with at least one HTFV
4% 4%
SSVs (total) 12,400 103,450 SSVs / 1,000 employees 5.5 3.8 % of establishment with at least one SSV
3% 3%
Skill gaps 99,200 1,489,500 Skill gaps / 1,000 employees 44.4 54.1 % of establishments reporting a skill gap
10% 13%
Source: Davies et al. (2012) Base: Vacancies as a % of employees based on all employment (N=87,571 establishments
unweighted). Hard-to-fill vacancies as a % of vacancies based on all vacancies (N=17,166 establishments unweighted) SSVs as a % of vacancies based on all vacancies (N=17,166 establishments unweighted) Skills gaps as a % of employees based on all employment (N=87,571 establishments unweighted)
Notes: numbers rounded to nearest 50 based on SSA definition of sector

Sector Skills Insights: Construction
62
Table 6.3b: Density of Skill Deficiencies
Density Construction UK Vacancies as a proportion of employees 2% 2% HTF vacancies as a % of vacancies 40% 23%
SSV as % of all vacancies 26% 16% Skills gaps as a % of all employees 4% 5%
Source: Davies et al. (2012) Base: Vacancies as a % of employees based on all employment (N=87,571 establishments
unweighted). Hard-to-fill vacancies as a % of vacancies based on all vacancies (N=17,166 establishments unweighted) SSVs as a % of vacancies based on all vacancies (N=17,166 establishments unweighted) Skills gaps as a % of employees based on all employment (N=87,571 establishments unweighted)
Notes: numbers rounded to nearest 50 based on SSA definition of sector
6.4 Other Evidence on Evidence of Skill Deficiencies
Overall, where employers report skill shortages these are much more likely to be in
skilled trades and professional occupations compared with the economy as a whole (see
Figure 6.1). These are two critically important occupations for the sector, especially the
former which comprises the largest occupational share of the workforce.
Chart 6.1 Occupational Distribution of Skill Shortages in Construction
5%
20%
22%
7%
17%
9%
7%
5%
7%
2%
5%
34%
19%
3%
28%
0%
2%
6%
3%
0%
0% 10% 20% 30% 40%
Managers
Professionals
Associate professionals
Administrative/clerical staff
Skilled trades occupations
Caring, leisure and …
Sales and customer …
Machine operatives
Elementary staf f
Unclassif ied staf f Construction
All sectors
Source: Davies et al. (2012)
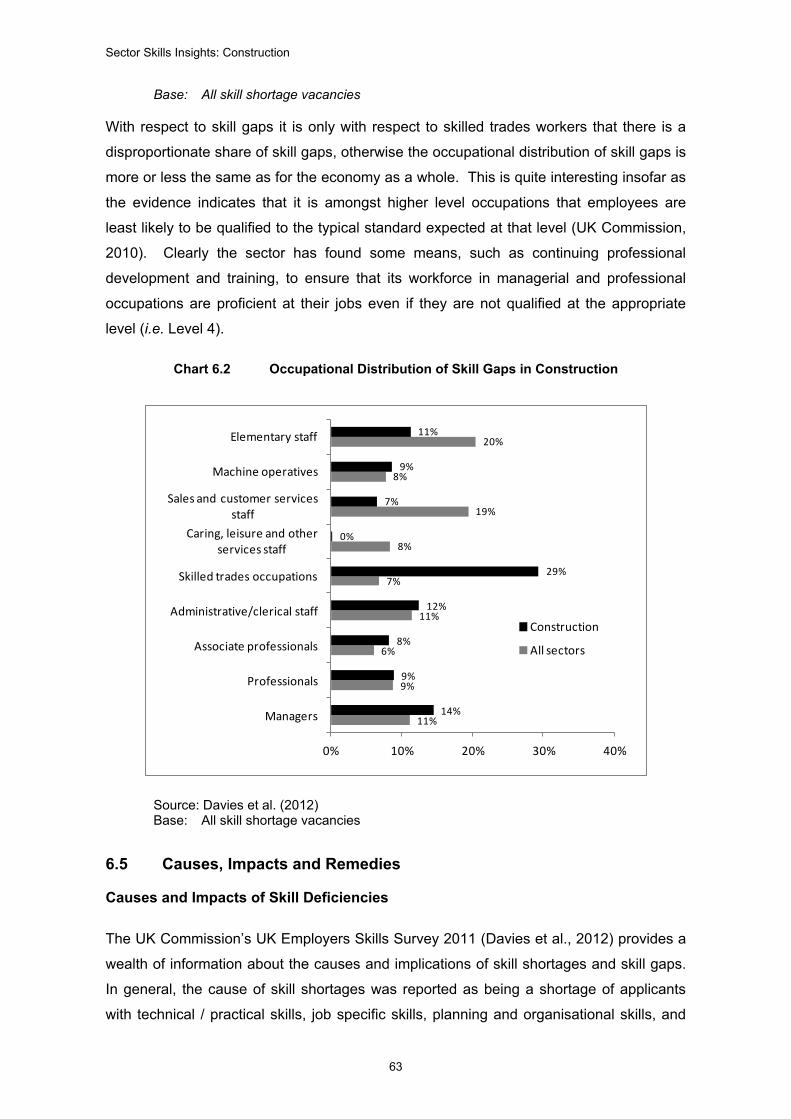
Sector Skills Insights: Construction
63
Base: All skill shortage vacancies
With respect to skill gaps it is only with respect to skilled trades workers that there is a
disproportionate share of skill gaps, otherwise the occupational distribution of skill gaps is
more or less the same as for the economy as a whole. This is quite interesting insofar as
the evidence indicates that it is amongst higher level occupations that employees are
least likely to be qualified to the typical standard expected at that level (UK Commission,
2010). Clearly the sector has found some means, such as continuing professional
development and training, to ensure that its workforce in managerial and professional
occupations are proficient at their jobs even if they are not qualified at the appropriate
level (i.e. Level 4).
Chart 6.2 Occupational Distribution of Skill Gaps in Construction
11%
9%
6%
11%
7%
8%
19%
8%
20%
14%
9%
8%
12%
29%
0%
7%
9%
11%
0% 10% 20% 30% 40%
Managers
Professionals
Associate professionals
Administrative/clerical staff
Skilled trades occupations
Caring, leisure and other services staff
Sales and customer services staff
Machine operatives
Elementary staff
Construction
All sectors
Source: Davies et al. (2012) Base: All skill shortage vacancies
6.5 Causes, Impacts and Remedies
Causes and Impacts of Skill Deficiencies
The UK Commission’s UK Employers Skills Survey 2011 (Davies et al., 2012) provides a
wealth of information about the causes and implications of skill shortages and skill gaps.
In general, the cause of skill shortages was reported as being a shortage of applicants
with technical / practical skills, job specific skills, planning and organisational skills, and

Sector Skills Insights: Construction
64
problem solving skills. The main response to experiencing skill shortages was to either
increase recruitment activity or find new means of recruitment. Only 3 per cent of
employers with skill shortages said they would increase salaries to attract more suitably
skilled employees. In relation to skill gaps, these were seen to result from staff being only
partially trained or being new to their role. Where employers had skill gaps just over half
of them reported that it was damaging their performance. In order to offset this they were
currently, or planning, to introduce more training, more supervision, and more mentoring
of staff. The main impacts of internal skills gaps include increased operating/running
costs, and difficulties in introducing new working practices. Having hard-to-fill vacancies
increased the workload of other staff, delayed development of new product and services,
increased operating costs, and resulted in a loss of business or orders to competitors.
There is also a risk that employers will fail to meet legislative requirements, for example,
in health and safety, if their staff lack skills and experience.
One of the solutions employers turns to in the face of skill deficiencies is to increase the
amount of training they undertake. Figure 6.3 shows the reasons employers report for
not providing training leading to a vocational qualification.
Chart 6.3 Reasons for Not Providing Vocational Qualifications

Sector Skills Insights: Construction
65
21
12
28
19
19
20
16
23
18
51
16
12
18
26
19
17
14
30
25
49
0 20 40 60
Unaware what vocational qualif ications are available
Vocational qualif ications not as rigorous as other qualif ications
Staf f don't want vocational qualif ications
Vocational qualif ications too expensive to deliver
Vocational qualif ications take too long to deliver
Vocational qualif ications too complicated for …
Vocational qualif ications too bureaucratic
Government does not provide funding or grants to cover …
Cutbacks in training budget.
Vocational qualif ications don't f it business needs
% of employers not training
Construction
Economy
Source: Shury et al. (2010) Note: Based on SSA definition of sector Base: All establishments 14,390 unweighted
There is not much difference between the construction sector and economy as whole,
with the principal reason for both being that vocational qualifications do not fit the
business (49 per cent of construction establishments versus 51 per cent in the economy
as whole). It is noticeable, however, that construction employers are more likely to report
cutbacks in their training budget (25 per cent in construction versus 18 per cent in the
economy as a whole), lack of public funding (30 per cent versus 23 per cent), and
vocational qualifications being too expensive to deliver (26 per cent versus 19 per cent).
On the other hand, construction employers are less likely to report that staff are resistant
to training (18 per cent versus 28 per cent).
Remedies to Skill Shortages
There are a range of programmes available which potentially boost skills supply, in
addition to the payment of the levy. Through their Employer Investment Fund (EIF) and
Growth and Innovation Fund (GIF), UKCES, with matched direct employer investment
and employer in-kind investment, provide funding aimed at improving employers’

Sector Skills Insights: Construction
66
ambition and attitudes to investment in skills development. Projects funded through these
initiatives include providing training for women to help them succeed and be retained in
the construction sector and helping organisations respond to the ‘low-carbon challenge’.
UKCES funding for the women and work programme is £116,800 whilst employer
investment is £17,250 and £99,280, in-kind. For the low carbon programme, UKCES
investment is equal to more than £1.3 million and employer in-kind investment is
£496,000.
Investors in People is “...the UK's leading people management standard. It’s a business
improvement tool designed to help all kinds of organisations develop performance
through their people.”5 Table 6.4 shows that in construction relatively few establishments
are accredited to IiP than in economy as whole.
Table 6.4: Investors in People Accreditation in IiP
IIP accredited (%)
Not IIP accredited (%)
Don't know (%)
Total (%)
Construction 8 83 9 100
UK 16 69 15 100
Source: Davies et al. (2012) Note: Based on SSA definition of sector Base: All Establishments 87,572 unweighted
The example of a smaller company illustrates how initiatives such as Investors in People
can provide a framework in which skills can be developed to avoid both skill shortages
and skill gaps (see panel).
Case study: Anthony A Davies Limited Anthony A Davies Limited and its sister companies Anthony A Davies Construction and Coed Derwen stemmed from a small joinery business set up by sole trader Anthony Davies in Abergavenny in 1980. The operation now has 84 people, making it one of the fastest growing businesses in Wales. The original company - Anthony A Davies Ltd - specialised in joinery, carpentry, roofing, restoration and building works. In 2000, Anthony A Davies Construction Ltd followed, offering construction, design and management and restoration services. Finally, Coed Derwen opened for business in 2005 making environmentally-friendly windows and doors. Since achieving The Standard in 2000, the business has made continued improvements to its processes and the benefits have been manifold. Standardised recruitment procedures have been implemented. Not only has this helped speed up
5 http://www.investorsinpeople.co.uk/About/Pages/default.aspx

Sector Skills Insights: Construction
67
the recruitment process, it has also been instrumental in improving the quality of new recruits. A company induction procedure is now firmly in place with both existing and new employees receiving a pack which includes comprehensive detail on the company. This has ensured that each employee has access to adequate information to help them to understand the company’s procedures and culture from day one. Training is no longer simply a good intention, it happens in a structured manner for both existing employees and new hires. A programme for regular performance reviews is also in place to monitor progress and training needs. This, in combination with the other procedures, has helped ensure staff morale and retention rates remain high. The business also extends this ethos to its sub-contractors, providing them with training and development opportunities as they arise. At the same time, these procedures have made the business less fearful of expansion. With robust processes in place, it has been possible to roll out effective procedures across Anthony A Davies’s sister companies, Anthony A Davies Construction and Coed Derwen Joinery, which were both awarded the Standard in 2006.
“Investors in People gave us the confidence to quadruple our workforce and helped new employees to adopt our ethos quickly. Our intentions were always positive towards issues such as staff communication and development, but we didn’t quite know how to get started. When we committed to The Standard it gave us the initiative to address these issues seriously”, says Dawn Davies, Director
Source:
http://www.investorsinpeople.co.uk/MediaResearch/CaseStudy/Pages/CaseStudyDetails.aspx?CSID=84
Apprenticeships provide one means of boosting skills supply. The evidence suggests
that there are significant business benefits from employers investing in Apprenticeships.
Since the mid 1990s the University of Warwick Institute for Employment Research (IER)
has been undertaking a series of studies on the net costs and benefits of training to
employers engaged in Apprenticeship training in the construction sector. The studies
give an indication of the benefits which accrue to employers who invest in this form of
training. The latest case study research (Hogarth et al., 2012) indicated that:
• The net cost to the employer of engaging in Apprenticeship training at Level 3 were
relatively high compared with other sectors, but that employers were able to recoup
much of the cost of their investment within about two years or so if they were able to
retain the services of the apprentice.
• When deciding to recruit apprentices, the following factors were considered by these
employers: bringing young people into the industry; meeting future skills needs; and
developing staff for specific business needs.
• Accreditation and qualifications which supported the firm in rendering for work was
highlighted as a strength of the Apprenticeship programme.
• For many of the companies the Apprenticeship programme was the main method for
recruitment and training of staff. It was also viewed as a tool to support retention.
The statistics give an overview of the level of training and skills development activity
undertaken by employers, but insights can be obtained into how these activities alleviate
skill deficiencies by looking at specific examples of employers training activities and the
value they place in what they provide. The example below provides an indication of the

Sector Skills Insights: Construction
68
activities undertaken by a medium-sized employer engaged in the construction of
commercial and public buildings which has continued to invest in training to maintain its
own skill supply (see panel).
Source: http://www.stepnell.co.uk/ourcompany/people/training.aspx
In many respects if employers are able to put in place policies which ensure that they are
able to recruit the employees with the skills and attributes they require which relates in
many respects to providing an attractive employment offer to would-be recruits - with
respect to remuneration, career development and progression, etc. – and support existing
employees to further develop their skills, they will be able to avoid both skill shortages
and skill gaps.
Case study:
Stepnell
Stepnell is registered with ConstructionSkills and is working towards accreditation with Investors in People. In addition, Stepnell is recognised by many teaching establishments as an appropriate employer for site based training in vocational subjects at Level 2 and 3. To meet this standard Stepnell has trained many of our staff as approved Site Based Recorders for assessing course work and experience.
The Stepnell commitment to training is further demonstrated in our leading role with The Minster College Training Initiative.
Stepnell understands that our Supply Chain deliver our promises and maintain our reputation as "best in class". We are therefore very careful who we ask to join our team and do so on the basis of an open and honest dialogue.
Part of The Minster College Training Initiative is to help our entire supply chain, not just those involved with the Minster College Project, identify training needs and source that training.
About The Minster Training Initiative
The Minster College Training Initiative is the first ‘Mini Academy’ scheme of its kind to be run in the West Midlands.
The aim is :-
• To have a fully qualified Supply Chain to CSCS or equivalent standard
• To provide work experience and other career related opportunities to the Minster College
students and the wider community.
The initiative led by Stepnell Ltd, a family owned building and civil engineering contractor with a 140 year history. Stepnell Ltd, who place a great importance in employing trained, progressive and competent individuals, has come together with key West Midlands partners to participate in this training initiative and create a model of best practice in terms of developing and delivering skills.
The minimum requirements to work on The Minster College Project are:-
• A fully qualified workforce to NVQ/CSCS standard;
• provide relevant working opportunities to the college pupils and the wider community

Sector Skills Insights: Construction
69
Potentially the combination of vocational and continuing professional development and
training can ensure that companies can acquire the skills they need via recruitment and
then continue to develop the skills of those recruits subsequently through continuing
training. The example of Costain is instructive in this regard (see panel below).
Case Study: Costain Group PLC Constructing talent and skills development opportunities for all Costain is an international engineering and construction group focused on providing intelligent solutions to meet national need. Primarily, the business’s aim is to drive improved business performance by: • supporting staff in their individual job roles • developing the skills necessary for the future of the business
• promoting individuals internally and encouraging effective succession planning
• leading the National Skills Agenda in customers key sectors
With these aims in mind, Costain runs several highly successful initiatives:
• a series of advanced high performance programmes that identify future leaders within the
business and provide opportunities to develop their talents
• a structured, well-defined and highly regarded graduate training programme
• providing access to nationally recognised qualifications e.g. NVQ Diploma’s , and supporting
learners through these qualifications
• an apprenticeship centre where apprentices can develop their knowledge and skills through
combining work experience and study.
• identifying potential to progress for ALL staff through the performance and talent management
cycle and using the information to support staff progression through focused talent and
development programmes
Costain actively incentivises skills development through a number of methods, including the annual ‘Celebrating Success’ awards which reward staff and other stakeholders, and a financial reward scheme for employees achieving key milestones within their careers (for example gaining NVQ qualifications or achieving chartered status). The business operates a Building Awareness Scheme promoting the sector to school pupils, and offers apprenticeship schemes, university sponsorship and an NVQ training scheme. Impact on the business There are compelling business reasons for Costain’s committed approach to skills in the workplace and the business has seen real benefits arising from training, including improved safety, environmental enhancements, efficiency improvements, opportunities for new business and cost savings. Training has improved employee satisfaction and engagement within the company, as employees feel they can develop their career, which has contributed to a low staff turnover (7% in 2011). Direct financial benefits have been also been brought about by training and skills development. For example, the Save IT campaign was launched in 2005 to improve the efficiency with which raw materials are used and managed on site, with the aim to reduce the amount of wasted materials. The campaign is heavily dependent on developing skills and building awareness within the workforce, from managers to site operatives. The financial benefits of the campaign exceeded expectations – for example, between 2007 and 2010 the annual cost of skip waste disposal on Costain sites has been reduced by over 51%, a saving of over £1.1 million. When the cost of raw material and the labour associated with waste disposal are taken into account, this amounts to a saving of over £5 million. Absence rates are a key indicator of employee engagement and satisfaction and Costain’s

Sector Skills Insights: Construction
70
absence rate has decreased over the last four years. This can be attributed to improved training of managers and an overall reduction in accidents due to better training. The environment Costain has created, where skills development is genuinely valued, has led to employees becoming increasingly proactive about their professional development. The company says:
“This makes us an attractive employer to join, and motivates our team members to continue with us, as they feel they have a clear career path, and opportunities for internal promotion. Our senior managers act as role models for junior staff, especially the fact that two of the current Executive Board joined Costain as graduates, and have worked their way to the top of the company.”
The company’ believes that its structured development programmes, and close relationships with schools and universities give it a competitive edge with regards to recruiting talented and ambitious employees.
Source: BITC case study - http://www.bitc.org.uk/resources/case_studies/afe2923.html
Costain Group represents an example of a relatively large organisation which has been
able to develop training programmes, as well as making use of programmes such as
Apprenticeships, to ensure that it is able to avoid both skill shortages and skill gaps.
6.6 Conclusion
The most recent evidence relating to wage differentials and wage increases indicates
relatively weak demand for skills at the current time, but there are reasons to be wary of
placing too much store in figures. The construction sector has endured a steep decline in
demand as a consequence of the 2008/09 recession with recovery to date being
relatively weak. Over the slightly longer-term, as the recovery gathers pace, it is
anticipated that demand for construction will increase, initially through the
commencement of major infrastructure projects and then through house and commercial
property building. Depending upon the pace of the recovery there is a danger that skill
shortages of a type observed following previous recessions will emerge with companies
increasingly competing on the basis of wages to capture relatively scarce skills. The
case study examples provided in this chapter illustrate the way in which companies can
develop the skills of their existing employees, and make use of various national
programmes such as Apprenticeships to train new entrants to the sector.

Sector Skills Insights: Construction
71
7 Conclusion
7.1 The Sector Today and Tomorrow
Construction is vitally important to the UK economy with respect to both the volume of
employment and gross value added it contributes (accounting for around 10 per cent of
the total in the UK on both measures), but also more strategically in contributing to the
built environment and as part of packages designed to stimulate growth. Possibly more
than any other sector, construction has provided a means of stimulating growth following
recessions through undertaking publicly funded infrastructure projects. Whilst there is
less scope than previously to engage in publicly funded infrastructure projects it is
nonetheless apparent that the Government is trying to bring forward a number of
previously planned and budgeted for projects in order to help kick-start the economy.
This poses a number of challenges for the sector given that it has been adversely
affected by the current recession with a sharp drop in the value of contracts
commissioned and people employed. As the sector develops over the medium-term it
has a number of opportunities related to:
• capitalising upon the green, low carbon agenda with the demand for retro-fitting of
buildings to meet new environmental standards, as well as building renewable energy
plants and nuclear energy installations;
• driving up productivity levels through the introduction of new technologies and new
ways of working, including increased use of pre-fabrication, use of new materials, etc.
• becoming a sector which is able to better plan for the future by being able to identify
in a more timely fashion demand for construction projects of one kind or another;
• capturing an increased share of global markets in various sub-sectors of the world
market (e.g. engineering construction, professional building services).
Whilst the Government has set out plans for around £200 billion of public and private
infrastructure over the next five years, this total is likely to be subject to considerable
variation over the period. The timing of these investments creates great uncertainty in
construction demand. Firms hesitate to take on new trainees where future demand is so
uncertain. In looking to the future, the aim is very much to create a sector which has fully
recovered from the losses incurred in the 2008/09 recession and has been able to take
full advantage of the opportunities listed above, to bring about a much improved built
environment in the UK. Realising this vision, as will be summarised below, is dependent
upon the sector being able to drive up its skill levels across the workforce and introducing
the types of higher performance working practices which will make it an enticing sector in
which to work and will thereby attract talented individuals to work in the sector. Hence
Sector Skills Insights: Construction
72
effective people management in the widest sense of the term is a necessity for the
industry.
7.2 The Performance Challenge
The performance challenge for employers currently based in the UK is that of rising to the
challenges which will be posed by:
• the low carbon agenda (reducing carbon emissions and the carbon footprint of
buildings);
• a need to drive up productivity levels in order to retain at least the current share of the
UK and world markets held by UK based companies and fend off competition from
companies based outside the UK;
• bringing about increased levels of innovation in the design (i.e. the product) and the
construction (i.e. the process) in order to increase productivity; and
• meeting changing regulatory standards relating to the construction of buildings and
health and safety on site.
At the heart of these performance challenges is the need to bring about change at a time
when many employers are clearly faced with substantial risks to their survival as a
consequence of the low levels of demand for all types of construction activity.
Importantly, the sector will need to ensure that it possesses the skills it requires to rise to
these performance challenges. Again this is a formidable challenge for two inter-related
reasons:
i. the current recession has seen many people made redundant with a consequent
leaking of skills from the sector;
ii. the sector, historically, has encountered severe recruitment problems related to
the under-supply of people with skills, qualifications, and experience the sector
requires.
In summary, the sector has lost skills during downturns and has struggled to regain them
quickly enough as the sector has recovered resulting in skills being imported from abroad
and relatively high wages being paid in localised hotspots where substantial construction
activity has been taking place (as was the case in London during the 2000s when several
major projects were taking place more or less simultaneously – e.g. Terminal 5, Crossrail,
the Olympic sites). At the same time as building up the quantity of skills there has also
been the need to accommodate qualitative changes in skills as new construction
processes using new materials come increasingly to the fore.

Sector Skills Insights: Construction
73
The skills challenge is made all the more difficult given the relatively high levels of self-
employment in the sector. This means the changes in skills demand and practices to
attract and retain talent are driven through the supply chain where the lead company
requires certain minimum standards to be in place before they are eligible to work on site.
Nestled within the wider set of performance challenges, therefore, is a specific set of skill
challenges which the sector, though well aware of, will need to increasingly address,
including:
• investing in management skills to ensure that managers possess the skills required to
(a) meet the business challenges listed above; and (b) ensure that the skills and
people management systems are in place to offset any risk of skill shortages pushing
the sector off-course;
• ensuring that there is a good supply of new entrants to the sector qualified to the
appropriate level to work in their chosen occupation. At the moment many people
lack the qualifications required. This is not just about investing in skills but also the
people management skills which will attract and retain people in the sector;
• continuing to invest in the skills of the existing workforce – especially self-employed
people, many of whom are older people – to ensure that they possess the skills which
will be required on the construction site of tomorrow. Currently, it appears that training
of self-employed workers is low. The question of who is responsible for developing
the skills of freelance workers – the individual worker or the employer who uses their
skills is important if this is to be improved.
The UK has a substantial training infrastructure which can be drawn upon in meeting
these skills and human resources challenges.
7.3 Growth through Skills
There is a substantial training and skills development infrastructure in the sector. This
provides structured, externally accredited training at both initial and continuing levels.
The use of the grant-levy system and the CSCS ensure that training is provided and that
having accredited skills have become in many parts of a de facto licence to practice.
This report has shown that leading employers of all sizes and across all of the various
sub-sectors are acting to develop their own staff, influence the supply of skills and draw
on current initiatives in response to the challenges they face. For example:
• the strong supply of construction graduates exiting the higher education sector in a
range of disciplines – such as architecture, surveyors, civil engineers, and building
management;

Sector Skills Insights: Construction
74
• the Apprenticeship programme is well established at Levels 2 and 3 with relatively
high number of entrants each year across a range of disciplines – including,
bricklaying, carpentry, plumbing, heating and ventilation, electrical trades;
• continuing professional development and training is well established across large
parts of the sector as companies look to support the career progression of their staff;
• programmes such as IiP provide a broad framework within which employers can
attract, develop, and retain talented individuals at all levels of the business; and
• the CSCS is one way larger employers can ensure that all of their subcontractors are
sufficiently skilled.
The evidence points to where companies have made use of the above programmes they
have been able to obtain significant returns with respect to being able to obtain the skills
they need to meet the demands of a dynamic construction environment and being able to
either retain those skills or, where the use of subcontractors is to the fore, ensure that
these too have the skills they need.
7.4 Business Benefits
One of the principal business benefits of investing in training is company survival. The
evidence suggests that where construction employers invest in training they are four
more times likely to survive than their counterparts who do not do so (Collier, et al.,
2007). At a time when the demand for the services of construction companies is at a low
point this is a strong message especially when one takes into consideration the fact that
as the recovery gathers pace the demand for construction skills is likely to increase quite
sharply. Hence being able to capitalise upon the recovery will be largely dependent upon
having access to skills. The research by Garrett et al., (2010) also reveals a wide range
of benefits from investing in construction skills.
The business benefits of training go beyond company survival. The beginning of this
section pointed to the range of performance or business challenges which will face the
sector over the medium-term. These are formidable with respect to the need to acquire
new skills needed to deal with the green agenda, the drive to increase productivity, being
innovative in both the design of buildings and construction of buildings, and being
regulatory compliant. Many companies recognise the large skill element in meeting these
challenges for management skills, the skills required of construction professionals, and
skilled trades employees. In the past, skill shortfalls to some extent have been offset by
attracting migrant labour but as the construction sectors in other parts of the EU also
begin their recovery, there will be less scope to rely upon this source of labour. Put
another way, the costs of not training for the sector might be substantial.

Sector Skills Insights: Construction
75
The evidence demonstrates that there are relatively good returns for individuals and
employers to invest in skills and that there is a strong supply side able to deliver the skills
the sector needs via programmes such as Apprenticeships and IiP.

Sector Skills Insights: Construction
76
REFERENCES
Aldersgate Group (2009) Mind the Gap: Skills for the transition to a low carbon economy.
London: Aldersgate
ASHE (Annual Survey of Hours and Earnings) (2011) Provisional results (SOC 200)
Table 4 – Industry. Office for National Statistics, Newport. Available:
http://www.ons.gov.uk/ons/publications/re-reference-
tables.html?edition=tcm%3A77-235202 [Accessed 29th June 2012].
BIS (2011) The Plan for Growth, BIS/ HM Treasury, London
BIS (2011a) Population estimates at start of 2011 – 2011 statistical release. Available:
http://www.bis.gov.uk/assets/biscore/statistics/docs/b/bpe_2011_stats_release.pdf
[Accessed July 2012]
BIS (2009) Changing to compete: Review of productivity and skills in UK engineering
construction. December 2009.
BERR (Department of Business Enterprise and Regulatory Reform) (2007) Construction
statistics 2007. London: BERR
BERR (Department of Business Enterprise and Regulatory Reform) (2008) Construction
statistics 2008. London: BERR
Bradford, J. and Fraser, E.D.G (2008) “Local authorities, climate change and small and
medium enterprises: identifying effective policy instruments to reduce energy use
and carbon emissions”, Corporate Social Responsibility and Environmental
Management. 15(3): 156-172.
Briscoe, G. (1993) "Skill Shortages in the Construction Sector", International Journal of
Manpower. 11(2): 23-28.
CBI (2011) “Winning Overseas: Boosting Business Export Performance” Report by E&Y
for CBI, November 2011.
CIC (2009) “The Impact of the Recession on Construction Professional Services” by IFF
Research for Construction Industry Council and ConstructionSkills.
Chan, P.W. and Moehler, R. C. (2008) ‘Construction skills development in the UK:
Transitioning between the formal and informal’ CIB Joint International Symposium:
transformation through construction, Heriot-Watt University, Edinburgh.

Sector Skills Insights: Construction
77
ConstructionSkills (2008) Blueprint for UK construction skills 2008-2012. Kings Lynn
ConstructionSkills.
ConstructionSkills (2010) Blueprint for UK Construction Skills 2010 to 2014. Kings Lynn:
ConstructionSkills.
ConstructionSkills (2011) Training and Skills in the Construction Sector
http://www.cskills.org/uploads/Training-Skills-Survey-Reports_tcm17-27270.pdf
ConstructionSkills and UKCES (2007) Construction Skills: Sector qualifications strategy.
http://www.ukces.org.uk/assets/bispartners/ukces/docs/publications/sector-
qualifications-strategy-construction-skills.pdf
ConstructionSkills Insight (2010) Understanding Future Change in Construction. Kings
Lynn ConstructionSkills
Construction Products Association (2011). Press Release. 9 December 2011.
Construction Products Association (2009) Construction Industry Forecasts, July, CPA:
London.
Data Service (2012) Statistical First Release Apprenticeship Supplementary Tables,
March 2012, ONS. Available:
http://www.thedataservice.org.uk/statistics/statisticalfirstrelease/sfr_supplementary_
tables/Apprenticeship_sfr_supplementary_tables/. [Accessed 29th June 2012].
Davies, B., Gore, K., Shury, J., Vivian, D. and Winterbotham, M. (2012) UK Commission’s
Employer Skills Survey 2011: UK Results. Evidence Report 45. UK Commission for
Employment and Skills, Wath-upon-Dearne. Available:
http://www.ukces.org.uk/publications/employer-skills-survey-2011
Dickerson, A. and Vignoles, A. (2007) ‘The Distribution and Returns to Qualifications in
the Sector Skills Councils’. Sector Skills Development Agency Research Report 21.
Deloitte (2010) EPoC: European Powers of Construction. Madrid: Deloitte.
Eurostat (2011). “EU-27 construction activity falls by 16 % from its pre-crisis high by the
second quarter of 2011” Statistics in Focus: Industry, trade and service, 61/2011.
Eurostat (2010) “The EU-27 construction sector: from boom to gloom” Statistics in Focus,
7/2010.

Sector Skills Insights: Construction
78
Garrett, R., M. Campbell and G. Mason, (2010) The Value of Skills: An Evidence Review,
UK Commission Evidence Report No. 22, Wath-upon-Dearne
Gibson, M. (2009) Changing to compete: Review of Productivity and Skills in UK
Engineering Construction. BIS.
HESA (Higher Education Statistical Agency) (2011) Statistical First Release 153, Table 7.
Higher Educational Statistical Agency, Cheltenham. Available:
http://www.hesa.ac.uk/index.php?option=com_content&task=view&id=1936&Itemid
=161. [Accessed 27th June 2012].
HM Government (2010) Low Carbon Construction, Innovation & Growth Team - Final
Report. London: HM Government.
Jenkins, A., Greenwood, C. and Vignoles, A. (2007) ‘The Returns to Qualifications in
England: Updating the Evidence Base on Level 2 and Level 3 Vocational
Qualifications’. Centre for the Economics of Education Discussion Paper 89.
Kulatunga, U., D. Amaratunga and R. Haigh (2009) “Critical success factors of
construction research and development” Construction Management and
Economics. 27(9):891-900.
Maer L. (2011). Construction Industry. House of Commons.
MBD (2011). UK Civil Engineering Market Development Report. Market and Business
Development. URL: http://www.mbdltd.co.uk/Press-Release/Civil-Engineering.htm
MBD (2010). UK House Building Market Development Report. Market and Business
Development. URL: http://www.mbdltd.co.uk/Press-Release/House-Building.htm
McIntosh, S. (2006). ‘A Cost-Benefit Analysis of Apprenticeships and Other Vocational
Qualifications’. DfES Research Report 834.
McIntosh, S. (2009). ‘The Economic Value of Intermediate Education and Vocational
Qualifications’, UK Commission for Employment and Skills, Evidence Report 11.
Migration Advisory Committee (2011) Skilled, Shortage, Sensible: Full review of the
recommended shortage occupation lists for the UK and Scotland. Croydon: MAC.
Migration Advisory Committee Secretariat (2010) “Which sectors and occupations use
more immigrant labour and what characterises them? A quantitative analysis” MAC
Working Paper, November 2010.

Sector Skills Insights: Construction
79
ONS (2009) Statistical Bulletin, Quarterly national accounts, 2nd Quarter 2009.
September 2009.
ONS (2011) Construction Statistics Report 2011. Chapter 16: Key performance indicators
and benchmarking.
Revell, A. and Blackburn, R. (2007). “The Business Case for Sustainability? An
Examination of Small Firms in the UK’s Construction and Restaurant Sectors”
Business Strategy and the Environment. 16(6): 404 - 420
RICS Construction Market Survey : United Kingdom, Second Quarter (July), RICS,
London.
Salomon, R. and Shaver, M. (2005) Learning from exporting: new insights from
examining firm innovation. Journal of Economics & Management Strategy, 14(2):
431-460.
Shury, J., Vivian, D., Davies, B. and Gore, K. (2011) Employer Perspective Survey 2010.
Evidence Report 42. UK Commission for Employment and Skills, Wath-upon-
Dearne.
Skills Provision Committee: Executive Summary - A Picture of UK Training Provision for
the Construction Industry.
http://www.cskills.org/.../spcreportexecsummary_2011_tcm17-26614.pdf
Taylor, M. (2010) “A definition and valuation of the UK offsite construction sector”
Construction Management and Economics, 28(8): 885-896.
Taylor, S. (2009) Offsite production in the UK construction industry – prepared by HSE:
A brief overview. http://www.buildoffsite.com/downloads/off-
site_production_june09.pdf
Universities UK (2007) Higher Level Learning: Universities and employers working
together. London: UUK.
UK Commission (2010) The National Strategic Skills Audit for England 2010: Volume 2
Evidence Report, UK Commission for Employment and Skills
UKCES (2011) Almanac Online. UK Commission for Employment and Skills, Wath Upon
Dearne. Available: http://almanac.ukces.org.uk/default.aspx

Sector Skills Insights: Construction
80
Wilson R. and Homenidou, K. (2011) Working Futures 2010 – 2020, Evidence Report 41,
UK Commission for Employment and Skills, Wath-upon-Dearne.
Winch, G. (1998) “The growth of self-employment in British construction.” Construction,
Management and Economics, 16(5): 531-542.
Sector Skills Insights: Construction
81
List of previous publications
Executive summaries and full versions of all these reports are available from
www.ukces.org.uk
Evidence Report 1
Skills for the Workplace: Employer Perspectives
Evidence Report 2
Working Futures 2007-2017
Evidence Report 3
Employee Demand for Skills: A Review of Evidence & Policy
Evidence Report 4
High Performance Working: A Synthesis of Key Literature
Evidence Report 5
High Performance Working: Developing a Survey Tool
Evidence Report 6
Review of Employer Collective Measures: A Conceptual Review from a Public
Policy Perspective
Evidence Report 7
Review of Employer Collective Measures: Empirical Review
Evidence Report 8
Review of Employer Collective Measures: Policy Review
Evidence Report 9
Review of Employer Collective Measures: Policy Prioritisation
Evidence Report 10

Sector Skills Insights: Construction
82
Review of Employer Collective Measures: Final Report
Evidence Report 11
The Economic Value of Intermediate Vocational Education and Qualifications
Evidence Report 12
UK Employment and Skills Almanac 2009
Evidence Report 13
National Employer Skills Survey 2009: Key Findings
Evidence Report 14
Strategic Skills Needs in the Biomedical Sector: A Report for the National Strategic Skills Audit for England, 2010
Evidence Report 15
Strategic Skills Needs in the Financial Services Sector: A Report for the National Strategic Skills Audit for England, 2010
Evidence Report 16
Strategic Skills Needs in the Low carbon Energy generation Sector: A Report for the National Strategic Skills Audit for England, 2010
Evidence Report 17
Horizon Scanning and Scenario Building: Scenarios for Skills 2020
Evidence Report 18
High Performance Working: A Policy Review
Evidence Report 19
High Performance Working: Employer Case Studies
Evidence Report 20
A Theoretical Review of Skill Shortages and Skill Needs
Sector Skills Insights: Construction
83
Evidence Report 21
High Performance Working: Case Studies Analytical Report
Evidence Report 22
The Value of Skills: An Evidence Review
Evidence Report 23
National Employer Skills Survey for England 2009: Main Report
Evidence Report 24
Perspectives and Performance of Investors in People: A Literature Review
Evidence Report 25
UK Employer Perspectives Survey 2010
Evidence Report 26
UK Employment and Skills Almanac 2010
Evidence Report 27
Exploring Employer Behaviour in relation to Investors in People
Evidence Report 28
Investors in People - Research on the New Choices Approach
Evidence Report 29
Defining and Measuring Training Activity
Evidence Report 30
Product strategies, skills shortages and skill updating needs in England: New evidence from the National Employer Skills Survey, 2009
Evidence Report 31

Sector Skills Insights: Construction
84
Skills for Self-employment
Evidence Report 32
The impact of student and migrant employment on opportunities for low skilled people
Evidence Report 33
Rebalancing the Economy Sectorally and Spatially: An Evidence Review
Evidence Report 34
Maximising Employment and Skills in the Offshore Wind Supply Chain
Evidence Report 35
The Role of Career Adaptability in Skills Supply
Evidence Report 36
The Impact of Higher Education for Part-Time Students
Evidence Report 37
International approaches to high performance working
Evidence Report 38
The Role of Skills from Worklessness to Sustainable Employment with Progression
Evidence Report 39
Skills and Economic Performance: The Impact of Intangible Assets on UK Productivity Growth
Evidence Report 40
A Review of Occupational Regulation and its Impact
Evidence Report 41
Working Futures 2010-2020
Evidence Report 42

Sector Skills Insights: Construction
85
International Approaches to the Development of Intermediate Level Skills and Apprenticeships
Evidence Report 43
Engaging low skilled employees in workplace learning
Evidence Report 44
Developing Occupational Skills Profiles for the UK
Evidence Report 45
UK Commission’s Employer Skills Survey 2011: UK Results
Evidence Report 46
UK Commission’s Employer Skills Survey 2011: England Results
Evidence Report 47
Understanding Training Levies
Evidence Report 48
Sector Skills Insight: Advanced Manufacturing
Evidence Report 49
Sector Skills Insight: Digital and Creative

Evidence Reports present detailed findings of the research produced by the UK Commission for Employment and Skills. The reports contribute to the accumulation of knowledge and intelligence on skills and employment issues through the review of existing evidence or through primary research. All of the outputs of the UK Commission can be accessed on our website at www.ukces.org.uk
Produced by the Institute for Employment Research, Warwick University for the UK Commission for Employment and Skills
UKCESRenaissance HouseAdwick ParkWath-upon-DearneRotherhamS63 5NBT +44 (0)1709 774 800F +44 (0)1709 774 801
UKCES28-30 Grosvenor GardensLondonSW1W 0TTT +44 (0)20 7881 8900F +44 (0)20 7881 8999
This document is available atwww.ukces.org.uk under ‘Publications’
ISBN 978-1-908418-16-6© UKCES 1st Ed/07.12


