
SCORQ1 2018 resultsApril 26, 2018
SCOR delivers strong operating results in Q1 2018 and records a net income of
EUR 166 million, up 18.6%

2
DisclaimerGeneral:Numbers presented throughout this report may not add up precisely to the totals in the tables and text. Percentages and percent changes are calculated on complete figures (including decimals); therefore the presentation might contain immaterial differences in sums and percentages due to rounding. Unless otherwise specified, the sources for the business ranking and market positions are internal.
Forward looking statements:This presentation includes forward-looking statements and information about the objectives of SCOR, in particular, relating to its current or future projects. These statements are sometimes identified by the use of the future tense or conditional mode, as well as terms such as “estimate”, “believe”, “have the objective of”, “intend to”, “expect”, “result in”, “should” and other similar expressions. It should be noted that the achievement of these objectives and forward-looking statements is dependent on the circumstances and facts that arise in the future. Forward-looking statements and information about objectives may be affected by known and unknown risks, uncertainties and other factors that may significantly alter the future results, performance and accomplishments planned or expected by SCOR. Information regarding risks and uncertainties that may affect SCOR’s business is set forth in the 2017 reference document filed on February 23, 2018 under number D.18-0072 with the French Autorité des marchés financiers (AMF) and posted on SCOR’s website www.scor.com.In addition, such forward-looking statements are not “profit forecasts” in the sense of Article 2 of Regulation (EC) 809/2004.
Financial information:The Group’s financial information contained in this presentation is prepared on the basis of IFRS and interpretations issued and approved by the European Union. Unless otherwise specified, prior-year balance sheet, income statement items and ratios have not been reclassified. The calculation of financial ratios (such as book value per share, return on investments, return on invested assets, Group cost ratio, return on equity, combined ratio and life technical margin) are detailed in the Appendices of this presentation (see page 15). The financial information for the first quarter 2018 included in this presentation is unaudited.Unless otherwise specified, all figures are presented in Euros. Any figures for a period subsequent to March 31, 2018 should not be taken as a forecast of the expected financials for these periods.The Q1 2018 estimated solvency ratio has been adjusted to reflect the intended calls of two debts callable in Q2 2018 (undated subordinated CHF 315 million notes) and Q4 2018 (undated subordinated CHF 250 million notes), subject to the evolution of market conditions, following the issuance of a Restricted Tier 1 subordinated USD 625 million notes issued on March 6, 2018 which pre-finances these calls. The estimated Q1 2018 solvency results were prepared on the basis of the business structure in existence at December 31, 2017, and tax assumptions consistent with those applied to the 2017 annual IFRS Group financial statements.

3
Profitable franchise expansion
SCOR delivers a strong start to 2018
1) Gross written premium growth at constant exchange rates. Group gross written premium growth of 0.9% at current exchange rates. Life +5.0% at current exchange rates and P&C -5.0% at current exchange rates; 2) 2017 dividend subject to approval of the shareholders’ Annual General Meeting on April 26, 2018; 3) See Disclaimer, page 2; 4) Based on 5-year rolling average of 5-year risk-free rates: 71 bps. See Appendix, page 23, for details
▐ GWP (in € millions) Continued Life expansion in Asia-Pacific and
Life & Health (acquisition of MutRé)
Successful P&C renewals (January and April) mainly driven by both price increases and volume, with continued development in the U.S.
Robust earnings
Strong solvency position
“Vision in Action” targets exceeded
+10.2%1)
8.6%11.2%
Q1 2017 Q1 2018
▐ Return on Equity (in %)
1 558 1 480
2 181 2 291
3 739 3 771
Q1 2017 Q1 2018
▐ Estimated solvency ratio (in %)
Strong net income of EUR 166 million Superior P&C net combined ratio of 91.8% Life technical margin of 6.8% impacted by
portfolio mix and FX Return on invested assets of 2.3%
Strong solvency position marginally above the optimal range following robust capital generation and a favorable interest rate environment
Successful issuance of an inaugural USD 625 million subordinated Tier 1 (“RT1”) debt
Attractive DPS of EUR 1.652)
Optimal range (185%-220%)
RoE ≥ 800bps above 5-year risk-free rates
Return on Equity of 11.2%Above 800 bps over the 5-year risk-free
rates over the cycle4)
Estimated solvency of 222%Marginally above the optimal 185%-220% range
+3.9%1)
+14.7%1)
222%
End of Q1 20183)
3)
(at current exchange rates)
+0.9%

4
SCOR’s three engines deliver a strong set of results in Q1 2018
Premium growth+14.7%
+5.0% at current FX
Technical margin6.8%
-0.4 pts compared to Q1 2017
1)
Premium growth+3.9%
-5.0% at current FX
1)
Net combined ratio91.8%
-2.7 pts compared to Q1 2017
Return on invested assets2.3%
-0.3 pts compared to Q1 2017
Premium growth+10.2%
+0.9% at current FX
1)
Net incomeEUR 166 million
+18.6% compared to Q1 2017
Return on Equity11.2%
1 049 bps above 5-year RFR2)
Estimated Q1 2018 solvency ratio
222%
Note: all figures are as of March 31, 20181) Gross written premium growth at constant exchange rates2) Based on a 5-year rolling average of 5-year risk-free rates: 71 bps. See Appendix C, page 23, for details3) See Disclaimer, page 2
3)

5
SCOR Q1 2018 financial details▐ In € millions (rounded) Q1 2018 Q1 2017 Variation at current FX Variation at constant FX
Gross written premiums 3 771 3 739 0.9% 10.2%
Net earned premiums 3 342 3 331 0.3% 9.5%
Operating results 242 206 17.5%
Net income 166 140 18.6%
Group cost ratio 5.0% 5.1% -0.1 pts
Net investment income 134 151 -11.2%
Return on invested assets 2.3% 2.6% -0.3 pts
Annualized RoE 11.2% 8.6% 2.6 pts
EPS (€) 0.88 0.75 17.1%
Book value per share (€) 32.49 36.35 -10.6%
Operating cash flow 123 22 459.1%
Gross written premiums 1 480 1 558 -5.0% 3.9%
Net combined ratio 91.8% 94.5% -2.7 pts
Gross written premiums 2 291 2 181 5.0% 14.7%
Life technical margin 6.8% 7.2% -0.4 pts
Gro
upP&
CLi
fe

6
SCOR records a book value per share of EUR 32.49
1) The leverage ratio is calculated as the percentage of subordinated debt compared to the sum of total shareholders’ equity and subordinated debt. The calculation excludes accrued interest from debt and includes the effects of the swaps related to the CHF 315 million (issued in 2012) and CHF 250 million (issued in 2013) subordinated debt issuances; 2) Excluding minority interests. Refer to page 22 for the detailed calculation of the book value per share; 3) The 2017 consolidated shareholders’ equity reflects the impact of the reduction of French and US corporate tax rates on the remeasurement of deferred taxes in French and US entities of the Group. The 2017 IFRS Group results were prepared on the basis of the business structure in existence at December 31, 2017. Please also refer to the 2017 reference Document; 4) Variation of unrealized gains/losses on AFS securities, net of shadow accounting and taxes, see Appendix G, page 38; 5) Composed of treasury share purchases, share award plan and share option vestings, movements on net investment hedges, changes in share capital, share buy-back and other movements
▐ In € millions (rounded)
6 225 6 177
+166
-129
+12
-97
2 211 2 276
463
ConsolidatedShareholders' equity as
of Dec. 31, 2017
Net income Revaluationreserve (financialinstruments AFS)
Currencytranslationadjustment
Other variations ConsolidatedShareholders' equity as
of Mar. 31, 20184)
Financial leverage1) 25.7% 30.1%
5)
Book value per share2) € 33.01 € 32.49
Total shareholders’ equitySubordinated debt
3)
Debtscallable in Q2 and Q4 SCOR’s financial
leverage stands at 30.1% temporarily above the range indicated in “Vision in Action”
Allowing for the intended calls of the two debts callable on June and November 2018, the adjusted financial leverage ratio would be at 26.2%

7
SCOR’s generation of net operating cash flow of EUR 123 million is mainly impacted by payments from Q3 2017 cat events
1) Investment activities are the acquisition and disposal of assets and other investments not included in cash equivalents. They predominantly include net purchases / disposals of investments; see page 20 for details
2) Financing activities are activities that result in changes in the size and composition of the contributed equity and borrowings of the entity. They predominantly include increases in capital, dividends paid by SCOR SE and cash generated by the issuance or reimbursement of financial debt
3) Of which cash and cash equivalents from third parties for the amount of EUR 160m. Please refer to slide 37 for additional details on 3rd party gross invested Assets as of March 31, 2018
▐ In € millions (rounded)
Q1 2018 Q1 2017
Cash and cash equivalents at January 1 1 001 1 688
Net cash flows from operations, of which: 123 22
SCOR Global P&C 4 89
SCOR Global Life 119 -67
Net cash flows used in investment activities1) -510 208
Net cash flows used in financing activities2) 543 6
Effect of changes in foreign exchange rates -16 10
Total cash flow 140 246
Cash and cash equivalents at March 31 1 141 1 934
Short-term investments (i.e. T-bills less than 12 months) classified as ‘’other loans and receivables’’
68 132
Total liquidity3) 1 210 2 066
SCOR’s business model delivers operating cash flow of EUR 123 million as of March 31, 2018 that should normalize to EUR 200 million per quarter
− SCOR Global P&C reflects operating cash flow payments on Q3 2017 cat events
− SCOR Global Life benefits from strong cash flow; Q1 2017 was affected by seasonality from retrocession recoverables and claims payment timing differences
Cash flow from financing activities principally reflects the issuance of the USD 625 million “RT1” subordinated debt
Total liquidity of EUR 1.2 billion; rebalancing of the invested assets continues, in line with “Vision in Action”

8
The U.S. tax reform requires SCOR to implement certain changes to its operational structure
Targeted solution identified which mitigates the Base Erosion and Anti-Abuse Tax (“BEAT”)
Limited impact on SCORof the Base Erosion and Anti-Abuse Tax (“BEAT”)
A target solution has been identified in Q1 2018 optimizing a wide range of factors:
− Business considerations
− Capital and solvency
− Regulatory complexities
− Tax compliance
Implementation of the new structure is on going and should be substantially completed by H2 2018
No accounting charge stemming from the U.S. tax reform is being accounted for in Q1 2018 – IFRS charge anticipated in Q2 2018
The total non-recurring tax expense for the target solution is expected to be in the lower half of the USD 0 - 350 million range, which was communicated in SCOR’s full year 2017 disclosure
Limited impact on the solvency ratio
In line with “Vision in Action”, effective tax rate is confirmed at 22%-24% excluding one-off provisions
Overall, lower French and U.S. corporate tax rates are positive for SCOR
Thanks to its financial flexibility and capital agility, SCOR is able to successfully absorb the shock of the U.S. Tax Reform

9
SCOR Global P&C delivers strong technical profitability with a net combined ratio of 91.8%
Gross written premium
Net combined ratio
1) At constant FX; 2) See page 13 for details; 3) The commission ratio includes a one off 1% impact of sliding scale commissions which are a feature of some specific large contracts in China; this impact offsets reduced loss ratios; 4) Q1 2017 was negatively impacted by 8.9% of the change in Ogden rate partly balanced by 3.5% of reserves releases; 5) See Appendix E, page 26, for detailed calculation of the combined ratio
▐ In € millions
▐ In %
SCOR Global P&C gross written premium stands at EUR 1 480 million, +3.9% at constant FX compared to the same period of last year (-5.0% at current FX). The growth comes from P&C treaties in the U.S. and SCOR Business Solutions
In line with the January renewals communication, the growth for the full year 2018, at constant FX, is expected to be within the 3%-8% range assumed in “Vision in Action”2)
The excellent net combined ratio of 91.8% is driven by: − A very robust net attritional and commission ratio of
80.3%3) , resulting from low man-made activity,1pt below the 86.7% of Q1 2017 once normalized for the 5.4% impact of Ogden net of reserve releases4)
− Nat cat net losses of 4.1% mainly due to the European windstorm Friederike as well as an earthquake in Papua New Guinea
− Expense ratio of 7.4% which reflects the increasing weight of insurance business and the extended perimeter of retrocession
The Q1 2018 normalized net combined ratio stands at 93.7%5), below the 95%-96% assumption of “Vision in Action”2)
1 558 1 480
Q1 2017 Q1 2018
+3.9%1)
(at current exchange
rates)
-5.0%
61.2% 53.5%
1.0% 4.1%
25.5% 26.8%
6.8% 7.4%
Q1 2017 Q1 2018
87.7% 84.4%Net
technical ratio
P&C management expenses (+0.6 pts)
Commissions (+1.3 pts)Natural catastrophes (+3.1 pts)
Net attritional (-7.7 pts)
94.5% 91.8%

10
SCOR maintained positive pricing trends at the April P&C renewals
Agriculture: Driven by India
Credit & Surety: Driven by Japan
U.S. Cat: Stable client portfolio
Specialties by Line of Business
Treaty P&C by Geography
All figures based on available information as of April 12, 2018, at constant exchange rates at December 31, 20171) Includes all U.S. Cat business underwritten in Zurich and Chicago2) Includes U.S. Cat business underwritten by Specialties
SCOR’s gross reinsurance premiums grew +13.5% from EUR 445 to 505 million
Price improvements in line with January: +2.9%
▐ Gross premiums (in € millions)
Japan: Maintained position; generally flat
India: Growth with selected clients in improved market conditions
U.S.: New business and share increases with selected accounts
24
35
91
26
37
108
Total U.S. Cat
Credit & Surety
Agriculture
36
40
91
46
56
91
U.S.
India
Japan
+29%
+40%
+ ~1%
+8%
+5%
Still in progress
Up for renewalRenewed business
1)
2)

11
In Q1 2018, SCOR Global Life records strong profitable growth expanding the franchise further in Asia-Pacific
Gross written premium
Life technical margin3)
▐ In € millions
▐ In %
SCOR Global Life records strong growth in Q1 2018 with gross written premium standing at EUR 2 291 million, +14.7% at constant FX compared to Q1 2017 (+5.0% at current FX), in particular driven by Asia-Pacific and Financial Solutions
FY 2018 gross written premium growth is expected to normalize in line with the “Vision in Action” assumptions2)
Strong increase in net technical result up 10.3% reaching EUR 162 million1)
Technical margin stands at 6.8% (7.0% at constant FX) in Q1 2018, in line with “Vision in Action” assumptions, driven by:− Performance of the in-force portfolio in line with
expectations − Profitability of new business in line with the Group’s
RoE target The integration of MutRé is successfully completed:
− PGAAP Accounting results in badwill of EUR 26 million
− Contributing EUR 33 million GWP, or 1.5% of growth, with technical margin in line with “Vision in Action”
1) At constant FX2) See page 13 for details3) See Appendix F, page 28 for detailed calculation of the Life technical margin
2 181 2 291
Q1 2017 Q1 2018
+14.7%1)
(at currentexchange
rates)
+5.0%
7.2% 7.1% 6.8% 7.0%
Q1 2017 FY 2017 Q1 2018(Current FX)
Q1 2018(Constant FX)

12
In Q1 2018, SCOR Global Investments delivers a return on invested assets of 2.3%
1) Funds withheld & other deposits2) 5.0-year duration on invested assets (vs. 5.0 years in Q4 2017)3) Investable cash: includes current cash balances, and future coupons and redemptions4) Corresponds to marginal reinvestment yields based on Q1 2018 asset allocation of asset yielding classes (i.e. fixed income, loans
and real estate), according to current reinvestment duration assumptions and spreads. Yield curves as of March 31, 2018
Total invested assets: EUR 18.9 billion at 31/03/2018
Total investments reach EUR 27.6 billion, with total invested assets of EUR 18.9 billion and funds withheld1) of EUR 8.7 billion
Portfolio positioning in line with “Vision in Action” target asset allocation:− Liquidity at 5% (stable vs. Q4 2017)− Corporate bonds at 47% (+1 pt vs. Q4 2017) − Fixed income portfolio of very high quality, with an
average rating of A+, and a stable duration at 4.6 years2)
Investment portfolio remains liquid, with financial cash flows3) of EUR 5.4 billion expected over the next 24 months, which is optimal in a period of rising interest rates
Investment income on invested assets stands atEUR 108 million in Q1 2018, generating a return on invested assets of 2.3%
The reinvestment yield stands at 2.7% at the end of Q1 20184)
Under current market conditions, SCOR Global Investments expects the annualized return on invested assets in the upper part of the “Vision in Action” 2.5%-3.2% range for FY2018 and over the entire strategic plan
Return on invested assets vs. risk-free benchmark
▐ In % (rounded) Liquidity 5%
Fixed income 81%
Short-term investments 0%
Covered bonds & agency MBS 9%
Corporate bonds 47%
Structured & securitized products 1%
Loans 4%
Equities 3%Real estate 4%
Others 3%
Government bonds & assimilated 24%
3.7%2.9% 2.6% 2.9% 3.1% 2.9% 3.5%
2.3%
2.3% 1.8% 1.7% 1.6% 1.0% 0.9% 1.1% 1.2%
2011 2012 2013 2014 2015 2016 2017 Q12018Return on invested assets
SGI risk-free duration-adjusted benchmark
Cash 5%
▐ In % (rounded)

13
SCOR is on track to successfully deliver “Vision in Action” targets and assumptions in 2018
1) Based on a 5-year rolling average of 5-year risk-free rates
RoE above 800 bps over the 5-year risk-free rates across the cycle1)
Solvency ratio in the optimal 185%-220% range
Strategic assumptions of SCOR’s business engines according to “Vision in Action”
Profitability (RoE) target Solvency target
GWP growth3%-8% p.a.
Net combined ratio~95%-96%
GWP growth5%-6% p.a.
Net technical margin6.8%-7.0%
Return on invested assets
2.5%-3.2%

14
2018 upcoming events and Investor Relations contacts
Forthcoming scheduled events
SCOR is scheduled to attend the following investor conferences
Contacts: [email protected]
Ian Kelly
Head of Investor Relations
[email protected]+44 20 32 07 85 61
Olivier Armengaud
Investor Relations Senior Manager
[email protected]+33 1 58 44 86 12
Annabelle Paillette
Investor RelationsManager
[email protected]+33 1 58 44 83 99
Bank of America Merrill Lynch, London (September 26) Deutsche Bank, New York (May 29)
Goldman Sachs, Frankfurt (June 6)
Société Générale, Tokyo (June 13)
July 26, 2018—
SCOR group Q2 2018 results
October 24, 2018—
SCOR group Q3 2018 results
September 5, 2018—
SCOR group Investor Day
(Paris)

15
APPENDICES
Appendix A: P&L
Appendix B: Balance sheet & Cash flow
Appendix C: Calculation of EPS, Book value per share and RoE
Appendix D: Expenses & cost ratio
Appendix E: P&C
Appendix F: Life
Appendix G: Investment
Appendix H: Debt
Appendix I: Rating evolution
Appendix J: Listing information
Appendix K: Awards
A
B
C
D
E
F
G
H
I
J
K

16
Appendix A: Consolidated statement of income, Q1 2018
Q1 2018 Q1 2017Gross written premiums 3 771 3 739Change in gross unearned premiums -149 -139Revenues associated with life financial reinsurance contracts 2 1Gross benefits and claims paid -2 540 -2 626Gross commissions on earned premiums -606 -606Gross technical result 478 369Ceded written premiums -317 -300Change in ceded unearned premiums 37 31Ceded claims 61 151Ceded commissions 36 15Net result of retrocession -183 -103Net technical result 295 266Other income and expenses excl. revenues associated with financial reinsurance contracts -8 -16Total other operating revenues / expenses -8 -16Investment revenues 102 102Interest on deposits 42 46Realized capital gains / losses on investments 19 20Change in investment impairment -7 -8Change in fair value of investments -3 9Foreign exchange gains / losses -13 -2Investment income 140 167Investment management expenses -16 -17Acquisition and administrative expenses -133 -137Other current operating income and expenses -55 -51Current operating results 223 212Other operating income and expenses -7 -6Operating results before impact of acquisitions 216 206Acquisition-related expensesGain on bargain purchase 26Operating results 242 206Financing expenses -37 -39Share in results of associates -1 1Corporate income tax -38 -29Consolidated net income 166 139of which non-controlling interests -1Consolidated net income, Group share 166 140
▐ In € millions (rounded)

17
Appendix A: Consolidated statement of income by segment, Q1 2018
1) See Appendix E, page 25 for detailed calculation of the combined ratio2) See Appendix F, page 28 for detailed calculation of the technical margin
Q1 2018 Q1 2017Life P&C Group
functions Total Life P&C Group functions Total
Gross written premiums 2 291 1 480 3 771 2 181 1 558 3 739Change in gross unearned premiums -49 -100 -149 -27 -112 -139Revenues associated with life financial reinsurance contracts 2 2 1 1Gross benefits and claims paid -1 829 -711 -2 540 -1 777 -849 -2 626Gross commissions on earned premiums -257 -349 -606 -260 -346 -606Gross technical result 158 320 478 118 251 369Ceded written premiums -116 -201 -317 -123 -177 -300Change in ceded unearned premiums 37 37 31 31Ceded claims 50 11 61 109 42 151Ceded commissions 13 23 36 1 14 15Net result of retrocession -53 -130 -183 -13 -90 -103Net technical result 105 190 295 105 161 266Other income and expenses excl. revenues associated with financial reinsurance contracts -8 -8 -4 -12 -16
Total other operating revenues / expenses -8 -8 -4 -12 -16Investment revenues 36 66 102 35 67 102Interest on deposits 40 2 42 42 4 46Realized capital gains / losses on investments 1 18 19 7 13 20Change in investment impairment -7 -7 -8 -8Change in fair value of investments -3 -3 1 8 9Foreign exchange gains / losses -5 -8 -13 -2 -2Investment income 72 68 140 83 84 167Investment management expenses -4 -10 -2 -16 -5 -10 -2 -17Acquisition and administrative expenses -62 -66 -5 -133 -67 -64 -6 -137Other current operating income and expenses -21 -12 -22 -55 -15 -10 -26 -51Current operating results 90 162 -29 223 97 149 -34 212Other operating income and expenses 2 -9 -7 -6 -6Operating results before impact of acquisitions 92 153 -29 216 97 143 -34 206Loss ratio 57.6% 62.2%Commissions ratio 26.8% 25.5%P&C management expense ratio 7.4% 6.8%Net combined ratio1) 91.8% 94.5%Life technical margin2) 6.8% 7.2%
▐ In € millions (rounded)

18
Appendix B: Consolidated balance sheet – Assets
1) Include other intangible assets, tangible assets and other assets
Q1 2018 Q4 2017
Goodwill 788 788Goodwill arising from non insurance activities 71 71Value of business acquired 1 422 1 412Insurance business investments 28 946 28 360Real estate investments 701 701Available-for-sale investments 17 283 17 089Investments at fair value through income 1 262 1 157Loans and receivables 9 560 9 299Derivative instruments 140 114Investments in associates 17 75Share of retrocessionaires in insurance and investment contract liabilities 1 945 2 037Other assets 9 733 9 490Accounts receivable from assumed insurance and reinsurance transactions 6 132 5 875Accounts receivable from ceded reinsurance transactions 203 146Deferred tax assets 502 533Taxes receivable 198 193Miscellaneous assets1) 1 236 1 328Deferred acquisition costs 1 462 1 415Cash and cash equivalents 1 141 1 001
Total assets 44 063 43 234
▐ In € millions (rounded)
19
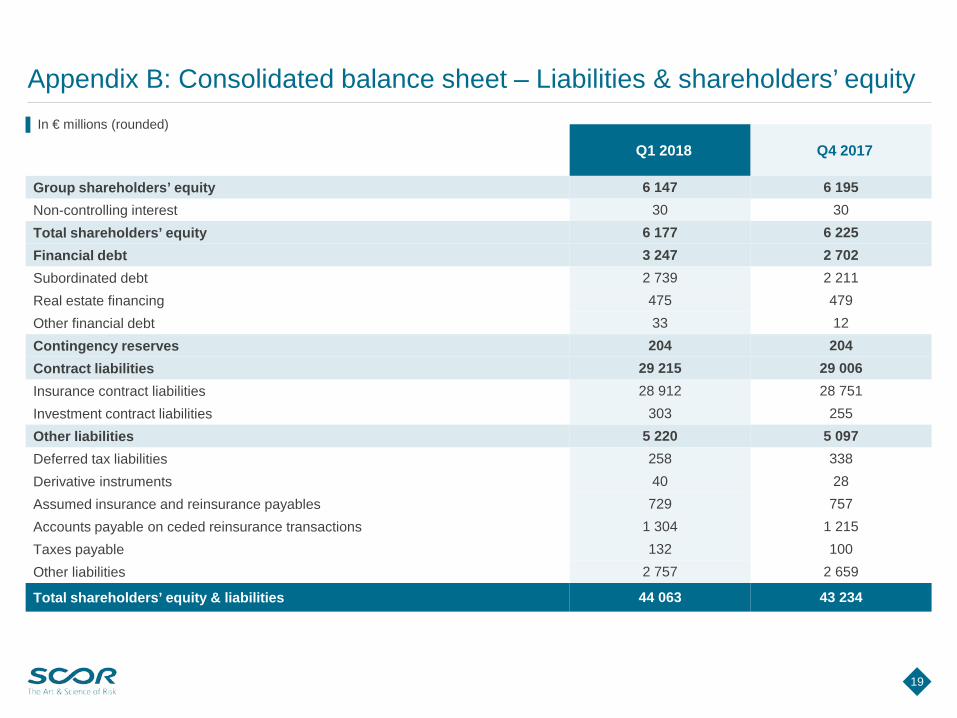
Appendix B: Consolidated balance sheet – Liabilities & shareholders’ equity
Q1 2018 Q4 2017
Group shareholders’ equity 6 147 6 195Non-controlling interest 30 30Total shareholders’ equity 6 177 6 225Financial debt 3 247 2 702Subordinated debt 2 739 2 211Real estate financing 475 479Other financial debt 33 12Contingency reserves 204 204Contract liabilities 29 215 29 006Insurance contract liabilities 28 912 28 751Investment contract liabilities 303 255Other liabilities 5 220 5 097Deferred tax liabilities 258 338Derivative instruments 40 28Assumed insurance and reinsurance payables 729 757Accounts payable on ceded reinsurance transactions 1 304 1 215Taxes payable 132 100Other liabilities 2 757 2 659
Total shareholders’ equity & liabilities 44 063 43 234
▐ In € millions (rounded)

20
Appendix B: Consolidated statements of cash flows
Q1 2018 Q1 2017
Cash and cash equivalents at the beginning of the period 1 001 1 688Net cash flows in respect of operations 123 22Cash flow in respect of changes in scope of consolidation 5 3Cash flow in respect of acquisitions and sale of financial assets -486 217Cash flow in respect of acquisitions and disposals of tangible and intangible fixed assets -29 -12Net cash flows in respect of investing activities -510 208Transactions on treasury shares and issuance of equity instruments 5 11Dividends paidCash flows in respect of shareholder transactions 5 11Cash related to issue or reimbursement of financial debt 522Interest paid on financial debt -10 -5Other cash flow from financing activities 26Cash flows in respect of financing activities 538 -5Net cash flows in respect of financing activities 543 6Effect of changes in foreign exchange rates -16 10
Cash and cash equivalents at the end of the period 1 141 1 934
▐ In € millions (rounded)
21
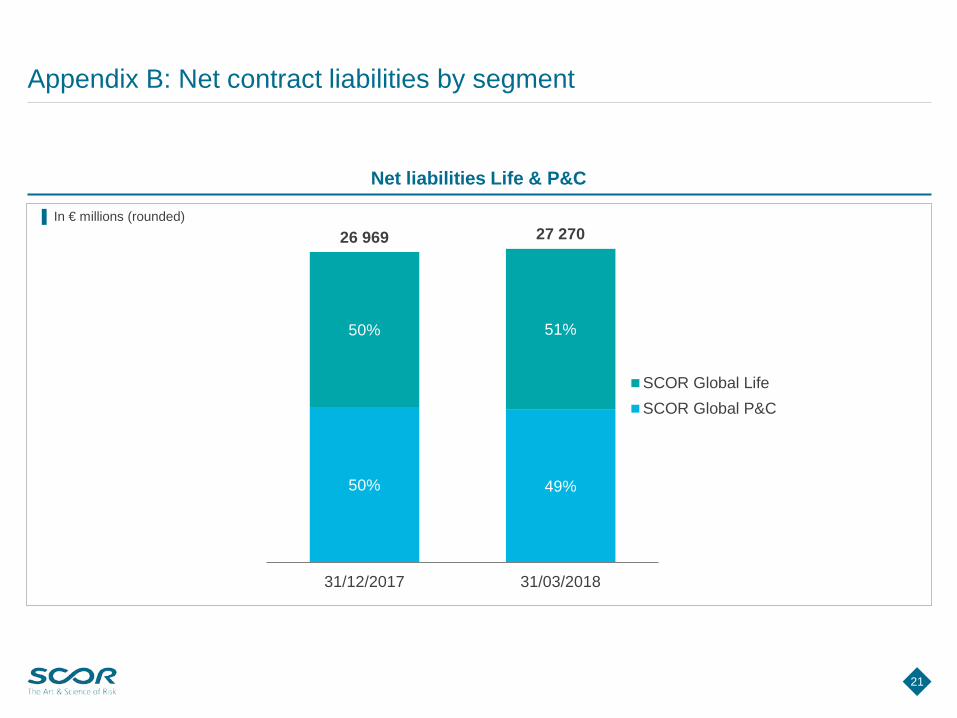
Appendix B: Net contract liabilities by segment
Net liabilities Life & P&C
▐ In € millions (rounded)
50% 49%
50% 51%
26 969 27 270
31/12/2017 31/03/2018
TotalSCOR Global LifeSCOR Global P&C
22
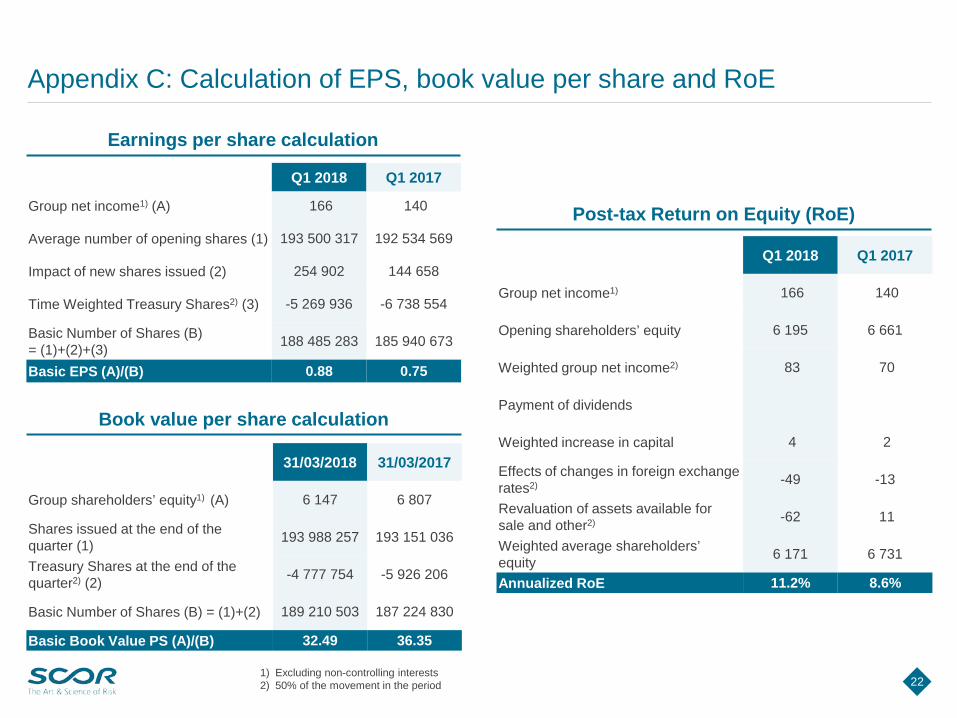
Appendix C: Calculation of EPS, book value per share and RoE
Earnings per share calculation
Book value per share calculation
Post-tax Return on Equity (RoE)
Q1 2018 Q1 2017
Group net income1) (A) 166 140
Average number of opening shares (1) 193 500 317 192 534 569
Impact of new shares issued (2) 254 902 144 658
Time Weighted Treasury Shares2) (3) -5 269 936 -6 738 554
Basic Number of Shares (B) = (1)+(2)+(3) 188 485 283 185 940 673
Basic EPS (A)/(B) 0.88 0.75
31/03/2018 31/03/2017
Group shareholders’ equity1) (A) 6 147 6 807
Shares issued at the end of the quarter (1) 193 988 257 193 151 036
Treasury Shares at the end of the quarter2) (2) -4 777 754 -5 926 206
Basic Number of Shares (B) = (1)+(2) 189 210 503 187 224 830
Basic Book Value PS (A)/(B) 32.49 36.35
1) Excluding non-controlling interests2) 50% of the movement in the period
Q1 2018 Q1 2017
Group net income1) 166 140
Opening shareholders’ equity 6 195 6 661
Weighted group net income2) 83 70
Payment of dividends
Weighted increase in capital 4 2
Effects of changes in foreign exchange rates2) -49 -13
Revaluation of assets available for sale and other2) -62 11
Weighted average shareholders’ equity 6 171 6 731
Annualized RoE 11.2% 8.6%

23
Appendix C: Calculation of the risk-free rate component of “Vision in Action” RoE target
1) 5-year risk-free rate2) 5-year German government bond3) Year-end currency mix based on SCOR’s net technical reserves
5-year rolling average of 5-year
risk-free rates
X =
5 ye
ars
5-year daily spot rates 1) Currency mix 3)Weighted average rates
EUR 2) USD GBP EUR USD GBP EUR USD GBP Total
1st April 2013 0.31 0.76 0.70 57% 30% 13% 0.16 0.22 0.11 0.492nd April 2013 0.34 0.77 0.71 57% 30% 13% 0.23 0.23 0.12 0.583rd April 2013 0.32 0.73 0.69 57% 30% 13% 0.26 0.25 0.13 0.64… … … … … … … … … … …31st Dec 2013 0.93 1.74 1.87 57% 30% 13% 0.53 0.53 0.23 1.29… … … … … … … … … … …31st Dec 2014 0.01 1.65 1.17 55% 32% 13% 0.01 0.53 0.15 0.69… … … … … … … … … … …31st Dec 2015 -0.04 1.77 1.35 51% 36% 13% -0.02 0.63 0.18 0.79… … … … … … … … … … …30th Dec 2016 -0.54 1.92 0.48 51% 36% 13% -0.28 0.71 0.06 0.49… … … … … … … … … … …29th December 2017 -0.20 2.21 0.73 52% 37% 11% -0.11 0.82 0.08 0.80… … … … … … … … … … …28th March 2018 -0.10 2.59 1.12 54% 35% 11% -0.05 0.91 0.12 0.9829th March 2018 -0.10 2.57 1.11 52% 37% 11% -0.06 0.90 0.12 0.9629th March 2018 -0.10 2.57 1.11 52% 37% 11% -0.06 0.90 0.12 0.96
0.71

24
Appendix D: Reconciliation of total expenses to cost ratio
▐ In € millions (rounded)
Q1 2018 Q1 2017
Total expenses as per Profit & Loss account -204 -205ULAE (Unallocated Loss Adjustment Expenses) -17 -15Total management expenses -221 -220Investment management expenses 16 17Total expense base -205 -203Minus corporate finance expenses 1 1Minus amortization 10 10Minus non-controllable expenses 5 3Total management expenses (for Group cost ratio calculation) -189 -189Gross Written Premiums (GWP) 3 771 3 739
Group cost ratio 5.0% 5.1%

25
Appendix E: Calculation of P&C net combined ratio for Q1 2018
1) Gross written premiums + Change in gross unearned premiums2) Ceded gross written premiums + Change in ceded unearned premiums
Q1 2018 Q1 2017
Gross earned premiums1) 1 380 1 446Ceded earned premiums2) -164 -146Net earned premiums (A) 1 216 1 300Gross benefits and claims paid -711 -849Ceded claims 11 42Total net claims (B) -700 -807Loss ratio (Net attritional + Natural catastrophes): -(B)/(A) 57.6% 62.2%Gross commissions on earned premiums -349 -346Ceded commissions 23 14Total net commissions (C) -326 -332Commission ratio: -(C)/(A) 26.8% 25.5%Total technical ratio: -((B)+(C))/(A) 84.4% 87.7%Acquisition and administrative expenses -66 -64Other current operating income / expenses -12 -10Other income and expenses from reinsurance operations -12 -15Total P&C management expenses (D) -90 -89P&C management expense ratio: -(D)/(A) 7.4% 6.8%
Total net combined ratio: -((B)+(C)+(D))/(A) 91.8% 94.5%
▐ In € millions (rounded)

26
Appendix E: Normalized net combined ratio
1) The budget cat ratio was 7% until Q4 2015 and 6% from Q1 2016; 2) Includes EUR 40 million (pre-tax) positive effect (3.1 pts on a quarterly basis) relatedto a reserve release in Q2 2016 – on a YTD basis, the impact on the net combined ratio is 1.6 pts at Q2 2016, 1.1 pts at Q3 2016 and 0.8 pts at Q4 2016;3) Includes EUR 45 million (pre-tax) positive effect (3.5 pts on a quarterly basis) related to a reserve release in Q1 2017 and EUR 71 million (pre-tax) negativeone-off linked in Ogden (-8.9 pts in Q1 and +3.6 pts in Q4) – on a YTD basis, the impact on the net combined ratio is 0.9 pts for reserve release and -1.4 ptsfor the negative one-off; 4) From Q2 2017, the net combined ratio calculation has been refined to exclude some immaterial non technical items that werepreviously included. Considering their potential growth, these items have been excluded to ensure they do not distort the combined ratio in the future
QTD YTD1 2 3 4 5 1+2+3+5 1 2 3 4 5 1+2+3+5
Published net
combined ratio
Reserve release One off Cat ratio
Cat ratio delta from budget1)
Normalized net
combined ratio
Published net
combined ratio
Reserve release One off Cat ratio
Cat ratio delta from budget1)
Normalized net
combined ratio
Q1 2014 88.9% 2.1% 4.9% 93.8% 88.9% 2.1% 4.9% 93.8%
Q2 2014 92.8% 5.0% 2.0% 94.8% 90.9% 3.5% 3.5% 94.4%
Q3 2014 92.8% 4.7% 2.3% 95.1% 91.6% 3.9% 3.1% 94.7%
Q4 2014 91.1% 4.8% 2.2% 93.3% 91.4% 4.2% 2.8% 94.2%
Q1 2015 89.1% 1.7% 5.3% 94.4% 89.1% 1.7% 5.3% 94.4%
Q2 2015 92.6% 2.0% 5.0% 97.6% 90.9% 1.8% 5.2% 96.1%
Q3 2015 90.6% 1.2% 5.8% 96.4% 90.8% 1.6% 5.4% 96.2%
Q4 2015 92.2% 4.0% 3.0% 95.2% 91.1% 2.2% 4.8% 95.9%
Q1 2016 89.7% 1.4% 4.6% 94.3% 89.7% 1.4% 4.6% 94.3%
Q2 2016 97.5% 3.1%2) 12.0% -6.0% 94.6% 93.8% 1.6%2) 6.9% -0.9% 94.5%
Q3 2016 91.4% 3.4% 2.6% 94.0% 93.0% 1.1%2) 5.7% 0.3% 94.4%
Q4 2016 93.3% 4.8% 1.2% 94.5% 93.1% 0.8%2) 5.5% 0.5% 94.4%
Q1 2017 94.5% 3.5%3) -8.9%3) 1.0% 5.0% 94.0% 94.5% 3.5%3) -8.9%3) 1.0% 5.0% 94.0%
Q2 20174) 92.6% 3.2% 2.8% 95.4% 93.5% 1.7% -4.3% 2.1% 3.9% 94.7%
Q3 2017 136.7% 47.4% -41.4% 95.4% 107.5% 1.1% -2.9% 16.8% -10.8% 95.0%
Q4 2017 91.6% 3.6%3) 8.8% -2.8% 92.4% 103.7% 0.9%3) -1.4%3) 14.9% -8.9% 94.3%
Q1 2018 91.8% 4.1% 1.9% 93.7% 91.8% 4.1% 1.9% 93.7%

27
Appendix E: SCOR Global P&C renewal definitions
Total premiums up for renewal: premiums of all Treaty contracts incepting in April 2017 at the exchange rate as at December 31, 2017
Cancelled/restructured: client or SCOR decided to cancel the business/programs and/or to change their programs (e.g. from proportional to non-proportional)
Underlying volume x price changes: combined effect of variations in underlying primary volume, in exposures and/or in rates
Exposure change: refers to the change in risk for the SCOR portfolio
New business with existing clients: existing client decided to place new business/programs and/or to change their programs (e.g. from proportional to non-proportional)
New clients: acquisition of new clients
Share variation: client or SCOR decided to reduce or increase the share participation (e.g. SCOR increases share with client X from 10% to 20%)
Total renewed premiums: premiums of all Treaty contracts incepting in April 2018 at the exchange rate as at December 31, 2017
Gross Underwriting Ratio: for pricing purposes, on an underwriting year basis: the sum of the expected loss ratio and the acquisition cost ratio (cedant’s commission and brokerage ratios), excluding internal expenses
Net Technical Ratio: on an accounting year basis, the sum of the loss ratio after retrocession and the acquisition cost ratio (cedant's commission and brokerage ratios)
Combined Ratio: on an accounting year basis, Net Technical Ratio plus internal expenses

28
Appendix F: Calculation of the Life technical margin
1) Gross written premiums + Change in gross unearned premiums2) Ceded gross written premiums + Change in ceded unearned premiums
▐ In € millions (rounded)
Q1 2018 Q1 2017
Gross earned premiums1) 2 242 2 154Ceded earned premiums2) -116 -123Net earned premiums (A) 2 126 2 031Net technical result 105 105Interest on deposits 40 42Technical result (B) 145 147
Net technical margin (B)/(A) 6.8% 7.2%
29
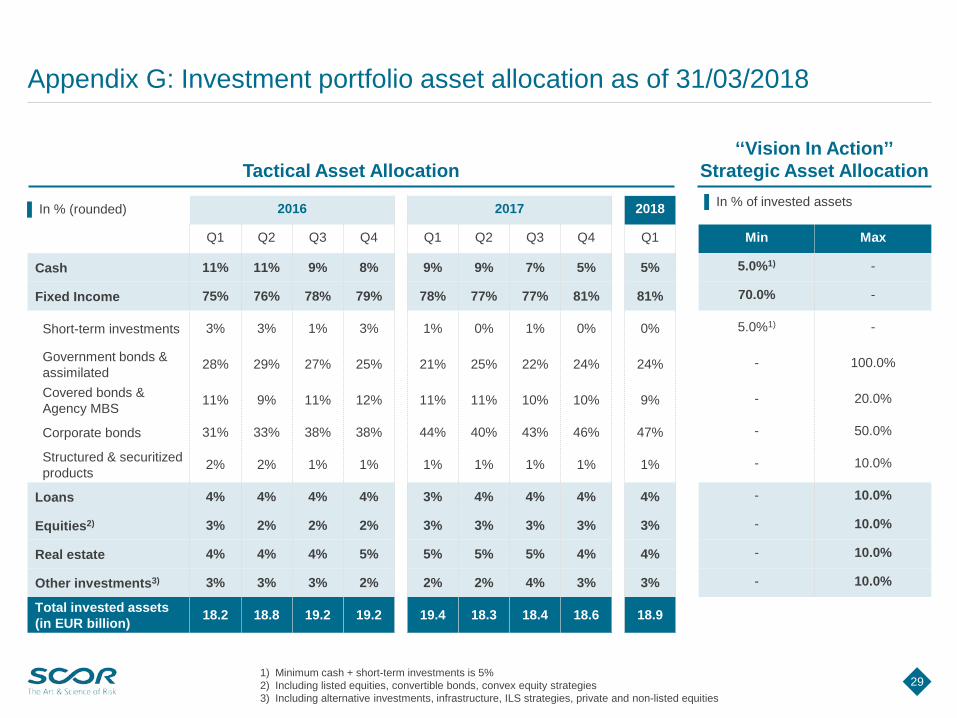
Appendix G: Investment portfolio asset allocation as of 31/03/2018
Tactical Asset Allocation‘‘Vision In Action’’
Strategic Asset Allocation
1) Minimum cash + short-term investments is 5%2) Including listed equities, convertible bonds, convex equity strategies3) Including alternative investments, infrastructure, ILS strategies, private and non-listed equities
2016 2017 2018
Q1 Q2 Q3 Q4 Q1 Q2 Q3 Q4 Q1 Min Max
Cash 11% 11% 9% 8% 9% 9% 7% 5% 5% 5.0%1) -
Fixed Income 75% 76% 78% 79% 78% 77% 77% 81% 81% 70.0% -
Short-term investments 3% 3% 1% 3% 1% 0% 1% 0% 0% 5.0%1) -
Government bonds & assimilated 28% 29% 27% 25% 21% 25% 22% 24% 24% - 100.0%
Covered bonds & Agency MBS 11% 9% 11% 12% 11% 11% 10% 10% 9% - 20.0%
Corporate bonds 31% 33% 38% 38% 44% 40% 43% 46% 47% - 50.0%
Structured & securitized products 2% 2% 1% 1% 1% 1% 1% 1% 1% - 10.0%
Loans 4% 4% 4% 4% 3% 4% 4% 4% 4% - 10.0%
Equities2) 3% 2% 2% 2% 3% 3% 3% 3% 3% - 10.0%
Real estate 4% 4% 4% 5% 5% 5% 5% 4% 4% - 10.0%
Other investments3) 3% 3% 3% 2% 2% 2% 4% 3% 3% - 10.0%
Total invested assets(in EUR billion) 18.2 18.8 19.2 19.2 19.4 18.3 18.4 18.6 18.9
▐ In % (rounded) ▐ In % of invested assets
30
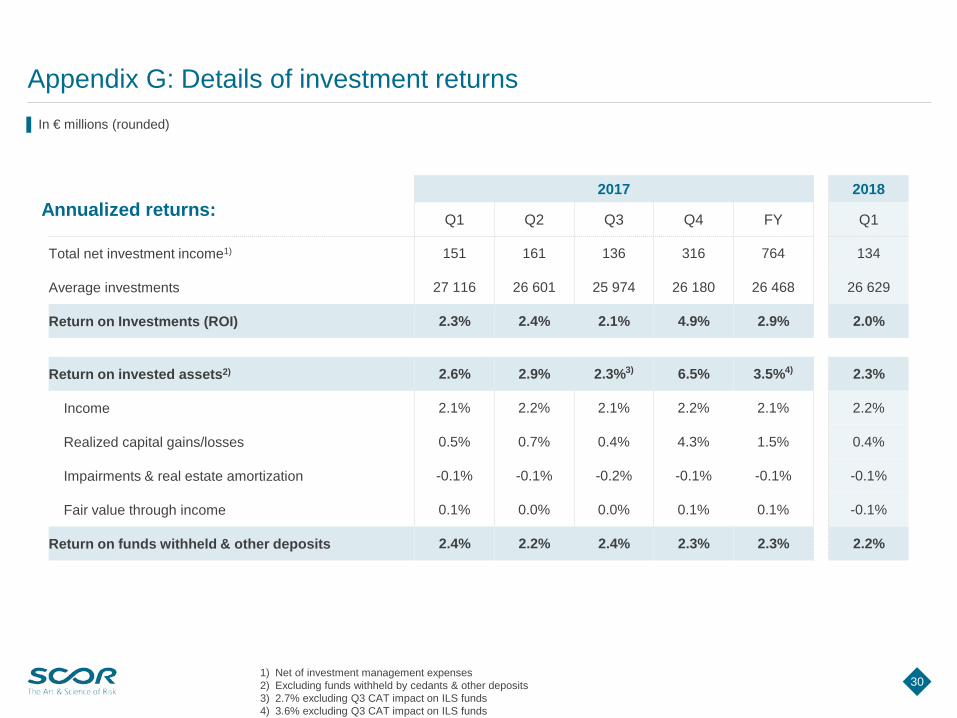
Appendix G: Details of investment returns
1) Net of investment management expenses2) Excluding funds withheld by cedants & other deposits3) 2.7% excluding Q3 CAT impact on ILS funds4) 3.6% excluding Q3 CAT impact on ILS funds
2017 2018
Q1 Q2 Q3 Q4 FY Q1
Total net investment income1) 151 161 136 316 764 134
Average investments 27 116 26 601 25 974 26 180 26 468 26 629
Return on Investments (ROI) 2.3% 2.4% 2.1% 4.9% 2.9% 2.0%
Return on invested assets2) 2.6% 2.9% 2.3%3) 6.5% 3.5%4) 2.3%
Income 2.1% 2.2% 2.1% 2.2% 2.1% 2.2%
Realized capital gains/losses 0.5% 0.7% 0.4% 4.3% 1.5% 0.4%
Impairments & real estate amortization -0.1% -0.1% -0.2% -0.1% -0.1% -0.1%
Fair value through income 0.1% 0.0% 0.0% 0.1% 0.1% -0.1%
Return on funds withheld & other deposits 2.4% 2.2% 2.4% 2.3% 2.3% 2.2%
▐ In € millions (rounded)
Annualized returns:

31
2017 2018
Q1 Q2 Q3 Q4 FY Q1Investment revenues on invested assets 101 105 96 101 403 101
Realized gains/losses on fixed income 11 35 19 1 66 1Realized gains/losses on loans 0 0 0 0 0 0Realized gains/losses on equities 0 -0 1 -1 -0 17Realized gains/losses on real estate -0 0 192 192Realized gains/losses on other investments 12 -0 0 2 14 1
Realized gains/losses on invested assets 23 35 20 194 272 19Change in impairment on fixed income 0 -0 0 -0 -0 0Change in impairment on loans -1 0 -0 -1Change in impairment on equity -0Change in impairment/amortization on real estate -5 -4 -6 -5 -20 -5Change in impairment on other investments -1 -0 -4 -0 -5 -1
Change in impairment on invested assets -7 -4 -10 -5 -26 -6Fair value through income on invested assets 6 1 1 3 11 -5of which: income on other consolidated entities 13 -1 12 -2Financing costs on real estate investments -1 -1 -1 -1 -4 -1
Total investment income on invested assets 122 136 106 292 656 108Income on funds withheld & other deposits 46 42 45 44 177 42Investment management expenses -17 -17 -15 -20 -69 -16
Total net investment income 151 161 136 316 764 134Foreign exchange gains / losses -2 -12 2 -15 -27 -13Step acquisition revaluation gain -13 1 -12 2Income on technical items -0 -0 -0 -1 -1 -0Financing costs on real estate investments 1 1 1 1 4 1
IFRS investment income net of investment management expenses 150 150 126 302 728 124
Appendix G: Investment income development▐ In € millions (rounded)

32
Appendix G: Government bond portfolio as of 31/03/2018
22%
39%4%
11%
24%EU (Non-UK)
North America
UK
China
Other
By region Top exposures
1) Supranational exposures consisting primarily of ‘‘European Investment Bank’’ securities and similar securities
▐ In %. Total € 4.5 billionQ1 2018
USA 33%France 11%China 11%Canada 6%Germany 6%UK 4%Singapore 4%Republic of Korea 4%Supranational1) 4%Australia 4%South Africa 2%Belgium 2%Brazil 1%Italy 1%Denmark 1%Spain 1%Norway 1%Other 4%Total 100%
▐ In %. Total € 4.5 billion
No exposure to US municipal bonds

33
Appendix G: Corporate bond portfolio as of 31/03/2018
By rating
By region
Q1 2018Financial1) 27%Consumer, Non-cyclical 21%Consumer, Cyclical 12%Industrial 11%Communications 10%Technology 7%Energy 5%Utilities 3%Basic Materials 3%Other 1%Diversified / Funds 0%Total 100%
By sector/type
By seniority
1) Of which banks: 82.0%2) Including tier 1, upper tier 2 and tier 2 debts for financials
Source: Bloomberg sector definitions
▐ In %. Total € 8.9 billion
2%
13%
47%
31%
5%
2%
AAA
AA
A
BBB
<BBB
NR
▐ In %. Total € 8.9 billion
27%
58%
8%7%
EU (Non-UK)
North America
UK
Other
95%
2% 2%
1%SeniorSubordinatedHybridOther
Source: Bloomberg geography definitions
2)
▐ In %. Total € 8.9 billion▐ In %. Total € 8.9 billion

34
Appendix G: ‘‘Banks’’ corporate bond portfolio as of 31/03/2018
By rating
By region
Q1 2018USA 42%Canada 11%Great Britain 10%France 9%Sweden 7%Netherlands 7%Australia 5%Switzerland 4%Norway 1%Spain 1%Other 3%Total 100%
By seniority
Top exposures
1) Including tier 1, upper tier 2 and tier 2 debts for financials
▐ In %. Total € 2.0 billion
▐ In %. Total € 2.0 billion
26%
53%
10%
11%EU (Non-UK)
North America
UK
Other
91%
8%
1%
Senior
Subordinated
Hybrid
0%
11%
59%
29%
1%0%
AAAAAABBB<BBBNR
Source: Bloomberg geography definitions
▐ In %. Total € 2.0 billion
▐ In %. Total € 2.0 billion
1)
35
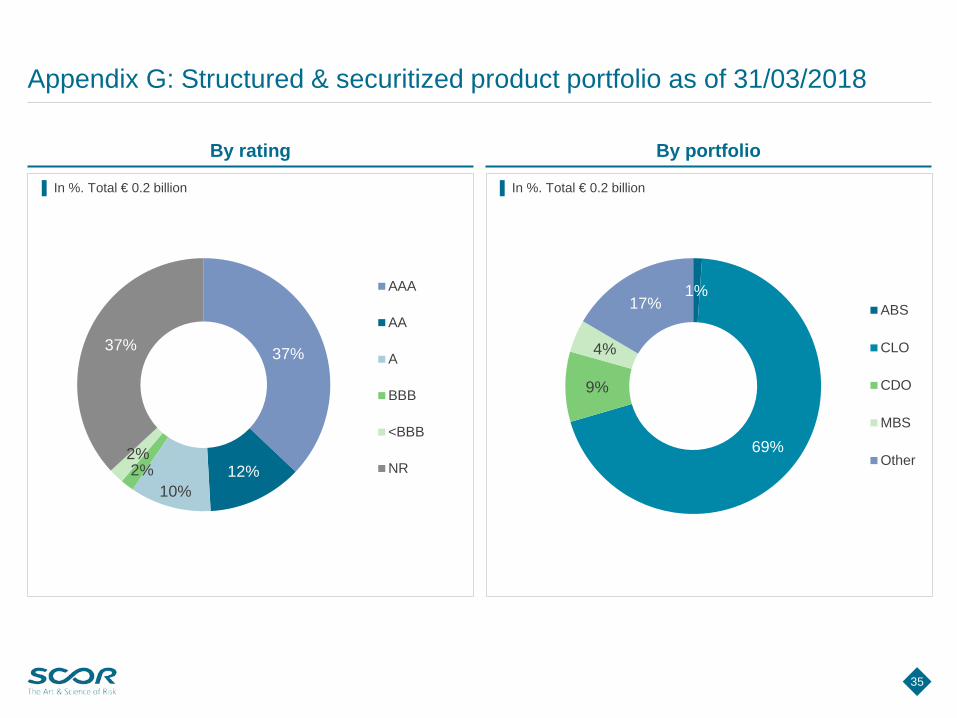
Appendix G: Structured & securitized product portfolio as of 31/03/2018
By rating By portfolio
37%
12%10%
2%2%
37%
AAA
AA
A
BBB
<BBB
NR
1%
69%
9%
4%
17% ABS
CLO
CDO
MBS
Other
▐ In %. Total € 0.2 billion ▐ In %. Total € 0.2 billion

36
Appendix G: Loans, equity, real estate and other investment portfolios as of 31/03/2018
Loans portfolio by underlying assets
Real estate portfolio
Q1 2018
Real estate securities and funds 127
Direct real estate net of debt and including URGL 558
Direct real estate at amortized cost 628
Real estate URGL 155
Real estate debt -225
Total 685
Equity portfolio by underlying assets
Other investments
▐ In € millions (rounded)
5%
62%3%5%
25%
AlternativeinvestmentsNon-listed equities
Infrastructure funds
Private equity funds
Insurance LinkedSecurities (ILS)
61%
36%
3% Common shares
Convertible bonds
Preferred shares
35%
22%
43%
Infrastructure loans
Real estate loans
Corporate andleveraged loans
▐ In %. Total € 0.5 billion
▐ In %. Total € 0.6 billion▐ In %. Total € 0.7 billion

37
Appendix G: Reconciliation of IFRS asset classification to IR presentation as of 31/03/2018
1) Including Atlas cat bonds, Atlas IX mortality bond, derivatives used to hedge US equity-linked annuity book and FX derivatives2) 3rd party gross invested assets (gross of direct real estate debt and direct real estate URGL (mainly MRM))3) Certain consolidated entities held for investment purposes have been included in the scope of Invested Assets in Q3 20174) This relates to purchase of investments in March 2018 with normal settlements in April 20185) Includes real estate financing and relates only to buildings owned for investment purposes
Cash Fixed income Loans Equities Real estate Other
investments
Total invested assets
Funds withheld by cedants & other deposits
Total investments
Accrued interest
Technical items1)
Total IFRS
classification
Real estate investments 701 701 701 701
Equities 1 64 57 385 124 130 761 761 761
Fixed income 15 316 1 073 2 16 391 16 391 131 16 522
Available-for-sale investments 1 15 380 1 130 387 124 130 17 152 17 152 131 17 283
Equities 283 979 1 262 1 262 1 262
Fixed income 0 0 0 0
Investments at fair value through income 0 283 979 1 262 1 262 1 262
Loans and receivables 68 783 3 3 857 8 701 9 558 2 9 560
Derivative instruments 140 140Total insurance business investments 1 15 448 1 913 670 828 1 112 19 972 8 701 28 673 133 140 28 946
Cash and cash equivalents 1 141 1 141 1 141 1 141
Total insurance business investments and cash and cash equivalents
1 142 15 448 1 913 670 828 1 112 21 113 8 701 29 814 133 140 30 087
3rd party gross invested Assets2) -160 -124 -1 179 -50 -73 -858 -2 444 -2 444
Other consolidated entities3) 45 237 282 282
Direct real estate URGL 155 155 155
Direct real estate debt -225 -225 -225 -2255)
Cash payable/receivable4) -19 -19 -19
Total SGI classification 963 15 369 734 620 685 491 18 862 8 701 27 563
▐ In € millions (rounded)

38
Appendix G: Reconciliation of asset revaluation reserve
1) Including short-term investments2) Direct real estate is included in the balance sheet at amortized cost. The unrealized gain on real estate presented here is the
estimated amount that would be included in the balance sheet, were the real estate assets to be carried at fair value3) Includes revaluation reserves (FX on equities AFS)
31/12/2017 31/03/2018 Variance YTDFixed income URGL 14 -205 -219
Government bonds & assimilated1) -21 -27 -6Covered & agency MBS -14 -32 -18Corporate bonds 50 -147 -196Structured products -1 -0 0
Loans URGL 1 1 -0Equities URGL 177 158 -19Real estate URGL 160 163 3
Real estate securities 8 8 0Direct real estate URGL2) 152 155 3
Other investments URGL 5 8 3Invested assets URGL 358 125 -233Less direct real estate investments URGL2) -152 -155 -3URGL on 3rd party insurance business investments 5 1 -3Total insurance business investments URGL 211 -28 -239
Gross asset revaluation reserve 207 -29 -236Deferred taxes on revaluation reserve -48 -2 46Shadow accounting net of deferred taxes 7 76 69Other3) -10 -18 -8
Total asset revaluation reserve 156 27 -129
▐ In € millions (rounded)

39
Appendix H: Debt structure as of 31/03/2018
1) The issue date is the closing of the debt issue i.e. the settlement date
Type Original amount issued Issue date1) Maturity Floating/ fixed
rate Coupon + step-up
Undated subordinatedfixed to floating rate notes PerpNC5.7
CHF 315 million
8 October2012 Perpetual Fixed
Initial rate at 5.25% p.a. until June 8, 2018, floating rate indexed
on the 3-month CHF Libor + 4.8167% margin
Undated subordinatedfixed to floating rate notes PerpNC5.2
CHF 250 million
30 September2013 Perpetual Fixed
Initial rate at 5.00% p.a. until November 30, 2018, floating rate indexed
on the 3-month CHF Libor + 4.0992% margin
Undated subordinated notes PerpNC11
EUR 250 million
1 October2014 Perpetual Fixed
Initial rate at 3.875% p.a. until October 1, 2025, revised every 11 years
at 11-years EUR mid-swap rate + 3.7%
Undated subordinated notes PerpNC6
CHF 125 million
20 October2014 Perpetual Fixed
Initial rate at 3.375% p.a. until October 20, 2020, revised every 6 years
at 6-years CHF mid-swap rate + 3.0275%
Dated subordinated notes 32NC12
EUR 250 million
5 June 2015
32 years2047 Fixed
Initial rate at 3.25% p.a. until June 5, 2027,revised every 10 years at the 10-year
EUR mid-swap rate +3.20%
Dated subordinated notes 30.5NC10
EUR 600million
7 December 2015
30.5 years8 June 2046 Fixed
Initial rate at 3% p.a. until June 8, 2026,revised every 10 years at 10-year
EUR mid-swap rate + 3.25%
Dated subordinated notes 32NC12
EUR 500 million
27 May2016
32 years27 May 2048 Fixed
Initial rate at 3.625% p.a. until May 27, 2028,revised every 10 years at 10-year
EUR mid-swap rate + 3.90%
Restricted Tier 1 subordinated
notes PerpNC11
USD 625 million
13 March 2018 Perpetual Fixed
Initial rate at 5.25% p.a. until March 13, 2029, revised every 5 years at 5-year
U.S. Treasury yield + 2.37%

40
Appendix I: SCOR’s Financial Strength Rating has improved dramatically since 2003
1) Credit watch with positive implications
Secu
re Exce
llent
A+
A
A-
Very
goo
d B++
B+
2003 2004 2005 2006 2007 2008 2009 2010 2011 2012 2013 2014 2015 2016 2017 2018
Secu
reVe
ry
stro
ng
Aa1
Aa2
Aa3
Stro
ng
A1
A2
A3
Goo
d
Baa1
Baa2
Baa3
2003 2004 2005 2006 2007 2008 2009 2010 2011 2012 2013 2014 2015 2016 2017 2018
Secu
reVe
ry
stro
ng
AA+
AA+
AA-
Stro
ng
A+
A+
A-
Goo
d BBB+
BBB+
BBB-Vulnerab
leModerately weak BB+
2003 2004 2005 2006 2007 2008 2009 2010 2011 2012 2013 2014 2015 2016 2017 2018
Secu
reVe
ry
stro
ng
AA+
AA+
AA-
Stro
ng
A+
A+
A-
Goo
d
BBB+
BBB+
BBB-
2003 2004 2005 2006 2007 2008 2009 2010 2011 2012 2013 2014 2015 2016 2017 2018
++
+ +
++
+
+
+
-
X
+
-
+
+-
+ +
+
Revios acquisition (11/06) Converium acquisition (08/07) TaRe acquisition (08/11)
Stable outlook Positive outlook / cwp1)+- Credit watch negative X Issuer Credit Rating to “a+”
Generali US acquisition (10/13)
Fitch rating AM Best rating
AA-Stable Outlook
AA-Stable Outlook
Aa3Stable Outlook
A+Stable Outlook
S&P rating Moody’s rating

41
Appendix J: SCOR’s listing information
Main information
DR Symbol SCRYY
CUSIP 80917Q106
Ratio 10 ADRs: 1 ORD
Country France
Effective Date June 5, 2007
Underlying SEDOL
B1LB9P6
Underlying ISIN FR0010411983
U.S. ISIN US80917Q1067
Depositary BNY Mellon
SCOR’s ADR shares trade on the OTC market
Main information
Valor symbol SCR
Valor number 2'844'943
ISIN FR0010411983
Trading currency CHF
Effective Date August 8, 2007
Security segment Foreign Shares
Main information
Valor symbol SCR
ISIN FR0010411983
Trading currency EUR
Country France
SCOR’s shares are publicly traded on the Eurolist by the Euronext Paris stock market
SCOR’s shares are publicly traded on the SIX Swiss Exchange (formerly known as the SWX Swiss Exchange)
SCOR’s shares are also tradable over the counter on the Frankfurt Stock Exchange
Euronext Paris listing SIX Swiss Exchange listing ADR programme

42
Appendix K: The strength of the SCOR group’s strategy is recognized by industry experts
2015 201820172016
SCOR: ‘‘Best reinsurer in Argentina”
SCOR Global Life: ‘‘Best Life reinsurer of the year’’
Remark International: ‘‘Service Provider of the year’’
SCOR Investment Partners: ‘‘Institutional Investor of the Year’’
Kory Sorenson and Fields Wicker-Miurin, elected ‘‘Influential Women in Insurance’’
SCOR: ‘‘Latin American Reinsurer of the Year’’
SCOR Global Life: ‘‘Reinsurer of the Year 2016’’
Kory Sorenson, Fields Wicker-Miurin, Vanessa Marquette, Marguerite Bérard-Andrieu and Ingrid Carlou, elected ‘‘Influential Women in Insurance’’
SCOR: ‘‘Risk innovation of the year’’
Nicholas Nudo: ‘‘Underwriting Star of the Year’’
SCOR: ‘‘Romanian Reinsurer of the Year’’
SCOR Global Life: ‘‘North American Reinsurer of the Year’’
SCOR: ‘‘Reinsurer of the Year’’
SCOR Global Life: ‘‘North American Reinsurer of the Year’’
SCOR: ‘‘Outstanding contribution to the Romanian insurance industry”
SCOR: “Reinsurer of the Year by InsuranceERM”
SCOR Investment: ‘‘Energy and Ecological Transition for Climate"


![Announces Q1 results [Result]](https://cdn.vdocuments.site/doc/165x107/577cb4121a28aba7118c4992/announces-q1-results-result.jpg)

