
TECHNICAL ANALYSIS
Sándor Bozsik (Ph.D)Miskolc UniversityHungary
EFFICIENT MARKET
In efficient market the NPV of all investment decisions is 0.
Assumptions: Information efficiency Transaction efficiency Allocation efficiencyConsequence: Price movement is a random walk.

TYPES OF EFFICIENT MARKET (FAMA) Weak form
Semi strong form
Strong form
TECHNICAL ANALYSIS – DENIES THE WEAK FORM
The price movement has a trend The history repeats itself The price perfectly reflects the effort of
market forces. The market has got memory. The prices are sticky.

STAGES OF TREND
Accumulation Expansion Dispersion Exhaustion
Discovering with support and resistance lines

METHODS OF TECHNICAL ANALYSIS Graphic tools
Bar chart Japanese candlestick O-X diagram
Statistical tools Moving average, EMA, MACD Momentum, oscillator Market strength, Money Flow Index
Combined tools Fibonacci-lines Bollinger-band Elliott-wave

BAR CHART (MOL)
2000.07.03
2000.07.06
2000.07.11
2000.07.14
2000.07.19
2000.07.24
2000.07.27
2000.08.01
2000.08.04
2000.08.09
2000.08.14
2000.08.17
2000.08.22
2000.08.25
2000.08.30
2000.09.04
2000.09.07
2000.09.12
2000.09.15
2000.09.26
2000.09.29
2000.10.04
2000.10.09
2000.10.12
2000.10.17
2000.10.20
2000.10.26
2000.10.31
2000.11.06
2000.11.09
2000.11.14
2000.11.17
2000.11.22
2000.11.27
2000.11.30
2000.12.05
2000.12.11
2000.12.15
2000.12.20
2000.12.27
0
1000000
2000000
3000000
4000000
5000000
6000000
7000000
8000000
9000000
10000000
3000
3500
4000
4500
5000
5500
6000
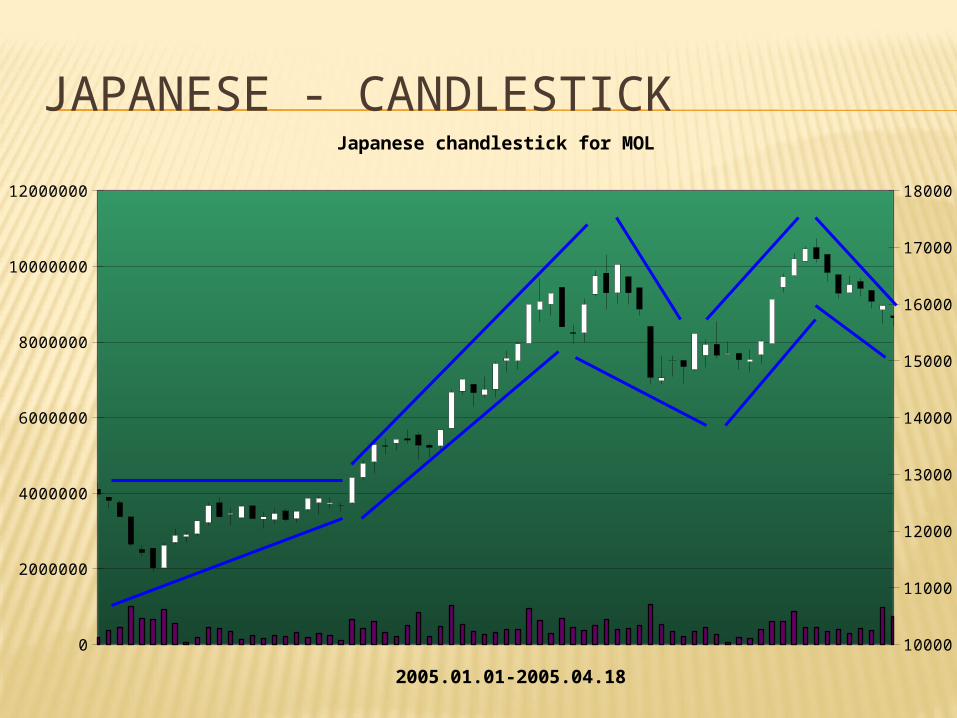
JAPANESE - CANDLESTICK
0
2000000
4000000
6000000
8000000
10000000
12000000
10000
11000
12000
13000
14000
15000
16000
17000
18000
Japanese chandlestick for MOL
2005.01.01-2005.04.18

TRENDS
Trend strengthening forms triangles Channels Mast and flag
Trend changing forms Double peak Saucer Key reversal or inland reversal Head and shoulders Spike

MOVING AVERAGE
Trading rule: if the shorter moving average crosses the longer one below – buying signal, on the contrary – selling signal
Grouping: By term: 3, 7, 14 days Simply, weighted or exponential Direct or Indirect average
The longer is the average, the better follows the trend, the shorter is the average, the quicker gives a signal.

EXPONENTIAL MOVING AVERAGE (EMA) Equation
]1[]1[
][*1
2]1[*
1
21][
XEMA
iXN
iEMAN
iEMA
Stage analysis (Stan Weinstein)Stage 1 – the asset moves in a relative narrow bandStage 2 – developing stage – the asset price increases above the 200 and the 50 days EMA Stage 3 – Peak, the asset price is permanently above the 200 day EMA (profit realisation)Stage 4 – Price drop

TWO DERIVATIVE FROM EMA McClellan oscillator and summary
index Daily breadth – difference between
the number of up-closing and down-closing shares – they are cumulated and an EMA with 10% and 5% adjusting parameter is created. The difference between them is the oscillator.
MACD – Difference between two EMA (12 days and 25 days) Then the 9 days EMA is taken. If it crosses the difference – trading signal.
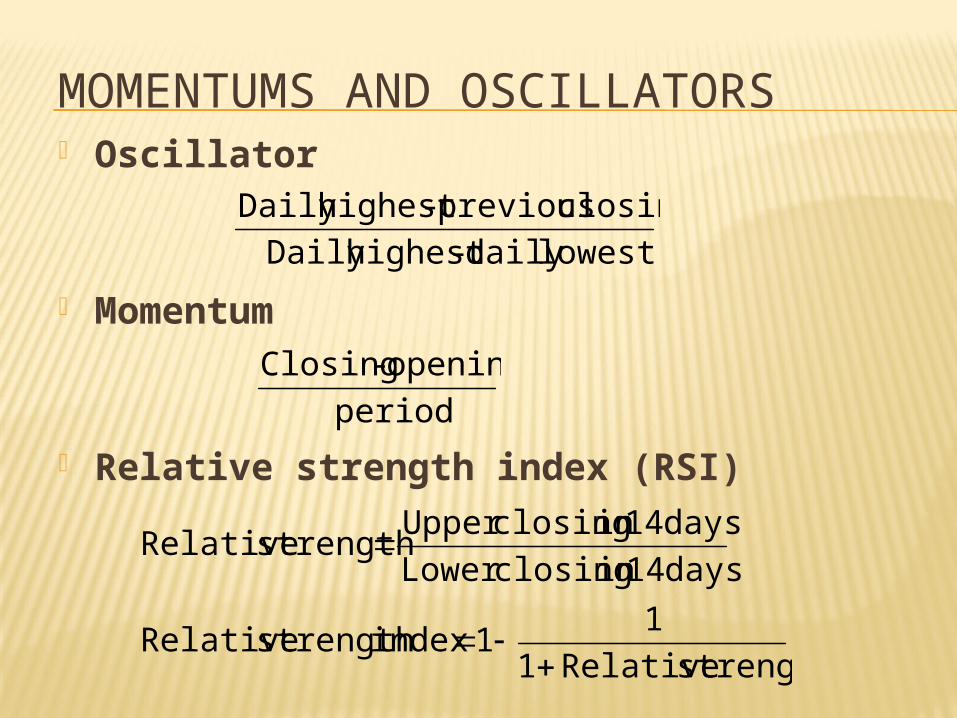
MOMENTUMS AND OSCILLATORS Oscillator
Momentum
Relative strength index (RSI)
lowestdaily -highest Daily
closing previous -highest Daily
period
opening - Closing
strength Relative1
11indexstrength Relative
days 14in closingLower
days 14in closingUpper strength Relative
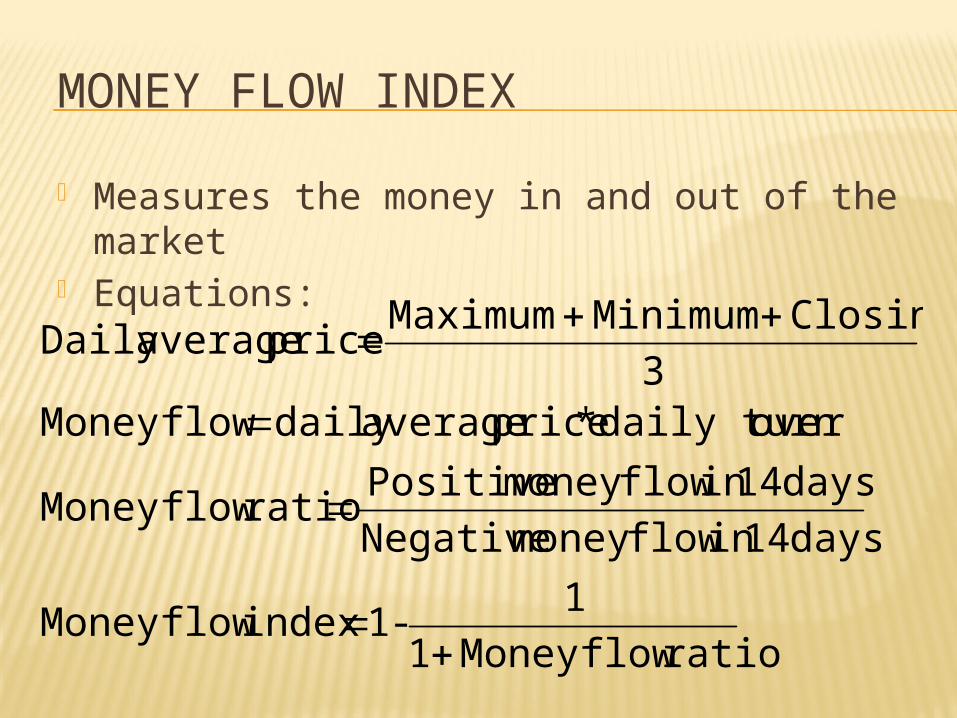
MONEY FLOW INDEX
Measures the money in and out of the market Equations:
ratio flowMoney 1
1-1index flowMoney
days 14in flowmoney Negative
days 14in flowmoney Positiveratio flowMoney
overdaily turn*price averagedaily flowMoney 3
Closing Minimum Maximumprice averageDaily

FIBONACCI NUMBERS
What does it show? – Resistance and support level
fn=fn-1+fn-1
The next figure is 1,618 higher than previous one (gold cut)
From 100% we get the followings: 100%; 61,8%; 38,2%; 23,6%; 14,6%; 9% 100% is the gap between maximum and
minimum price in a given period

FIBONACCI LINE
25 390
0
5 000
10 000
15 000
20 000
25 000
30 000
3/24/200010/8/19994/23/199911/6/19985/22/199812/5/1997
20 271
17 10414 54511 986
8 819
3 700
Richter

BOLLINGER - BAND
difference normal *2 average moving - Band
1difference Normal
2
1
n
ii xx
n
Usage: To determine the eruptionsBased on:• Relative support and resistance• Moving average + standard deviationThe larger is the volatility the larger is the width of band.

APPLYING THE BOLLINGER-BAND
0
20
40
60
80
5 0007 0009 000
11 00013 00015 00017 00019 00021 000
3/27/20001/3/200010/11/19997/19/19994/26/19992/1/199911/9/1998
Richter (záró)20 napos mozgóátlagfelsőalsó
-0,20,00,20,40,60,81,01,2
ASSUMPTION OF BOLLINGER-BAND
Narrowing band projects meaningful change in price
If the price reaches the upper or lower limit, then the trend may go on.
If the price leaves one of the limit, but doesn’t reach the another one, then the current trend continues.
If the price breaks the moving average, then reaches the opposite limit.
The break out of the band is a sign of eruption.

FUNDAMENTAL ANALYSIS

PRINCIPLES OF FUNDAMENTAL ANALYSIS
The market is efficient in weak form, but inefficient in semi-strong form.
Not everybody can evaluate properly the public information.
Analyse the fundamentals to determine the company’s intrinsic value.
Invest in medium or long term.

HOW THE FUNDAMENTAL ANALYSIS WORKS
Find a benchmark (similar company or industry average)
Calculate a market ratio Collect the financial statements,
market projections, data on macroeconomic circumstances
Analyse and compare the results Try to explain the differences in market
ratio
HOW TO CHOOSE PROPER BENCHMARK
Operated in the same industry Located in similar region Similar size Similar financial risk profile

FAMOUS MARKET RATIOS
P/E – Price per earning
Market to book value
P/EBITDA

P/E RATIO
P/E – share price/net income per share
Value of shares:
Usage: manufacturing companies
XXX
XX
DBPV
dE
PEPSP
*
1***
Where:• Px – firm’s share price• EPSX – firm’s earnings per share• P/E* - benchmark’s P/E indicator• d – adjusting factor• DBX – number of share issued• VX – value of equity

MORE SOPHISTICATED METHODS
DCF analysis Real option models


