

Proceedings of IAOE 2018 Technical Symposium
IAOETS 2018
April 29, 2018, Houston, USA
www.iaoeonline.org
Investigation of Touchdown Point Mismatch during Installation for
Catenary Risers
Chaojun Huang a, Guanyu Hu
a, Fengjie Yin
a*
a 2H Offshore Inc., 15990 N Barkers Landing Rd Ste 200, Houston, TX 77079
* Corresponding author. Tel.: +1-281-258-2000; e-mail: [email protected]
ABSTRACT
Meeting the touchdown point (TDP) target box is one of the challenges during catenary riser
installation, especially for deep water or ultra-deep water riser systems. TDP location mismatch
compared to the design can result in variation of riser configuration, additional hang-off
misalignment, and extra bending loads going into the hang-off porch. A good understanding of
the key installation parameters can help to minimize this mismatch, and ensure that the riser
global response meets the design criteria.
This paper focuses on investigating the potential factors that may affect the touchdown point
location, and addressing the challenges both in the design stage and during installation campaign.
Conventionally, the vessel offset and current are the most critical factors which may affect the
TDP movement during installation. With the offshore exploration going deeper and deeper in the
sea (up to 10,000ft), other sources such as the seabed slope and seabed soil stiffness are playing
an important role as well. The impacts of potential sources are quantified through case studies for
steel catenary riser (SCR) and lazy wave steel catenary riser (LWSCR) in deep water application.
Investigations through both theoretical study and numerical validation are carried out.
Furthermore, design recommendations are provided during execution phase for the TDP
mismatch condition to ensure the integrity of the riser system.
Keywords: TDP, Target box, SCR, LWSCR, Misalignment, Mismatch, Installation, Deep water,
Integrity.
1 Introduction
Risers are among the most important components of offshore oil and gas platforms. Risers are
the conduits between the subsea wellhead and the drilling or production platform for
development, production, gas lift or water injection purposes. Catenary riser configuration is the
most popular riser configuration for deepwater oil production beyond 1000 meter water depth,
either in pure catenary shape or lazy wave catenary shape.
All global analyses for subsea risers in catenary shape are normally conducted for the designed
configuration. A target box of the touchdown point (TDP) is typically specified for the subsea
Learn more at www.2hoffshore.com

2 Proceedings of IAOE 2017 2nd Technical Symposium
installation contractor to meet the tolerance of design configuration during installation. However,
it is one of the biggest challenges to meet the TDP target box during catenary riser installation,
especially for deep water or ultra-deep water riser systems. Various factors can impact the riser
configuration during riser installation stage. It is very possible to miss the TDP target box during
a severe environmental event, such as loop currents.
Missing the TDP target box may result in unexpected system failure without further evaluation
of the new riser configuration. It is very important to find the source causing the TDP mismatch
and root out the permanent TDP mismatch, which may cause system failure. This paper focuses
on evaluating the potential sources for TDP mismatch through both theoretical study using
catenary equations and numerical validation using finite element software.
2 Catenary Equation and Typical Catenary Riser Configurations
Though deepwater risers are usually made of steel and have very large bending stiffness, their
bending stiffness can be ignored when calculating the static configuration due to their large
aspect ratio. The static configuration of a steel catenary (SCR) riser can be simplified as the
catenary function shown in Fig.1 and equation 1.
Fig. 1 Catenary Equations
𝑆 = 𝑎 tan𝜃
𝑥 = 𝑎 ln(sec 𝜃 + tan𝜃) (1)
𝑦 = 𝑎 sec 𝜃
Where:
S is the arc length from the origin
(0, a) to P1 (x, y);
θ is defined as the tangential slope
angle at a point (P1);
a is defined as the catenary shape
parameter.
2.1 Catenary Riser Configuration
For a typical SCR configuration shown in Fig. 2, the hang-off angle (top departure angle) of
(90°-θ1) and the height (Y) between hang-off point and seabed are usually known. The TDP to
X
Y
Origin (0, a)
θ
P1 (x, y)
= ( ) + ( )
= ( )
Learn more at www.2hoffshore.com

Proceedings of IAOE 2017 2nd Technical Symposium 3
hang-off distance X is defined as the (X1-X2). Taking all the known parameters into equation 1,
the suspended length (S) and TDP to hang-Off horizontal distance (X) of SCR can be calculated
by solving the following equations assuming rigid seabed.
𝑋 = 𝑋1 − 𝑋2 = 𝑎 𝑙𝑛(sec 𝜃1 + tan 𝜃1) − 𝑙𝑛(sec 𝜃2 + tan𝜃2) (2)
𝑌 = 𝑌1 − 𝑌2 = 𝑎(sec 𝜃1 − sec 𝜃2)
where 𝜃2 is the seabed slope, can be positive and negative. It is 0 for flat seabed. Friction is
ignored in a sloped seabed condition.
Fig. 2 Typical Catenary Riser Configurations
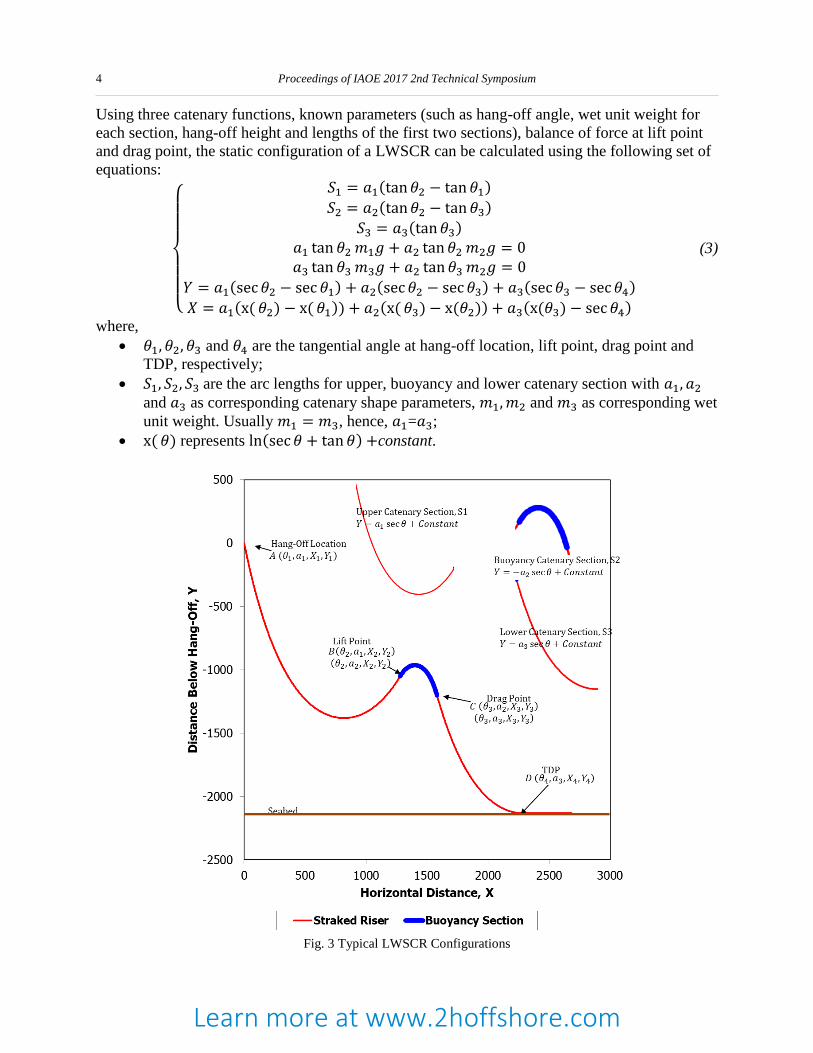
2.2 Lazy Wave Catenary Riser Configuration
For a typical lazy wave SCR (LWSCR) configuration shown in Fig. 3, the static configuration
can be separated into three catenary sections:
Upper catenary section (S1): defined from hang-off to start of the buoyancy section. It
is a regular catenary function with a shifting of origin;
Buoyancy catenary section (S2): defined from the start of buoyancy section to the end
of buoyancy section. It is an upside-down catenary function (due to uplift force direction)
with a shift of origin;
Lower catenary section (S3): defined from end of buoyancy section to TDP. It is the
same as a regular SCR.
Learn more at www.2hoffshore.com
4 Proceedings of IAOE 2017 2nd Technical Symposium
Using three catenary functions, known parameters (such as hang-off angle, wet unit weight for
each section, hang-off height and lengths of the first two sections), balance of force at lift point
and drag point, the static configuration of a LWSCR can be calculated using the following set of
equations:
{
𝑆1 = 𝑎1(tan𝜃2 − tan𝜃1)
𝑆2 = 𝑎2(tan𝜃2 − tan𝜃3)
𝑆3 = 𝑎3(tan𝜃3)
𝑎1 tan 𝜃2 𝑚1𝑔 + 𝑎2 tan 𝜃2 𝑚2𝑔 = 0𝑎3 tan 𝜃3 𝑚3𝑔 + 𝑎2 tan 𝜃3 𝑚2𝑔 = 0
𝑌 = 𝑎1(sec 𝜃2 − sec 𝜃1) + 𝑎2(sec 𝜃2 − sec 𝜃3) + 𝑎3(sec 𝜃3 − sec 𝜃4)
𝑋 = 𝑎1(x( 𝜃2) − x( 𝜃1)) + 𝑎2(x( 𝜃3) − x(𝜃2)) + 𝑎3(x(𝜃3) − sec 𝜃4)
(3)
where,
𝜃1, 𝜃2, 𝜃3 and 𝜃4 are the tangential angle at hang-off location, lift point, drag point and
TDP, respectively;
𝑆1, 𝑆2, 𝑆3 are the arc lengths for upper, buoyancy and lower catenary section with 𝑎1, 𝑎2
and 𝑎3 as corresponding catenary shape parameters, 𝑚1, 𝑚2 and 𝑚3 as corresponding wet
unit weight. Usually 𝑚1 = 𝑚3, hence, 𝑎1=𝑎3;
x( 𝜃) represents ln(sec 𝜃 + tan𝜃) +constant.
Fig. 3 Typical LWSCR Configurations
Learn more at www.2hoffshore.com

Proceedings of IAOE 2017 2nd Technical Symposium 5
3 Critical Factors for TDP Locations
Based on the equations for SCR and LWSCR, other than installation errors, the critical factors
which can impact the TDP locations include vessel offset, bottom current during installation,
seabed properties, riser wet weight and buoyancy uplift.
3.1 Vessel Offset
Vessel position has a large impact on the configuration of riser, thus on the TDP locations.
Vessel offset is usually controlled to be small during riser installation. However, under the
combined wind, current and wave loading, some vessel offsets are expected.
At a far vessel offset, the TDP will move away from the vessel while at a near offset, the TDP
will move towards the vessel. For lazy wave riser, the same amount of vessel offset will cause
less TDP movement than SCR due to the fact that the buoyancy arch section can compensate
quite a lot of vessel motion.
Fig. 4 Variation of Lazy Wave Configuration with Vessel Offsets
3.2 Bottom Current
The TDP location is typically not sensitive to current loading directly acting on riser itself,
especially if it is a near surface current. However, for bottom current, the impact on lower part of
the catenary shape can be significant. In addition, monitoring the direction and magnitude of
bottom current is much more difficult than surface current during riser installation. Ignoring the
impact of bottom current can also lead to TDP mismatch. For a lazy wave riser which has the
Learn more at www.2hoffshore.com

6 Proceedings of IAOE 2017 2nd Technical Symposium
buoyancy section near bottom, the impact of bottom current can be significantly more
pronounced than SCRs.
3.3 Seabed Properties
3.3.1 Seabed Slope/Profile
In riser analysis, for simplicity, a horizontal flat seabed is mostly assumed. However, in real
world the seabed profile from survey data can be very complicated, and the seabed slope can be
quite large. The configuration of lower part of catenary shape is controlled by the seabed
slope/profile, so the TDP location is largely impacted by the seabed slope/profile. Although
seabed survey is usually conducted before riser installation, the detailed profile at local riser
touch down zone is typically not considered in current industry practice for installation analysis,
and can thus lead to TDP location mismatch.
3.3.2 Seabed Stiffness
The seabed stiffness also impacts the TDP location, especially when the stiffness changes from
very high stiffness to very low stiffness. The stiffness is essentially affecting the tangential slope
of the TDP as shown in Fig. 5.
Fig. 5 Pipe-Soil Interact Schematic
3.4 Riser Wet Weight and Buoyancy Uplift Force
Riser wet weight is not included in the SCR catenary equations (1) and (2). Hence, it should not
impact the TDP location. On the other hand, the wet weight and buoyancy uplift force are
included in the LWSCR catenary equations (3). It is expected that TDP moves near to vessel
when either increasing the riser wet weight or reducing the buoyancy uplift force.
Learn more at www.2hoffshore.com
Proceedings of IAOE 2017 2nd Technical Symposium 7
4 Numerical Validation
To quantify the impact of each potential factor to the TDP location of catenary risers, numerical
validation using FEA software, OrcaFlex, is conducted for a generalized project with SCR and
LWSCR configuration options. For the case with vessel offsets, the suspended catenary lengths
and corresponding projected horizontal lengths from theoretical equations are also provided.
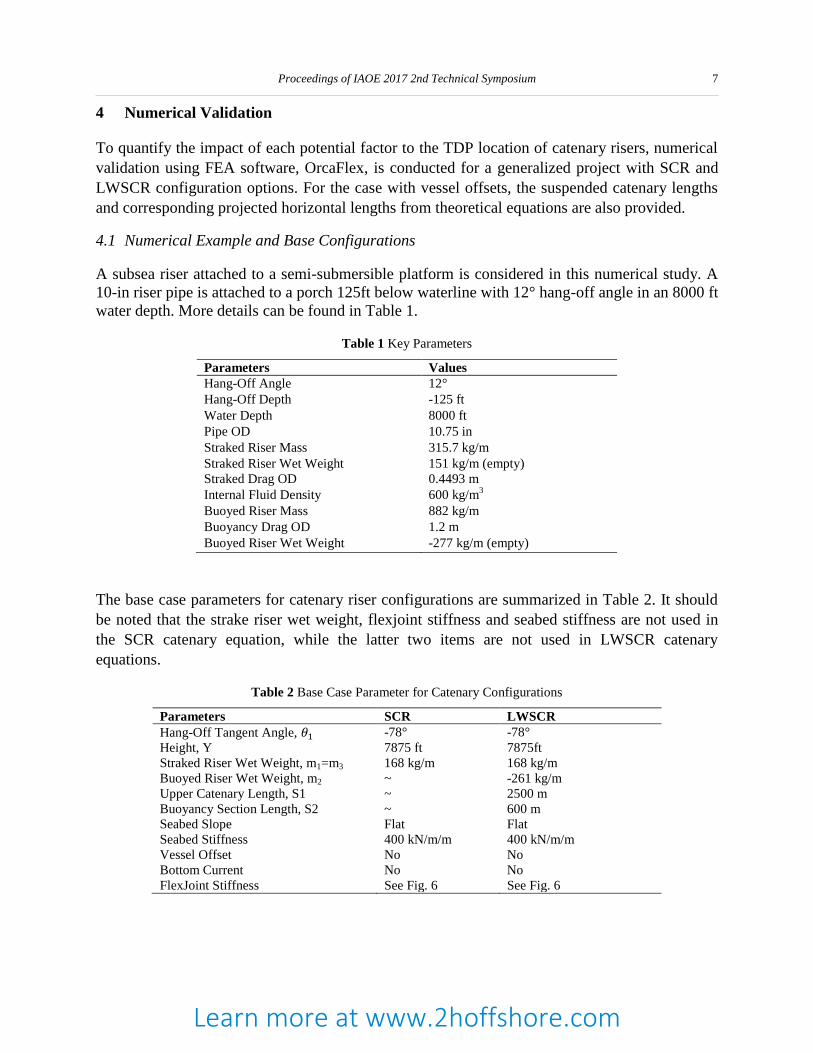
4.1 Numerical Example and Base Configurations
A subsea riser attached to a semi-submersible platform is considered in this numerical study. A
10-in riser pipe is attached to a porch 125ft below waterline with 12° hang-off angle in an 8000 ft
water depth. More details can be found in Table 1.
Table 1 Key Parameters
Parameters Values
Hang-Off Angle 12°
Hang-Off Depth -125 ft
Water Depth 8000 ft
Pipe OD 10.75 in
Straked Riser Mass 315.7 kg/m
Straked Riser Wet Weight 151 kg/m (empty)
Straked Drag OD 0.4493 m
Internal Fluid Density 600 kg/m3
Buoyed Riser Mass 882 kg/m
Buoyancy Drag OD 1.2 m
Buoyed Riser Wet Weight -277 kg/m (empty)
The base case parameters for catenary riser configurations are summarized in Table 2. It should
be noted that the strake riser wet weight, flexjoint stiffness and seabed stiffness are not used in
the SCR catenary equation, while the latter two items are not used in LWSCR catenary
equations.
Table 2 Base Case Parameter for Catenary Configurations
Parameters SCR LWSCR
Hang-Off Tangent Angle, 𝜃1 -78° -78°
Height, Y 7875 ft 7875ft
Straked Riser Wet Weight, m1=m3 168 kg/m 168 kg/m
Buoyed Riser Wet Weight, m2 ~ -261 kg/m
Upper Catenary Length, S1 ~ 2500 m
Buoyancy Section Length, S2 ~ 600 m
Seabed Slope Flat Flat
Seabed Stiffness 400 kN/m/m 400 kN/m/m
Vessel Offset No No
Bottom Current No No
FlexJoint Stiffness See Fig. 6 See Fig. 6
Learn more at www.2hoffshore.com

8 Proceedings of IAOE 2017 2nd Technical Symposium
Fig. 6 FlexJoint Rotational Stiffness
The base configurations for SCR and LWSCR using the parameters in Table 2 are shown in
Fig.7. The total suspended lengths (S) and projected horizontal lengths (X) from FEA and
catenary equations are summarized in Table 3.
Table 3 Catenary Configurations
Parameters From FEA From Catenary Equations
Hang-Off Tangent Angle, 𝜃1 78° 78°
Height, Y 7875 ft 7875ft
SCR, Total Suspended Length, S 2963.49 m 2964.12 m
SCR, Horizontal Projected Length, X 1419.56m 1419.36 m
LWSCR, Total Suspended Length, S 3819.0m 3816.9
LWSCR, Horizontal Projected Length, X 2382.52 m 2380.28
Fig. 7 Base Configurations for SCR and LWSCR
-2500
-2000
-1500
-1000
-500
0
0 500 1000 1500 2000 2500
Ve
rtic
al
Dis
tan
ce
to
Wa
terl
ine
, Y
(m
)
Horizontal Distance to Hang-Off, X (m)
LWSCR SCR
Learn more at www.2hoffshore.com

Proceedings of IAOE 2017 2nd Technical Symposium 9
4.2 Vessel Offsets
In the riser installation stage, the offshore platform can offset in the environmental direction due
to environmental loading. In this study, vessel offset in the near and far direction is considered
from -5% (Far) to +5% (Near) of water depth. The results from both FEA and equations are
summarized in the following table.
Table 4 TDP Horizontal Coordinates with Various Vessel Offsets
Vessel Offset SCR, m LWSCR, m
% of WD, 8000 ft FEA FEA
Change Equations
Equations
Change FEA
FEA
Change Equations
Equations
Change
-5% (-121.92 m) 1592.43 172.87 1592.46 173.1 2435.5 52.98 2434.08 53.8
-4% (-97.54 m) 1554.46 134.9 1554.91 135.55 2422.5 39.98 2421.54 41.26
-3% (-73.15 m) 1518.48 98.92 1518.9 99.54 2411.51 28.99 2409.9 29.62
-2% (-48.77 m) 1484.51 64.95 1484.35 64.99 2400.51 17.99 2399.24 18.96
-1% (-24.38 m) 1451.54 31.98 1451.19 31.83 2391.52 9 2389.4 9.12
0 1419.56 0 1419.36 0 2382.52 0 2380.28 0
+1% (+24.38 m) 1389.59 -29.97 1388.81 -30.55 2374.52 -8 2371.82 -8.46
+2% (+48.77 m) 1360.62 -58.94 1359.46 -59.9 2366.53 -15.99 2363.96 -16.32
+3% (+73.15 m) 1332.64 -86.92 1331.28 -88.08 2359.53 -22.99 2356.65 -23.63
+4% (+97.54 m) 1305.67 -113.89 1304.22 -115.14 2352.53 -29.99 2349.83 -30.45
+5% (+121.92 m) 1281.69 -137.87 1278.22 -141.14 2346.54 -35.98 2343.49 -36.79
Based on the results in Table 4, the SCR TDP positions from both FEA and equation calculation
move almost the same distance as vessel offset when vessel moves in near direction, while the
SCR TDP moves almost 1.5 times the vessel offset when vessel moves in far direction. On the
other hand, the TDP movement for LWSCR due to vessel offset is not as sensitive to the top
vessel offset as SCR due to the decoupling effect from the buoyancy section.
4.3 Bottom Current
In-plane bottom current profile (see Fig. 8) is applied to the base configuration. The amplitude
varies from -100% to +100% with 20% increment. The TDP coordinates results are summarized
in Table 5, which indicate both riser systems are susceptible to bottom current. And their TDPs
move in the opposite direction when facing the same current. For this specific bottom current
profile, TDP of SCR configuration is more sensitive than LWSCR.
Learn more at www.2hoffshore.com

10 Proceedings of IAOE 2017 2nd Technical Symposium
Fig. 8 Bottom Current Profile
Table 5 TDP Horizontal Coordinates with Various Bottom Currents
Bottom Current Speed, % SCR, m Change, m LWSCR, m Change, m
-100% 1383.6 -35.96 2394.53 12.01
-80% 1396.59 -22.97 2389.53 7.01
-60% 1406.58 -12.98 2386.52 4
-40% 1414.57 -4.99 2384.52 2
-20% 1418.57 -0.99 2382.52 0
No Current 1419.56 0.00 2382.52 0
20% 1421.56 2.00 2381.52 -1
40% 1425.56 6.00 2380.52 -2
60% 1432.55 12.99 2378.52 -4
80% 1442.54 22.98 2376.51 -6.01
100% 1454.53 34.97 2373.51 -9.01
4.4 Seabed Properties
4.4.1 Seabed Slope
Seabed slopes from -4° to +4° with 1° increment are considered in the analysis. The results are
summarized in Table 6. The impact of seabed slope on the TDP locations are more severe in the
SCR configuration comparing to the LWSCR configuration. This can be explained as the vertical
length difference (SCR 7875 ft vs. LWSCR Lower 1241 ft) and hang-off tangential angle (SCR
78° vs. LWSCR Lower 55.6°) between SCR and the lower catenary of LWSCR. In another word,
for deeper water depths and larger hang-off tangential angles, the impact of the seabed slope will
be larger.
Table 6 TDP Horizontal Coordinates with Various Seabed Slope
Seabed Slope, ° SCR, m Change, m LWSCR, m Change, m
-4 1377.33 -42.23 2385.22 2.7
-3 1387.55 -32.01 2383.48 0.96
-2 1398 -21.56 2382.95 0.43
-1 1408.68 -10.88 2382.63 0.11
0 1419.56 0 2382.52 0
1 1430.66 11.1 2382.62 0.1
2 1441.94 22.38 2382.94 0.42
3 1452.41 32.85 2384.47 1.95
Learn more at www.2hoffshore.com

Proceedings of IAOE 2017 2nd Technical Symposium 11
4.4.2 Seabed Stiffness
Seabed stiffnesses from 50 kN/m/m to 1300 kN/m/m are considered in this study. The results of
the TDP coordinates are summarized in Table 7. The impact of seabed stiffness on TDP
coordinates is slightly more severe for SCR configuration than LWSCR configuration though
both are not that sensitive for analyzed cases. There is a trend that TDP locations are more
sensitive when the soil stiffness is smaller.
Table 7 TDP Horizontal Coordinates with Various Seabed Stiffness
Seabed Stiffness,
kN/m/m SCR, m Change, m LWSCR, m Change, m
50 1415.57 -3.99 2378.52 -4
100 1417.57 -1.99 2380.52 -2
200 1418.57 -0.99 2381.52 -1
400 1419.56 0 2382.52 0
800 1420.56 1 2383.52 1
1300 1421.56 2 2383.52 1
4.5 Riser Wet Weight and Buoyancy Uplift Force
The changes of riser wet weight change and buoyancy uplift force are realized by changing the
steel pipe in-air mass and buoyed section in-air mass by -5% to +5% with 1% increment. The
results are summarized in Table 8. As predicted, there is almost no impact on SCR TDP location
when varying the steel mass. On the other hand, LWSCR is very sensitive to both the riser wet
weight and buoyancy uplift force change.
Table 8 TDP Horizontal Coordinates with Various Vessel Offsets
Steel Mass SCR, m LWSCR, m
or Buoyed
Section Mass Steel Mass Change Steel Mass Change Buoy Mass Buoy Mass
-5% 1420.57 1.01 2445.52 64 2486.5 104.98
-4% 1420.57 1.01 2431.52 50 2465.51 83.99
-3% 1420.57 1.01 2419.52 38 2445.52 64
-2% 1420.57 1.01 2405.52 24 2423.52 42
-1% 1419.57 0.01 2393.52 12 2403.52 22
0 1419.56 0 2381.52 0 2381.52 0
1% 1419.56 0 2369.52 -12 2361.52 -20
2% 1419.56 0 2359.52 -22 2339.52 -42
3% 1419.56 0 2349.52 -32 2319.52 -62
4% 1419.56 0 2339.52 -42 2299.52 -82
5% 1419.56 0 2329.52 -52 2279.52 -102
Learn more at www.2hoffshore.com

12 Proceedings of IAOE 2017 2nd Technical Symposium
5 Conclusions and Recommendations
Theoretical equations have been discussed for both SCR and LWSCR configurations. Numerical
validation has been conducted for the catenary riser configurations. Sensitivity studies for each
critical factor towards the TDP location of catenary riser are conducted to quantify their impacts.
The key conclusions for SCR configuration are:
The TDP moves along with vessel offset: 1.5 times in the far direction and almost the
same length in the near direction;
The impact of bottom current on TDP location is not a linear effect. The larger the
current is, the larger displacement the TDP will move;
Seabed slope has large impact on SCR TDP locations; Seabed stiffness can also impact
the TDP locations when large stiffness is used while the measured results are very small;
Riser weight has neglect effect on SCR TDP locations.
The key conclusions for LWSCR configurations are:
The TDP moves along with vessel offset but not as sensitive as the SCR configuration
because the separation effect of buoyancy section: less than half of the vessel offset;
For the analyzed in-plane bottom current profile and LWSCR configuration, the TDP
location is not that sensitive. However, it can be more sensitive for different current
profile or different direction of the currents;
Seabed slope and seabed stiffness has much smaller impact on LWSCR TDP location
than that of SCR;
The riser wet weight and buoyancy uplift force has very significant impact on LWSCR
configuration and its TDP locations.
A few recommendations based on the analysis are listed below:
If the key contributor to the TDP mismatch is vessel offset or current, no additional work
is needed. As vessel offsets and bottom currents can be a short time event, the TDP
location will move back to the designed location in the long term;
In the global analysis for riser design, usually flat seabed is used. However, when
creating the general arrangement (GA) drawings, modeling the seabed profile and correct
seabed stiffness in the FEA are strongly recommended; If seabed stiffness for installation
is not available, the value used in the GA drawing model should be added as notes in the
drawing;
If riser weight or buoyancy uplift force deviates from the design data after installation for
LWSCR configuration, re-evaluation of the as-built configuration is strongly
recommended since the lazy wave shape change can change the TDP fatigue
performance.
Learn more at www.2hoffshore.com

Proceedings of IAOE 2017 2nd Technical Symposium 13
References
Huang, C. (2012). Structural Health Monitoring System for Deepwater Risers with Vortex-induced
Vibration: Nonlinear Modeling, Blind Identification, Fatigue/Damage Estimation and Vibration
Control. (Doctoral dissertation). Rice University, Houston, Texas.
Huang, C. & Nagarajaiah, S. (2014). Output-only structural health monitoring for deepwater risers:
Experimental study of wavelet Modified SOBI and distributed force index algorithm. International
Journal of Structural Stability and Dynamics.
Hu, G., & Campbell, M. & Huang. C (2014). Dynamic Plastic Deformation of Deepwater Steel Catenary
Risers under Extreme Cyclic Compressive Loading. Oil and Gas Facilities.
Li, S. & Nyuen, C. (2010). Dynamic Response of Deepwater Lazy-Wave Catenary Riser. Deep Offshore
Technology International, Amsterdam, Netherlands.
Orcina ltd. (2018). OrcaFlex 10.2a. https://www.orcina.com/Resources/index.php.
Biographies
Chaojun Huang is an Engineering Specialist at 2H Offshore Inc. He received his BS and MS
degrees in civil engineering from the Tsinghua University in 2004 and 2007, respectively, and
his PhD degree in civil engineering from the Rice University in 2012. His current research
interests include subsea technology, structural health monitoring, and vibration control.
Guanyu Hu is a Principal Engineer at 2H Offshore Inc. He received his BS degrees in civil
engineering from Zhejiang University in 2001, and his PhD degree in structural engineering from
The University of Texas at Austin in 2010. His current research interests include linear & non-
linear stress-strain analysis, complex fluid structural interaction and pipe soil interaction
analysis.
Fengjie Yin works at 2H Offshore as a senior engineering specialist. Dr. Yin received her PhD
in Mechanical Engineering from fatigue and fracture research lab of University of Toledo in
2006 and BS in Mechanical Engineering from Tsinghua University in Beijing, China. She
received SAE International’s Henry O. Fuchs Student Award in 2006, which recognizes a
graduate student for the excellent work in the field of fatigue research and applications. Since
then she has joined 2H Offshore and worked / managed on various projects covering feasibility,
pre-FEED / FEED, detailed engineering, and third part verification (CVA) phases of riser design
and analysis. One of her specialties is fatigue and fracture mechanics assessment of offshore
risers, titanium taper stress joints, and pipelines. Dr. Yin is an active committee member of ASM
Houston Chapter, API 17G, OTC / MTS Subcommittee, and a member of IAOE.
Learn more at www.2hoffshore.com


