Sample Expansion for Transit Rider Surveys
Experiments with Two Rail Systems

2
Motivations
• FTA requirements for rider surveys– Model validation for major-project forecasting– “Before” and “After” rider surveys for projects
• Frequently asked questions:– What is best practice for sample expansion?– Are special on-to-off “surveys” worth the effort?
3
Motivations (continued)
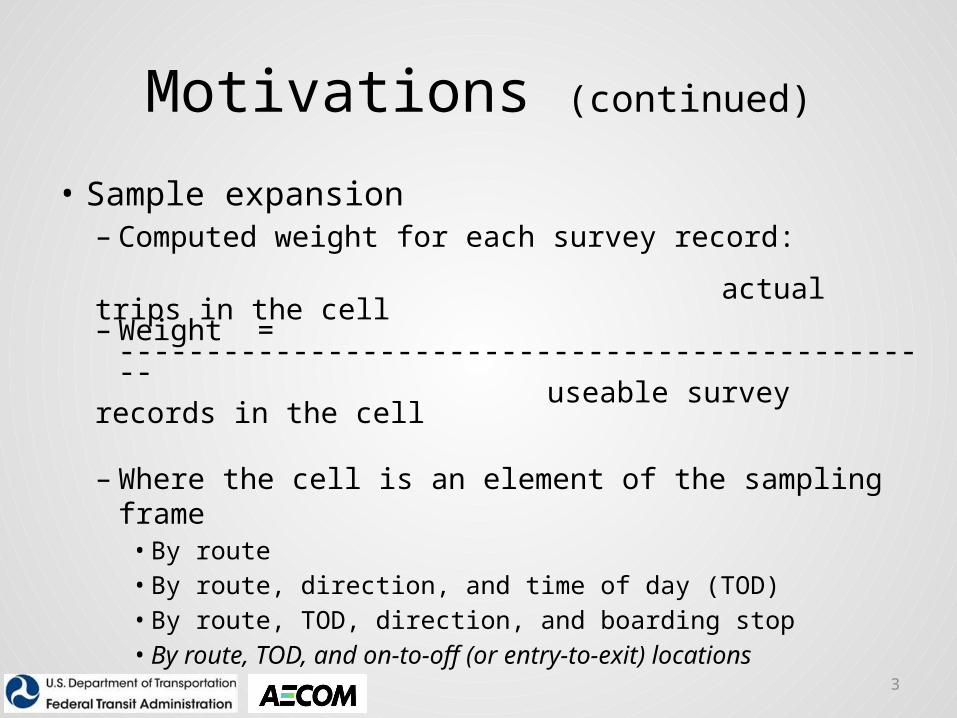
• Sample expansion– Computed weight for each survey record:
actual trips in the cell– Weight = ------------------------------------------------ useable survey records in the cell
– Where the cell is an element of the sampling frame• By route• By route, direction, and time of day (TOD)• By route, TOD, direction, and boarding stop• By route, TOD, and on-to-off (or entry-to-exit) locations
4
Experimental design
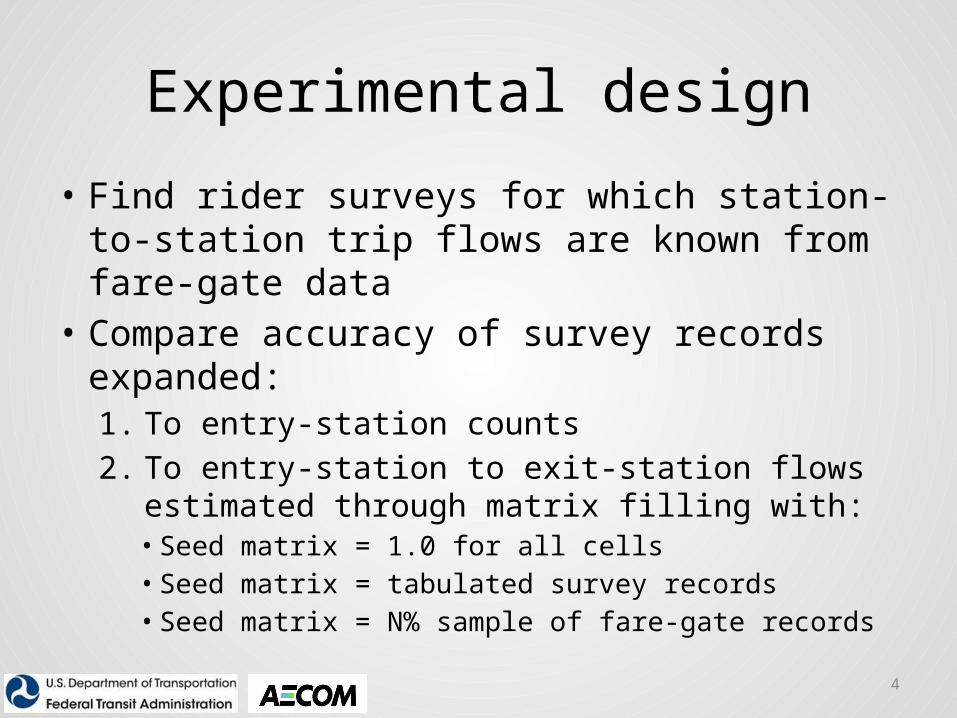
• Find rider surveys for which station-to-station trip flows are known from fare-gate data
• Compare accuracy of survey records expanded:1. To entry-station counts2. To entry-station to exit-station flows estimated
through matrix filling with:• Seed matrix = 1.0 for all cells• Seed matrix = tabulated survey records• Seed matrix = N% sample of fare-gate records
5
Survey datasets
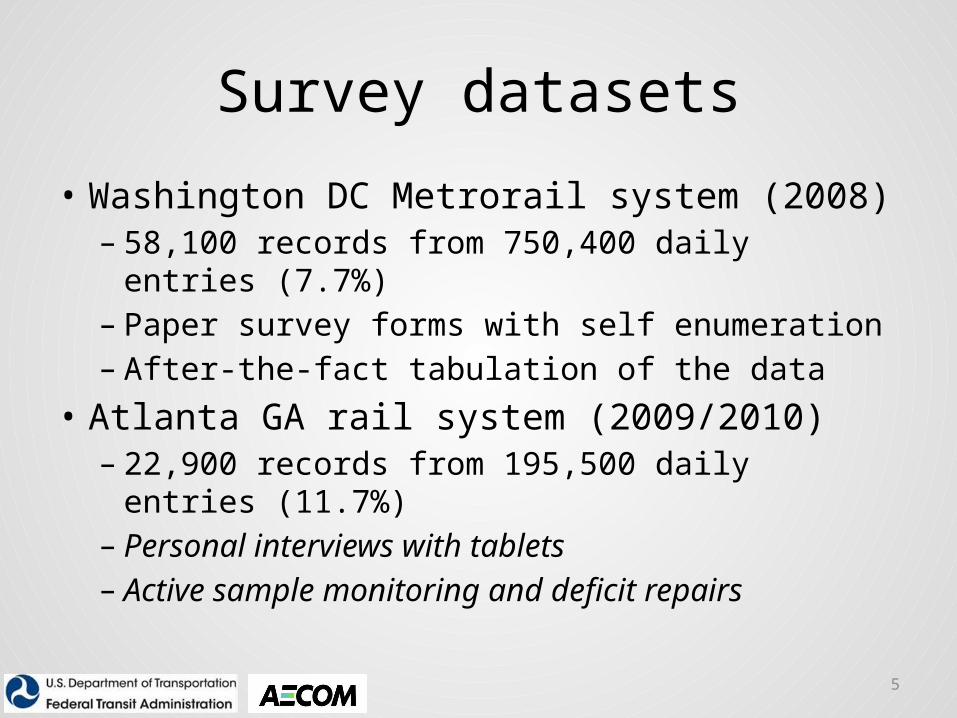
• Washington DC Metrorail system (2008)– 58,100 records from 750,400 daily entries (7.7%)– Paper survey forms with self enumeration– After-the-fact tabulation of the data
• Atlanta GA rail system (2009/2010)– 22,900 records from 195,500 daily entries (11.7%)– Personal interviews with tablets– Active sample monitoring and deficit repairs
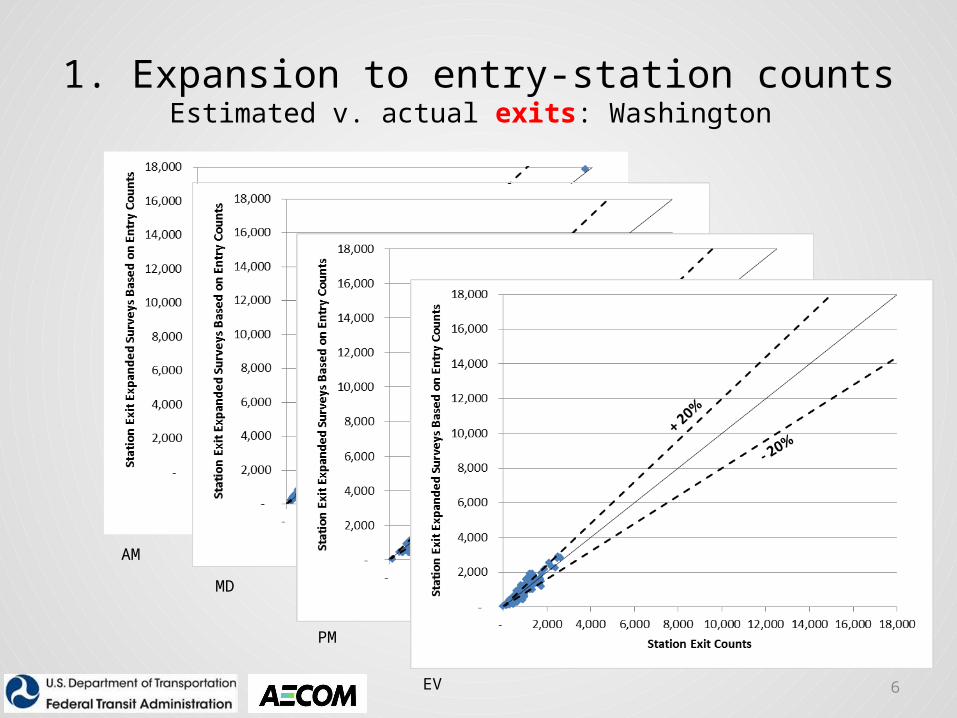
1. Expansion to entry-station countsEstimated v. actual exits: Washington
6
AM
MD
PM
EV
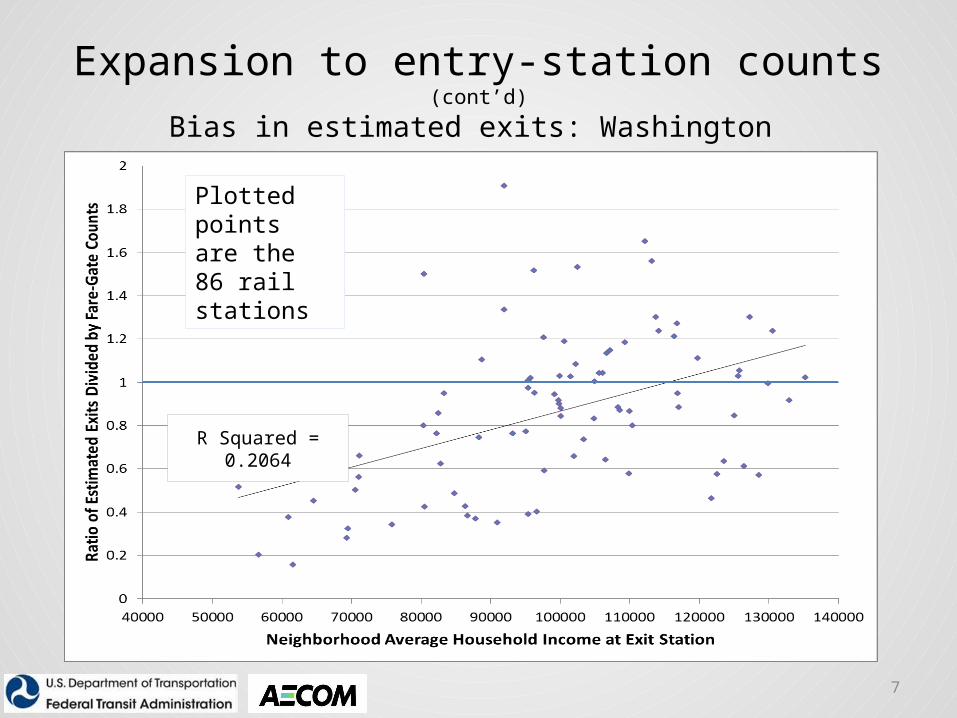
Expansion to entry-station counts (cont’d)
Bias in estimated exits: Washington
7
Plotted points are the 86 rail stations
R Squared = 0.2064
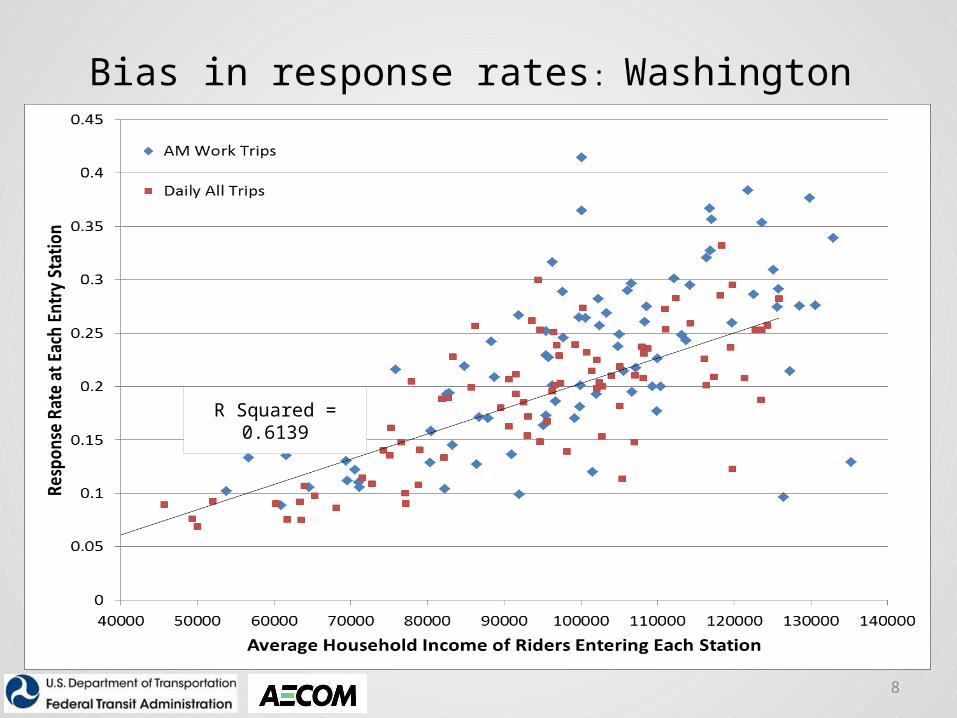
Bias in response rates: Washington
8
R Squared = 0.6139
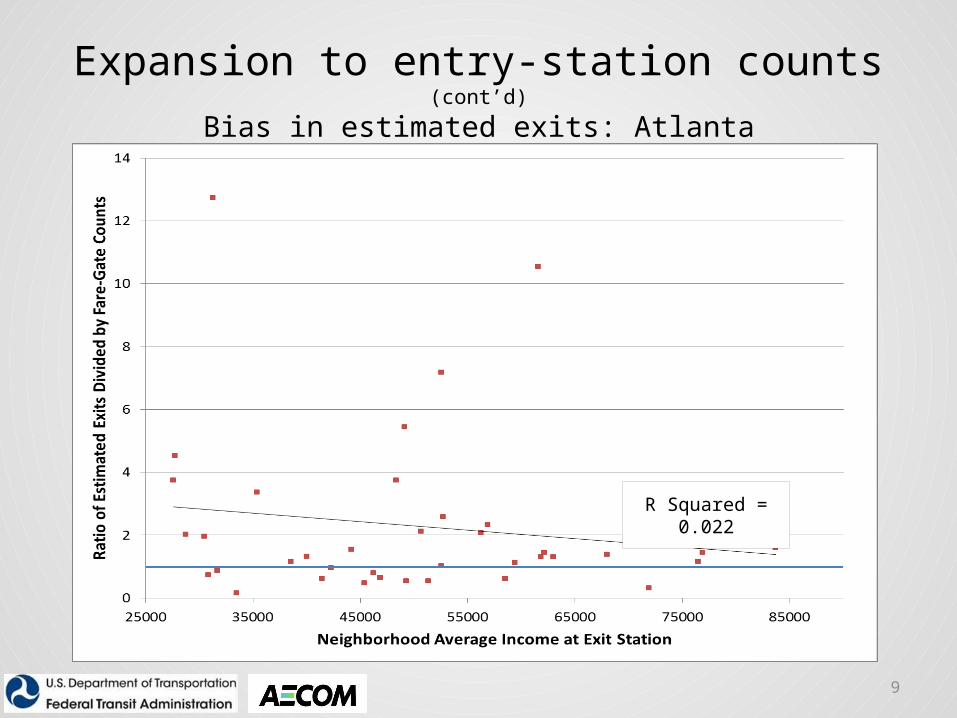
Expansion to entry-station counts (cont’d)
Bias in estimated exits: Atlanta
9
R Squared = 0.022
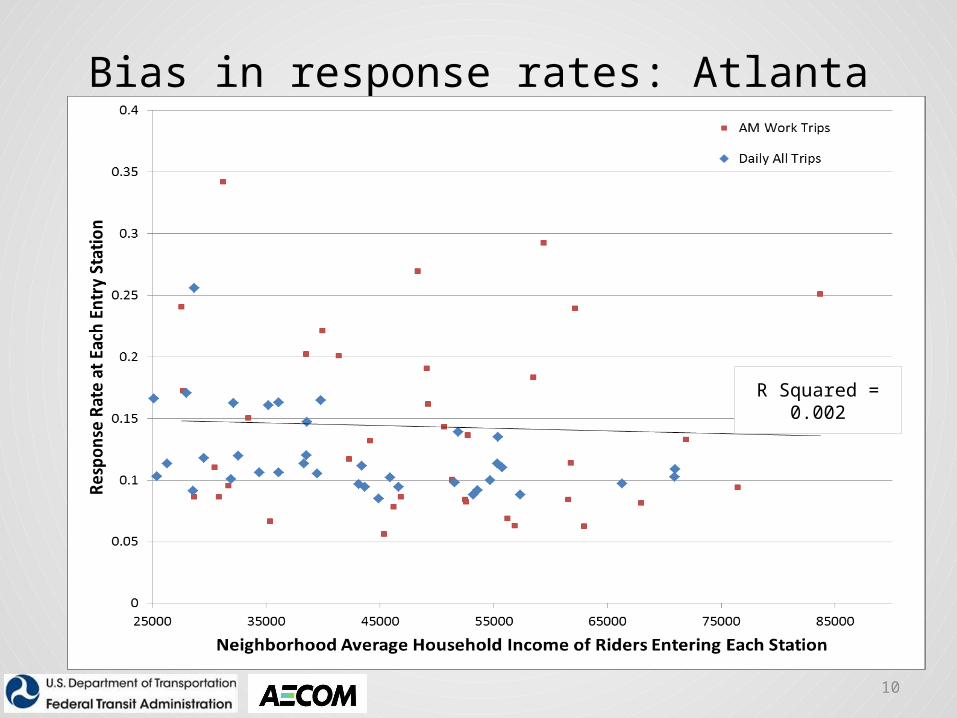
Bias in response rates: Atlanta
10
R Squared = 0.002
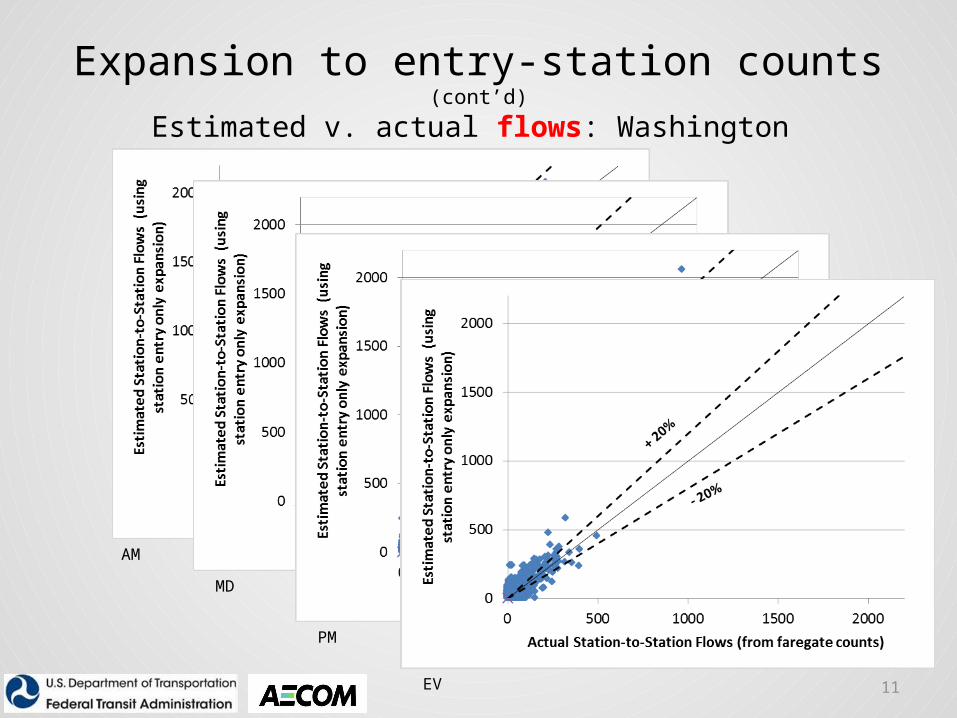
Expansion to entry-station counts (cont’d)
Estimated v. actual flows: Washington
11
AM
MD
PM
EV
12
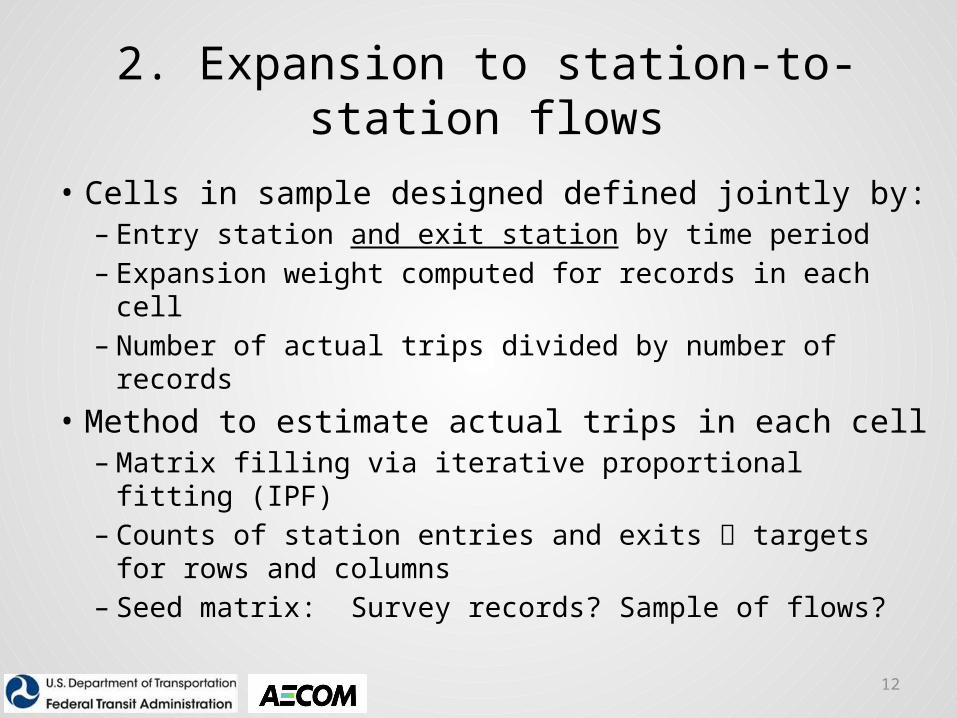
2. Expansion to station-to-station flows
• Cells in sample designed defined jointly by:– Entry station and exit station by time period– Expansion weight computed for records in each cell– Number of actual trips divided by number of records
• Method to estimate actual trips in each cell – Matrix filling via iterative proportional fitting (IPF)– Counts of station entries and exits targets for rows
and columns – Seed matrix: Survey records? Sample of flows?
13
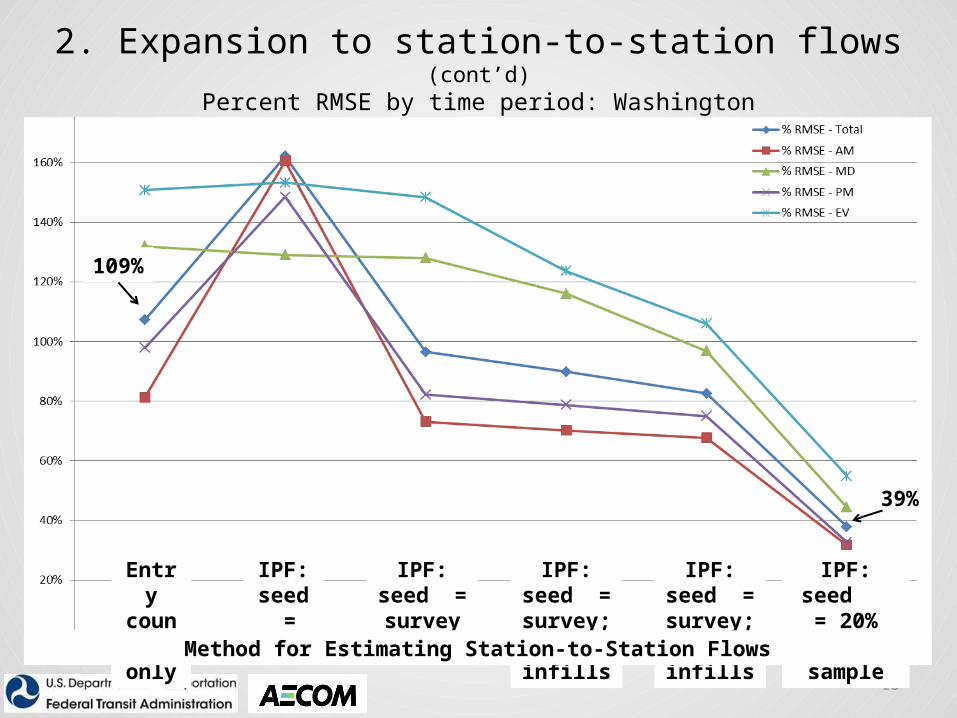
Entry counts
only
IPF: seed = 1’s
IPF: seed = survey records
IPF: seed = survey; 0.1 infills
IPF: seed = survey; 1.0 infills
IPF: seed = 20% flow sample
Method for Estimating Station-to-Station Flows
109%
39%
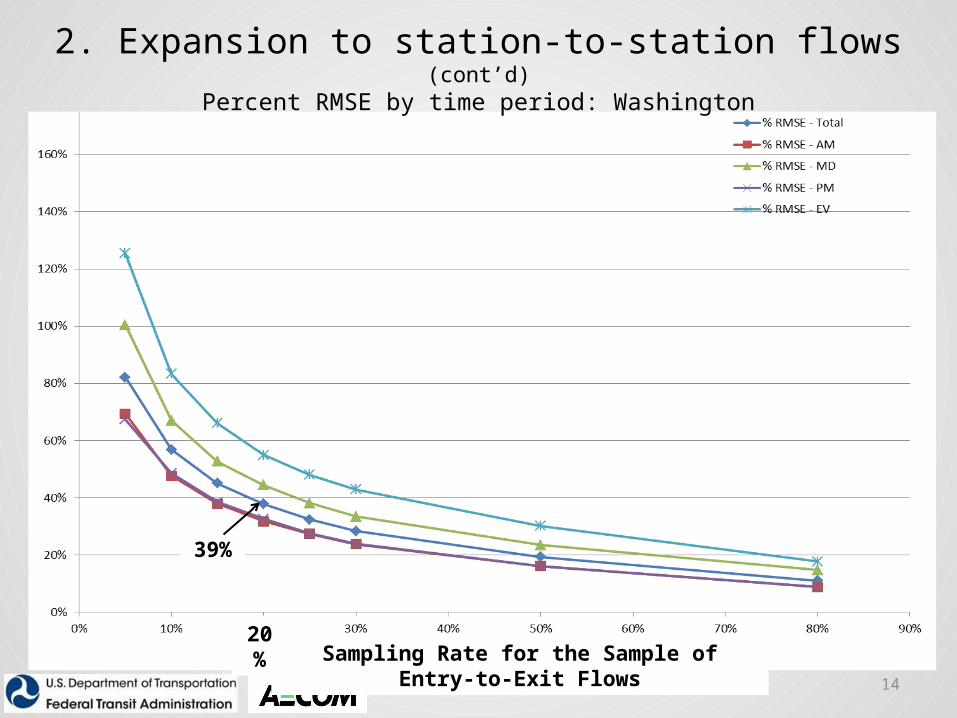
2. Expansion to station-to-station flows (cont’d)Percent RMSE by time period: Washington
14
39%
2. Expansion to station-to-station flows (cont’d)Percent RMSE by time period: Washington
Sampling Rate for the Sample of Entry-to-Exit Flows20%
15
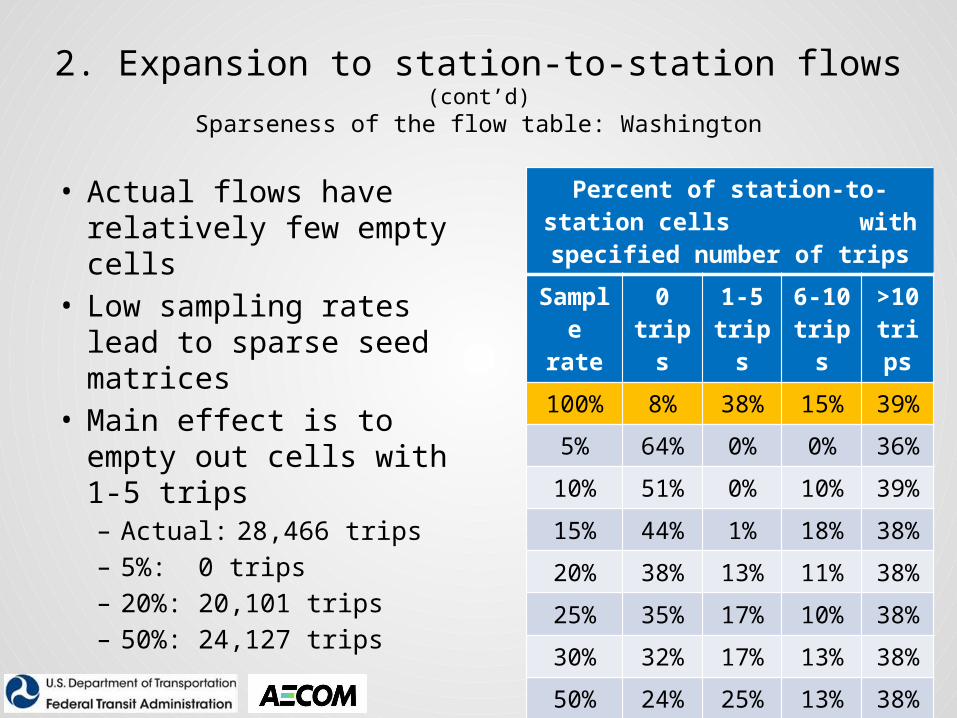
2. Expansion to station-to-station flows (cont’d)Sparseness of the flow table: Washington
• Actual flows have relatively few empty cells
• Low sampling rates lead to sparse seed matrices
• Main effect is to empty out cells with 1-5 trips– Actual: 28,466 trips– 5%: 0 trips– 20%: 20,101 trips– 50%: 24,127 trips
Percent of station-to-station cells with specified number of trips
Sample rate
0 trips
1-5 trips
6-10 trips
>10 trips
100% 8% 38% 15% 39%
5% 64% 0% 0% 36%
10% 51% 0% 10% 39%
15% 44% 1% 18% 38%
20% 38% 13% 11% 38%
25% 35% 17% 10% 38%
30% 32% 17% 13% 38%
50% 24% 25% 13% 38%
80% 18% 33% 12% 38%
16
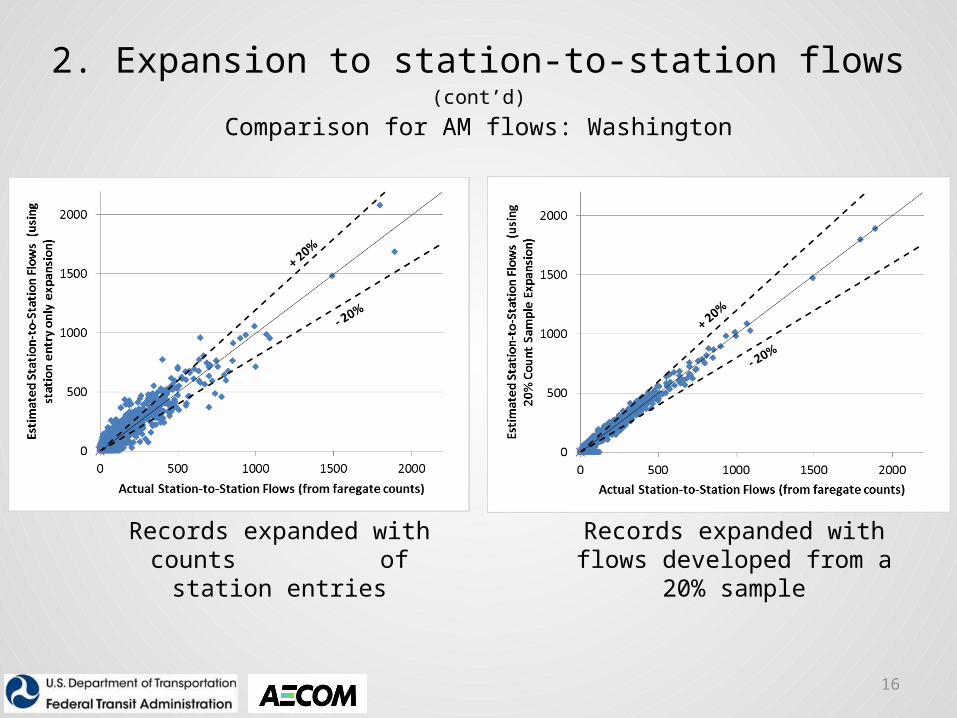
2. Expansion to station-to-station flows (cont’d)
Comparison for AM flows: Washington
Records expanded with counts of station entries
Records expanded with flows developed from a 20% sample
17
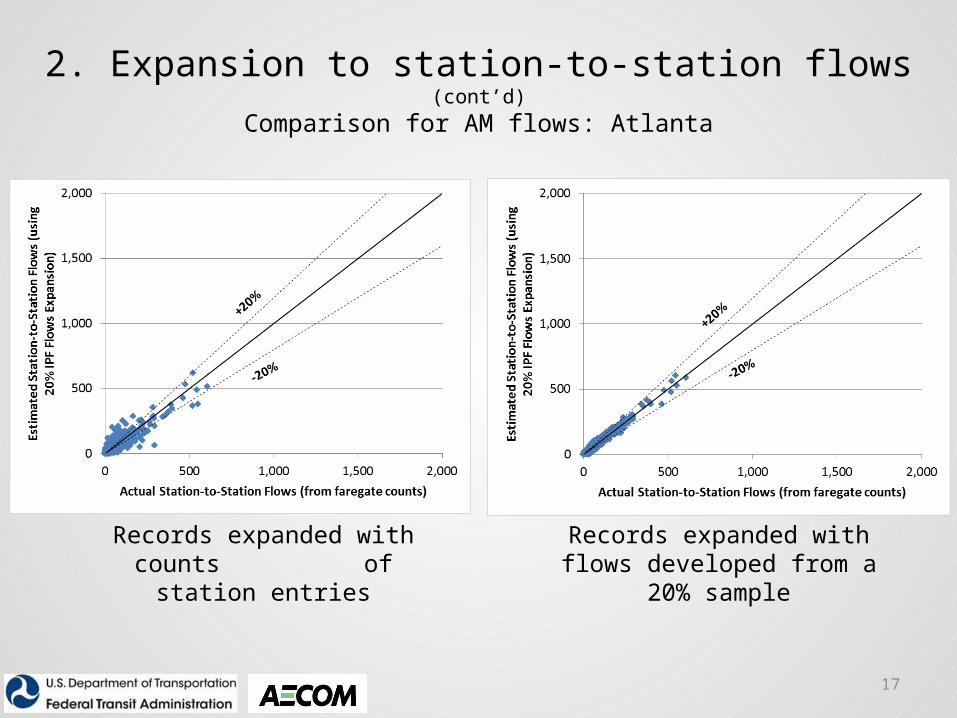
Records expanded with counts of station entries
Records expanded with flows developed from a 20% sample
2. Expansion to station-to-station flows (cont’d)
Comparison for AM flows: Atlanta
18
1. Expansion to station-entry counts– Errors in estimates of flows and station exits– Income-related biases in response rates • Evident with paper-based, post-processed survey• Much less evident with combination of:
– Tablet-assisted personal interviews,– Sample design based on fare-gate flows, and – Real-time monitoring to ensure realization of the sample
design
Observations
19
2. Expansion to station-to-station flows– Adds important information: station exits– IPF application improves estimate flows significantly• Seed matrix from survey records retains survey biases• Seed matrix from independent sample of flows– 20-30% sample effective for these two systems– Larger samples marginally better
Observations

20
• Method in the field matters• Second dimension helpful in all cases• Sample of flows helps– With sample design and management– With sample expansion
• Extension to smaller-ridership cases– Similar sample design, management, expansion– Sparseness grouping of stations/stops
Implications for rider surveys

Thank you.Questions?


