International Journal of Engineering Technology, Management and Applied Sciences
www.ijetmas.com August 2017, Volume 5, Issue 8, ISSN 2349-4476
42 Olorunleke, Kola Gabriel
Sales Promotion and Purchasing Decision of Fast Moving
Consumer Goods in Ondo State
Olorunleke, Kola Gabriel (Ph.D)
Department of Business Administration
Adekunle Ajasin University, Akungba-Akoko
Ondo State, Nigeria.
ABSTRACT
The purpose of this study is to investigate the effect of sales promotion and various sales promotion tools on the
purchasing decision of a customer. The study evaluate the impact of sales promotional tools mainly, price discount,
product sampling and in store display on product trial and purchase behaviour of the customers. The sample points for
the study were customer s in Ondo State. A Total of 300 customers were survey using structured questionnaire, out of
which 261 useable responses were received. This study gives an insight into the retailers capability of managing sales
promotion by examining the sales promotion programs offered FMCG. The result of data analysis indicate that price
discount, free samples and in store displays are associated with the product trial and are popular among retailers and
preferred by consumers. The result also show that the preference for sales promotion programs are dependent upon
consumers demographic characteristics.
Keywords: Sales Promotion, Purchasing Decision, Fast Moving Consumer Goods
INTRODUCTION
1.1 Background to the study.
In the business world today, attracting new customer has become so important in modern retailing. Whereas,
all businesses need to communicate to the consumer what they have to offer (Jobber &Lancaster, 2006). Firms
are expected to communicate with their present and potential customers and make it an important aspect in the
marketing process. Hence, marketers today search for more cost effective method to communicate with their
target audience and are gradually shifting away from conventional above the line media advertising to a
variety of below the line sales promotion (yang, 2010). One of the reasons for switching from the traditional
method of advertising is because of its difficulty to measure its effectiveness (yang,2010). Many methods are
adopted for the achievement of getting in touch with customers and increase market shares. Sales promotion is
one of them.
Promotion refers to as any communication used to inform, persuade and remind people about an
organization or individual goods, service, image, ideas, community involvement or impact of society (Evans
&Berman,1997). Studies (Currim&Scheinder,1991; Ailawadi&Neslin, 1998; Pwaels,Silva-
Risso&Hanssens,2003) indicate that sales promotion have effect on the firms sales volume, purchasing
decision of customer and revenue of firm. Sales promotion has become a valuable tool for marketers and the
importance of it has been increasing rapidly over the past few years. Sales promotions are useful tools which
act as demand booster that do not sustain the risk associated with the new products (Blattberg, Robbert &
Neslin, 1990). Sales promotion is unique in that it offers an extra incentive for actions (Adrian Palmer, 2004).
In addition, purchasing decision refers to consumers deciding what to buy, why to buy, where to buy, and how
often they buy, how frequently they use it, how they evaluate it after the purchase and the impact of such
evaluations on future purchase and how they dispose it off (Schiffman&kamk,2004). Sale promotion generally
works on a direct behavioral basis rather than effecting awareness or attitude (schulk, 1998).Interestingly,
some researchers (Peattie & Peattie, 2009) have shown that sales promotion is likely to repeat purchases if

International Journal of Engineering Technology, Management and Applied Sciences
www.ijetmas.com August 2017, Volume 5, Issue 8, ISSN 2349-4476
43 Olorunleke, Kola Gabriel
consumers are satisfied with the brand that is being promoted; it is more likely that they will also buy it later
after promotion is over. Sales promotion simply exists to have a direct impact on the behavior of firms’
customers (Blattberg&Neslin, 1990). Studies such as Sadia and Syeda (2012); Odunlami and Ogunsiji (2011)
and Aderemi (2003) disclosed that the purpose of sales promotion is to motivate the customers to immediately
purchase a particular product thus enhancing its sales volume.
Retail sector is one of the very biggest industries in the world. The retail shops can’t run business without fast
moving consumer goods as well as people can’t live without FMCG products. Today, the fast moving
consumer goods are fulfilling the consumer’s needs and wants. This sector’s products are used by people at
every day. Available markets are found of many FMCG product and FMCG companies face competition.
Therefore, competition faced by FMCG companies have led to the introduction of many promotional activities
in the sectors
In Nigeria, fast moving consumer goods companies are many. Their contribution to the Nigeria economy and
GDP has got attention of many in the recent time. However, their performance has not been impressive in the
recent times. There seems to be low sales promotional activities among these companies, thereby leading to
their poor performance. There is need therefore to investigate the link between sales promotion and
performance of FMCG companies in Nigeria.
1.2 STATEMENT OF THE PROBLRM
In Nigeria today, there are many FMCG companies and products. FMCG is an important segment of
the retail sector of the Nigeria economy. However, studies available indicate that their performance has not
been impressive. Rapid changes in technology, shortened product life cycles, increased competitions owning
to reduced barriers to international trade and globalization (Olmac, 1985) have all contributed to the need for a
firm to have distinctive capabilities or core-competence, which when successfully applied to firms markets
become competitive advantages (kay, 1983).
Many a time, most organizations do not achieve the level of marketing performance that will yield rents for
them, hence some organizations experience sub-optimal or even out-right poor marketing performance.
Scholars and experts have been wondering whether sales promotions and indeed trade sales promotions still
serve its purpose (Ikem,2011).The extent of FMCG companies adoption of sales promotion as a weapon to
gain competitive advantage has not been empirically established in Nigeria.
In addition, studies have equally been inadequate as to the impact of sales promotion on the
performance of FMCG in Nigeria. Studies by Daramola, Bello and Okafor (2014): Ajike, Akpan and Ajike
(2016) are the only studies in the literature that are related to sales promotion and purchasing decision of
FMCG but with emphasis on branding, packaging and green pricing. Many studies in the literature that
investigated the significant relationship between sales promotion and purchasing decision of FMCG are
foreign studies that may be difficult to rely on in the case of Nigeria. In order to investigate this relationship
and address the inadequacy of empirical studies in Nigeria, there is need to examine the significance
relationship between sales promotion and purchasing decision FMCG in Nigeria hence this study.
1.3 Research Questions
Consequent upon the gap in the literature as articulated in the statement of problem, the following research
questions will be raised
1. What is the extent of sales promotion activities among FMCG companies in Nigeria?
2. What is the effect of sales promotion and performance of FMCG companies in Nigeria?
1.4 Objective of the study
The main objective of this study is to analyze the role of sales promotion in influencing the purchasing
decision of FMCG in Nigeria.
The specific objectives are to;
i. Examine what types of sales promotion are highly preferred by the customer of FMCG.
ii. Investigate the effect of sales promotion on the performance of FMCG companies in Nigeria

International Journal of Engineering Technology, Management and Applied Sciences
www.ijetmas.com August 2017, Volume 5, Issue 8, ISSN 2349-4476
44 Olorunleke, Kola Gabriel
1.5 Hypothesis of the study:
i. There is no significant relationship between sales promotion and performance of FMCG companies in
Nigeria.
1.6 Significance of the study
Sales promotions campaign is often the only promotional material available at the point of purchases which
inform remind and also stimulate the buyers (Stanton et al, 1995).Low sales promotion is a concern for
manufacturing firms including FMCG companies in Nigeria. Specifically, the finding of this study is expected
to benefit the following stakeholders;
Government
To the government, the study would provide greater insight into the relationship between sales promotion and
performance of retail firms including FMCG companies. This may aid in formation of policies and regulation
that can help improve profitability and market shares in the retail sector and by extension increase job
creation.
F M C G Companies
FMCG companies may benefit from the study as they could better understand the underlying sales
promotional activities influencing performance of FMCG companies and they may be better placed to deal
with hurdles that impede successful sales promotion performance. Aggressive sales promotion will provide
impetus to increased profitability, market share and sales.
Based on these observations, this study may perhaps propose some future directors in order to make Nigeria
FMCG companies competitive with world class best strategies.
Academic field
The study could also benefit the academic community as it may contribute to the increasing body of literature
on sales promotion. It may possibly provide a framework of sales promotion activities which may be used as a
test based for further research. Due to the limited study on sales promotion on FMCG in Nigeria that has been
carried out, the researchers in the field may be interested in reviewing the findings of this study and more so
those resident in Nigeria.
LITERATURE REVIEW
SALES PROMOTION
Over the years sales promotion has become an indispensable element ofconsumer marketing. In the
past, advertising used to be one of the most effectivemarketing tools to reach the target customers to influence
their purchasing decision.However, today marketers put more emphasis to sales promotion and are
graduallyshifting away from traditional method of advertising towards sales promotion. Thereare number of
factors that have resulted in this shift, from traditional method ofadvertising to the extensive growth of sales
promotion.
Firstly, companies everywhere are facing declining real differences betweenthe products and services
that they have to offer. Secondly, companies today face apressure to achieve short term result amid intense
competition in the marketplace.Furthermore, with the advent of Internet technology, customers today are
moreinformed about the product fight harder and faster for every sale (Cummins, 2008).
Many studies regarding behavioral and economic theory has providedsupporting evidence that
consumption for some product categories responds to promotion (Wansink & Despande, 1994) through
experimental approach concluded that significant holding cost pressure consumer to purchase more of a
product(Wansink &Despande, 1994) showed that when the product is perceived as widelysubstitutable,
consumer will consume more of it in place of its close substitute (Chandon,Brian,Wansink&Laurent,2000)
showed that stockpiling increases consumption of high convenience products more than low convenience
product.

International Journal of Engineering Technology, Management and Applied Sciences
www.ijetmas.com August 2017, Volume 5, Issue 8, ISSN 2349-4476
45 Olorunleke, Kola Gabriel
In another analytical study, (Assunção& Meyer, 1993) shows thatconsumption is an
indigenous decision variable driven by promotion and promotion induced stockpiling resulting from forward
looking behavior. There has not been enough research done regarding the purchasing strategies that the
consumer adopts in response to particular promotion or to study how pervasive these promotion are in
population of interest. Blattberg&Neslin (1990) define a purchase strategy as a general buyingpattern which
"incorporates several dimensions of buying behavior such as brandloyalty, private brand proneness and deal
proneness." A greater understanding of thedifferent types of consumer responses to promotions can help
managers to developeffective promotional programs and also provide new insights for consumer
behaviortheorists who seek to understand the influence of different types of environmentalcues on consumer
behavior.( Eppen, & Lieberman, 1981), and (Wilson, Newman,&Hastak, 1979) find evidence that promotions
are associated with purchase acceleration in terms of an increase in quantity purchased and, to a lesser
extent,decreased inter purchase timing.Researchers studying the brand choice decision-for
example,(Guadagni,John,& Little, 1983) and (Gupta, 1988) have found promotions to be associatedwith brand
switching. (Montgomery, 1971), (Schneider &Currim, 1991), and (Webster, 1965) found that promotion-
prone households were associatedwith lower levels of brand loyalty. (Blattberg,Peacock,&Sen,
1976)describes 16purchasing strategy segments based on three purchase dimensions: brand loyalty(single
brand, single brand shifting, many brands), type of brand preferred (national,both national and private label),
and price sensitivity (purchase at regular price,purchase at deal price).
There are other variables that may be used to describe purchase strategies,examples are whether the
household purchases a major or minor national brand, storebrand, or generic, or whether it is store-loyal or
not. McAlister (1983) and (Neslin&Shoemaker, 1989) use certain segments derived from those of (Blattberg
et al., 1976)but add a purchase acceleration variable to study the profitability of productpromotions. In this
age of competition, sales promotions have become an integral partof the marketing mix.Marketers use
different kinds of price-oriented promotions such as coupons,rebates, price discounts to increase sales and
market share, encourage trial, andencourage brand switching. Non-price promotions such as sweepstakes,
frequent userclubs, and premiums add excitement and value to brands and may encourage brandloyalty
(Aaker, 1991). In addition, consumers prefer promotions and are alwayslooking to reap benefit from some
form of promotion. They provide utilitarianbenefits such as monetary savings, added value, increased quality,
and convenience, as well as other benefits such as entertainment, exploration, and self-expression
(Chandon,Wansink and laurent, 2000).
A large body of literature has examined consumer response to salespromotions, most notably coupons
(Sawyer & Dickson, 1984), (Bawa, Kapil, &Shoemaker, 1987), (Gupta, 1988), (Blattberg&Neslin, 1990),
(Agarwal&Rao.,1996) and (Leone &Srinivasan, 1996)According to Blattberg and Neslin, (1990) sales
promotion is a key ingredient in marketing campaigns which consist of collection of incentive tools to
stimulatequicker or greater purchase of particular products by the consumers. Similarly, Brassington and
Pettitt, (2000) states that sales promotion are range of marketingtechnique that are designed to add value to a
product or services over and above thenormal offering in order to achieve specific sales or marketing
objective. Shimp (2003) defines sales promotion as any incentive used by manufactureror a retailer to
encourage the sales force to aggressively sell the product and also toinduce the buyer to buy the product. Sales
promotion plays an important role in themarketing programs of the retailer and it can have a significant impact
when customermakes their purchasing decision (Gedenk, Karen, Scott . Neslin, &Ailawadi, 2006).From these
definitions it can be said that the sales promotion adds value to theproducts or services and it provides an extra
incentive to consumer who makepurchasing decision based on the promotion.
The value created by sales promotion may also vary depending upon thedifferent types of sales
promotion such as free sample, price discounts, pointof sale display promotions etc. It provides direct impact
on consumer behavior andaccelerates the selling process by influencing consumer to make a swift
purchase.Customers look for more fun from the brands they buy. Sales promotion offersnovelty, excitement
and humor at the point of purchase which they respond to(Cummins, 2008). Moreover sales promotion
changes temporary consumer‘sperception towards the price and value of the product.

International Journal of Engineering Technology, Management and Applied Sciences
www.ijetmas.com August 2017, Volume 5, Issue 8, ISSN 2349-4476
46 Olorunleke, Kola Gabriel
Consumer Behavior and Decision Making
Marketing begins with understanding the need of a consumer as those acts ofindividual who are
directly involved in obtaining, using and disposing of economicgoods and services including the decision
processes that precede and determine thisacts. Therefore, knowledge of consumer behavior is an indispensable
input to formingany promotional mix. Consumer behavior is defined as the behavior that consumersdisplay in
seeking, purchasing, using, evaluating and disposing of products andservices that they expect will satisfy their
personal needs.(Shiffman ,Cowley,Watson,&kanuk 2001).
Solomon, Bamossy and Hogg (2010) defines ―consumer behavior as the studyof the processes
involved when individual or groups select, purchase, use or disposeproducts, services, ideas or experiences to
satisfy need and desires‖. Roger and Blackwell et al state that consumer behavior as activities people
undertake whenobtaining, consuming, and disposing of products and services. Consumer behavior isthe study
of how individuals make decisions to spend their available resources(money, time and effort) on
products.Moreover, it is the study of several influencing factors such as what, why,how, when and where does
a consumer make a purchase decision (Shiffman et al.,2001). Consumer behavior is defined as the ―study of
buying units and the exchangeprocesses involved in acquiring, consuming, and disposing of goods,
services,experiences, and ideas‖ (Michael, 2000).The above mentioned definitions of consumer behavior
reveal, the exchangeprocess, which begins with the acquisition phase, then moves to the consumptionphase
and ends with the disposition phase. This work aims to study the factors thatinfluence the acquisition choice
of consumers when they decide to acquire a certainproduct or service.
It is very vital for the businesses to understand the consumer behavior; it is a key factor that affects
consumers‘ purchasing decision. According to Bill McDermott, (SAP America, Inc) ―Starting with what
your customers need and want,rather than what you have to sell, is the key to sales success‖. Today‘s
businessesplace greatest importance on processing and understanding consumer behavior as itprovides
numerous benefits. The importance of understanding the consumer is foundin the definition of marketing as a
human activity directed at satisfying needs andwants through human exchange process. (Michael, 2000).To
understand the consumer behavior several researchers have examined the
classes of a variable that influences the consumer behavior; they focus onunderstanding the nature of each
variable. Some of the variables that influence theconsumer behavior are the stimulus variables such as
advertisement, sales promotion,products, that exist in both the individual‘s external and internal environment
(Loudon& AJ, 1993) These variables generate sensory inputs to consumers.Response variables are the
resulting mental / physical reactions of individualswho are influenced by stimulus variables. Moreover, there
are third kind of variablescalled intervening variables which literally intervenes between stimulus variable
andresponse variables. These variables act to influence or magnify the effect of stimulus
variables on response variables (Loudon & AJ, 1993).The scope of this study islimited to the study of
consumer behavior in regard to the stimulus variables such assales promotion. Several studies have revealed
that sales promotion influences theconsumer behavior. Or in other words, sales promotion influences the
consumerbuying decisionsTherefore, the challenge formanagers should not be whether to allocate funds to
advertising or sales promotion,but rather to find a way to connect these methods. What we have also seen
emergefrom the literature is a doubt whether or not either advertising or sales promotion can
influence brand image – a question that surely needs more empirical answers.But, at least for now, we do
know that companies can rarely exclude salespromotion from their campaigns due to the factors such as
increased competition andpressure from retailers. They can, however, choose to use the sales
promotionelements which have proven to be more effective in enhancing the companys image.
METHODOLOGY
This study uses survey questionnaire as a research instrument to collect primary data because of the
geographical distribution of the population of thiswork. The population of this work are scattered over a wide
geographical area,and questionnaire is considered as the most feasible tool to reach them in the given time
period. The population of the study consist of customers of fast moving goods in ondo state.The sample size is
International Journal of Engineering Technology, Management and Applied Sciences
www.ijetmas.com August 2017, Volume 5, Issue 8, ISSN 2349-4476
47 Olorunleke, Kola Gabriel
261.The survey is divided into 2 parts. The first part consists of general questions such aspersonal
background, demographics, income level, etc. of the respondents whereas thesecond part consists of the
research – specific questions. The researcher uses closed –ended questions in the survey, meaning that the
possible answer choices are set out inthe questionnaire and the respondents select the answer choices that
bestaccommodates their response and likert scale was used to rate the various aspect of the interaction. The
data obtain was captured and analyzed using the descriptive statistics (frequency and percentage) to describe
and analyzed. A pearson correlation was used to determine the relationship between the variables and test the
research hypothesis.
RESULTS
Here, the researcher uses descriptive statistics (frequency and percentage) todescribe and analyze the
demographics of the research, alsouses Pearson’s correlation to determine whether there isrelationship
between the dependent and independent variables.
Demographic Data
1. Age
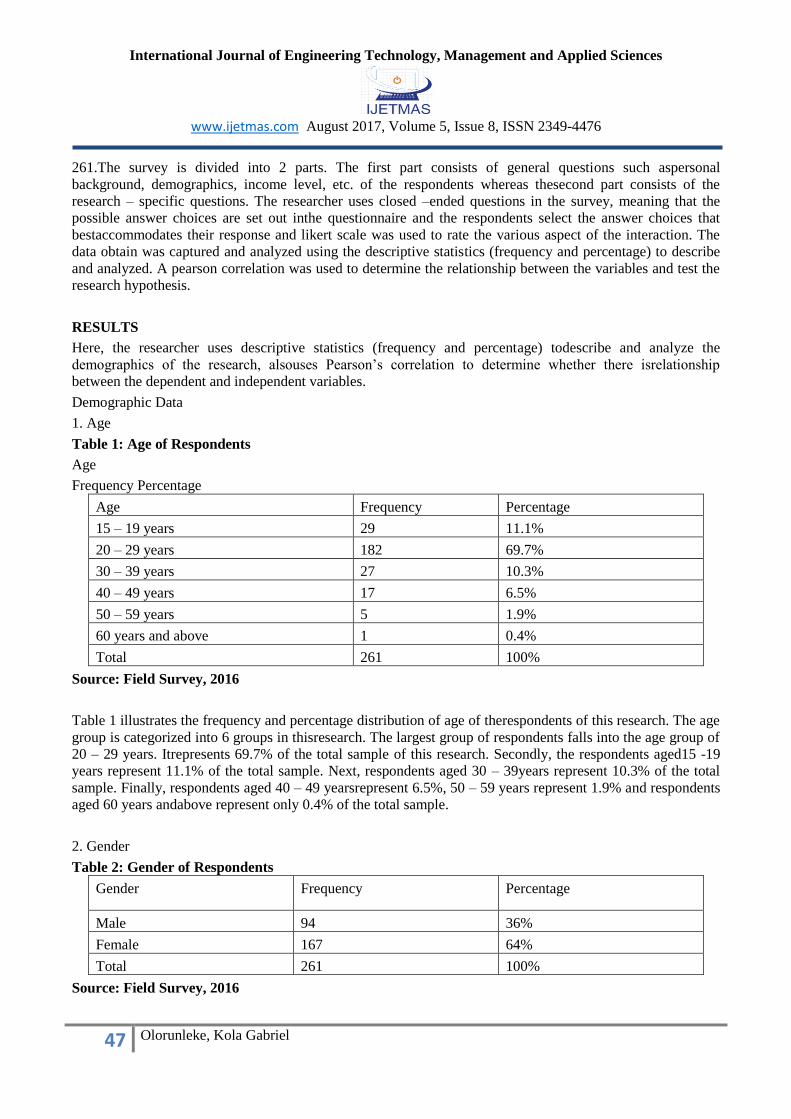
Table 1: Age of Respondents
Age
Frequency Percentage
Age Frequency Percentage
15 – 19 years 29 11.1%
20 – 29 years 182 69.7%
30 – 39 years 27 10.3%
40 – 49 years 17 6.5%
50 – 59 years 5 1.9%
60 years and above 1 0.4%
Total 261 100%
Source: Field Survey, 2016
Table 1 illustrates the frequency and percentage distribution of age of therespondents of this research. The age
group is categorized into 6 groups in thisresearch. The largest group of respondents falls into the age group of
20 – 29 years. Itrepresents 69.7% of the total sample of this research. Secondly, the respondents aged15 -19
years represent 11.1% of the total sample. Next, respondents aged 30 – 39years represent 10.3% of the total
sample. Finally, respondents aged 40 – 49 yearsrepresent 6.5%, 50 – 59 years represent 1.9% and respondents
aged 60 years andabove represent only 0.4% of the total sample.
2. Gender
Table 2: Gender of Respondents
Gender Frequency Percentage
Male 94 36%
Female 167 64%
Total 261 100%
Source: Field Survey, 2016
International Journal of Engineering Technology, Management and Applied Sciences
www.ijetmas.com August 2017, Volume 5, Issue 8, ISSN 2349-4476
48 Olorunleke, Kola Gabriel
Table 2 illustrates the frequency and percentage distribution of gender of therespondents of this research. Out
of 261 respondents surveyed in this research, 64%were female respondents and 36% were male respondents.
3: Criteria that determines the choice of noodles
Table 3: Criteria that determines Respondents choice of FMCG
Criteria that determines your choice of noodles Frequency Percentage
Brand name 47 18%
Product Quality 120 46%
Product Variety 32 12%
Store Ambiance 9 3%
Price 30 11%
Purchasing Convenience 23 9%
Total 261 100%
Source: Field Survey, 2016
Table 3 represents the frequency and percentage distribution of the criteriathat determines respondent’s choice
of the FMCG. 46% of the respondentsselect the FMCG based on product quality. 18% of the respondents
select the noodlesbased on brand name. 12% select the FMCG brand based on product varietyoffered. 11% of
the respondents select the FMCG based on the price offered by thebrand. 9% of the respondents select the
noodles brand based on purchaseconvenience. And only 3% of the respondents select the FMCG based on
thestore ambience.
Table 4: Analysis of Respondent’s Perception towards the Relationship betweenSales Promotion and
Purchase Decision
Q. Sales Promotion and Purchase Decision Mean SD Perception
13
My purchase decision is based on sales promotion
offered by the brand.
3.74 0.75 Agree
Source: Field Survey, 2016
Table 4 shows the analysis of the respondent’s perception towards therelationship between sales promotion
and purchase decision. Most respondents agreethat their purchase decision is based on the sales promotion
offered by the brand withmean score of 3.74. This data shows that majority of respondents take sales
promotioninto consideration while making their purchase decision offered by the respectivebrand.
Table 5: Analysis of Respondent’s Perception towards the Relationship betweenPrice and Purchase
Decision
Q. Price and Purchase Decision Mean SD Perception
14 I make price comparisons when I go to eat noodle 3.69 0.83 Agree
15 I only make my purchase if there is price discount on the
product
3.64 1.00 Agree
16 I tend to buy more than usual when offered price discounts 3.69 0.91 Agree
17 I am willing to switch brands if price discount is offered by
the competing brands
3.44 0.90 Agree
18 Price discounts influences me to makeunplanned purchase. 3.54 0.97 Agree
19 I am willing to pile up stock of noodleswhen there is a price
discount
2.81 1.01 Neutral
Source: Field Survey, 2016

International Journal of Engineering Technology, Management and Applied Sciences
www.ijetmas.com August 2017, Volume 5, Issue 8, ISSN 2349-4476
49 Olorunleke, Kola Gabriel
Table 5 shows the respondents perception towards the relationship betweenprice and purchase decision while
buying. It shows that mostrespondents agree on making price comparison while they go to buy, with mean
score of 3.96. Similarly, respondents agree that, they usually make purchasedecision if there is a price
discount on the product with mean score of 3.64.Furthermore, respondents agree that, they tend to purchase
more than usual whenoffered price discount with mean score of 3.69. In addition, respondents also agreethat
they will switch to competing brands provided that if the competing brands offerprice discount with mean
score of 3.44. Moreover, respondents are willing to makeunplanned purchase of FMCG when the price
discount is on offer with mean scoreof 3.54. However, in regarding the willingness to pile of up the stock of
FMCG,respondents have neutral attitude with the mean score of 2.81.
Table 6: Analysis of Respondent’s Perception towards the Relationship betweenFree Samples and
Purchase Decision
Q.
Free Samples and Purchase Decision Mean SD Perception
26
Free samples influences me to try new
product
3.93 0.78 Agree
27
Free samples influences me to make
unplanned purchase
3.74 0.77 Agree
28
When offered free samples it influences to meto make
purchase decision instantly
3.79 0.78 Agree
29
I am more willing to buy a new product only free
sample is offered
3.20 0.95 Neutral
Source: Field Survey, 2016
According to the illustrated data regarding the perception of respondentstowards the free samples and their
purchase decision, respondents agree that freesamples influences them to try new products and influences
them to make unplannedpurchase with mean score of 3.93 and 3.74. Respondents also agree that when the
freesamples are offered it influences them to make purchase decision instantly with meanscore of 3.79.
However, respondents have a neutral attitude when asked if they arewilling to buy a new product only if free
sample of the product is offered with meanscore of 3.20. To sum up from the data collected above it shows
that free sampleinfluence respondents to make their purchase decision.
Table 7: Analysis of Respondent’s Perception towards the Relationship betweenPremium and Purchase
Decision
Q.
Premium and Purchase Decision Mean SD Perception
30
I am more likely to make purchase if I knowthat I will
win a free gift
3.28 0.91 Neutral
31
I am willing to spend more on purchase of a product to
get a premium
3.60 0.93 Agree
32
If a premium promotion required buying
more than one product I still like to
participate in the promotion
3.36 0.80 Neutral
Source: Field Survey, 2016
International Journal of Engineering Technology, Management and Applied Sciences
www.ijetmas.com August 2017, Volume 5, Issue 8, ISSN 2349-4476
50 Olorunleke, Kola Gabriel
The data illustrated in table 7 shows that respondents have neutral attitudeabout likeliness to purchase the
product provided that they will win a free gift withmean score of 3.28. They also have neutral attitude about
participating in thepremium promotion that required buying more than one product with mean score of3.36.
Respondents agree and are willing to spend more on purchase of a product to geta premium with mean score
of 3.60.
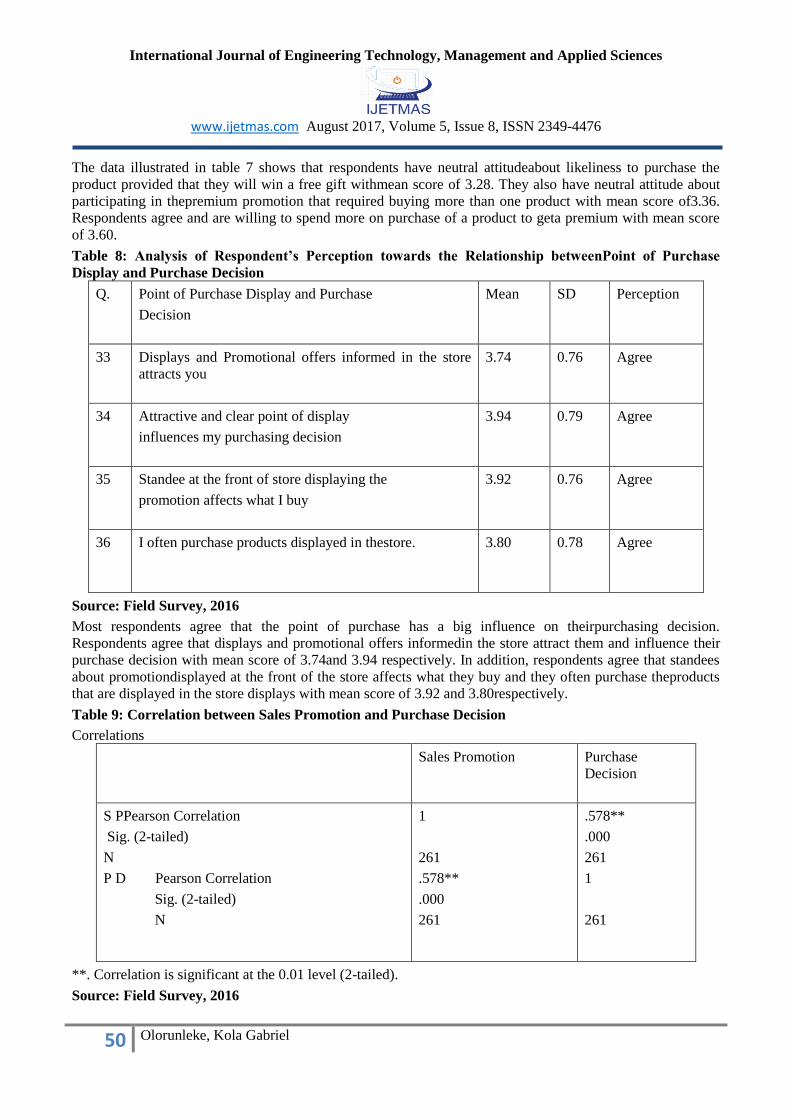
Table 8: Analysis of Respondent’s Perception towards the Relationship betweenPoint of Purchase
Display and Purchase Decision
Q.
Point of Purchase Display and Purchase
Decision
Mean SD Perception
33
Displays and Promotional offers informed in the store
attracts you
3.74 0.76 Agree
34
Attractive and clear point of display
influences my purchasing decision
3.94 0.79 Agree
35
Standee at the front of store displaying the
promotion affects what I buy
3.92 0.76 Agree
36
I often purchase products displayed in thestore. 3.80 0.78 Agree
Source: Field Survey, 2016
Most respondents agree that the point of purchase has a big influence on theirpurchasing decision.
Respondents agree that displays and promotional offers informedin the store attract them and influence their
purchase decision with mean score of 3.74and 3.94 respectively. In addition, respondents agree that standees
about promotiondisplayed at the front of the store affects what they buy and they often purchase theproducts
that are displayed in the store displays with mean score of 3.92 and 3.80respectively.
Table 9: Correlation between Sales Promotion and Purchase Decision
Correlations
Sales Promotion Purchase
Decision
S PPearson Correlation
Sig. (2-tailed)
N
P D Pearson Correlation
Sig. (2-tailed)
N
1
261
.578**
.000
261
.578**
.000
261
1
261
**. Correlation is significant at the 0.01 level (2-tailed).
Source: Field Survey, 2016
International Journal of Engineering Technology, Management and Applied Sciences
www.ijetmas.com August 2017, Volume 5, Issue 8, ISSN 2349-4476
51 Olorunleke, Kola Gabriel
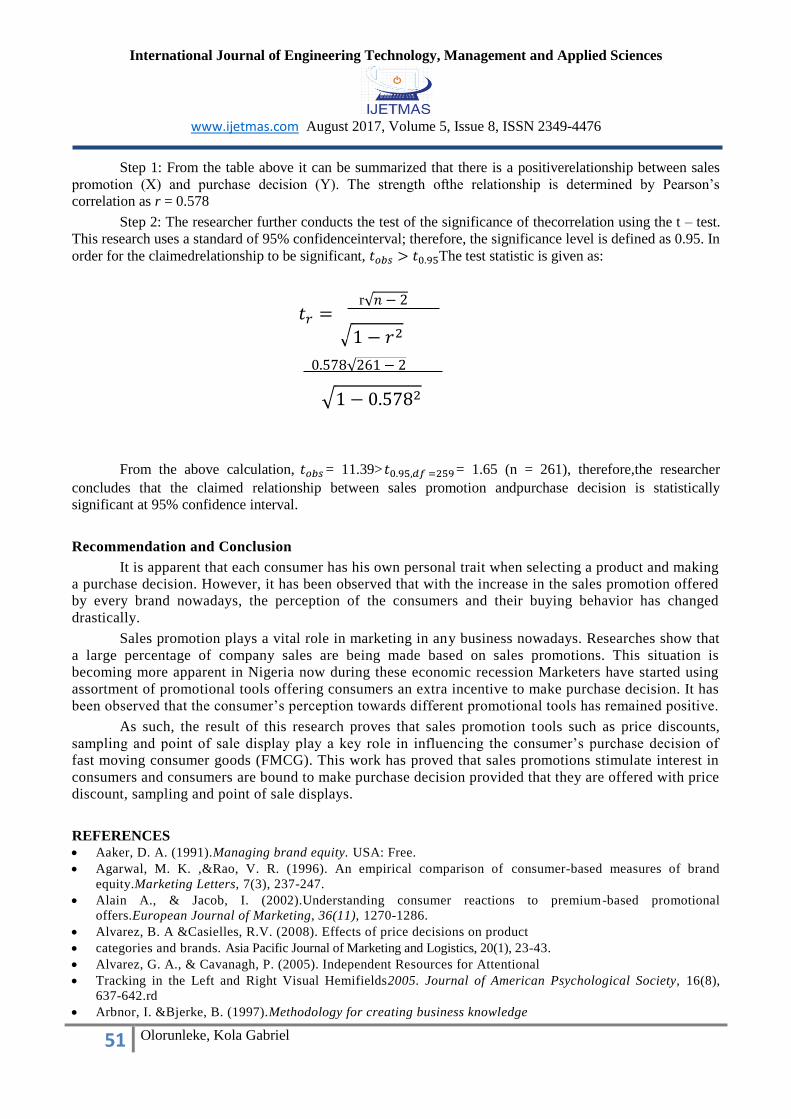
Step 1: From the table above it can be summarized that there is a positiverelationship between sales
promotion (X) and purchase decision (Y). The strength ofthe relationship is determined by Pearson’s
correlation as r = 0.578
Step 2: The researcher further conducts the test of the significance of thecorrelation using the t – test.
This research uses a standard of 95% confidenceinterval; therefore, the significance level is defined as 0.95. In
order for the claimedrelationship to be significant, 𝑡𝑜𝑏𝑠 > 𝑡0.95The test statistic is given as:
r√𝑛 − 2
0.578√261 − 2
From the above calculation, 𝑡𝑜𝑏𝑠 = 11.39>𝑡0.95,𝑑𝑓 =259 = 1.65 (n = 261), therefore,the researcher
concludes that the claimed relationship between sales promotion andpurchase decision is statistically
significant at 95% confidence interval.
Recommendation and Conclusion
It is apparent that each consumer has his own personal trait when selecting a product and making
a purchase decision. However, it has been observed that with the increase in the sales promotion offered
by every brand nowadays, the perception of the consumers and their buying behavior has changed
drastically.
Sales promotion plays a vital role in marketing in any business nowadays. Researches show that
a large percentage of company sales are being made based on sales promotions. This situation is
becoming more apparent in Nigeria now during these economic recession Marketers have started using
assortment of promotional tools offering consumers an extra incentive to make purchase decision. It has
been observed that the consumer’s perception towards different promotional tools has remained positive.
As such, the result of this research proves that sales promotion tools such as price discounts,
sampling and point of sale display play a key role in influencing the consumer’s purchase decision of
fast moving consumer goods (FMCG). This work has proved that sales promotions stimulate interest in
consumers and consumers are bound to make purchase decision provided that they are offered with price
discount, sampling and point of sale displays.
REFERENCES Aaker, D. A. (1991).Managing brand equity. USA: Free.
Agarwal, M. K. ,&Rao, V. R. (1996). An empirical comparison of consumer-based measures of brand
equity.Marketing Letters, 7(3), 237-247.
Alain A., & Jacob, I. (2002).Understanding consumer reactions to premium-based promotional
offers.European Journal of Marketing, 36(11), 1270-1286.
Alvarez, B. A &Casielles, R.V. (2008). Effects of price decisions on product
categories and brands. Asia Pacific Journal of Marketing and Logistics, 20(1), 23-43.
Alvarez, G. A., & Cavanagh, P. (2005). Independent Resources for Attentional
Tracking in the Left and Right Visual Hemifields2005. Journal of American Psychological Society, 16(8),
637-642.rd
Arbnor, I. &Bjerke, B. (1997).Methodology for creating business knowledge
√1 − 𝑟2
𝑡𝑟 =
√1 − 0.5782
International Journal of Engineering Technology, Management and Applied Sciences
www.ijetmas.com August 2017, Volume 5, Issue 8, ISSN 2349-4476
52 Olorunleke, Kola Gabriel
(3 rd ed.). New York: Sage.
Assun9ao, J. L., & Meyer, R. J. (1993).The Rational Effect of Price Promotions on Sales and
Consumption.Management Science, 39(5), 517-535.
Babbie, E. (2010). The practice of social research (6thed.). Belmont, CA: Wadsworth.
Banks, P. (2003). Store was set to rage on. Irelands Marketing Monthly, 14(8).Retrieved from
www.marketing.ie/sep03/article4.htm.
Bawa, K., & Shoemaker, R. W. (1987). The Effects of a Direct mail Coupon on Brand Choice Behavior.
Journal of Marketing Research, 24(4), 370-376.
Bawa, K. ,& Shoemaker, R. W. (1897). The Effects of A Direct Mail Coupon on Brand Choice Behavior.
Journal of Marketing Research, 24(4), 370-376.
Blair, E. A., & London, L. (1981).The Effects of Preference Price in Retail Advertisments. Journal of
Marketing, 45(2), 83-93.
Blattberg, R. C., &Neslin, S. A. (1990).Sales promotion—concepts, methods, and strategies (2nded.). NJ:
Prentice Hall.
Blattberg, R. C., Peacock, P., &Sen, S. K. (1976).Purchasing strategies Across Product Categories. Journal of
Consumer Research, 3, 369-377.
Brassington, S., &Pettitt, S. (2000).Principles of marketing (2nded.). Essex,
England: Pearson Education .
Broniarczyk, S. M. ,& Alba, J. W. (1994). The importance of the brand in brand extension. Journal of
Marketing Research, 37(May), 214-228.
Center, Thai Farmers Research.(2000). Retail business in 2000.Industry Focus,
4(22), 1-7.
Chandon, P., &Wansink, B. (2002). When are stockpiled products consumed faster? A convenience -salience
framework of post purchase consumption incidence and quantity. Journal of Marketing, 39(1), 321-335.
Chandon, P.,Wansink, B. & Laurent, G. (2000). A Benefit Congruency Framework of Sales Promotion
Effectiveness.Journal of Marketing, 64, 65-81.
Cook, A. (2003). How to cash in on the coupon craze.Incentive Business .Retrieved from
http://www.aessweb.com/pdf-files/3%20(2)%20114-130.pdf
Coughian, M., Cronin, P., & Ryan, F. (2007). Step by-step guide to critiquing
research. Part 1: quantitative research. British Journal of Nursing, 16(2), 658 - 663.
Creswell, W. (2003).Research design qualitative, quantitative and mixed methods approaches (2nded.). California:
Sage.
Cummins, J. (2008). Sales Promotion: How to create, implement and integrate campaigns that really work (8thed.).
London, UK: Kogan Page.
Darkea, Peter R., &, Cindy,M.Y. C (2005). Effects of pricing and promotion on
consumer perceptions: it depends on how you frame it. Journal of Retailing, 81(1), 35-47.
Dawes, J. (2004). Price changes and defection levels in a subscription-type market: can an estimation model
really predict defection levels? Journal of Services Marketing, 18(1), 35-44
Della B., J, A., & Monroe, K. B. (1981).A Multivariate Analysis of the Perception of Value from Retail Price
Advertisements, in Advances in Consumer Research.Association of consumer research, 8, 161-165.
Diamond, W. D. ,& Johnson, R. R. (1990). The framing of sales promotions: an
approach to classification, in Goldberg. Advances in Consumer Research, 17, 494-500.
Don, E. S., William, A. R., &Petrison, L. (1998).Sales promotion essentials: The 10 basic sales promotion
techniques and how to use them (1sted.). New York: McGraw Hill Professional.
Ellen R. F., Patriya S. T., & Wong, J. K. (1988). Evaluating cross-national sales
promotion strategy: an audit approach. International Marketing Review, 5(4), 7-15.
Farrag, D. (2010). Behavioral Responses to Sales Promotion A study of Muslim consumers in Egypt. Paper
presented at the International Conference on
Odunlami IB, Ogunsiji A (2011). Effect of sales promotion as a tool on organizational
performance. J. Emerg. Trends in Econ. And manage. Sci. (JETEMS). 2(1):9-13.
Syeda N.Z and Sadia M (2011). Impact of sales promotion on organizations’
profitability and consumer’s perception in Pakistan.
Interdisciplinary journal of contemporary research in business. Vol. 3 No. 5.
International Journal of Engineering Technology, Management and Applied Sciences
www.ijetmas.com August 2017, Volume 5, Issue 8, ISSN 2349-4476
53 Olorunleke, Kola Gabriel
Adrian Palmer (2004). Introduction to Marketing Theory and Practice. 2nd Edition, United State: Oxford
University Press Inc.
AilawadiKusum, Neslin S (1998). The Effect of Promotion on Consumption: BuyinMore and consuming it
Faster J. Mark. Res
Schiffman, L. G. and Kanuk, L. L. (2004). Consumer Behavior. Eight Edition, Prentice- Hall of India.
Pawels, K., Srinivasan, S., Silva-Risso, J., & Hanssen, D. M. (2003). New Products, Sales Promotions and Firm
Value, with Application to the Automobile Industry. Journal of Marketing , 22-38.
Blattberg, C., R., & Neslin, S. A. (1990). Sales Promotion, Concepts, Methods and
Strategies. Englewood Cliffs, New Jersey: Prentice Hall.
Jobber D, Lancaster G (2006) Selling and sales management, (7thedn),
Harlow: Pearson Education.
Evans J, Berman B (1997) Marketing. New Jersey: Prentice Hall International.
Peattie K and Peattie S (2009). Social Marketing: A Pathway to Consumption Reduction, Journal of Business
Research ,vol .62 ,Ishttp :/www .sciencedirect .com/science/article/B6V75...cb01bc5aa097590713c
Chandon Pierre, Wansink Brian andLaurent Gilles, A benefit congruency framework of sales promotion
effectiveness, Journal of Marketing, 64, 65-81 (2000)
Schultz DE, Robinson WA (1998). Sales Promotion Management. Crain Books, Chicago. Roger, D. B., Paul, W. M., & Engel, J. F. Consumer Behavior:The Dryden Press
Series in Marketing (9th ed.). Pennsylvania State University: Harcourt College Publishers. Shiffman, B., Cowley, O., Watson, & Kanuk. (2001). Consumer Behaviour (2nd ed.).
Sydney: Pearson Education.
Blattberg, R. C., Peacock, P., & Sen, S. K. (1976). Purchasing strategies Across
Product Categories. Journal of Consumer Research, 3, 369-377.
Yang, L. (2010). An examination of Sales Promotion Programs in Hongkong: What
retailers offer and what consumers prefer. Journal of Promotion Management,16(4), 467-479.
Aderemi S. A (2003). Marketing Principles and Practice. Mushin: concept Publication Limited. Kay, J. S. (1983). Foundations of Corporate Success; How business strategies add value. Oxford: Oxford
University Press.
Ohmae, K. (1985). Triad Power: The coming shape of Global Competition. New York: Free press.
Ikem, V. (2011). Nigeria is becoming one hell of a casino. TMKG Publishing Limited.


