
1
Safety of the Urban Freight
System: Key Performance
Indicators
NCDOT Project 2020-36
December 2020
Torrey Lyons, PhD
Noreen McDonald, PhD
Department of City and Regional Planning
University of North Carolina at Chapel Hill
2
Safety of the Urban Freight System: Key
Performance Indicators
NCDOT Research Program FY 2020 - Project Number 2020-036
Noreen McDonald (PI) and Torrey Lyons
Department of City and Regional Planning
University of North Carolina at Chapel Hill
Final Report
December 1, 2020
3
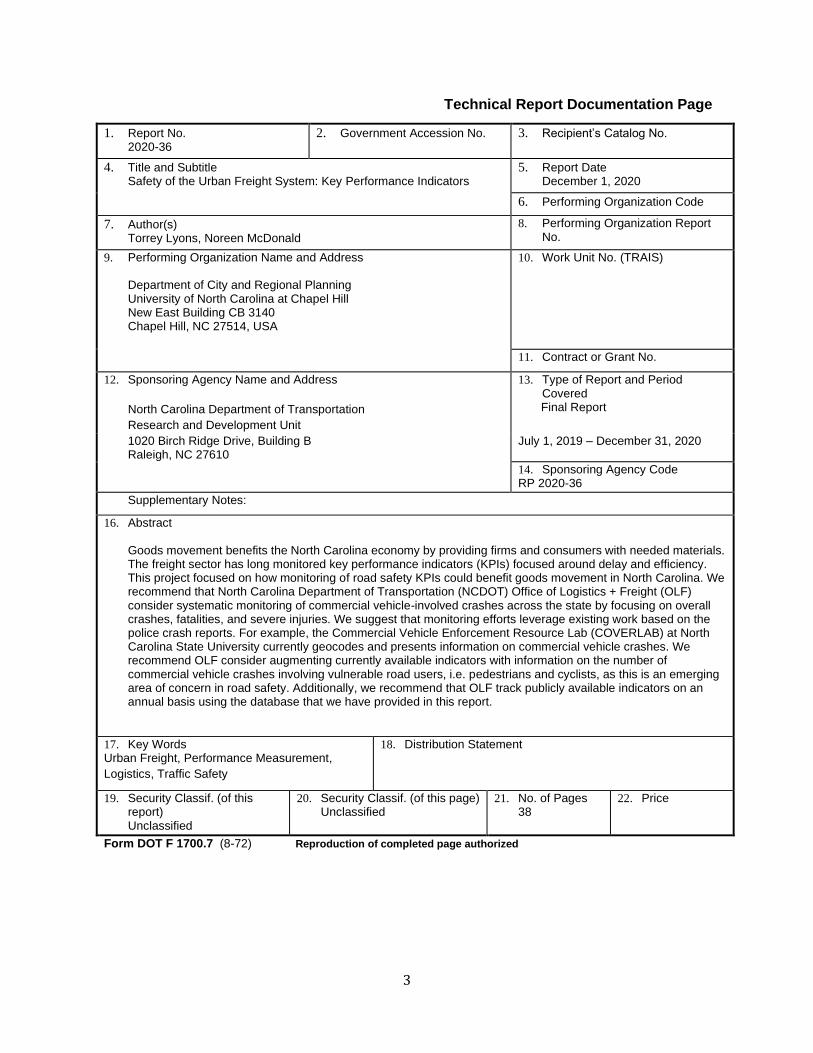
Technical Report Documentation Page
1. Report No. 2020-36
2. Government Accession No.
3. Recipient’s Catalog No.
4. Title and Subtitle Safety of the Urban Freight System: Key Performance Indicators
5. Report Date December 1, 2020
6. Performing Organization Code
7. Author(s) Torrey Lyons, Noreen McDonald
8. Performing Organization Report No.
9. Performing Organization Name and Address Department of City and Regional Planning University of North Carolina at Chapel Hill New East Building CB 3140 Chapel Hill, NC 27514, USA
10. Work Unit No. (TRAIS)
11. Contract or Grant No.
12. Sponsoring Agency Name and Address
North Carolina Department of Transportation
Research and Development Unit
13. Type of Report and Period Covered
Final Report
1020 Birch Ridge Drive, Building B Raleigh, NC 27610
July 1, 2019 – December 31, 2020
14. Sponsoring Agency Code RP 2020-36
Supplementary Notes:
16. Abstract Goods movement benefits the North Carolina economy by providing firms and consumers with needed materials. The freight sector has long monitored key performance indicators (KPIs) focused around delay and efficiency. This project focused on how monitoring of road safety KPIs could benefit goods movement in North Carolina. We recommend that North Carolina Department of Transportation (NCDOT) Office of Logistics + Freight (OLF) consider systematic monitoring of commercial vehicle-involved crashes across the state by focusing on overall crashes, fatalities, and severe injuries. We suggest that monitoring efforts leverage existing work based on the police crash reports. For example, the Commercial Vehicle Enforcement Resource Lab (COVERLAB) at North Carolina State University currently geocodes and presents information on commercial vehicle crashes. We recommend OLF consider augmenting currently available indicators with information on the number of commercial vehicle crashes involving vulnerable road users, i.e. pedestrians and cyclists, as this is an emerging area of concern in road safety. Additionally, we recommend that OLF track publicly available indicators on an annual basis using the database that we have provided in this report.
17. Key Words Urban Freight, Performance Measurement,
Logistics, Traffic Safety
18. Distribution Statement
19. Security Classif. (of this report)
Unclassified
20. Security Classif. (of this page) Unclassified
21. No. of Pages 38
22. Price
Form DOT F 1700.7 (8-72) Reproduction of completed page authorized

4
DISCLAIMER
The authors alone are responsible for the preparation and accuracy of the information, data,
analysis, discussions, recommendations, and conclusions presented herein. The contents do
not necessarily reflect the views, opinions, endorsements, or policies of the North Carolina
Department of Transportation or the U.S. Department of Transportation. The North Carolina
Department of Transportation makes no representation or warranty of any kind, and assumes
no liability therefore.

5
ACKNOWLEDGMENTS
The authors acknowledge the North Carolina Department of Transportation (NCDOT) for
funding this research, and the following individuals from NCDOT and other agencies on the
Technical Advisory Committee for helping to guide the research:
• Curtis Bradley, PhD, NCDOT
• Dana Magnolia, NCDOT
• Ahmed Zahrani, NCDOT
• Jessica Hill, Centralina Regional Council
• Tyler Meyer, Greensboro Urban Area MPO
Additionally, we acknowledge the Southeast Transportation, Research, Innovation,
Development and Education Center (STRIDE) for funding a related research project that
allowed additional analyses to be incorporated into this report.
6
Executive Summary
Goods movement benefits the North Carolina economy by providing firms and consumers with
needed materials. The freight sector has long monitored key performance indicators (KPIs)
focused around delay and efficiency. This project focused on how monitoring of road safety
KPIs could benefit goods movement in North Carolina. We recommend that North Carolina
Department of Transportation (NCDOT) Office of Logistics + Freight (OLF) consider systematic
monitoring of commercial vehicle-involved crashes across the state by focusing on overall
crashes, fatalities, and severe injuries. We suggest that monitoring efforts leverage existing
work based on the police crash reports. For example, the Commercial Vehicle Enforcement
Resource Lab (COVERLAB) at North Carolina State University currently geocodes and presents
information on commercial vehicle crashes. We recommend OLF consider augmenting currently
available indicators with information on the number of commercial vehicle crashes involving
vulnerable road users, i.e. pedestrians and cyclists, as this is an emerging area of concern in
road safety. Additionally, we recommend that OLF track publicly available indicators on an
annual basis using the database that we have provided in this report. Below, an abridged list of
those publicly available indicators is included, with the most recent data quantified for statewide
or regional geographies.
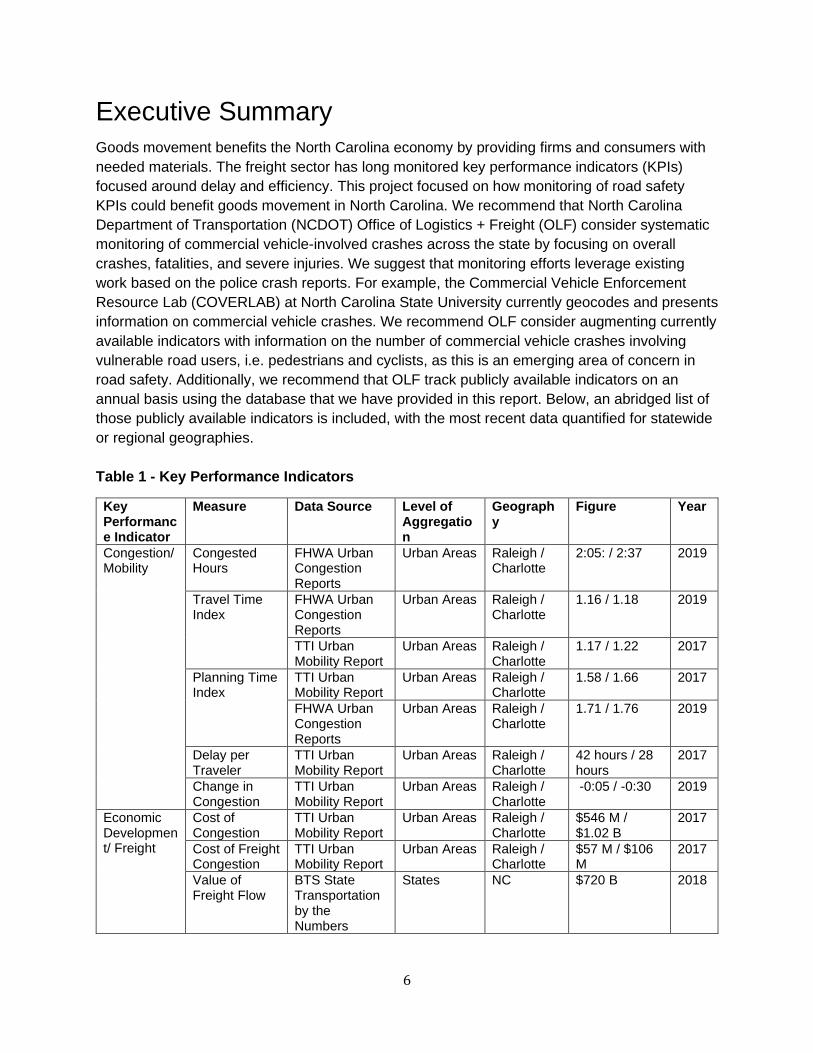
Table 1 - Key Performance Indicators
Key Performance Indicator
Measure Data Source Level of Aggregation
Geography
Figure Year
Congestion/Mobility
Congested Hours
FHWA Urban Congestion Reports
Urban Areas Raleigh / Charlotte
2:05: / 2:37 2019
Travel Time Index
FHWA Urban Congestion Reports
Urban Areas Raleigh / Charlotte
1.16 / 1.18 2019
TTI Urban Mobility Report
Urban Areas Raleigh / Charlotte
1.17 / 1.22 2017
Planning Time Index
TTI Urban Mobility Report
Urban Areas Raleigh / Charlotte
1.58 / 1.66 2017
FHWA Urban Congestion Reports
Urban Areas Raleigh / Charlotte
1.71 / 1.76 2019
Delay per Traveler
TTI Urban Mobility Report
Urban Areas Raleigh / Charlotte
42 hours / 28 hours
2017
Change in Congestion
TTI Urban Mobility Report
Urban Areas Raleigh / Charlotte
-0:05 / -0:30 2019
Economic Development/ Freight
Cost of Congestion
TTI Urban Mobility Report
Urban Areas Raleigh / Charlotte
$546 M / $1.02 B
2017
Cost of Freight Congestion
TTI Urban Mobility Report
Urban Areas Raleigh / Charlotte
$57 M / $106 M
2017
Value of Freight Flow
BTS State Transportation by the Numbers
States NC $720 B 2018
7
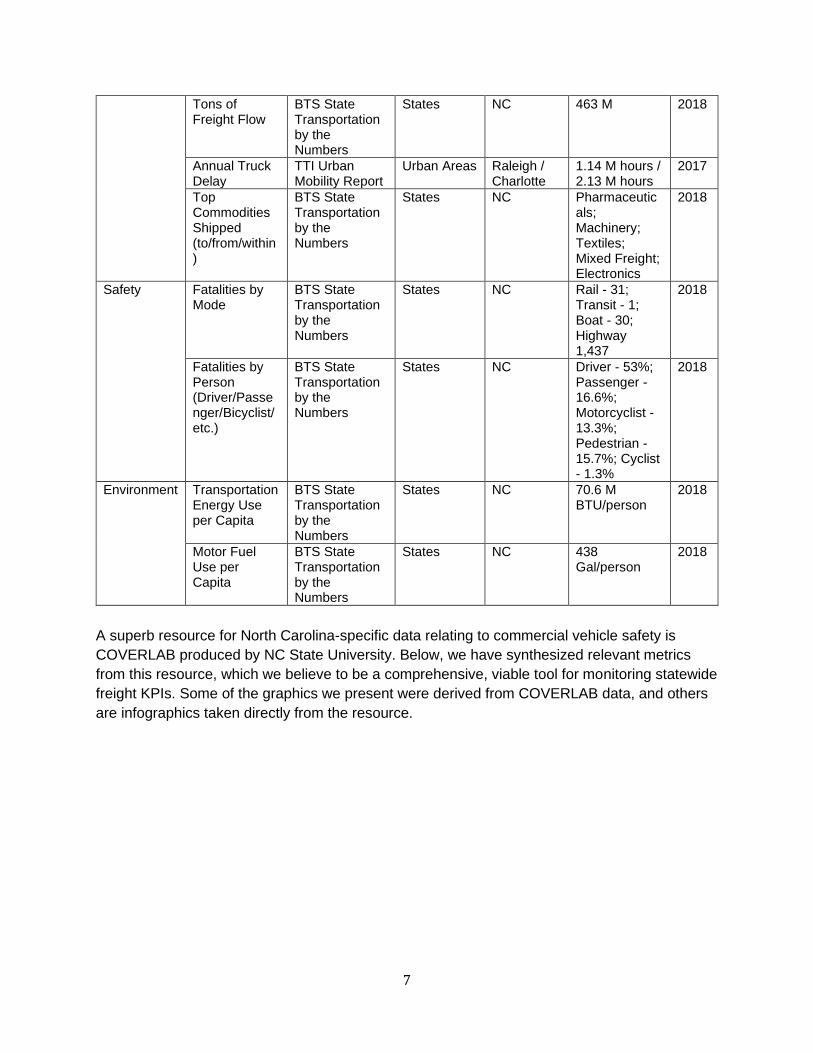
Tons of Freight Flow
BTS State Transportation by the Numbers
States NC 463 M 2018
Annual Truck Delay
TTI Urban Mobility Report
Urban Areas Raleigh / Charlotte
1.14 M hours / 2.13 M hours
2017
Top Commodities Shipped (to/from/within)
BTS State Transportation by the Numbers
States NC Pharmaceuticals; Machinery; Textiles; Mixed Freight; Electronics
2018
Safety Fatalities by Mode
BTS State Transportation by the Numbers
States NC Rail - 31; Transit - 1; Boat - 30; Highway 1,437
2018
Fatalities by Person (Driver/Passenger/Bicyclist/etc.)
BTS State Transportation by the Numbers
States NC Driver - 53%; Passenger - 16.6%; Motorcyclist - 13.3%; Pedestrian - 15.7%; Cyclist - 1.3%
2018
Environment Transportation Energy Use per Capita
BTS State Transportation by the Numbers
States NC 70.6 M BTU/person
2018
Motor Fuel Use per Capita
BTS State Transportation by the Numbers
States NC 438 Gal/person
2018
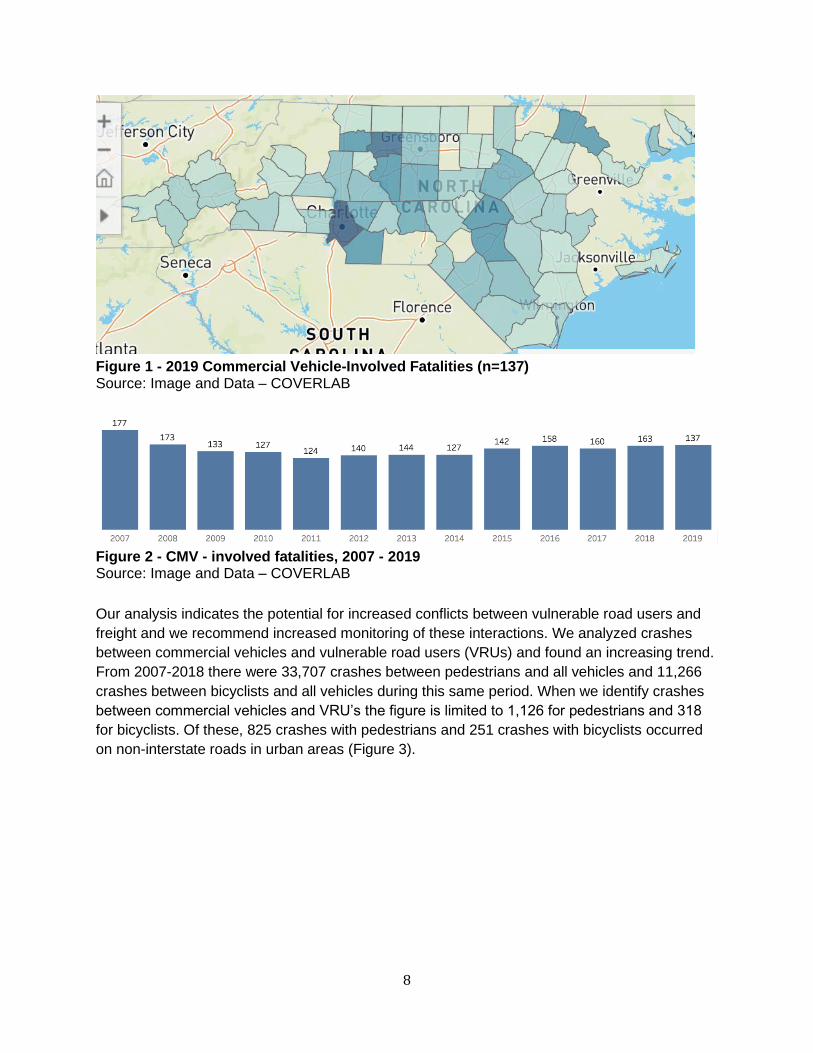
A superb resource for North Carolina-specific data relating to commercial vehicle safety is
COVERLAB produced by NC State University. Below, we have synthesized relevant metrics
from this resource, which we believe to be a comprehensive, viable tool for monitoring statewide
freight KPIs. Some of the graphics we present were derived from COVERLAB data, and others
are infographics taken directly from the resource.
8
Figure 1 - 2019 Commercial Vehicle-Involved Fatalities (n=137) Source: Image and Data – COVERLAB
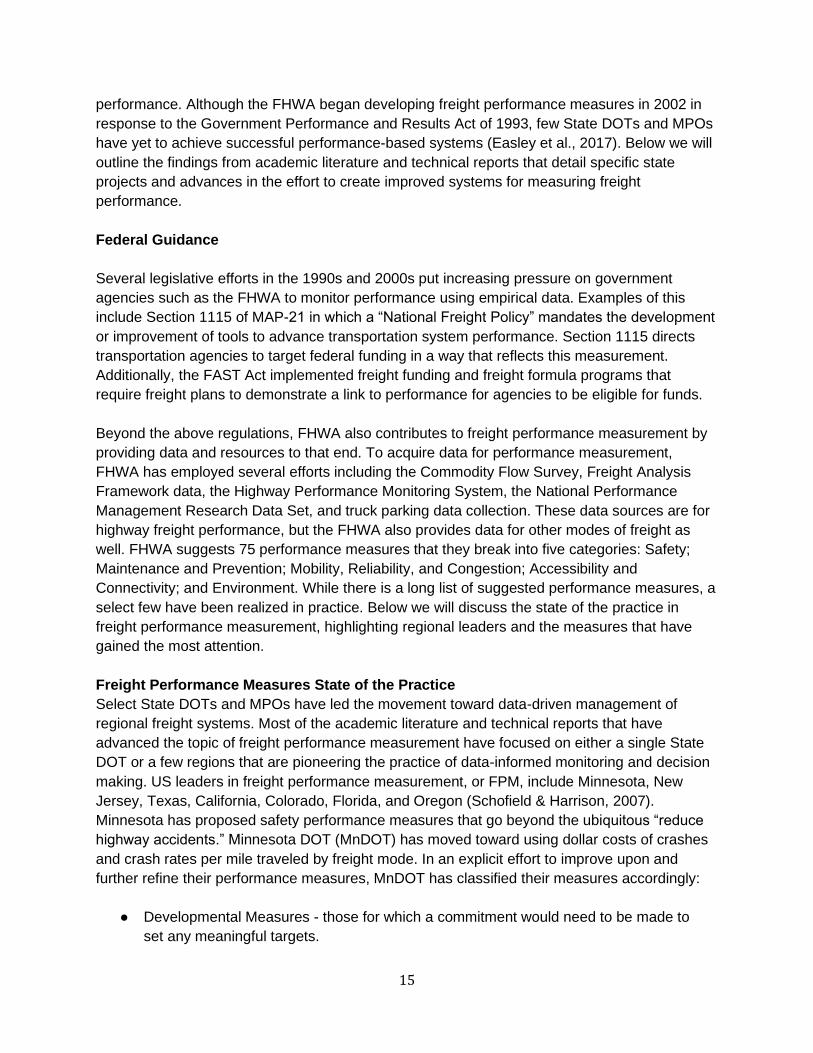
Figure 2 - CMV - involved fatalities, 2007 - 2019 Source: Image and Data – COVERLAB
Our analysis indicates the potential for increased conflicts between vulnerable road users and
freight and we recommend increased monitoring of these interactions. We analyzed crashes
between commercial vehicles and vulnerable road users (VRUs) and found an increasing trend.
From 2007-2018 there were 33,707 crashes between pedestrians and all vehicles and 11,266
crashes between bicyclists and all vehicles during this same period. When we identify crashes
between commercial vehicles and VRU’s the figure is limited to 1,126 for pedestrians and 318
for bicyclists. Of these, 825 crashes with pedestrians and 251 crashes with bicyclists occurred
on non-interstate roads in urban areas (Figure 3).

9
Figure 3 - VRU - Commercial Vehicle Crashes
Recommendations
We have four recommendations based on our research. These are described in Chapter 5.
Recommendation 1 – Utilize the COVERLAB Crash Visualization Tool
Recommendation 2 – Maintain Database of Publicly Available KPIs
Recommendation 3 – Focus on VRU-Commercial Vehicle Safety
Recommendation 4 – Establish a Working Group on Freight Safety Monitoring/Data Sharing
Plan

10
Table of Contents Executive Summary ................................................................................................................... 6
Chapter 1 – Background and Literature ....................................................................................14
Chapter 2 – KPI Matrix Assessment ..........................................................................................19
Chapter 3 – Quantified KPIs ......................................................................................................22
3.1 COVERLAB Monitoring Tools ..........................................................................................22
3.2 Quantifying KPIs from Identified Public Data Sources......................................................24
3.3 VRU-Commercial Vehicle Safety (Section 3.3 is a product of an ongoing study funded by
the Collaborative Sciences Center for Road Safety) ..............................................................25
Chapter 4 – Lessons from Interviews ........................................................................................33
Chapter 5 – Freight Monitoring Recommendations ...................................................................35
Appendix ...................................................................................................................................41

11
List of Tables
Table 1 - Key Performance Indicators .................................................................................... 6
Table 2 - Suggested Texas DOT FPMs ..................................................................................17
Table 3 - Summary of Safety Key Performance Indicators ..................................................20
Table 4 - Summary of Data Monitoring Needs ......................................................................21
Table 5 - Freight Key Performance Indicators ......................................................................25

12
List of Figures
Figure 1 - 2019 Commercial Vehicle-Involved Fatalities (n=137) .......................................... 8
Figure 2 - CMV - involved fatalities, 2007 - 2019 .................................................................... 8
Figure 3 - VRU - Commercial Vehicle Crashes ....................................................................... 9
Figure 4 - COVERLAB 2020 CMV - Involved Crashes ...........................................................22
Figure 5 - CMV - Involved Crashes - Wake County, 2020 .....................................................23
Figure 6 - Yearly Trend CMV - Involved Crashes - Wake County, 2020 ...............................23
Figure 7 - CMV - Involved Crashes Road Classification Proportions - Wake County, 2020
.................................................................................................................................................23
Figure 8 - Crash Reason - Wake County, 2020 ......................................................................24
Figure 9 - CMV High Crash Corridors ....................................................................................24
Figure 10 - Crash Severity by Crash Hour .............................................................................28
Figure 11 - Crash Severity by Year ........................................................................................28
Figure 12 - Charlotte VRU - Commercial Crashes and Freight Jobs ...................................29
Figure 13 - Charlotte VRU - Commercial Crashes and Population Density ........................30
Figure 14 - Raleigh/Durham/Chapel Hill VRU-Commercial Crashes and Freight Jobs ......30
Figure 15 - Raleigh / Durham / Chapel Hill VRU - Commercial Crashes and Pop Density .31
Figure 16 - VRU - Commercial Vehicle Crash Frequency by Month (Preliminary) ..............31

13
[This page intentionally left blank.]

14
Chapter 1 – Background and Literature
Freight Performance Measurement - Background
Goods movement has been a central element of urban areas for millennia. But the advent of
online shopping and technological advances in logistics are reshaping freight in urban areas
and bringing new safety concerns to the fore. North Carolina has seen increases in freight trips
and will likely also see new modes for last-mile delivery introduced in coming years. For
example, the move to 2-hour delivery windows in some parts of the state has increased freight
volumes and changed spatial patterns. As urban freight volumes are expected to rise, levels of
innovation are also rising. Governments and firms are looking for creative city logistics
strategies that allow for fast, reliable, and safe freight deliveries. The resulting goods movement
will impact all aspects of the transportation system including congestion, pollution, and road
safety making it an opportune time to study the topic.
A first step for transportation officials in dealing with emerging problems is to assess the current
situation. Once an assessment is made, goals can be put forward that shape policy funding
decisions. Effectively planning in a way that achieves those stated goals involves a framework
known as the “rational planning model.” The rational planning model is a foundational theory of
planning that has been applied widely and forms the basis of many standard practices in
transportation planning (Black, 1990). Although the model has been criticized as overly
simplistic and not bound by the realities of planning practice, the rational planning model
provides the overarching framework for performance measurement as a tool that agencies can
use to achieve their goals (R. Ewing, personal communication, April 15, 2020). The rational
planning model proceeds as follows:
Goals → Performance measures → Indicators/Data → Decisions
In response to growing demand for greater public accountability, performance measurement
has been standard practice in transportation planning for decades (MacDonald et al., 2004).
Many performance measures have become ubiquitous in transportation planning. Measures like
vehicle miles traveled, transit ridership, mode share, delay, level of service, etc. are all familiar
to transportation officials and planners.
Less commonly encountered, however, are freight performance measures. Moving Ahead for
Progress in the 21st Century (MAP 21) and the Fixing Americas Surface Transportation (FAST)
Acts are important enabling legislation that provide funding and frameworks for allocating those
funds for surface transportation in the US. Map 21 and the Fast Act require that the Federal
Highway Administration’s (FHWA) Office of Freight Management and Operations (OFMO) assist
Departments of Transportation (DOTs) and Metropolitan Planning Organizations (MPOs) in their
efforts to plan and monitor freight systems (Easley et al., 2017). The OFMO assists by providing
data, guidance, and processes for using data to meaningfully measure freight system
15
performance. Although the FHWA began developing freight performance measures in 2002 in
response to the Government Performance and Results Act of 1993, few State DOTs and MPOs
have yet to achieve successful performance-based systems (Easley et al., 2017). Below we will
outline the findings from academic literature and technical reports that detail specific state
projects and advances in the effort to create improved systems for measuring freight
performance.
Federal Guidance
Several legislative efforts in the 1990s and 2000s put increasing pressure on government
agencies such as the FHWA to monitor performance using empirical data. Examples of this
include Section 1115 of MAP-21 in which a “National Freight Policy” mandates the development
or improvement of tools to advance transportation system performance. Section 1115 directs
transportation agencies to target federal funding in a way that reflects this measurement.
Additionally, the FAST Act implemented freight funding and freight formula programs that
require freight plans to demonstrate a link to performance for agencies to be eligible for funds.
Beyond the above regulations, FHWA also contributes to freight performance measurement by
providing data and resources to that end. To acquire data for performance measurement,
FHWA has employed several efforts including the Commodity Flow Survey, Freight Analysis
Framework data, the Highway Performance Monitoring System, the National Performance
Management Research Data Set, and truck parking data collection. These data sources are for
highway freight performance, but the FHWA also provides data for other modes of freight as
well. FHWA suggests 75 performance measures that they break into five categories: Safety;
Maintenance and Prevention; Mobility, Reliability, and Congestion; Accessibility and
Connectivity; and Environment. While there is a long list of suggested performance measures, a
select few have been realized in practice. Below we will discuss the state of the practice in
freight performance measurement, highlighting regional leaders and the measures that have
gained the most attention.
Freight Performance Measures State of the Practice
Select State DOTs and MPOs have led the movement toward data-driven management of
regional freight systems. Most of the academic literature and technical reports that have
advanced the topic of freight performance measurement have focused on either a single State
DOT or a few regions that are pioneering the practice of data-informed monitoring and decision
making. US leaders in freight performance measurement, or FPM, include Minnesota, New
Jersey, Texas, California, Colorado, Florida, and Oregon (Schofield & Harrison, 2007).
Minnesota has proposed safety performance measures that go beyond the ubiquitous “reduce
highway accidents.” Minnesota DOT (MnDOT) has moved toward using dollar costs of crashes
and crash rates per mile traveled by freight mode. In an explicit effort to improve upon and
further refine their performance measures, MnDOT has classified their measures accordingly:
● Developmental Measures - those for which a commitment would need to be made to
set any meaningful targets.
16
● Emerging Measures - those for which data is available, but targets have yet to be set.
● Mature Measures - those for which data is available and targets have been set.
This is a helpful framework for considering the process of developing freight performance
measures. MnDOT Office of Freight and Commercial Vehicle Operations utilize automatic traffic
recorders (ATRs) and weigh-in-motion systems for measuring truck weights and identifying
freight vehicles using a state-wide system. Sensors for this system collect data on truck weights
and speeds throughout the state, but these systems are unable to estimate truck travel times
(Liao, 2014).
DOTs have also looked outside the US for examples of successful performance management
programs. Schofield & Harrison (2007) describe the use of probe cars in Japan. Probe vehicles
are typically public vehicles such as buses that are equipped with location devices to obtain
location and time data. Probe vehicles communicate with a network of data transceivers that
send these data to be processed and accumulated. These data can be used to determine travel
speeds and congestion levels. The richness of the data depends on the number of probe
vehicles communicating with the network. Schofield & Harrison (2007) suggest that probe
vehicles can be very useful in determining the effects of interventions on roadways, such as
capacity projects or new traffic treatments.
An important contribution to the discussion of freight performance measurement came from
Schofield & Harrison (2007). They highlight the elegance of a well-constructed freight
performance measure with the following statement:
“The nature of a good performance measure requires that it be easily
understandable and measurable, creating new clarity that eases communication
on all levels: agency to agency, planner to planner, and agency to the public.”
Pickerel & Neumann (2001) contend that difficulty in freight system management stems from the
need to identify measures that are both within the purview of public agencies, meaning that the
determinants of this metric are controllable by the agency, and are meaningful to private sector
stakeholders. In their recommendations to Texas DOT, Schofield & Murray suggest that the
most useful freight performance measures (FPMs) will be: capable of being measured; capable
of capturing deficiencies; capable of measurement over time; capable of being forecast; easy to
understand by decision makers/officials. The authors propose a set of FPMs for Texas that are
listed below in Table 2.

17
Table 2 - Suggested Texas DOT FPMs
Source: Schofield & Harrison (2007)
Despite FHWA’s efforts to provide data for freight system management, a persistent issue for
State DOTs and MPOs is the ability to access adequate and reliable data for performance
measures. Collecting data is a challenge for DOTs and MPOs as freight measures are often an
afterthought when designing transportation data collection systems and protocols for even the
most modern intelligent transportation systems (ITS). Another challenge they face is that some
of the best data are collected from private operators that are reluctant to give up their
information for competitive or privacy reasons. Geographic considerations also limit the viability
of private data for performance measurement, as carriers sometimes only operate in certain
regions or in specific corridors, requiring that transportation agencies aggregate multiple
sources in order to have a useful dataset. Finally, the validity of private data is hard to verify,
making decisions from these data circumspect (Liao, 2014).
Private freight companies can, however, be convinced to participate in freight system monitoring
by providing vehicle location data that they are already collecting for their own monitoring and
optimization purposes. Logistics firms are concerned with congestion because, for example, an
hour of truck delay costs an estimated $88 (Schrank et al. 2012). Just as important to these
companies is their ability to predict and account for inevitable delay. For this reason, they are
also concerned with travel time reliability. Two survey-based research efforts asked freight
carriers and planners about their top concerns with respect to operating and planning freight.
The areas of overlap between the findings of both studies are concerns regarding congestion
and travel reliability (Donath & Murray, 2005; Ostria, 2003). The issue of congestion was also
shown to be a major concern for carriers in California by Regan & Golob (1999). Some have
18
proposed using Global Positioning Systems (GPS) and other means of automatic vehicle
location be provided to transportation agencies so that they can be aggregated into meaningful
evaluations of congestion and travel speed conditions (Jones & Sedor, 2006; Turner et al.,
2011). Coordinating and sharing data with State DOTs and MPOs allows private firms to
participate in performance measurement so that these partnerships can lead to targeted
programs and investments that mitigate congestion and unreliable travel times.
As is true in all scientific measurement, a triangulation from multiple data sources is the best
practice in freight performance measurement. Turner et al. (2011) recommend a blend of private
sector vehicle location data with public traffic volume data for a more nuanced measure of travel
time reliability. Public traffic data might include traditional volume counts or more sophisticated
data sources such as information from regional ITS or the Mobility Monitoring Program
(Harrison et al., 2006). Some researchers have proposed other more state-of-the-art data
collection schemes like the use of probe vehicles for dynamic monitoring of real-time travel
speed and congestion information (Zhao et al., 2013; Schofield & Harrison, 2007).
Measuring Safety
Based on the above advancements in performance measurement in alignment with the
motivations of the freight industry and its regulators, the most effort has been made in response
to the conditions that limit freight efficiency. The performance measures that have been
discussed most often in the academic literature and technical reports relate to congestion: travel
times, delay, and travel time reliability. Congestion measures were mentioned in all the literature
that we reviewed, although according to FHWA this is only part of the spectrum of suggested
freight system monitoring. While some additional economic and environmental measures are
occasionally discussed, safety is surprisingly lacking from the discussion of freight system
performance. Even FHWA guidelines for freight safety measures include the value of goods lost
due to crashes; further evidence of the motivations behind suggested performance measures.
When one evaluates the prominence of safety within the context of the four other performance
categories, FHWA provides 18 possible measures out of the total 75 (Easley et al., 2017). This
demonstrates that the federal authorities expect a reasonable proportion of transportation
agencies’ attention to be given to safety, among other performance concerns. Analyzing the
literature beyond the policy documents provided by FHWA, we see that only one research effort,
Schofield & Harrison (2007), proposed safety performance measures. This indicates that there
are limited examples, aside from MnDOT’s program, for transportation agencies to follow if they
hope to incorporate safety considerations into their freight system monitoring. This study will
help to ameliorate this issue by developing and refining new indicators of safety performance.
We will explore potential data sources and measurement techniques to evaluate the current
safety conditions within the State of North Carolina. Finally, we will produce recommendations
and protocols for continuing to monitor safety in a way that is informative for freight planning and
decision making.

19
Chapter 2 – KPI Matrix Assessment
Identifying Key Performance Indicators
To identify key performance indicators (KPIs) for freight system monitoring, we underwent an
iterative three-stage process. First, we consulted the academic and grey literature of published
journal articles and technical reports related to performance measurement of freight systems.
Next, we consulted the resources that are available from federal agencies, such as the Federal
Highway Administration, that provided policy guidance, best practices, and data sources for
state-level freight system monitoring. Finally, we interviewed local experts to identify how they
are assessing freight performance as well as to determine specific needs for future monitoring.
Lessons from Literature in Brief
The academic and grey literature relating to measuring freight performance is quite limited.
Much of the literature came in response to changes mandated by Map 21 and the Fast Acts
requiring performance-based transportation planning. Researchers proposed a litany of
performance measures for freight planning, most of which, however, were concerned with
congestion and travel time reliability. Much less attention has been given to the monitoring of
freight-related safety metrics. Among those that have been suggested in the limited research
are accidents, fatality rates, and insurance costs (Jones & Sedor, 2006; Harrison et al., 2006).
One potential lack of focus on freight safety is the assumption that freight safety concerns are
adequately addressed through broader efforts to improve highway safety. The larger field of
highway safety research has produced a profusion of metrics and data sources for assessing,
monitoring, and improving safety. While lessons can certainly be learned from this larger area of
research, there is a need for more efforts to establish better metrics for monitoring freight-
specific safety issues. For more information on freight performance measures, please see Table
1 and Appendix Items 1 and 2. A complete literature review can also be found in the appendix.
KPIs—Existing Measures and Data
As is evident in the literature, most of the attention in freight planning has been given to
congestion and reliability freight measure. There is some convention, however, for measuring
freight safety as well. Table 1 list accidents as an important indicator of freight safety for which
we provide several specific metrics. The most common accident related metric are crash
counts, as there are regular protocols for reporting crashes by responding police officers. The
resulting crash reports, however, are not always digitized and easy to access, especially when
trying to tease out freight-specific measures. There are several excellent resources within North
Carolina, produced by the efforts of many different research centers. In Table 1, we highlight
two of such efforts. First is the Commercial Vehicle Enforcement Resource Lab (COVERLAB),
produced by the Institute for Transportation Research and Education at North Carolina State
University. COVERLAB provides safety-related statistics for commercial vehicles in North
Carolina. Their interactive data visualizations include figures for commercial vehicle-involved

20
crashes at varying geographies and temporal scales. This is a very useful resource that can be
easily integrated into regional and State freight planning efforts.
Another important indicator, novel to this study, is crashes between vulnerable road users and
freight vehicles. With the help of partners at the Highway Safety Research Center at the
University of North Carolina and the North Carolina Department of Transportation, we have
compiled a dataset of geocoded crashes between these modes as well as characteristics of the
environments around the crashes. These data can be used to describe trends in crashes
between freight vehicles and vulnerable road users over time, as well as identify locations
where these crashes might be happening more frequently. We will describe our analysis in more
detail later in the report.
The table below details safety KPIs identified consistently in the literature, from federal
agencies, and by NC freight experts. Further detail on source and data availability are available
in the appendix.
Table 3 - Summary of Safety Key Performance Indicators
Indicator Example Metrics Best NC Data Source
Accidents Crash Counts; Crashes by Mode; Commercial Vehicle Crashes; Commercial Vehicle Injuries; Commercial Vehicle-Vulnerable Road User Crashes
NCDOT Crash Database; COVERLAB; Bureau of Transportation Statistics;
Fatality Rates Highway Fatalities; Commercial Vehicle Fatalities; Commercial Vehicle-Involved Fatal Crash Counts
NCDOT Crash Database; COVERLAB
Insurance Costs Annual Cost per Truck American Trucking Association Survey
Parking Number of Truck Parking Spaces
Unavailable
The above resources cover many of the data needs for monitoring key performance indicators
of freight safety, with a few exceptions. The literature review and interviews identified two freight
indicators for which we were not able to find reliable data. Insurance costs, suggests Harrison et
al. (2006), are an effective proxy for freight safety as premiums will increase as more crashes
occur. The American Trucking Association (ATA) conducts annual surveys that include
questions about insurance costs, however the results of the survey are proprietary and are not
made available to the public. It is possible the State could license these data from the ATA and
distribute them to regional transportation planners for freight system monitoring. Truck parking is
another missing piece of data for freight safety monitoring that we have identified. Our
interviews suggested that truck parking was a major concern to officials in North Carolina.
Federal safety regulations mandate that freight operators get specified amounts of rest each

21
day, and for this to happen in a safe way for operators and other motorists, adequate truck
parking spaces need to be located along established freight corridors. We are not aware of any
inventory of truck parking spaces in North Carolina. Monitoring this indicator would require
establishing such an inventory as well as occasional occupancy surveys to determine whether
the supply of truck parking spaces are adequate. Below, Table 4 includes a summary of data
monitoring needs.
Table 4 - Summary of Data Monitoring Needs
Metrics Potential Measures Potential Data Sources
Truck Parking Truck Parking Total Inventory Survey of Municipalities; Field Studies
Truck Parking Occupancy Survey of Firms/Operators; Field Studies
Vulnerable Road User Conflicts
VRU-Freight Crash Counts NCDOT Crash Database
VRU-Freight Fatalities NCDOT Crash Database

22
Chapter 3 – Quantified KPIs
3.1 COVERLAB Monitoring Tools
The best publicly available resource for monitoring freight safety in North Carolina is provided by
the Commercial Vehicle Enforcement Resource Lab (COVERLAB) in collaboration with the
Institute of Transportation Research and Education at NC State University. This web-based
portal provides maps and data visualizations of commercial vehicle-involved crashes throughout
North Carolina. Because we believe that this resource is a viable zero-cost solution for NCDOT
to monitor freight system safety, we will detail below the features and basic usage of the portal.
The most rich element of the resource can be found by navigating to
https://coverlab.org/visualizations/interactive-visualization/ or via their homepage by clicking on
the “Data Visualizations” tab and selecting “CMV Crash Visualization.” Below is an image of the
site from which a wide variety of data aggregations and visualizations can be produced with
ease.
Figure 4 - COVERLAB 2020 CMV - Involved Crashes
One can select from several filters including crash year, location, and reporting agency. Crash
locations, or rather aggregation levels, can include statewide, counties, troops, troop districts,
LEL regions, and planning organizations.
The visualization tool includes five performance metrics that can be selected individually:
commercial vehicle (CMV)-involved crashes; property damage only CMV-involved crashes;
CMV-involved injuries; CMV-involved fatal crashes; and CMV-involved fatalities. These are all
unique and useful metrics that are measured and reported at different geographic aggregations
from 2007 to near present with this tool. The tool will produce counts, infographics, and maps of
all five measures for any of the above-mentioned years. It will even produce graphics, maps and
23
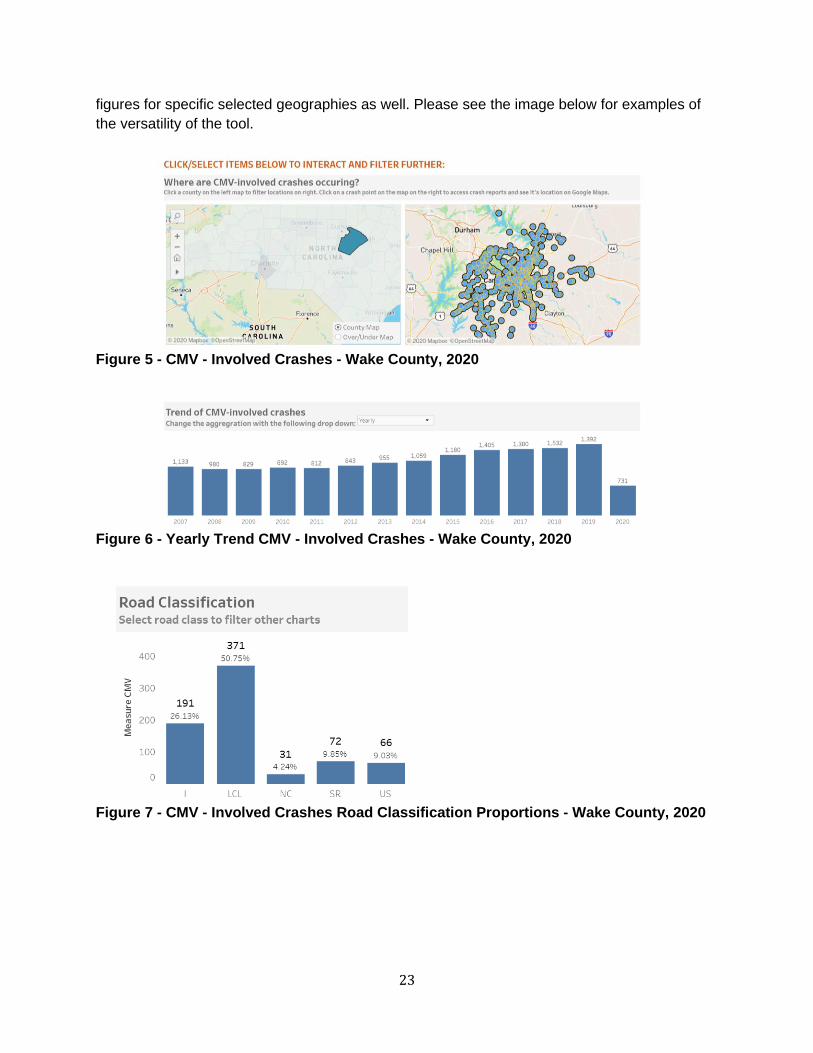
figures for specific selected geographies as well. Please see the image below for examples of
the versatility of the tool.
Figure 5 - CMV - Involved Crashes - Wake County, 2020
Figure 6 - Yearly Trend CMV - Involved Crashes - Wake County, 2020
Figure 7 - CMV - Involved Crashes Road Classification Proportions - Wake County, 2020

24
Figure 8 - Crash Reason - Wake County, 2020
Finally, in addition to the data visualization portal, COVERLAB also produces a “CMV High
Crash Corridors” mapping tool for identifying where CMV crashes are happening, with respect
to road segments, most frequently. This tool does not allow the user to change geography or
select for specific years, but instead is intended to quickly identify problem areas within the
state. Below we present an image from the mapping tool.
Figure 9 - CMV High Crash Corridors
3.2 Quantifying KPIs from Identified Public Data Sources
After we identified KPIs and determined the availability of data, we quantified them using
existing public data sources that are regularly updated. In the below table we present quantified
KPIs from public data sources with links to those data sources, the geographies at which they
are quantified, the values of the KPI, and the year for which they are most recently measured.
This table is slightly abridged for readability within the report, and a more detailed table with
additional fields is included in the appendix.

25
Table 5 - Freight Key Performance Indicators
3.3 VRU-Commercial Vehicle Safety (Section 3.3 is a product of an ongoing study
funded by the Collaborative Sciences Center for Road Safety)
3.3.1 INTRODUCTION Trends in consumer preference and retail have led to a boom in e-commerce. Impacts of
this change are felt widely but are especially apparent in the transport sector. This new model of
consumption has increased the volume of heavy and light goods vehicles in urban areas
including residential areas. Transportation planners, local officials, the public, and the media
have been debating the impacts of our increased reliance on commercial vehicles for last-mile
delivery. Researchers have analyzed congestion impacts, air pollution and greenhouse gas
emissions, noise pollution, road safety, and curb management strategies to increase delivery
efficiency (Allen et al., 2017; Callahan, 2019; Duhigg, 2019; Giordani et al., 2018; Ranieri et al.,
2018).
Recent media coverage of the impacts of online delivery has highlighted conflicts
between freight vehicles and vulnerable road users – pedestrians and bicyclists (Callahan,
2019; Haag & Hu, 2019; Gilbert, 2020). Researchers and planners have long advocated for
policies and infrastructure investments that promote bicycling and walking as alternatives to
automobile transport, citing reductions in externalities related to automobile travel such as air
pollution, carbon emissions, congestion, and noise (Pucher & Buehler, 2017; Cavill et al., 2006;
Godlee, 1992; OECD, 2004). Research suggests that targeted efforts to promote active
transportation are changing travel behavior, at least in areas where these policies are present
(Ogilivie et al., 2004). While we know that the potential for interactions between commercial
vehicles and vulnerable road users is rising, there has been little empirical work examining
safety issues specifically between these cohorts within metropolitan areas.
This study describes the spatial and temporal patterns of freight vehicle interactions with
VRU in urban areas of North Carolina to provide a knowledge base and assess strategies to
reduce risks for VRU and freight vehicle drivers. We focus on the following research questions:
• What are the spatial and temporal trends in VRU/freight vehicle crashes?
• What are the crass-level characteristics associated with VRU/freight crashes?
Key Performance Indicator Measure Link Geography Figure Year
https://ops.fhwa.dot.gov/perf_measurement/ucr/reports/fy2019_q4.pdfRaleigh / Charlotte 2:05: / 2:37 2019
https://ops.fhwa.dot.gov/perf_measurement/ucr/reports/fy2019_q4.pdfRaleigh / Charlotte 1.16 / 1.18 2019
https://mobility.tamu.edu/umr/congestion-data/Raleigh / Charlotte 1.17 / 1.22 2017
https://mobility.tamu.edu/umr/congestion-data/Raleigh / Charlotte 1.58 / 1.66 2017
https://ops.fhwa.dot.gov/perf_measurement/ucr/reports/fy2019_q4.pdfRaleigh / Charlotte 1.71 / 1.76 2019
Delay per Traveler https://mobility.tamu.edu/umr/congestion-data/Raleigh / Charlotte 42 hours / 28 hours 2017
Change in Congestion https://mobility.tamu.edu/umr/congestion-data/Raleigh / Charlotte -0:05 / -0:30 2019
Cost of Congestion https://mobility.tamu.edu/umr/congestion-data/Raleigh / Charlotte $546 M / $1.02 B 2017
Cost of Freight Congestion https://mobility.tamu.edu/umr/congestion-data/Raliegh / Charlotte $57 M / $106 M 2017
Value of Freight Flow https://www.bts.dot.gov/sites/bts.dot.gov/files/states2020/North_Carolina.pdfNC $720 B 2018
Tons of Freight Flow https://www.bts.dot.gov/sites/bts.dot.gov/files/states2020/North_Carolina.pdfNC 463 M 2018
Annual Truck Delay https://mobility.tamu.edu/umr/congestion-data/Raleigh / Charlotte 1.14 M hours / 2.13 M hours 2017
Top Commodoties Shipped (to/from/within) https://www.bts.dot.gov/sites/bts.dot.gov/files/states2020/North_Carolina.pdfNC Pharmaceuticals; Machinery; Textiles; Mixed Freight; Electronics2018
Fatalities by Mode https://www.bts.dot.gov/sites/bts.dot.gov/files/states2020/North_Carolina.pdfNC Rail - 31; Transit - 1; Boat - 30; Highway 1,4372018
Fatalities by Person (Driver/Passenger/Bicyclist/etc) https://www.bts.dot.gov/sites/bts.dot.gov/files/states2020/North_Carolina.pdfNC Driver - 53%; Passenger - 16.6%; Motocyclist - 13.3%; Pedestrian - 15.7%; Cyclist - 1.3%2018
Transportation Energy Use per Capita https://www.bts.dot.gov/sites/bts.dot.gov/files/states2020/North_Carolina.pdfNC 70.6 M BTU/person 2018
Motor Fuel Use per Capita https://www.bts.dot.gov/sites/bts.dot.gov/files/states2020/North_Carolina.pdfNC 438 Gal/person 2018
Congested Hours
Travel Time Index
Economic Development/Freight
Environment
Congestion/Mobility
Safety
Planning Time Index

26
3.3.2 METHODS 3.3.2.1 Study Area
For this analysis we focus on non-interstate crashes involving vulnerable road users and
commercial vehicles that occur within census-defined urban areas in North Carolina. We focus
on non-interstate urban areas because the policy discussion of how to decrease dangerous
interactions between VRU and freight vehicles has focused in these environments. We selected
North Carolina as a convenience sample where the research team had strong knowledge of and
access to road safety data. However, North Carolina represents a wide range of environments
which will provide important context for broader interpretation of our results.
3.3.2.2 Data and Measurement
For the purpose of this study, we have defined vulnerable road users (VRUs) as
bicyclists and pedestrians. Some authors have been more inclusive with their definition of
VRUs, sometimes including motorcycles, mopeds, and other non-enclosed modes of transport
(Constant & Lagarde, 2010; WHO, 2009). We believe that motorized modes are categorically
different than bicyclists and pedestrians, and as such, conclusions from a combined sample
would be difficult to interpret for meaningful policy or infrastructure interventions.
We define likely freight vehicles as those categorized in police crash reports as light
trucks (mini-van/panel), single unit trucks (2-axel, 6-tire), single unit trucks (3 or more axels),
tractor/doubles, tractor/semi-trailers, truck/tractors, truck/trailers, unknown heavy trucks, and
common cargo vans. While recent innovations in last-mile delivery have greatly expanded the
variety of vehicles used for commercial purposes, we limited our van category to cargo-style
models that are not likely to carry passengers. This included 16 sub-models by four automakers
that we identified via their vehicle identification numbers (VIN). The other vehicle type
classifications are made by police officers on the scene, and do not necessarily reflect a
scientific designation protocol. Previous studies have focused on large freight vehicles, typically
heavy trucks (Roudsari et al., 2004; Kim et al., 2006; Ma et al., 2014; McCarthy & Gilbert, 1996;
Pokorny et al., 2017). We include a broader range of commercial vehicles with the knowledge
that changing delivery patterns and practices requires a broader operationalization of freight
vehicles. Recent research by Lyons & McDonald (2020) shows that freight carriers are
increasingly using delivery vans and other smaller vehicles for urban freight delivery.
Our data are a sample of crashes throughout North Carolina from 2007 to 2018. Each
observation in our sample represents a single crash. There are associated crash characteristics
that relate to vehicles and individuals, but the observation, frequencies, and visualizations
represent crashes. The sample has been limited to crashes between vulnerable road users and
commercial vehicles, as defined above. We select crashes that occur on non-interstate roads
within urban areas. Our sample of VRU-cargo van crashes has a more limited temporal extent,
representing only 2011-2018. Because of the more recent addition of these types of vehicles to
the commercial fleet, and based on our analysis of the data, we expect that our sample contains
most of this type of accident occurring in North Carolina. The data come from digitized crash
reports that have been geocoded by the Institute for Transportation Research and Education at
North Carolina State University. The data include crash-specific variables that measure aspects
of the individuals involved, the vehicles, the crash site and immediate surroundings, and the

27
conditions at the time of the crash. From 2007-2018 there were 33,707 crashes between
pedestrians and all vehicles and 11,266 crashes between bicyclists and vehicles during this
same period. When we identify crashes between commercial vehicles and VRU’s the figure is
limited to 1,126 for pedestrians and 318 for bicyclists. Finally, we selected only VRU-commercial
vehicle crashes that occurred on non-interstate roads in urban areas, leaving 825 crashes with
pedestrians and 251 crashes with bicyclists. There were an additional 51 crashes between
qualifying cargo vans and VRU’s that met all the above criteria.
3.3.2.3 Analysis:
Descriptive Analysis
We begin by exploring the data using descriptive analysis. We use crosstabulations and
pivot tables to observe patterns and associations between specific variables of interest. Given
the limited size of our sample, some relationships will not demonstrate significant relationships
in inferential models, but trends and associations can still provide meaningful context. Next, we
map crashes to observe spatial patterns for certain crash types. We map crashes between
VRU’s and commercial vehicles for the two largest North Carolina regions: Charlotte, and
Raleigh/Durham/Chapel Hill. Finally, we conduct a time series analysis of monthly VRU-
commercial vehicle crashes to determine if there is a significant trend over the study period and
how it varies monthly and seasonally.
Modeling
We estimate two logistic regression models to assess the determinants of crash severity
in crashes between VRUs and commercial vehicles. To add nuance to our understanding of the
determinants of crash severity, we estimate the same model using two different outcome
variables: severe crashes and fatal crashes. Severe crashes are those in which the VRU was
classified in the crash report as a “Suspected Serious Injury” or “Killed.” Fatal crashes are those
in which the VRU was classified as “Killed.” Given the fact that crash reports are completed on
the scene or shortly thereafter, it is possible that some crashes categorized as “Suspected
Serious Injury” could have resulted in a subsequent fatality, where the victim later died as a
result of injuries from the crash. We select our logistic regression model using a stepwise model
selection process considering model fit, face validity, and significance of relationships as criteria
for inclusion of independent variables.
3.3.3 RESULTS 3.3.3.1 Descriptive Analysis
We start by presenting crosstabulations of variables of interest with crash severity.
Figure 10 describes crash counts by hour of the day for each level of crash severity. This
crosstabulation of crash hour and crash severity indicates that there is a higher frequency of
minor crashes in the 12-hour period from 8:00 AM to 8:00 PM. More serious crashes involving
suspected serious injuries or fatalities are more evenly spread throughout the 24-hour period,
with the distribution most even for fatal crashes.

28
Figure 10 - Crash Severity by Crash Hour
Below, Figure 11 describes yearly crash counts by crash severity. We see two peaks in
total crashes, first in 2008 and next in 2014. This does not conform with our expectation that as
urban freight and home deliveries have increased there would be a corresponding increase in
VRU-freight vehicle crashes.
Figure 11 - Crash Severity by Year
3.3.3.2 Spatial Analysis
We map VRU-commercial vehicle crashes for the two largest regions in North Carolina
below. We have shaded census tracts by population density and freight jobs to explore whether
there are observable patterns in crash frequency for areas with high freight-producing economic
0102030405060708090
12
:00
:00
AM
1:0
0:0
0 A
M
2:0
0:0
0 A
M
3:0
0:0
0 A
M
4:0
0:0
0 A
M
5:0
0:0
0 A
M
6:0
0:0
0 A
M
7:0
0:0
0 A
M
8:0
0:0
0 A
M
9:0
0:0
0 A
M
10
:00
:00
AM
11
:00
:00
AM
12
:00
:00
PM
1:0
0:0
0 P
M
2:0
0:0
0 P
M
3:0
0:0
0 P
M
4:0
0:0
0 P
M
5:0
0:0
0 P
M
6:0
0:0
0 P
M
7:0
0:0
0 P
M
8:0
0:0
0 P
M
9:0
0:0
0 P
M
10
:00
:00
PM
11
:00
:00
PM
Crash Frequencies by Time of Day
Minor/Possible/No Injury Severe/Fatal
0
10
20
30
40
50
60
70
2007 2008 2009 2010 2011 2012 2013 2014 2015 2016 2017 2018
Crash Frequency by Severity and Year
Minor/Possible/No Injury Severe/Fatal
29
activity or high general trip-producing activity. We use the Work Area Characteristics subset of
Longitudinal Employer-Household Dynamics (LEHD) Origin Destination Employment Statistics
to determine the number of freight-producing jobs per census tract. Of the 20 employment
categories provided by the LEHD data, we include jobs from the following four categories:
Manufacturing; Wholesale Trade; Retail Trade; and Transportation and Warehousing. Below,
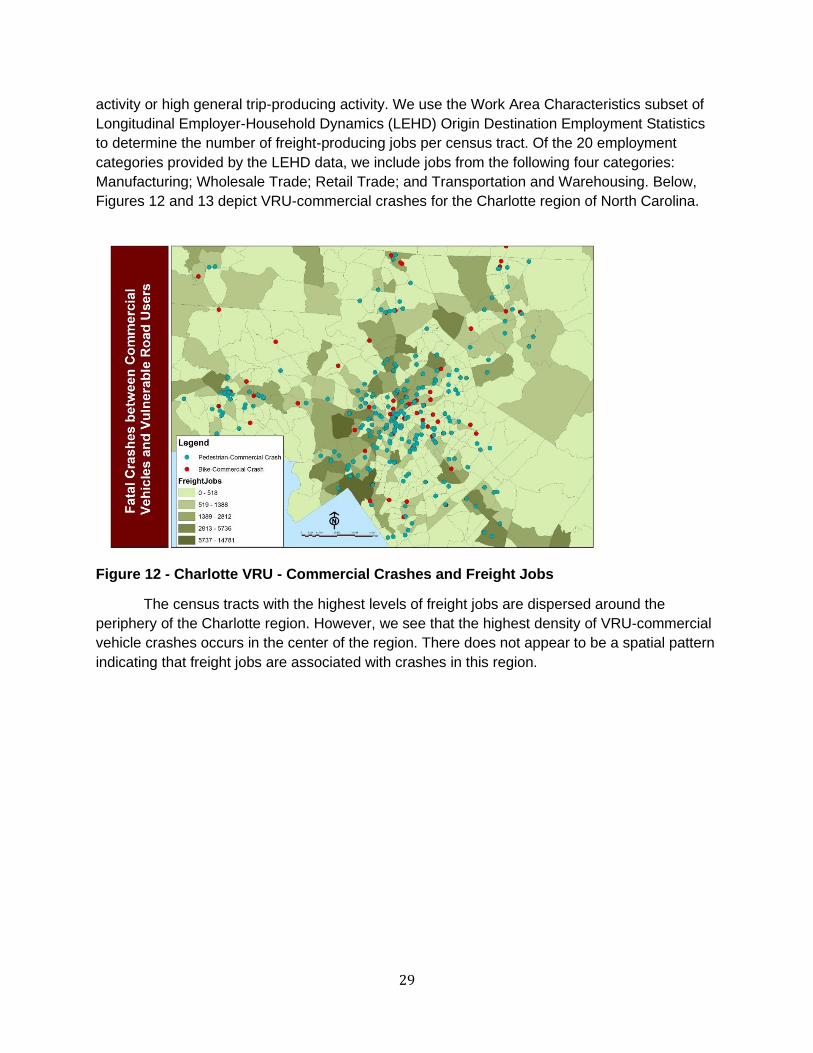
Figures 12 and 13 depict VRU-commercial crashes for the Charlotte region of North Carolina.
Figure 12 - Charlotte VRU - Commercial Crashes and Freight Jobs
The census tracts with the highest levels of freight jobs are dispersed around the
periphery of the Charlotte region. However, we see that the highest density of VRU-commercial
vehicle crashes occurs in the center of the region. There does not appear to be a spatial pattern
indicating that freight jobs are associated with crashes in this region.

30
Figure 13 - Charlotte VRU - Commercial Crashes and Population Density
We see that population density is higher near the center of the region. There appears to
be a spatial relationship between crash density and population in Charlotte. It is important to
note, however, that this apparent relationship is not proven statistically, however. We are simply
stating that there is an apparent association visible in this map. Below, Figures 14 and 15
explore these patterns for the Raleigh/Durham/Chapel Hill (Research Triangle) region.
Figure 14 - Raleigh/Durham/Chapel Hill VRU-Commercial Crashes and Freight Jobs

31
Figure 15 - Raleigh / Durham / Chapel Hill VRU - Commercial Crashes and Pop Density
Like what we observed in the Charlotte region, the Research Triangle region seems to
display little or no spatial relationship between freight jobs and VRU-commercial crashes. We do
observe an apparent association between population density and crashes.
3.3.3.3 Time Series Analysis
We plot the time series of VRU-freight crash counts per month in Figure 16 below. One
can observe a somewhat irregular seasonal trend in these crashes, with dramatic peaks around
2016 and continuing higher peaks in the following years. The R package “forecast” identifies the
overall trend as well as the seasonal variation to predict crash counts for 20 months past the
end of the data. Figure 16 depicts the time series plot of monthly crash counts as well as a
forecast for monthly crash counts through 2022. The overall trend is significant (t=2.79, p=0.01),
suggesting a 2% increase in crashes per year. This 2% increase is much smaller than what was
observed by McDonald et al. (2019). Beyond the overall trend however, none of the yearly
variation was significant.
Figure 16 - VRU - Commercial Vehicle Crash Frequency by Month (Preliminary)
32
3.3.4 CONCLUSION AND LIMITATIONS This paper examines crashes between vulnerable road users (VRUs) and commercial
vehicles. We define VRUs as pedestrians and bicyclists and commercial vehicles as large
trucks and cargo vans. We analyze data taken from police crash reports and geocoded for the
entire State of North Carolina. Our data represent all VRU-commercial vehicle crashes from
2007 to 2018. We analyze the data using descriptive statistics, mapping, time series analysis,
and logistic regression. The mapping indicates little to no spatial association between VRU-
commercial vehicle crashes and freight-producing jobs. We do see, however, some apparent
association between population density and clustering of crashes. Our time series analysis
indicated that over the 12-year study period, there has been a statistically significant increase in
these crashes. The increase predicted by the time series model is approximately 2% per year,
with slight deviations from that trend that did not prove to be significant.
33
Chapter 4 – Lessons from Interviews
To achieve a more nuanced understanding of the state of freight planning and measurement in
North Carolina, we interviewed key informants that are participating in local and regional freight
planning efforts. We interviewed three individuals from two different planning agencies and
reviewed documents that further detailed the topics from our interviews. We conducted semi-
structured interviews with 10 questions that covered the state of freight planning in North
Carolina, current practices for monitoring freight safety, problems that the informants observed
with the freight system, and suggestions for future freight monitoring practices. In the below
paragraph we succinctly synthesize our findings from these interviews. The interview questions
and edited interview notes can be found in the appendix.
We started interviews by asking informants how they saw their agencies’ role in planning for
freight as well as how they collaborated with other regional actors. We found that, at least with
the agencies that we covered, there was a robust framework for interagency collaboration over
freight. An example of this collaborative freight planning process in North Carolina is the Greater
Charlotte Freight Mobility Plan (GCFMP) published in 2016. The GCFMP is unique, not only in
its pioneering of a regional effort to vision, measure, monitor, and improve freight mobility, but
also in its coordination with an exhaustive set of stakeholders. Contributors to the GCFMP
process included representatives from federal agencies, state (North Carolina and South
Carolina) DOTs, five different MPOs, local governments, local economic development
organizations, and private industry. The plan, according to one our informants, was an 18-month
project that was an outgrowth of Charlotte’s Connect Our Future Initiative that identified freight
as a major priority for improving economic development. The GCFMP identified the existing
freight network, detailed bottlenecks in the system, and suggested policy solutions to the issues
it established. An additional unique feature of the plan, according to one informant, was its
acknowledgement that land use was an important factor in planning for a successful freight
system. Measurable effects of the GCFMP are difficult to assess at this point, but our interviews
indicated that the plan has a significant effect on the way that officials are framing and
understanding the regional freight planning process. Our informants consistently referenced the
plan when asked about the state of freight planning and the ways they are working to monitor
and improve freight conditions. A critique that we noticed of the plan, apparent in our interviews
both explicitly and implicitly, was that the collaboration that existed in the process of producing
the plan did not continue past its publication. The plan was often referenced when informants
discussed how they work with other actors to plan and monitor the freight system, but there was
little evidence that interagency collaboration on freight was ongoing.
The freight system has undergone a significant amount of pressure associated with the increase
in e-commerce activity, according to our informants. The officials attributed issues with
congestion and safety to an increase in home deliveries made by box trucks and vans. The
freight system is also changing in terms of the prominence of truck shipments. Much of the
share of freight tonnage has shifted from rail to truck, according to our informants, as the latter
mode is more cost effective and flexible to the needs of agents on the supply chain. Despite the
clear pressure associated with changes happening in the freight system, our informants did not

34
feel that there was a corresponding increase in attention being given to the issue. In fact, we
were told by one official that they had observed a lack of awareness of transportation issues in
general by land use planners, but the problem is even more acute with respect to freight issues.
A specific problem that is currently not addressed by land use planning that affects the freight
system is accommodating the physical constraints of larger freight vehicles. The technical
aspect of providing space, whether it be for safely moving through an urban environment or
parking spaces for unloading. Our informant suggested that tickets associated with violating
parking regulations have become an expected “cost of doing business” for freight carriers.

35
Chapter 5 – Freight Monitoring Recommendations
From this research effort we can comfortably make four recommendations for monitoring freight
safety KPIs in North Carolina to provide a pathway for better assessment and management of
the freight system. Below we outline each recommendation and our assessment of what it will
take to achieve the recommendation in a manner that is prudent and sustainable.
Recommendation 1 – Utilize the COVERLAB Crash Visualization Tool
The COVERLAB platform developed by ITRE provides strong visualization tools for monitoring
commercial vehicle road safety. This tool can be used without any cost and is straightforward to
use, requiring little to no staff training. Our overview of the web portal should act as an easy
starting point from which NCDOT staff can become familiar with the tool. While NCDOT could
maintain a spreadsheet or database from figures produced by the tool, the data visualizations
are very helpful in displaying KPI trends and mapping occurrences of KPIs. The versatility of the
tool will require little if any maintenance of the data by NCDOT staff if the tool remains available
and accessible to the public. If NCDOT were to adopt only one KPI monitoring practice as a
product of this report, we would suggest that it simply utilize this existing resource to monitor
freight safety KPIs going forward. Specifically, we would suggest that NCDOT maintain a record
of statewide figures for the five KPIs provided by the Crash Visualization Tool. Other state,
regional, and local agencies can also use this tool by selecting specific geographies of concern.
We also suggest that NCDOT consult the High Crash Corridors tool to ensure that agency
efforts to focus on areas of greatest concern are, indeed, being applied to the appropriate
corridors.
Recommendation 2 – Maintain Database of Publicly Available KPIs
Building on the efforts of this project, we recommend that NCDOT continue to monitor KPIs from
the publicly available data sources that we have identified, linked, and quantified in the table
included in this report. We recommend that staff use the modest database that we have
compiled here and build upon it by updating KPIs as new figures are released. The baseline
established in this report will be more meaningful as additional data become available and
trends can begin to be noticed. We also suggest that NCDOT incorporate metrics from
proprietary data sources or others that were not included in this report. A single KPI database,
especially if it is similar to the scope of what we have provided in this report, will not be
particularly onerous to maintain, but will help staff to continue monitoring the safety of the freight
system as conditions change.
Recommendation 3 – Focus on VRU-Commercial Vehicle Safety
Our review of the literature as well as our analysis of the empirical data suggest that vulnerable
road users (VRUs) are often neglected when considering freight safety KPIs. We have identified
crashes between VRUs and commercial vehicles and cross tabulated them among many
characteristics for a nuanced understanding of how these characteristics interact and how
specific types of crashes are varying in frequency over time. We suggest that NCDOT continue
to monitor these trends by maintaining our dataset. While we do not necessarily assume that
continued refinement of the regression models and time series analysis are necessary, it should
36
prove useful to maintain the dataset so that specific crash types and frequencies can be
monitored.
Recommendation 4 – Establish a Working Group on Freight Safety Monitoring/Data Sharing
Plan
A challenge that we found in conducting our analysis, with concerted effort, could become an
asset for NCDOT. There are several different entities working on measuring and monitoring
safety of the road system. While they do not all necessarily have a freight focus, they are
working to collect data and maintain databases that have the potential to have a meaningful
impact on NCDOT’s ability to monitor the safety of the freight system. The specific entities that
we suggest NCDOT contact for the establishment of a freight safety monitoring working group
include the Commercial Vehicle Enforcement Resource Lab also at NC State, the Highway
Safety Research Center at UNC, and the City and Regional Planning program at the University
of North Carolina at Chapel Hill. We see the purpose of this working group to collaborate on a
data sharing plan, as our process of acquiring data from some of these entities has uncovered
many overlapping data collection and maintenance efforts. We believe that the formation of this
group would benefit both NCDOT by clarifying exactly what data exist and where, but the
entities themselves would also benefit from such a discussion.

37
REFERENCES Allen, J., Bektaş, T., Cherrett, T., Friday, A., McLeod, F., Piecyk, M., ... & Austwick, M. Z.
(2017). Enabling a freight traffic controller for collaborative multidrop urban logistics:
Practical and theoretical challenges. Transportation Research Record, 2609(1), 77-84.
Al-Ghamdi, A. S. (2002). Pedestrian–vehicle crashes and analytical techniques for stratified
contingency tables. Accident Analysis & Prevention, 34(2), 205-214.
Baltes, M., R. (1996). Factors Influencing Nondiscretionary Work Trips by Bicycle Determined
from 1990 U.S. Census Metropolitan Statistical Area Data. Transportation Research
Record, pp. 96–101.
Caldwell, H., & Sedor, J. (2002). The freight story: A national perspective on enhancing freight
transportation (No. FHWA-OP-03-004).
Callahan, P. (2019, September 5). Amazon pushes fast shipping but avoids responsibility for the
human cost. The New York Times, retrieved from
https://www.nytimes.com/2019/09/05/us/amazon-delivery-drivers-accidents.html
Cavill, N., Kahlmeier, S., Rutter, H., Racioppi, F., & Oja, P. (2008). Economic analyses of
transport infrastructure and policies including health effects related to cycling and
walking: a systematic review. Transport Policy, 15(5), 291-304.
Clifton, K. J., Burnier, C. V., & Akar, G. (2009). Severity of injury resulting from pedestrian–
vehicle crashes: What can we learn from examining the built environment?. Transportation
Research Part D: Transport And Environment, 14(6), 425-436.
Constant, A., & Lagarde, E. (2010). Protecting vulnerable road users from injury. PLoS
Medicine, 7(3).
Conway, A., Tavernier, N., Leal-Tavares, V., Gharamani, N., Chauvet, L., Chiu, M., & Bing
Yeap, X. (2016). Freight in a bicycle-friendly city: Exploratory analysis with new york
city open data. Transportation Research Record, 2547(1), 91-101.
Dablanc, L., & Ross, C. (2012). Atlanta: a mega logistics center in the Piedmont Atlantic
Megaregion (PAM). Journal Of Transport Geography, 24, 432-442.
Dablanc, L., Giuliano, G., Holliday, K., & O'Brien, T. (2013). Best practices in urban freight
management: Lessons from an international survey. Transportation Research Record, 2379(1),
29-38.
Duhigg, C. (2019, October 10). Is Amazon Unstoppable? The New Yorker, retrieved from
https://www.newyorker.com/magazine/2019/10/21/is-amazon-unstoppable

38
Dumbaugh, E., Li, W., & Joh, K. (2013). The built environment and the incidence of pedestrian
and cyclist crashes. Urban Design International, 18(3), 217-228.
Dumbaugh, E., Rae, R., & Wunneberger, D. (2009). Examining the relationship between
community design and crash incidence (No. SWUTC/09/167173-1). Texas Transportation
Institute.
European Conference of the Ministers of Transport. National Policies to Promote Cycling.
Organisation for Economic Cooperation and Development, Paris, 2004.
Gao, J., & Ozbay, K. (2017). A Data-Driven Approach to Estimate Double Parking Events using
Machine Learning Techniques. Transportation Research Board’s 96th Annual Meeting.
Washington, DC.
Gilbert, B. (2020, July 29). 10-year-old killed in crash with Amazon delivery van in Bay Area.
Business Insider, retrieved from https://www.businessinsider.com/10-year-old-killed-in-crash-
with-amazon-delivery-van-2020-7
Giordani, I., Archetti, F., Djordjevic, D., & Sormani, R. (2018). Towards sustainable urban
logistics: the evolution of digital marketplace. Transport and the City, 75.
Giuliano, G., Kang, S., & Yuan, Q. (2018). Using proxies to describe the metropolitan freight
landscape. Urban Studies, 55(6), 1346-1363.
Godlee, F. (1992). Transport: a public health issue. BMJ: British Medical Journal, 304(6818),
45.
Haag, M. & Hu, W. (2019, October 28). 1.5 Million Packages a Day: The Internet Brings Chaos
to N.Y. Streets. The New York Times, retrieved from
https://www.nytimes.com/2019/10/27/nyregion/nyc-amazon-delivery.html
Hutchings, D., Best, N., & Mahmuti, M. (2013). Global perspective on retail: online retailing. A
Cushman & Wakefield Research Publication, London.
Kaplan, S., Vavatsoulas, K., & Prato, C. G. (2014). Aggravating and mitigating factors
associated with cyclist injury severity in Denmark. Journal Of Safety Research, 50, 75-82.
Kim, J. K., Kim, S., Ulfarsson, G. F., & Porrello, L. A. (2007). Bicyclist injury severities in
bicycle–motor vehicle accidents. Accident Analysis & Prevention, 39(2), 238-251.
Lee, C., & Abdel-Aty, M. (2005). Comprehensive analysis of vehicle–pedestrian crashes at
intersections in Florida. Accident Analysis & Prevention, 37(4), 775-786.

39
Lyons, T. & McDonald, N. (2020) Innovative Strategies in Last-Mile Urban Freight Delivery: A
systematic review of the literature. Working Paper.
Ma, Y. (2014). City logistics in China–an empirical study from an emerging-market-economy
country (Doctoral dissertation, Technische Universität).
Ma, M., Ma, Y., Liu, L., & Shi, L. (2014). Severity Analysis of Motor Vehicle-Bicycle Crashes.
In CICTP 2014: Safe, Smart, and Sustainable Multimodal Transportation Systems (pp. 2605-
2613).
Manson, J., Cooper, S., West, A., Foster, E., Cole, E., & Tai, N. R. (2013). Major trauma and
urban cyclists: physiological status and injury profile. Emergency Medicine Journal, 30(1), 32-
37.
Martinez, K. L. H., & Porter, B. E. (2006). Characterizing red light runners following
implementation of a photo enforcement program. Accident Analysis & Prevention, 38(5),
862-870.
McCarthy, M., & Gilbert, K. (1996). Cyclist road deaths in London 1985–1992: drivers,
vehicles, manoeuvres and injuries. Accident Analysis & Prevention, 28(2), 275-279.
McDonald, N., Yuan, Q., & Naumann, R. (2019). Urban freight and road safety in the era of e-
commerce. Traffic Injury Prevention, 20(7), 764-770.
McGowan, J. (2019). How Has the Growth of E-commerce Sales Affected Retail Real Estate?.
Nicaj, L., Stayton, C., Mandel-Ricci, J., McCarthy, P., Grasso, K., Woloch, D., & Kerker, B.
(2009). Bicyclist fatalities in New York City: 1996–2005. Traffic Injury Prevention, 10(2), 157-
161.
OCDE/OECD (1998) Safety of vulnerable road users. Paris: Organisation for Economic Co-
Operation and Development. DSTI/DOT/RTR/ RS7(98)1/Final DSTI/DOT/RTR/RS7(98)1/ Final.
http://www.oecd.org/dataoecd/24/4/ 2103492.pdf
Ogilvie, D., Egan, M., Hamilton, V., & Petticrew, M. (2004). Promoting walking and cycling as
an alternative to using cars: systematic review. BMJ, 329(7469), 763.
Park, K., Ewing, R., Sabouri, S., & Larsen, J. (2019). Street life and the built environment in an
auto-oriented US region. Cities, 88, 243-251.
Pokorny, P., Pritchard, R., & Pitera, K. (2018). Conflicts between bikes and trucks in urban
areas—A survey of Norwegian cyclists. Case Studies on Transport Policy, 6(1), 147-155.
Pucher, J., & Buehler, R. (2009). Integrating bicycling and public transport in North

40
America. Journal of Public Transportation, 12(3), 5.
Pucher, J., & Buehler, R. (2017). Cycling towards a more sustainable transport future.
Ranieri, L., Digiesi, S., Silvestri, B., & Roccotelli, M. (2018). A review of last mile logistics
innovations in an externalities cost reduction vision. Sustainability, 10(3), 782.
Roudsari, B. S., Mock, C. N., Kaufman, R., Grossman, D., Henary, B. Y., & Crandall, J. (2004).
Pedestrian crashes: higher injury severity and mortality rate for light truck vehicles compared
with passenger vehicles. Injury Prevention, 10(3), 154-158.
Seiniger, P., Gail, J., & Schreck, B. (2015). Development of a test procedure for driver assist
systems addressing accidents between right turning trucks and straight driving cyclists. In 24th
International Technical Conference on the Enhanced Safety of Vehicles (ESV), Gothenburg,
Sweden.
Sze, N. N., & Wong, S. C. (2007). Diagnostic analysis of the logistic model for pedestrian injury
severity in traffic crashes. Accident Analysis & Prevention, 39(6), 1267-1278.
Visser, J., Nemoto, T., & Browne, M. (2014). Home delivery and the impacts on urban freight
transport: A review. Procedia-Social and Behavioral Sciences, 125, 15-27.
WHO/OMS (2009) Global status report on road safety: time for action. Geneva: World Health
Organisation, http://whqlibdoc.who.int/publications/ 2009/9789241563840_eng.pdf.
Zegeer, C. V., Stutts, J. C., Huang, H., Zhou, M., & Rodgman, E. (1993). Analysis of elderly
pedestrian accidents and recommended countermeasures. Transportation Research
Record, 1405, 56-63. Transportation Research Board, Washington, D.C., 2018.

41
Appendix
Acronyms:
KPI – Key Performance Indicator
DOT – Department of Transportation
MPO – Metropolitan Planning Organization
VRU – Vulnerable Road User
CV – Commercial Vehicle
OLF – Office of Freight + Logistics
COVERLAB – Commercial Vehicle Enforcement Resource Lab
FHWA – Federal Highway Administration
OFMO – Office of Freight Management and Operations
FPM – Freight Performance Measurement
ATR – Automated Traffic Recorder
ITS – Intelligent Transportation System
GPS – Geographic Positioning System
ATA – American Trucking Association
VIN – Vehicle Identification Number
LEHD – Longitudinal Employer-Housing Dynamics
GCFMP – Greater Charlotte Freight Mobility Plan
ITRE – Institute of Transportation Research and Education
HSRC – Highway Safety Resource Center
Appendix Table 1: Key Performance Indicators from Literature
Authors Year Article Indicator Measurement Details
Jones & Sedor 2006 Improving the Reliability of
Freight Travel
Speed
Reliability Fill Rate The percentage of orders delivered "on time"
Security Delay Actual delivery day minus confirmed delivery day
Visibility
Profitability
Return on Investment
Congestion Delay Delay per person or per vehicle
Mobility Travel Time
The time it takes for a vehicle to travel between two points
Safety

42
Economic Development
Lomax et al. 2003 Selecting travel time reliability
measures
Travel Time Reliability
Statistical Range
An estimate of the range of transportation conditions (congestion) that can be experienced
Buffer Time Measures
The effect of irregular conditions--the extra time that must be allowed to achieve the destination reliably
Tardy Trip Indicators
How often a traveler will be "unacceptably" late
Texas Transportation Institute and Cambridge Systems
2006
Travel time reliability:
Making it there on time every
time
Travel Time Reliability
90th/95th percentile Travel Times
How bad delay will be on the heaviest travel days
Buffer Index
Extra buffer or time cushion that travelers must add to ensure reliable on time arrival
Planning Time Index
Like buffer index but includes free-flow travel time
Harrison et al.
2006 Developing Freight Highway
Corridor Performance Measure Strategies in Texas
Travel Time
Peak Period Travel Time
Delay Hours of delay per 1000 vehicle mile
Reliability
Delay Hours of incident-related delay
Percent of on-time arrivals
Travel Time Reliability
Ratio or variance to average minute per trip in peak periods in metro areas
Cost
Cost of highway freight
per ton-mile
Fuel consumption per ton mile

43
Maintenance cost of
connector links
Safety
Accident Rates Number of accidents in given geography and/or period of time
Fatality Rates
Insurance Cost
Highway Condition
Condition
Lane-miles of high-level highway requiring rehabilitation
NHS intermodal connectors condition
Percent of roads/bridges with surface/condition classified as good
Number of at grade railroad crossings
Overpasses with vertical clearance restrictions
Weight-restricted bridges
Intersections with inadequate turning radii
Economic Impact
Infrastructure Return
Contribution of investment to GDP
Net present value of improvements/ Benefit-cost ratio of highway improvements
Industry Productivity
Capacity
Average length of haul
Average load
Percent of VMT empty
Annual miles per truck
Margiotta et al.
2015
Freight Performance Measure Approaches for
Bottlenecks, Arterials, and Linking Volumes to Congestion Report
Congestion
Total Delay
Actual vehicle hours experienced minus the vehicle hours at free-flow speeds
Mean Travel Time Index
The mean travel time over the highway section divided by the travel time that would occur at the reference speed
Planning Time Index

44
80th Percentile Travel Time Index
The 80th percentile travel time divided by the travel time that would occur at the reference speed

45
Appendix Table 2: KPIs and Data Sources:

46
Appendix Item 3: Data Hyperlinks
Federal Highway Administration Urban Congestion Report -
https://ops.fhwa.dot.gov/perf_measurement/ucr/reports/fy2019_q4.pdf
INRIX Scorecard -
https://inrix.com/scorecard/#:~:text=Welcome%20to%20the%20INRIX%20Global,comparisons%2C%20a
nd%20incident%20congestion%20impacts.
Federal Highway Administration Significant Corridors -
https://ops.fhwa.dot.gov/freight/freight_analysis/perform_meas/fpmtraveltime/traveltimebrochure.pdf
Federal Highway Administration Conditions and Performance Report -
https://www.fhwa.dot.gov/policy/23cpr/pdfs/23cpr.pdf
Texas Transportation Institute Urban Mobility Report - https://mobility.tamu.edu/umr/congestion-
data/
Bureau of Transportation Statistics State Transportation by the Numbers -
https://www.bts.dot.gov/sites/bts.dot.gov/files/states2020/North_Carolina.pdf
Federal Motor Carrier Safety Administration Large Truck and Bus Crash Facts -
https://www.fmcsa.dot.gov/safety/data-and-statistics/large-truck-and-bus-crash-facts-2017#A5

47
Appendix Item 4: Semi-Structured Interview Questions
1) Who do you see (organization, agency, decision-makers etc.) as primarily responsible
for monitoring the freight system?
2) What changes have you observed in urban freight activity in your region?
3) Have you noticed any change in the amount of attention given to urban freight by
planners or leaders?
4) What problems do you see associated with urban freight now or in the future?
5) How is your organization monitoring urban freight?
6) What kind of collaboration, if any, is your agency participating in with respect to
coordinated planning for urban freight?
7) you know of any private-public collaboration happening with respect to urban freight?
8) What do you see as key indicators of safety in the urban freight system?
9) Beyond safety, what should be other foci of urban freight monitoring?
10) Who else should we speak to for this inquiry?


