
THIS REPORT CONTAINS ASSESSMENTS OF COMMODITY AND TRADE ISSUES MADE BY
USDA STAFF AND NOT NECESSARILY STATEMENTS OF OFFICIAL U.S. GOVERNMENT
POLICY
Required Report - public distribution
Date: 12/11/2009
GAIN Report Number: RS9310
Russian Federation
FRESH DECIDUOUS FRUIT ANNUAL
2009
Approved By:
Dana L. Johnson
Prepared By:
Svetlana Ilyina and Dana L. Johnson
Report Highlights:
Russia is the largest importer of apples and pears in the world, and despite the economic crisis,
devaluation of the ruble, and negative income growth, imports in 2009 remained steady. Fruit remains
popular with consumers, but they are buying less exotic fruits, pears, and grapes. Demand for most U.S.
fresh fruits is growing, and U.S. fruit importers continue diversifying their product lines. Domestic fruit
production is limited, and growers already suffering from the economic crisis are facing increased
competition from imports.

2
Executive Summary:
Russia is the largest importer of apples and pears in the world, and despite the economic crisis,
devaluation of the ruble, and negative income growth, imports in 2009 remained steady. Fruit remains
popular with consumers, but they are buying less exotic fruits and pears. Consumers are spending their
food budgets on more affordable and necessary products, and Russians bought 30 percent less exotic
fruits, 17 percent fewer pears, and 5 percent less grapes.
Russia imported 5.1 million metric tons (MT) of fruit while domestic production was only 2.1 million
MT. Fruit imports from Europe and the Southern Hemisphere are declining, while imports from the
Commonwealth of Independent States (CIS) and Poland are increasing. Demand for most U.S. fruit is
growing, and importers of fresh fruit from the U.S. continue to diversify their product lines.
Domestic fruit production is limited, and growers already suffering from the economic crisis are facing
increased competition from imports. The main commercial fruit crop is apples and both the area planted
and production fell in 2008. The Russian Government provides subsidies to stimulate production and
investment in plantations with perennial crops and help growers modernize and remain in the industry.
Investment in new rootstock and equipment is continuing, but at a pace of only 2 to 3 percent per year.
The Russian Far East remains a stable market for U.S. fruits, responsible for 30 percent of the total
volume imported to Russia. U.S. fruit sales and their price competitiveness in Russia will depend a lot
on the U.S. Dollar/Russian ruble and Euro/Russian ruble exchange rates.
Production:
In preparation of this report, Post obtained 2008 production data from the Russian Federation State
Statistics Committee (Rosstat) and the figures indicated that apple production in Russia had declined by
30 percent from the previous year. Post made an additional request with Rosstat for 2007 data and the
statistics provided differed from the data provided by Rosstat last year for the same period, including
revised figures for apples and grape production and for the area planted for pears. GAIN RS8308 the
Fresh Deciduous Fruit Report 2008 contained data and analysis based on the information provided by
Rosstat in 2008. While we cannot know all of the reasons behind the revision of the 2007 data, we
believe Rosstat has now provided us the most accurate figures available. Post analysis for this report
was done utilizing the revised data provided by Rosstat in 2009 and tables have been revised to account
for the updated figures for 2007 and the new data for 2008.
The economic crisis negatively impacted development of the fruit growing industry in Russia. In 2008,
Russia reported a decrease in apple production, as well as area planted. In 2008, Russia produced 2.1
MT of fruit. Apples account for 52 percent of the total fruit crop, followed by stone fruits with 26
percent, grapes were 13 percent (including table grapes), and pears were 9 percent. Apples and grapes
are the only fruits commercially grown in Russia. Other fruits, berries, and nuts are grown on household
plots for household consumption and the surplus is sold in local wet markets.
Most commercial apple production is in southern and central Russia. Golden Delicious, Red Chief,
Semerenka (Russian light green sour variety), Granny Smith, Gala, and Fuji are the major apple
varieties cultivated in Russia. In 2008, Russia produced 1.1 MT of apples, 15 percent less compared to

3
the revised yield data for 2007. Rosstat reported a 4 percent decrease in area planted. According to the
Russian business magazine “Expert,” 80 percent of apple orchards are more than 35 years old,
demanding major investment in replanting, irrigation, modern storage, and packing technologies in
order to be efficient and produce good yields. In 2008, apple yields averaged 5.8 MT per hectare, six
times less than the yields in China’s apple growing provinces.
The Russian horticultural industry is largely outdated and inefficient, but experts say there are additional
factors leading to decreased apple production in Russia. First, 2008 was a “down” year because trees
needed “rest” after the good yields in 2007. Another hurdle was the lack of affordable credit for
operating costs which impaired the industry’s ability to harvest and it is likely that some crops were
simply abandoned. Finally, storage facilities and packing technology are inadequate to preserve the crop
year around, and the existing distribution channels may not be sufficient for smaller producers to market
and sell their crop.
Increasingly, imported apples produced in the CIS and Poland are pushing Russian apples out of the
market because distributors and major retailers prefer working with imports because they are more
consistent in quality, sizes, price, and supply.
Despite the difficulties facing the Russian horticulture industry, some in the industry have been
implementing modernization and development projects for at least the last four years. Apple producers
in the major apple growing provinces such as Krasnodarskiy Kray, Linetskaya, and Volgogradskaya
Oblast, are replacing rootstock and are developing new orchards according to new “intensive garden”
technology. This technology uses higher yield planting material, which is smaller in size to help
maximize productivity. The number of trees can exceed 1,500 per hectare while traditional gardens
would typically have only 300 trees in the same space. The gardens can be harvested within 2 to 3 years
after planting. According to industry experts, only 10 percent of the total are planted in Russia is this
newer, intensive variety. Russia’s overall apple orchard replacement rate is 2 to 3 percent compared to
the world average of 10 percent. According to Expert magazine, one hectare of intensive garden costs
around $25,000 including irrigation equipment and storage and packaging facilities. The larger
horticultural producers such as Sad Gigant, Sadi Pridonya, the Centralno-Chernozemnaya Company are
continuing investment projects. The yields from intensive gardens are better quality and have longer
shelf life and are usually in demand from retail chains. Russian consumers like buying locally produced
apples and consider them the most ecologically safe and natural product on the market which helps
support sales of Russian apples. The long term viability of the intensive garden projects is threatened by
the lack of available credit and increased competition from imports. Post expects the larger commercial
players in Russia to continue modernizing.
According to Selskaya Zhizn’ (Agricultural Life), the main agricultural newspaper in Russia, 11,700
hectares of new fruit orchards were planted in 2008. A small percentage of the drop in production from
2007 to 2008 could be attributable to the lag time between cultivation from old orchards and the new
intensive gardens which do not begin producing fruit until the second or third year.
The Russian Government continues to provide domestic support in the form of subsidies for agricultural
producers. According to Selskaya Zhizn’, the government provided 116 billion rubles ($4.1 billion) for
agricultural projects in 2008. In 2009, 302 million Rubles ($10 million) went for subsidies for new
orchard planting and treatment and state support for horticulture is planned to reach 420 million rubles
($14 million) in 2010. The subsides are intended to stimulate investment and production on plantations

4
with perennial crops, such as fruit orchards, berry farms, horticultural nurseries, and help growers
modernize and remain in the industry.
Selskaya Zhizn' reported that the horticultural industry requested increased subsidies from the Federal
government to help cope with the challenges they faces. Currently they receive 140,000 to150,000
rubles ($4,660 to $5,000) per hectare of perennial gardens and an additional 25,000 rubles ($800) per
hectare for cultivation. Thus far, the government has not responded to the industry’s request for
assistance.
According to Russian producers and distributors, 2009 has been a very good year for apples in Russia.
The World Apple and Pear Association forecast a 7 percent increase in apple yield in Russia in
2009/2010 compared to the previous year, but stiff competition from imported apples from Uzbekistan,
Ukraine, Moldova, and Poland is expected to continue.
Considering the ongoing competitiveness problems in quality, shelf life, and price, the crisis could be
acting as a catalyst for farm failures now and in the future. Post expects that the rate of crop
abandonment and waste to increase unless there is additional intervention by the government. Of course,
the government has shown no hesitation to use sanitary and phytosanitary issues to manage trade, such
as the MRLs applied to fruit imports from the EU. The government may choose to address increased
competition with new trade barriers in order to protect domestic production.
Consumption:
In Marketing Year (MY) 2008, the size of the Russian fruit market totaled 6 million MT, which is level
with figures for 2007. Total trade and production statistics indicates that per capita fruit consumption
rose in Russia to 40 kgs per year, a 20 percent increase compared to 2004 data. According to the
Rosstat, Russians consumed 9.4 kgs of apples, 5.9 kgs of citrus, 5.6 kgs of bananas, and 2.6 kgs of
grapes in 2008. According to Post estimates, pears are one of the most popular fruits in Russia, and per
capita consumption is approximately 3.2 kgs. According to research conducted by the international
marketing and media information agency, Nielson, 69 percent of Russians eat fruit at least once per
week during the summer, but that figure falls to 55 percent in the winter months.
According to the Russian produce industry analysis firm, the Fruit and Vegetable Alliance, Russian
consumers favor the following fruits:
Favorites: apples (40 percent of Russians prefer apples to other fruits), bananas (31 percent), and
oranges (28 percent);
Popular fruits: grapes (22 percent) and pears (21 percent);
Regularly purchased fruits: apricots, peaches, water melons, mandarins, grapefruits, lemons,
plums, pineapples and kiwifruits (7-18 percent); and
Other fruits include mangos and avocados (less than 4 percent).
Fruit consumption in Russia is driven by two factors - the level of income and retail prices. According
to the Rosstat, fresh produce retail prices increased by 15 percent in 2008 as the ruble was losing its
value and real income decreased. Thirty percent of Russian consumers shifted their shopping habits
toward lower quality, lower priced goods. According to Nielsen, Russians chose to spend their food
budget on fruits such as apples, bananas, and oranges in 2008. The market share of other fruits dropped
significantly as Russians bought 30 percent less exotic fruits, 17 percent less pears, and 5 percent less
grapes compared to MY 2007.
5
Consumption figures also vary widely depending on geographic location. In rural areas, Russians tend
to consume locally grown fruits and vegetables where a lot of canning in traditionally done in order to
preserve fruits and vegetables for out of season consumption. Fruit consumption, especially imported
fruit, is substantially higher in urban areas.
Russian consumers like locally grown produce because they believe that it is fresher, contains less
pesticides, and is ecologically safe, and these ideas are perpetuated by the media and government
officials. In summer and early autumn, many families grow their own berries, fruit, and vegetables on
private plots. Tending gardens and collecting apples at dachas (summer cottages) is a beloved pastime
for Russians. In addition to apples, other popular items include strawberries, pears, plums, cherries,
apricots, blueberries, green onion, cucumbers, dill, and other herbs. Even Russians who do not have
land for gardens of their own enjoy buying from local open air markets and street vendors. Therefore,
demand for imported products is lower when local products are fresh and readily available.
Produce grown in the CIS countries of Azerbaijan, Uzbekistan, Moldova, Ukraine, Tajikistan, and
Kyrgyzstan are popular with Russians as well due to historic distribution channels that date back to
Soviet times when these were the only sources of exotic fruits for Russians. These products are not
usually the highest quality items available on the market, but the varieties and characteristics are
familiar and represent the historic “standard” of these products to Russian. Russians prefer products
from these CIS countries such as grapes, watermelons, peaches, apricots, and plums when they are in
season over imported products. In the late summer months, more than 40 percent of fruit sold on the
Russian market are these seasonal items.
Many Russians are seeking healthier lifestyles and new products. The Russian Government launched a
social advertising and education campaign to discourage drinking alcohol, smoking, and overeating. The
number of people quitting smoking, beginning exercising regimens, tracking calories and nutritional
content, and eating healthier foods is rising. Diets are changing as consumers chose more fresh and
dried fruit as a substitute for other snacks. Fruit-based desserts are increasingly available in foodservice,
and people are drinking more freshly squeezed juices. August 2009 was the first month within the last 5
years when the birthrate was higher than the death rate in Russia. If the trend continues, consumption
rates should rise as well.
As previously reported, 65 percent of all fruit is sold through wholesale and wet markets. Russian
consumers prefer to buy fruits at markets rather than in retail stores because they believe the prices are
lower and the product is fresher when there are fewer people involved in the supply chain. However, the
popularity of retail chains has become more popular for fruit consumption because the larger chains
such as X5, Metro, Aushan, Lenta, O’Key, and Pyatorochka are spreading to smaller cities in provincial
Russia and their higher volumes mean they can offer competitive prices and conveniences. Retail chains
have improved the assortment of fresh produce available for consumers at various income level that are
well merchandised and there are numerous choices of consumer packaging.
According to the marketing company, Express–Obzor, the ten top retail chains by annual receipts, are:
X5 Retail Company - 221 billion rubles ($7.6 billion)
Auchan - 142.4 billion rubles ($4.9 billion)
Magnat- 132.9 billion rubles ($4.6 billion)
Metro Group Russia - 125.9 billion rubles ($4.3 billion)
Lenta - 58.2 billion rubles ($2 billion)
Kopeyka - 51.6 billion rubles ($1.7 billion)

6
O’Key - 50.3 billion rubles ($1.7 billion)
Dixie - 47.8 billion rubles ($1.6 billion)
Sedmoy Continent - 43.9 billion rubles ($1.5 billion)
Victoria, GC - 34.9 billion rubles ($1.2 billion)
Trade:
According to Global Trade Atlas, Russia is a net importer of fruits, the third largest after the United
States and Germany by volume. Russia’s climate conditions and outdated infrastructure impede
development of the commercial fruit growing sector, and thus, the country remains heavily dependent
on imports to satisfy consumer demand for fruit.
According to Global Trade Atlas, during MY 2008, Russia imported 5.1 million MT of fruit and nuts.
The value reached $4.3 billion, a 10 percent increase compared to 2007, primarily due to inflation.
The global economic crisis had a negative impact on the Russian economy and by mid 2009, Rosstat
showed negative income growth. The Russian ruble depreciated against the U.S. dollar and Euro
making imported products more expensive and less competitive with the produce from Poland and the
CIS. Consumers reacted by purchasing more affordable and necessary products. The crisis demonstrated
how over reliant both importers and retailers in the Russian market are on credit for operating capital.
The lack of available credit has made what little there is available, very expensive, to the point of being
almost cost-prohibitive. Even the top players in the retail sector are expecting 90-day credit terms from
their suppliers putting importers in an even tougher position with working capital tied up in prepayment
to exporters while their retail customers are slow to pay. Last year, the two largest fruit importers in
Russia were forced into bankruptcy while others shifted to smaller fruit shipments out of concern over
reduced sales in Russia.
From December 2008 to June 2009, Russia’s imports of apples and citrus remained steady with calendar
year (CY) 2008 figures. However, Russians bought 30 percent less exotic fruits, such as dates, figs,
avocados, guavas, and mangos; 17 percent fewer pears; 5 percent fewer grapes; and 3 percent fewer
bananas. Russia buys fruit from all over the world, but the effects of the crisis are apparent when
looking at fruit trade statistics. For example, the European Union (EU), which traditionally supplies
pears and apples to Russia, exported 20 percent less in MY 2008. Russia also imported less from the
Southern Hemisphere countries of Argentina, Chile, and South Africa. In 2008, Russia’s largest
suppliers of fresh produce were Ecuador (bananas), Poland (apples), Turkey (citrus, grapes, and stone
fruits), Argentina (apples, pears, and citrus), Chile (grapes), and China (apples, citrus, stone fruits).
The CIS countries of Azerbaijan, Uzbekistan, Moldova, Ukraine, Tajikistan, and Kyrgyzstan play an
increasingly important role as fruit suppliers to Russia. The volume of fruit import to Russia sourced
from these countries reached 400,000 tons, a 25 percent increase over the previous year. These countries
which have historically supplied fruits to Russia, have a built-in transportation advantage and lower
prices. Since Soviet times Uzbek, Azerbaijani, Tajik suppliers handled the fruit trade throughout Russia
and created fully integrated systems of product distribution including imports and wholesale distribution
to the regions, as well as sales at wet markets nationwide. Post expects fruit imports from these CIS
countries to increase at least 5 percent in MY 2010.
As reported previously, Russia is a vast country stretching for 12,000 km from East to West and spans
11 time zones. The food market in Western Russia differs significantly from the Pacific coast market.

7
There are two points of entry for imported foods to the Russian Federation. The Port of St. Petersburg is
the major trade route handling around 80 percent of imported food shipments to Russia. Most
consumption is concentrated in the Western market, with approximately 120,000 million people in the
territory reaching from the Western border stretching to the Ural Mountains. The fruit market in
Western Russia is very competitive because suppliers from the EU, the Middle East, and the CIS are in
close proximity to this market. Importers of U.S. products face several difficulties such as, complicated
logistics (30-day transit time from the U.S.), lack of awareness about U.S. fruit quality among
consumers, and strong competition from neighboring countries.
The fresh produce market in the Russian Far East (RFE) differs from that of Western Russia. The
climate condition in the RFE is not conducive to commercial production of fruit; and therefore, all fruit
is imported. Moreover, there is a great distance between the RFE and major fruit suppliers in the EU,
the Middle East, and even Russia’s fruit growing region. The RFE imports directly 114,000 tons of
fruit, mostly from Asian Pacific countries. Chinese fruit is dominant in the RFE with more than 80
percent of total fruit imported to the region. The RFE remains a good market for American fruits despite
the crisis because the U.S. fruit industry has been present on the market doing promotional campaigns
and the products are widely recognized for their high quality and taste. U.S. apples and pears have been
available on the market for more than 10 years and importers have long standing relationships with their
suppliers on U.S. West coast. The typical fruit shipment is on the water between the U.S. and the RFE
only 18 days. According to Russian Customs, in MY 2008, the RFE was responsible for 30 percent of
the total volume of U.S. fruit imports to Russia and shipments of apples, pears, and citrus for MY 2009
are already well underway for what is expected to be a strong season.
In MY 2008, Russia imported 27,900 MT of U.S. fresh fruit, a 7 percent drop from MY 2007. U.S.
apples sales went down 45 percent and totaled 9,700 MT, due to the limited supply of apples
appropriate for the high-end Russian market (extra large and bright in color) and decreased demand for
premium produce products. The volume of pears held steady while imports of citrus and grapes were at
a record high, more than doubling the 2007 level which had been the previous record. Western Russian
tested American pomegranates and citrus and found that even during the crisis, there is demand for this
product, and Post expects pomegranate imports to increase in MY 2009. U.S. fruit sales and their price
competitiveness in Russia will depend a lot on the U.S. Dollar/Russian ruble and Euro/Russian ruble
exchange rates.
Figure 1. Fruit Imports to Russia, by Percentage, Jan. to Sept. 2009

8
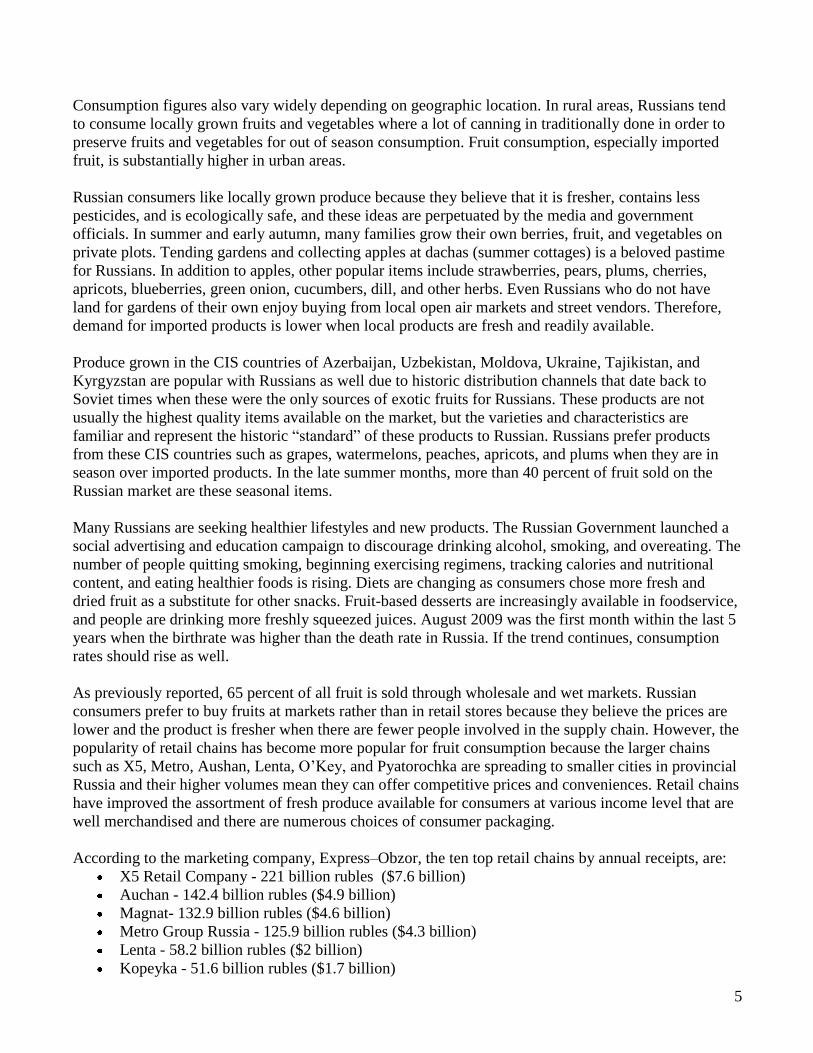
Figure 2. Dollar/Ruble Exchange Rate, 2002-2009
Figure 3. Dollar/Ruble Exchange Rate, July 2008 to June 2009.
9
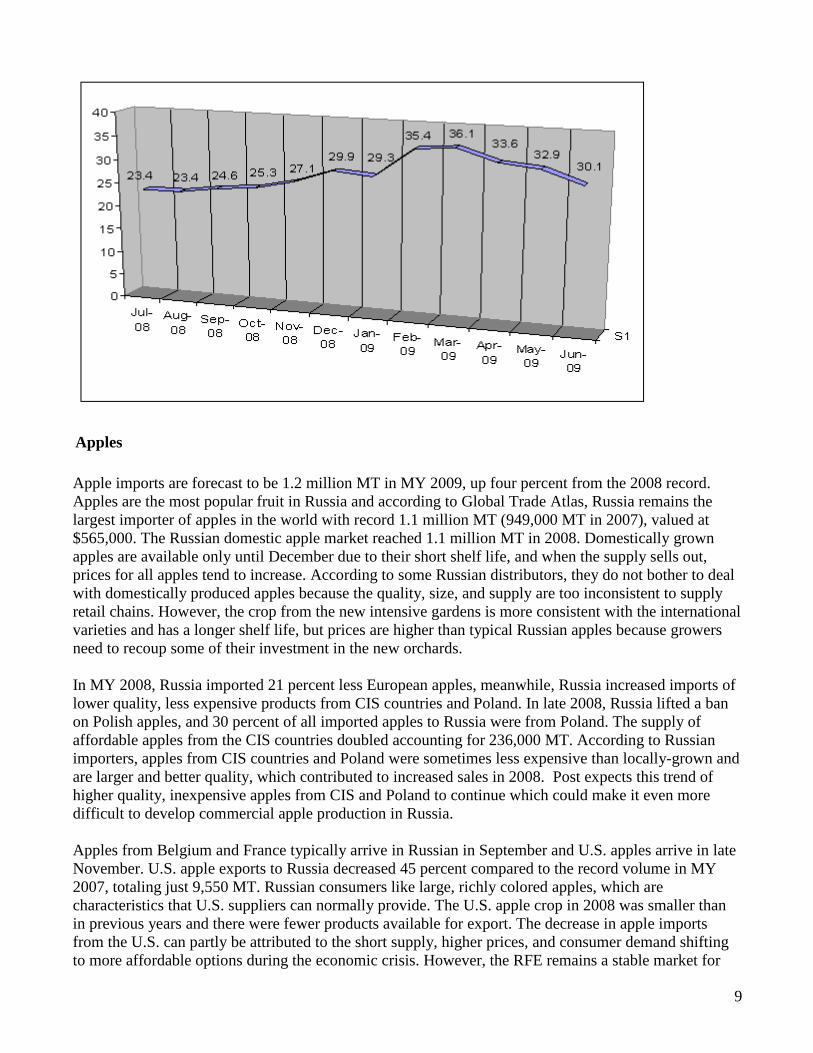
Apples
Apple imports are forecast to be 1.2 million MT in MY 2009, up four percent from the 2008 record.
Apples are the most popular fruit in Russia and according to Global Trade Atlas, Russia remains the
largest importer of apples in the world with record 1.1 million MT (949,000 MT in 2007), valued at
$565,000. The Russian domestic apple market reached 1.1 million MT in 2008. Domestically grown
apples are available only until December due to their short shelf life, and when the supply sells out,
prices for all apples tend to increase. According to some Russian distributors, they do not bother to deal
with domestically produced apples because the quality, size, and supply are too inconsistent to supply
retail chains. However, the crop from the new intensive gardens is more consistent with the international
varieties and has a longer shelf life, but prices are higher than typical Russian apples because growers
need to recoup some of their investment in the new orchards.
In MY 2008, Russia imported 21 percent less European apples, meanwhile, Russia increased imports of
lower quality, less expensive products from CIS countries and Poland. In late 2008, Russia lifted a ban
on Polish apples, and 30 percent of all imported apples to Russia were from Poland. The supply of
affordable apples from the CIS countries doubled accounting for 236,000 MT. According to Russian
importers, apples from CIS countries and Poland were sometimes less expensive than locally-grown and
are larger and better quality, which contributed to increased sales in 2008. Post expects this trend of
higher quality, inexpensive apples from CIS and Poland to continue which could make it even more
difficult to develop commercial apple production in Russia.
Apples from Belgium and France typically arrive in Russian in September and U.S. apples arrive in late
November. U.S. apple exports to Russia decreased 45 percent compared to the record volume in MY
2007, totaling just 9,550 MT. Russian consumers like large, richly colored apples, which are
characteristics that U.S. suppliers can normally provide. The U.S. apple crop in 2008 was smaller than
in previous years and there were fewer products available for export. The decrease in apple imports
from the U.S. can partly be attributed to the short supply, higher prices, and consumer demand shifting
to more affordable options during the economic crisis. However, the RFE remains a stable market for

10
U.S. fruit. In MY 2008, the total amount of U.S. apples imported to the RFE reached 3,500 MT, a 6
percent increase. European apples, comparable in both price and quality, are the main competitor to U.S.
apples on the Russian market and importers will be examining the U.S. Dollar/Russian ruble and
Euro/Russian ruble exchange rates when making purchasing decisions throughout the coming year.
According to an estimate from the World Apple and Pear Association, in 2009 European apple
production dropped 7 percent compared with 2008, primarily due to lower yields in Poland. The total
crop is expected to reach 10.7 million MT (22 percent of the crop is Golden Delicious, 10 percent is
Gala, 6 percent is Red Delicious, and 6 percent is Jonagold). China will produce 10 percent fewer
apples in 2009. The crop in the Southern Hemisphere will go up 4 percent and amount to 5.3 million
MT.
According to importers and apple industry representatives, U.S. apple imports are expected to increase
in MY 2009 because the crop size, quality, and color are appropriate for the Russia market and should
be price competitive. The Russian ruble recently began to appreciate against the U.S. dollar which
could help increase exports if the exchange rate holds or continues to improve.
Table 4. Import Trade Matrix for Apples in Metric Tons, MY 2007-2008
Year 2007 2008
U.S. 17,707 U.S. 9,755
Others Others China 232,784 Poland 378,517
Azerbaijan 86,723 China 203,179
Poland 85,651 Azerbaijan 114,430
Argentina 81,467 Moldova 82,400
France 57,693 France 49,085
Italy 52,760 Italy 41,339
Moldova 45,720 Ukraine 40,947
Belgium 41,597 Argentina 38,328
Serbia 38,296 Chile 35,484
Chile 37,218 Belgium 33,805
Total for Others
759,909
1,017,514
Others not Listed 162,330 119,731
Grand total 939,946 1,147,000
Source: Global Trade Atlas
Table 5. Russia: Imported Apples, U.S. Dollars per Metric Ton, MY 2007-2008
Prices in U.S Dollars/MT

11
Year 2007 2008 %
Jul 542 557 2%
Aug 434 467 7%
Sep 429 453 5%
Oct 430 454 5%
Nov 422 454 7%
Dec 435 473 8%
Jan new CY 513 596 16%
Feb 512 563 10%
March 522 590 13%
April 529 589 11%
May 536 591 10%
Jun 566 592 5%
Source: Global Trade Atlas
Table 6. Average Retail Prices for Apples in Western Russia MY 2008, in U.S. Dollars per kg
Month, year
Variety
Countries of origin
Price range,
per kilo
August 2008 Gala Royal France 2.78-4.16
Golden Italy 2.67-3.82
Red Delicious Argentina 3.19-563
Local varieties
Moldova Ukraine
2.04-3.67
Idared
Russia Moldova Ukraine
2.04-2.45
Local varieties Russia 1.22-1.58
September 2008 Golden Italy 2.56-4.01
Fuji China 3.07-4.24
Pink Lady France 3.50-6.81
Red Delicious USA 2.53-3.11
Idared
Russia Moldiva Ukraine
1.95-2.33
Local varieties Russia 1.69-4.90
November 2008 Royal Gala Italy 2.97
Red Delicious France 4.25
Grany France 5.02
Gala Russian 2.95

12
Golden Delicious Azerbaijan 2.34
Red Poland 1.45
Gala Poland 2.05
Fuji China 3.39
Jonagold Holland 2.65
December 2008 Red Chief Italy 4.42
Braeburn France 2.43
Gala France 4.33
Red Delicious Chile 2.87
Golden Delicious Russia 2.43
No variety Russia 1.24
No variety Poland Poland 1.61
Fuji China 3.0
Red Delicious USA 5.39
Golden Delicious USA 8.81
January 2009 Grany Smith France 3.52
Red Delicious France 4.25
Golden Delicious Russia 2.05
Idared Poland 2.7
Royal Gala Argentina 1.92
Red Delocious Chile 2.02
February 2009 Golden Delicious Italy 3.18
Braeburn France 2.76
Golden Delicious Belgium 2.67
Golden Argentina 2.8
Idared Poland 1.39
Golden China 1.60
Red Chef USA 2.23
March 2009 Gaanny Smth France 2.02
Red Delicious USA 2.4-4.1
Golden Delicious Belgium 2.56
Red Delicious Argentina 2.89
Golden China 1.99
April 2009 Fuji China 2.32-3.80
Gala Royal France 3.66-4.09
Gloster Poland 1.74-2.26
Gala Royal Argentina 1.93
Red Delicious USA 1.16-4.96

13
May 2009 Cameo USA 2.18
Gala Royal Chile 2.52-4.07
Gala Royal France 3.92
Grany Smith Spain 1.77
Red Delicious Argentina 1.87
Red Delicious USA 2.02-4.85
June 2009 Golden Delicious Italy 1.72
Granny Smith Argentina 1.59
Pink Lady Chile 2.07
Fuji China 1.91-2.23
Red Deliciuos USA 2.83
Pears
Imports and domestically grown pears account for 496,000 MT. Pears are not commercially grown in
Russia and the majority of domestic pears are grown in private plots and used for household
consumption.
Russia remains the world’s largest importer of pears. In MY 2008, Russian imports decreased by 25
percent and totaled 316,487 MT. Post estimates that due to the crisis, consumers chose to purchase
fewer varieties of fruit, giving preference to tree fruits such as apples, bananas, and citrus. Despite the
drop in pear imports, Post calculates pear consumption in Russia to be approximately 3.2 kg per capita,
making it still one of the most popular fruits in the country.
In MY 2008, the largest suppliers of pears to Russia were Argentina (94,281tons), Belgium (66,190
tons), and China (36,540 tons). Russian pear imports from the EU decreased by 30 percent and imports
from the Southern Hemisphere fell by 20 percent. The pear season started early in the U.S. in MY 2008
and Russian importers placed orders before the full impact of the economic crisis was felt in Russia.
U.S. pear imports reached 7,800 metric tons, which was on par with MY2007. Forty-one percent of all
U.S. pear imports (3,200 MT) were imported to the RFE from the U.S. West Coast.
According to Fruit News www.fruitnews.ru, the pear crop in MY 2009 will be larger. Europe’s
production is expected to go up 16 percent compared with 2008 and total 2.5 million MT, including
Conference variety at 856,000 MT, Williams BC at 296,000 MT, and Abbat Fetel at 277,000 MT. Pear
production forecasts in China and Ukraine are expected to fall by 25 percent and 5 percent, respectfully.
U.S. pears are a rather unique product. Some varieties, like Anju, have no European equivalent. U.S.
pears also have good quality and long shelf life, which is critical for regional distribution within Russia.
Thus, if U.S. pears are price competitive, Russian importers will buy U.S. pears. The first shipments of
U.S. pears have already arrived in Russia for MY 2009 and Post expects sales to be strong if prices
remain steady.
Table 7. Import Trade Matrix for Pears in Metric Ton, MY 2007-2008

14
Year 2007 2008
U.S. 7,728 U.S. 7,880
Others: Others: Argentina 117,174 Argentina 94,281
Belgium 115,205 Belgium 66,190
Netherlands 46,820 China 36,540
China 38,932 Netherlands 25,809
South Africa 23,651 Spain 22,873
France 11,341 South Africa 17,623
Spain 8,994 France 11,522
Portugal 5,180 Portugal 9,015
Italy 4,660 Chile 4,975
Chile 4,553 Poland 3,964
Total for others
376,510
292,792
Others not listed 3,614 15,806
Grand total 380,624 316,478
Source: Global Trade Atlas
Table 8. Russia: Imported Pears, U.S. Dollars per Metric Ton, MY 2007-2008
Prices in US Dollars/MT
Year 2007 2008 %
Jul 795 841 5%
Aug 762 887 16%
Sep 805 906 12%
Oct 812 884 8%
Nov 819 880 7%
Dec 827 884 7%
Jan 902 899 -1%
Feb 874 849 -3%
March 855 811 -6%
April 843 797 -6%
May 836 788 -6%
Jun 836 778 -7%
Source: Global Trade Atlas
Grapes
Russia’s grape imports have grown steadily since 2002. In 2008, Russia imported 394,000 MT, for
$488,000. Grape imports dropped by 5 percent in volume, but increased in value by $40 million. The
main grape exporters to Russia are Turkey (120,897 MT, which is a 30 percent increase), Uzbekistan

15
(64,359 MT), and Kyrgyzstan (41,394 MT). Russian consumers are accustomed to the grape varieties
from CIS countries and they are also the least expensive, adding to their popularity. Grapes from CIS
countries have a short shelf life and are only available until December.
Turkey is the largest supplier of standard table grapes to Russia while U.S. and Italian grapes are
considered premium or niche products. Due to counter-seasonal production, grapes from Argentina,
Chile, and South Africa arrive in January and dominate the market until July. The RFE imports grapes
from China and the product is available on the market for a long time, competing successfully with
Turkish and Uzbek grapes.
In MY 2008, U.S. grape imports to Russia doubled totaling 4,100 MT. According to grape importers,
the new season can be successful for Californian grapes if prices remain steady. The main competitor to
the U.S. in the premium segment is Italy, and heavy rains there recently may have damaged the crop
quality, according to trade sources. California’s grape crop has been good and the first shipments
already arrived in Western Russia. If the Russian economy and Russian ruble remain stable, and the
price for California grapes does not rise, Post expects grape imports from California to increase.
Table 9. Import Trade Matrix for Grapes in Metric Tons, MY 2007-2008
Year 2007 2008
U.S. 1,679 U.S. 4,100
Others: Others: Uzbekistan 118,597 Turkey 120,897
Turkey 86,016 Uzbekistan 64,359
Chile 48,463 Kyrgyzstan 41,394
Italy 24,881 Chile 38,244
Kyrgyzstan 21,128 Italy 36,917
Argentina 19,600 China 17,721
China 15,653 Moldova 13,997
South Africa 14,653 South Africa 11,104
Moldova 11,083 Argentina 9,714
Kazakhstan 10,363 Tajikistan 4,997
Total for Others
370,268
359,344
Others not Listed 42,699 34,105
Grand total 412,967 393,449
Source: Global Trade Atlas
Table 10. Russia: Imported Grapes, US Dollars per Metric Tons, MY 2007-2008
Prices in US Dollars/MT
Year 2007 2008 %
Jul 1,400 1,624 16%
Aug 1,302 1,242 -5%

16
Sep 1,166 1,153 -2%
Oct 1,075 1,146 6%
Nov 1,068 1,213 13%
Dec 1,086 1,269 16%
Jan new CY 1,169 1,303 11%
Feb 1,073 1,366 27%
March 1,181 1,371 16%
April 1,242 1,372 10%
May 1,280 1,384 8%
Jun 1,302 1,360 4%
Source: Global Trade Atlas
Policy:
The Russian Federation only allows fruits to enter the country with permission from the Veterinary and
Phytosanitary Surveillance Service (VPSS) in the form of an import permit. Importers apply to VPSS
for this permit prior to the shipment and it is not uncommon for it to take more than a month to be
processed; and thus, the importer should obtain the import permit before the cargo arrives at the port of
entry.
The fruit must be accompanied by a sanitary-epidemiological certificate issued by the Federal Service
for Consumer Rights and Human Well-Being. This document states that products imported are
produced according to the safety standard and do not contain biotech components. The document should
contain an attached list of products for imports and the MRLs of harmful substances required by
Russian regulation. A sanitary-epidemiological certificate is issued for 5 years.
In order for the imported fruit to be cleared, the importer must obtain a phytosanitary certificate from
VPSS, based on the phytosanitary certificate from the exporting country’s national plant protection
authority.
Once all the certificates are in order according to the Russia standard, the importer pays customs duties
and value added tax (VAT) and in the goods are cleared for import to Russia. The package of document
necessary for customs clearance contains:
Import license
Sales transaction documents such as the contract and bill of lading;
Import permit form VPSS
Sanitary–epidemiological certificate
Phytosanitary certificate from the exporting country’s national phytosanitary authority;
Phytosanitary certificate issued by VPSS
Quality certificate from producer (not obligatory)
Safety certificates (obligatory for EU countries to cite MRLs - see list below)
The Russian government began imposing MRLs on fruit from the EU on July 1, 2008. As of November
15, 2008, imports of certain European products had to be accompanied by safety certificates issued by
several European laboratories. Those products include: grapes, peaches, nectarines, oranges, and
mandarins coming from Greece; peaches, nectarines, mandarins, grapefruits, pears, and oranges from

17
Spain; all products from Latvia; tomatoes, apples, carrots, beetroots, and cabbages form the
Netherlands; apples, celery, cabbage, and plums from Hungary; and grapes form Italy.
As of August 6, 2009, the customs duties for major fruit items were:
Apples (HS 080820, excluding for cider production)
From January to July 0.1 Euro/kg plus 18 percent VAT
From July to December 0.2 Euro/kg plus 18 percent VAT
Pears (HS 080810) 10 percent duty plus 18 percent VAT
Grapes (HS 080610) 5 per cent duty plus 18 percent VAT
Oranges (HS 08510) orange-percent , but not less than 0.02 Euro/kg plus18 percent VAT
Marketing:
In Russia, marketing of fresh produce is less developed than the promotion of snack, alcohol, dairy, and
confectionary items. However, within the last few years, exporting countries’ trade development
agencies, fresh produce associations, and larger exporters and importers have put more effort into
merchandising and promotion.
The marketing techniques and programs utilized differ depending on consumer awareness of the product
and whether the product is already available on the Russian market. If the product is new or needs
marketing support to overcome market access problems, government-funded trade facilitation programs
are often used to help build foreign markets for the exporting country. The Chilean government, through
its Chilean Fresh Fruit Association, is actively promoting the country as one of the leaders in fresh
produce exports from the Southern Hemisphere by hosting educational tours for importers, retailers, and
the media. In addition, they run consumer marketing programs, such as product tastings, product
merchandising displays, point-of-sale (POS) materials, and media placements. The Governments of
Korea and Japan regularly sponsor buyer missions to their counties in which they organize visits to the
country’s growing regions as well as trade meetings between growers and exporters. These buyer
missions are successful in introducing new products to potential buyers and are critical for establishing
direct contacts between buyers and sellers.
For the products already available on the Russian market, distributor- and consumer-oriented marketing
programs are used to solidify consumer awareness and develop sales. Some distributor- and retail-
focused marketing techniques include product handling training, product education materials, and food
safety or supply chain seminars. Typical consumer-oriented marketing techniques include internet
promotions and giveaways, POS materials, in-store promotions, billboard advertising, and print
advertising campaigns.
According to Fresh News (www.freshnews.ru), President of the World Apple and Pear Association
Alexander Dalpiaz, said during the Prognosfrutis Conference in August 2009 that, “Russia remains the
key and most prosperous market for European produce and European companies' success is in
developing partnership relations with Russia.” In MY 2008, various government agencies from Europe,
together with their produce associations, launched several new projects to promote fresh produce
exports from the EU. The European apple association “Pink Lady” has a robust campaign promoting its
Pink Lady apples in Russia by organizing retail displays and in-store product tastings. The Spanish fresh
produce marketing organization, Anecoop, and an alliance of the 5 major Italian apple growers recently
announced the opening of their trade representative offices in Moscow. These offices will help connect
Russian importers with growers, negotiate contracts, coordinate product deliveries, and monitor quality

18
and control. Russian importers believe this sort of in-country representation will create a significant
competitive advantage for Italian and Spanish products, because they will be able to deal with a single
person in Russia who is responsible for both signing contracts and overseeing the quality and control.
This is especially meaningful to Russians because culturally, they put a high value on face-to-face
business relationships. European exporters, even those who do not have full time representative offices
in Russia, regularly visit the country which helps raise their Russian partners’ comfort level and
reinforces the relationship-based way of doing business.
Other relevant reports:
RS 9304 Exporters Guide
http://gain.fas.usda.gov/Recent%20GAIN%20Publications/EXPORTER%20GUIDE%20ANNUAL_Mo
scow%20ATO_Russian%20Federation_9-15-2009.pdf
RS 9008 Economic Crisis Update
http://www.fas.usda.gov/gainfiles/200902/146327327.doc
Food and Agricultural Import Regulations and Standards Country Report 2009
http://gain.fas.usda.gov/Recent%20GAIN%20Publications/Food%20and%20Agricultural%20Import%2
0Regulations%20and%20Standards%20-
%20Narrative_Moscow_Russian%20Federation_11.08.2009.pdf
RS 8308 Fresh Deciduous Fruit Report 2008
http://www.fas.usda.gov/gainfiles/200811/146306497.doc
RS 7335 Fresh Deciduous Fruit Report 2007
http://www.fas.usda.gov/gainfiles/200712/146293158.doc
Production, Supply and Demand Data Statistics:
Table 1. PSD Table, Apples
Fresh
Apples, Russia
Apples, Fresh
(HA)(1000)(MT)
2007/2008 2008/2009 2009/2010
Market Year Begin: Jul 2007 Market Year Begin: Jul 2008 Market Year Begin: Jul
2009
USDA Official
Data
Old
Post Data
USDA Official
Data
Old
Post Data
USDA
Official
Data
New Post Estimate

19
Area Planted
385 000
385
000
258 000
390 000
390
000
250 000
248 000
Area Harvested 320 000
320
000
210 000
325 000
325
000
190 000
188 000
Bearing Trees
120 000
120
000
80 000
126 000
126
000
85 000
80 000
Non-Bearing Trees 40 000
40
000
25 000
42 500
42
500
35 000
40 000
Total Trees
160 000
160
000
105 000
168 500
168
500
120 000
120 000
Commercial Production 1 250
000
1 250
000
930 000
1 250
000
1 250
000
775 000
820 000
Non-Comm. Production 550 000
550
000
370 000
550 000
550
000
340 000
330 000
Production
1 800
000
1 800
000
1 300
000
1 800
000
1 800
000
1 115 000
1 150 000
Imports
940 000
940
000
940 000
1 200
000
800
000
1 147 000
1 170 000
Total Supply
2 740
000
2 740
000
2 240
000
3 000
000
2 600
000
2 262 000
2 320 000
Fresh Dom. Consumption
1
326 000
1 361
200
1 365
000
1
692 000
1 292
000
1 350 000
1 450 000
Exports
4 000
3 800
4000
3 000
3 000
5 000
6 000
For Processing
1 400
000
1 365
000
861 000
1 300
000
1300
000
887 000
839 000
Withdrawal From Market 10 000
10
000
10 000
5 000
5 000
20 000
25 000
Total Distribution 2 740
000
2 740
000
2 230
000
3 000
000
2 600
000
2 262 000
2 320 000
Sources: Rosstat [1] , All Russia Agricultural Census, and Global Trade Atlas
[1]
Revised data for 2007 was provided in 2009.

20
Table 2. PSD Table, Pears
Fresh
Pears, Russia
Pears, Fresh
(HA)(1000)(MT)
2007/2008 2008/2009 2009/2010 Market Year Begin: Jul
2007 Market Year Begin:
Jul 2008 Market Year Begin:
Jul 2009
USDA
Official
Data
Old Post
Data
USDA
Official
Data
Old
Post Data
USDA
Officia
l Data
New Post Estimat
e
Area Planted 58 200 58
200 45
000 58
00
0
58
00
0
43 000 43 000
Area Harvested 39 000 39
000 30
000 39
00
0
39
00
0
30 000 30 000
Bearing Trees
12 200
12
200
13
000
12
40
0
12
40
0
13 000
13 000
Non-Bearing Trees
7 600 7
600
5
000
6
00
0
6
00
0
5 000
5 000
Total Trees 19 800 19
800 18
000 18
40
0
18
40
0
18 000 18 000
Commercial Production
30 000
30
000
35
000
30
00
0
30
00
0
30 000
30 000
Non-Comm. Production 140 000
140
000
155
000
14
5
00
0
14
5
00
0
150 00
0
150 000
Production 170 000 170
000 190
000 17
5
00
0
17
5
00
0
180
000 180 000
Imports 397 000 397
000 397
000 36
0
00
0
34
5
00
0
316
000 320 000
Total Supply 567 000 567
000 587
000 53
5
00
0
52
0
00
0
496
000 500 000
Fresh Dom. Consumption
450 800
450
800
450
000
42
6
00
0
41
1
00
0
425
000
430 000
Exports 2 000 2
000 2
000 1
00
0
1
00
0
2 000 2 000
For Processing
21
110 000 110
000 131
000 10
5
00
0
10
5
00
0
65 000 64 000
Withdrawal From Market 4 200
4
200
4000
3
00
0
3
00
0
4 000
4 000
Total Distribution 567 000
567
000
587
000
53
5
00
0
52
0
00
0
496
000
500 000
Sources: Rosstat [1] , All Russia Agricultural Census, and Global Trade Atlas
[1]
Revised data for 2007 was provided in 2009.
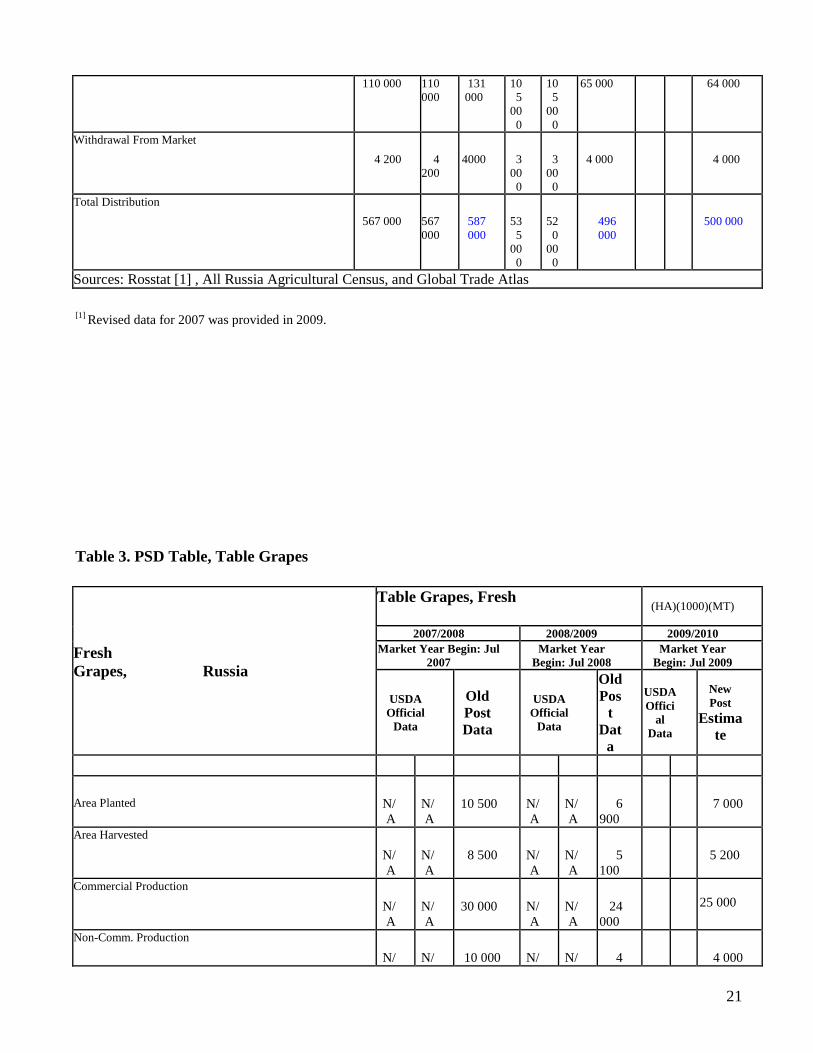
Table 3. PSD Table, Table Grapes
Fresh
Grapes, Russia
Table Grapes, Fresh
(HA)(1000)(MT)
2007/2008 2008/2009 2009/2010 Market Year Begin: Jul
2007 Market Year
Begin: Jul 2008 Market Year
Begin: Jul 2009
USDA
Official
Data
Old
Post Data
USDA
Official
Data
Old
Pos
t Dat
a
USDA
Offici
al
Data
New
Post Estima
te
Area Planted
N/
A
N/
A
10 500
N/
A
N/
A
6
900
7 000
Area Harvested N/
A
N/
A
8 500
N/
A
N/
A
5
100
5 200
Commercial Production N/
A
N/
A
30 000
N/
A
N/
A
24
000
25 000
Non-Comm. Production N/
N/
10 000
N/
N/
4
4 000

22
A A A A 000 Production N/
A N/
A 40 000 N/
A N/
A 28
000 29 000
Imports 41
3
50
0
41
3
00
0
413 0
00 37
0
00
0
34
3
00
0
393
000 380
000
Total Supply N/
A N/
A 453 000 N/
A N/
A 421
000 409 000
Fresh Dom. Consumption 41
3
55
3
41
3
05
3
451 00
0
37
0
05
5
34
3
05
5
418
000
407 000
Exports N/
A N/
A 1000 N/
A N/
A 1
000 1 000
For Processing N/
A
N/
A
0
N/
A
N/
A
0
0
Withdrawal From Market N/
A
N/
A
1 000
N/
A
N/
A
2
000
1 000
Total Distribution 41
3
55
3
41
3
05
3
453 000 37
0
05
5
34
3
05
5
421
000 409 000
Sources: Rosstat [1] , All Russia Agricultural Census, Global Trade Atlas [1]
Revised data for 2007 was provided in 2009.


