Running head: GEOGRAPHIC PROFILING SURVEY
Geographic Profiling Survey: A Preliminary Examination of
Geographic Profilers’ Views and Experiences
Karla Emeno1*, Craig Bennell2, Brent Snook3, and Paul J. Taylor4
1University of Ontario Institute of Technology, Oshawa, Ontario, Canada; 2Carleton University,
Ottawa, Ontario, Canada; 3Memorial University, St. John’s, Newfoundland and Labrador,
Canada; 4Lancaster University, Lancaster, United Kingdom.
*Correspondence should be addressed to Karla Emeno, Faculty of Social Science and
Humanities, University of Ontario Institute of Technology, 2000 Simcoe Street North, Oshawa,
Ontario, Canada, L1H 7K4. Email: [email protected].
Special thanks to the reviewers of the initial draft of this paper for their valuable feedback.

GEOGRAPHIC PROFILING SURVEY 2
Karla Emeno is Assistant Professor of Forensic Psychology in the Faculty of Social
Science and Humanities at the University of Ontario Institute of Technology, Oshawa,
Canada. Her research has primarily examined investigative and crime prevention
techniques, such as geographic profiling, space-time clustering of crime, and predictive
crime mapping. Recent and upcoming research projects also focus on key topics in
policing, including recruitment, selection, and stress.
Craig Bennell is Professor of Psychology at Carleton University, Ottawa, Canada and
Director of Carleton’s Police Research Lab. Much of his research examines the
reliability, validity, and usefulness of psychologically-based investigative techniques,
including criminal and geographic profiling. Craig’s other stream of research examines
factors that influence police decision-making in use-of-force encounters.
Brent Snook is Professor of Psychology at Memorial University, Newfoundland and
Labrador, Canada and Director of Memorial’s Psychology and Law Lab. His research
aims to advance scientific and legal literacy within the criminal justice system and
conduct research that improves the administration of justice. Specifically, Brent’s
research examines the validity and reliability of various psychological-based
investigative practices and decision making within the criminal justice system.
Paul J. Taylor is Professor of Psychology at Lancaster University, United Kingdom. His
research has focused on how people cooperate by examining both the fundamental
behavioural and cognitive processes that make human interaction possible and, more
practically, the kinds of tactics and policies that promote peaceful resolutions. Paul is also
the Director of Security-Lancaster, a university-wide centre of excellence comprising
approximately 60 staff and the latest in research and training facilities.
GEOGRAPHIC PROFILING SURVEY 3
ABSTRACT
Geographic profiling can be described as an investigative technique that involves
predicting a serial offender’s home location (or another anchor point) based on where he
or she has committed their crimes. Although the use of geographic profiling in police
investigations appears to be on the rise, little is currently known about the procedure and
how it is used in operational settings. To examine these issues a survey was distributed to
police professionals in the United States, Canada, the United Kingdom, Germany,
Australia, Japan, the Netherlands, and South Africa. The survey consisted of questions
designed to assess: (1) how geographic profiles are constructed, (2) the perceived
usefulness and accuracy of geographic profiling, (3) whether core geographic profiling
conditions are examined before profiles are constructed, and (4) the types of cases where
geographic profiling is used. The results suggest that geographic profiles are commonly
used in operational settings even when geographic profiling conditions are violated. In
addition, general perceptions of geographic profiling accuracy and usefulness appear to
be high. Although preliminary in nature, the results from this study help enhance
understanding of how geographic profiling is used in police investigations around the
world, and under what conditions. The survey also provides directions for future research
on the topic of geographic profiling.
Keywords: geographic profiling, serial offenders, crime investigation, serial crime,
investigative psychology
GEOGRAPHIC PROFILING SURVEY
4
INTRODUCTION
Geographic profiling (GP) is ‘a criminal investigative methodology that analyses the
locations of a connected series of crime to determine the most probable area of offender
residence’ (Rossmo, 2012, p. 144). Although there are many different ways in which GP
can be used to aid in the investigation of serial crime, it is often relied on as a tool for
prioritizing potential suspects, with those suspects living closest to the predicted home
location being focused on first (Rossmo, 2000). Despite the use of GP in police
investigations appearing to be on the rise, little is currently known about the GP
procedure and how it is used in operational settings. Thus, the current study helps fill this
gap in the literature through the use of an international online survey.
Conducting GP
Although there are many different strategies available for conducting GP, all of them rely
on the same underlying theoretical assumptions: (1) most serial offenders do not travel
far from their home location to commit their crimes (distance decay) and (2) most serial
offenders live within the area covered by their criminal activity (domocentricity). These
numerous GP strategies can be broadly classified as either spatial distribution strategies
or probability distance strategies (Snook, Zito, Bennell, & Taylor, 2005). Spatial
distribution strategies involve using the distribution of crime site locations to calculate a
central point, which serves as the offender’s predicted residence. Some examples of
spatial distribution strategies include the calculation of the centroid, spatial mean, and the
centre of minimum distance. The centroid calculation is one of the most commonly used
spatial distribution strategies and involves averaging the x-y coordinates of a linked series
of crimes to identify the likely location of the offender’s residence.

GEOGRAPHIC PROFILING SURVEY
5
Probability distance strategies, on the other hand, predict the offender’s residence
by applying a type of mathematical function (e.g., linear, lognormal, truncated negative
exponential) to each of the crime sites. This produces a probability surface that specifies
how likely it is that the offender resides in each of the possible areas within their activity
space (Snook et al., 2005). This surface can then be searched in a systematic fashion for
the offender’s residence (i.e., starting at the highest point of probability and working
outward). The use of computerized systems that rely on probability distance strategies
(e.g., Rigel, CrimeStat, Dragnet) is currently the most common way of conducting GP
(Snook et al., 2005).
Accuracy of GP
A range of research has been conducted to assess the accuracy of various GP approaches
with some of this research focusing on the accuracy of computerized GP systems.
Rossmo (2000), for example, used information from selected FBI serial murder cases to
evaluate Rigel and found a mean hit score percentage of 6% (i.e., on average, only 6% of
the total prioritized search area had to be searched before the offender’s home location
was found). Similarly, Canter, Coffey, Huntley, and Missen (2000) examined the GP
system Dragnet by using body disposal locations of 79 American serial killers and found
an average hit score percentage across the sample of 11%.
Other research has compared the accuracy of simpler spatial distribution strategies
to that of more complex probability distance strategies. For example, Snook et al. (2005)
rated 11 different GP strategies (six spatial distribution and five probability distance
strategies) in terms of their complexity and assessed their accuracy using crime data from
16 UK serial burglars. They found that strategy complexity was not positively correlated
GEOGRAPHIC PROFILING SURVEY
6
with accuracy, suggesting that complex GP strategies are not necessarily better than
simpler strategies. In another study, Paulsen (2006a) compared several GP systems
(Rigel, Dragnet, CrimeStat) to spatial distribution strategies using crime series of various
types and found that the more complex probability strategies did not generate
substantially more accurate geographic profiles than the simple spatial distribution
strategies.
Finally, a series of studies have been conducted to examine whether clinical (i.e.,
human-based) forms of GP are as effective as more complex (i.e., computer-based) forms
of GP (e.g., Bennell, Snook, Taylor, Corey & Keyton, 2007; Paulsen, 2006b; Snook,
Canter, & Bennell, 2002; Snook, Taylor, & Bennell, 2004). Bennell, Taylor, and Snook
(2007) conducted a review of this research and found that training participants in simple
GP strategies (i.e., heuristic training) resulted in significantly more accurate predictions.
In addition, this training often, but not always, allowed human judges to perform as well
on GP tasks as a range of computer-based forms of GP.
One possible reason for these conflicting findings is the use of two different
evaluation measures: (1) error distance and (2) hit score percentage. Error distance refers
to the distance between the offender’s predicted home location, which is produced by the
GP technique being examining, and his or her actual residence. Hit score percentage, on
the other hand, refers to the percentage of the total prioritized search area (produced by
the GP system) that has to be searched (when working from the highest to the lowest
probability point) before the offender’s home base is located. Although hit score
percentage is considered more reflective of how geographic profiles are used by police in
an investigative setting (Rossmo, 2011), some still consider error distance useful as it can

GEOGRAPHIC PROFILING SURVEY
7
be easily calculated and readily applied to all methods of GP, including those that do not
produce search areas (i.e., strategies that result in a single prediction point), and it has
been recommended for use in a National Institute of Justice funded proposal of how to
evaluate GP systems (Rich & Shively, 2004).
Conditions of GP
According to Rossmo (2000, 2005), GP is only feasible when the following five
conditions are met:
1. the offender has committed a minimum of five crimes,
2. the crimes are linked to the same offender and the series is relatively complete,
3. the offender committing the crimes has not commuted into the area of criminal
activity,
4. the offender has not moved anchor points (or operated from multiple anchor points)
during his or her crime series, and
5. the distribution of suitable targets (i.e., the target backcloth) is relatively uniform
around the offender’s home.
However, at the time of the investigation it is often challenging to determine
whether all of these conditions have been met; for example, whether the offender is a
commuter or a marauder. Marauders can be described as those offenders whose home
location (or anchor point) is located within their area of criminal activity, whereas
commuters commit their crimes in a different area from their home (Canter & Larkin,
1993). Paulsen (2007) found the “best guess” rate of commuter/marauder predictions to
be 60%, which suggests that accurate commuter/marauder predictions may not be
possible at the time of the investigation. However, prediction accuracy did increase to

GEOGRAPHIC PROFILING SURVEY
8
81% when designated predictor variables, which were all known or could be calculated at
the time of the investigation, were used. The three significant predictor variables were all
geographic or temporal in nature. In contrast, the traditional modus operandi related
variables (e.g., victim type, crime type, and night-time activity), which are more readily
available at the time of the investigation, were not significant predictors of
commuter/marauder classification.
In addition, these conditions have not always been met in previous GP research.
For example, studies examining GP accuracy have often included offenders who have
committed a minimum of only three crimes (e.g., Paulsen, 2006a; Snook et al., 2004). As
well, many GP accuracy studies have included both commuters and marauders, in their
analyses (e.g., Canter et al., 2000; Paulsen, 2006b). However, Rossmo (2005) suggests
that these GP studies bear little resemblance to actual police investigations, emphasizing
the need for research examining the GP procedure and how it is used in operational
settings.
Type of cases where GP is used
Although originally developed for the investigation of serial murder, GP has
subsequently been applied to numerous other serial crime types, such as rape, arson,
robbery, bombings, burglary, fraud, auto theft, and kidnappings (Rossmo, 2012).
However, research does suggest that GP accuracy can be expected to vary depending on
the crime type to which it is applied. For example, in Paulsen’s (2006a) study where the
accuracy of several GP systems was compared to that of spatial distribution strategies, he
found that crime type did indeed influence the accuracy of the GP profile, regardless of
what GP profiling strategy was used. Specifically, certain crime types (auto theft, street
GEOGRAPHIC PROFILING SURVEY
9
robbery, and residential burglary) yielded substantially more accurate results than other
crime types (commercial robbery and larceny). In addition, findings from other research
suggest that offenders of interpersonal crime are more likely to be marauders than
offenders of property crime (e.g., Canter & Larkin, 1993; Kocsis & Irwin, 1997; Santtila,
Laukkanen, & Zappalà, 2007). Given that GP is only accurate when applied to marauding
offenders, it can be expected that GP will be more accurate when applied to interpersonal
crime than when applied to property crime.
The current study
As previously mentioned, the use of GP in police investigations appears to be on the
increase; however, little is currently known about the GP procedure and how it is used in
operational settings. Thus, the current study examined the use of GP in operational
settings by collecting survey responses from geographic profilers around the world. It is
important to note that the current research is exploratory in nature, allowing for a
preliminary examination of real-world geographic profilers’ views and experiences of
GP. Although the results are preliminary, this study still makes an important contribution
to the GP literature as the results begin to enhance our understanding of how GP is used
in police investigations around the world, and under what conditions. In addition, the
results can be used to inform future GP research, which could lead to subsequent
improvements in GP from an operational standpoint.
METHOD
Survey Monkey was used to create an online survey that was distributed to police
professionals in Canada, the United States, the United Kingdom, Germany, Australia,
Japan, the Netherlands, and South Africa, who have personally generated a geographic

GEOGRAPHIC PROFILING SURVEY
10
profile in order to assist with a police investigation (this was assessed via self-report).
Recruitment for participants involved direct contact with colleagues and GP researchers,
contact through various police and crime mapping electronic mailing lists and online
discussion groups, and contact through word of mouth at police-related conferences. The
recruitment message briefly described the study and the survey as well as the
requirements to participate. The recruitment message also included a link to the online
survey with the survey remaining available for completion for 10 consecutive months
(September 15, 2011, until July 15, 2012).
Survey
The survey, which was developed by the authors, required approximately 20 to 30
minutes to complete and contained a total of 47 questions, which were primarily closed-
ended (i.e., multiple choice) and designed to assess:
1. how geographic profiles are constructed,
2. the perceived usefulness and accuracy of GP,
3. whether core GP conditions are examined before profiles are constructed, and
4. the types of cases where GP is used.
Although the survey consisted of 47 questions in total, the exact number of
completed questions varied across the respondents depending on their answers to
previous questions (e.g., if a respondent answered “No” to having received training in GP
then they automatically skipped the follow-up question where they were asked to specify
the type of training received, thus reducing the total number of questions answered). A
copy of the complete survey is available upon request from the first author.
Sample

GEOGRAPHIC PROFILING SURVEY
11
In total, 35 individuals began the online survey. However, four were excluded from
completing the survey as they had not personally generated a geographic profile in order
to assist with a police investigation, which was a requirement for participation in the
study. An additional nine respondents abandoned the survey midway through and as a
result, their partial responses were also excluded from the analysis. Thus, the final sample
for the current study consisted of 22 individuals (16 males, 6 females) who had
personally constructed a geographic profile (mean age = 44.6 years, SD = 9.2; age range
= 29 to 65). Fifteen individuals worked for a police department with two of the remaining
seven respondents having at least some background experience in policing. Almost three-
quarters of respondents (73%) worked in North America (United States n = 9, Canada n =
7) with the remainder working in the United Kingdom (n = 2), South Africa (n = 2),
Netherlands (n = 1), and Italy (n = 1). The level of experience in generating geographic
profiles varied greatly within the sample with a little over half of respondents (55%, n =
12) having generated 10 or less, 18% (n = 4) having generated between 11 and 20, one
respondent having generated approximately 70, and 14% (n = 3) having generated 100 or
more; two participants did not respond to this question. In addition, 77% of respondents
(n = 17) had some form of GP training.
Given the method of survey dissemination (i.e., survey link sent out to an
unknown number of potential participants via electronic mailing lists, online discussion
groups, and email), it is not possible to determine an exact response rate. However, the
small sample size (N = 22) suggests that the response rate was low, which is certainly not
uncommon in research surveying police personnel. Burrell and Bull (2011), for example,
surveyed 72 crime analysts in order to examine their views and experiences of
GEOGRAPHIC PROFILING SURVEY
12
comparative case analysis and reported that only 18 responded, for a response rate of
25%. In another study, Jamel, Bull, and Sheridan (2008) investigated specialist police
service provided to male rape survivors by sending surveys to 300 officers and received
just 19 responses (response rate = 6.3%). As well, although it is recognized that the
findings of this research will not necessarily be generalizable to all geographic profilers
working in operational settings, recall that the purpose of this study was to offer a
preliminary examination of real-world geographic profilers’ views and experiences of
GP. Consequently, it was decided that the current, albeit small, sample was sufficient for
achieving the primary aims of this research.
Analysis
Given the small sample size (N = 22), the survey data is examined primarily in terms of
descriptive analyses, such as frequencies and means, across each of the four themes.
Although survey non-completers were removed from the analyses, respondents were
permitted to skip (i.e., not respond to) questions. In addition, not all questions were
relevant to all respondents. As a result, the total number of responses varies by question
and does not necessarily remain constant at 22.
RESULTS
How geographic profiles are constructed
The vast majority of respondents typically or always construct a geographic profile
individually (91%, n = 20) rather than in a group (9%, n = 2). In terms of the GP methods
used to generate geographic profiles, 77% reported that they had used computerized GP
systems (n = 17), followed by spatial analysis techniques and educated guesses (e.g.,
eyeballing a map and estimating an anchor point) with both having been used by 27% of

GEOGRAPHIC PROFILING SURVEY
13
respondents (n = 6). However, there were some interesting differences among those
respondents who had received GP training compared to those who had not. Specifically, a
greater proportion of trained respondents (94%, n = 16) had used computerized GP
systems to generate a profile than untrained respondents (20%, n = 1). In addition, a
greater proportion of untrained respondents (60%, n = 3) reported having used an
educated guess to generate a geographic profile compared to the trained respondents
(17.6%, n = 3).
Among the 17 trained and untrained respondents who had used computerized GP
systems, Rigel was the most popular at 53% (n = 9), followed by CrimeStat at 47% (n =
8), and Dragnet at 18% (n = 3). Of the six respondents who had used spatial analysis
techniques to generate a geographic profile, the centre of the circle was the most popular
(67%, n = 4), followed by the median (50%, n = 3), centroid (50%, n = 3), and centre of
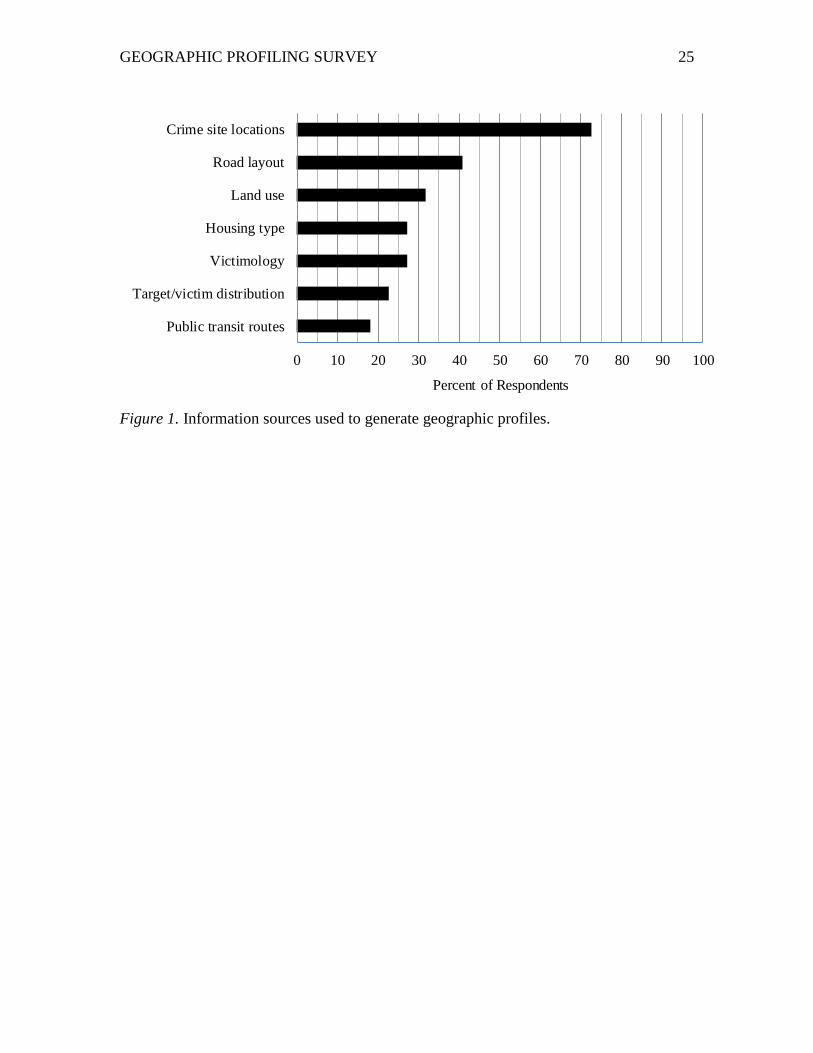
minimum distance (50%, n = 3). Respondents reported having used a variety of
information sources to generate their geographic profiles with crime site locations being
the most commonly cited (73%, n = 16) (see Figure 1 for frequencies for additional
information sources). Finally, GP has most frequently been implemented as an
investigative tool by increasing patrol intensity in the area where the offender might live
or work (77% for both, n = 17) (see Table 1 for frequencies for additional
implementations of GP as an investigative tool).
[Insert Figure 1 and Table 1 about here]
Perceived accuracy/usefulness of GP
On average, respondents have found GP to be useful in moving the investigation forward
in a little over half of the cases where it has been used (M = 53.2% of cases, SD = 28.44).
GEOGRAPHIC PROFILING SURVEY
14
Computerized GP systems were ranked the highest with 75% of respondents ranking it as
producing both the most accurate and operationally useful profiles. Spatial analysis
techniques were ranked second by 70% and 60% of respondents in terms of producing
the most accurate and operationally useful profiles, respectively. In comparison to the
other two methods, 76% and 80% of respondents ranked an educated guess as producing
the least accurate and least useful profiles, respectively. Approximately three-quarters of
respondents (77%, n = 17) indicated that training should be required for individuals
constructing geographic profiles. Finally, almost all of the respondents (91%, n = 20)
would consider constructing a geographic profile again in the future and all respondents
(n = 22) reported that they would consider using GP as an investigative tool again in the
future.
GP conditions
Recall that Rossmo’s (2000) five conditions of GP are: (1) the offender has committed a
minimum of five crimes, (2) the crimes are linked to the same offender and the series is
relatively complete, (3) the offender committing the crimes has not commuted into the
area of criminal activity, (4) the offender has not moved anchor points (or operated from
multiple anchor points) during his or her crime series, and (5) the distribution of suitable
targets (i.e., the target backcloth) is relatively uniform around the offender’s home.
Figure 2 compares the percent of respondents who only use GP if a particular condition is
met to those who use GP even if the condition is violated. Note that for conditions 3, 4,
and 5 the grey bar consists of both those respondents who do not attempt to determine
whether the offender is a commuter, the offender has moved anchor points, or the target
backcloth is uniform prior to constructing the GP profile, as well as those respondents

GEOGRAPHIC PROFILING SURVEY
15
who do attempt to determine those things, but still use GP even if the condition is
violated.
Note that condition 2 is not included in Figure 2 as it was not assessed using a
yes/no question. On average, respondents had to be fairly positive that the series of
crimes under investigation was committed by the same offender before they would use
GP on that series (M = 74.1% positive that the series of crimes was committed by the
same offender, SD = 21.3). In addition, many respondents reported that prior to
constructing the geographic profile, they would first check with neighbouring police
forces to see whether they also have crimes that could potentially be linked to the same
offender (65%, n = 13) or that they already had access to crimes committed in nearby
areas so contacting neighbouring police forces was not necessary (25%, n = 5). Thus, it
appears that respondents are taking steps to ensure that the crime series is relatively
complete and that the crimes can be linked to the same offender. However, it is still
possible that GP is used in operational settings when condition 2 is violated given that it
is not always possible to determine at the time of the investigation whether the series is
complete and whether all crimes in the series were committed by the same offender.
In regards to the remaining four GP conditions, Figure 2 indicates that the
majority of respondents still use GP even if these conditions are not met. This is
particularly the case for conditions 3, 4, and 5 where 96%, 96%, and 91%, respectively,
reported that they still use GP even if that particular condition is violated. The sample
was more split over condition 1 with 48% reporting that they only construct a geographic
profile if there are at least five crimes in the series, in comparison to the 52% who use GP
even if there are fewer than five crimes in the series. When broken down by GP training

GEOGRAPHIC PROFILING SURVEY
16
the condition results were similar across the two groups except that in comparison to the
untrained respondents (20%, n = 1), a greater proportion of trained respondents (56.3%, n
= 9) would only use GP if there were a minimum of 5 crimes in the series.
[Insert Figure 2 about here]
Types of cases where GP is used
Many respondents have used GP to generate profiles for a variety of crime types, such as
burglary (59.1%, n = 13), robbery (50%, n = 11), murder (36.4%, n = 8), auto theft
(31.8%, n = 7), rape (31.8%, n = 7), and arson (31.8%, n = 7). In addition, approximately
a third of respondents (31.8%, n = 7) have used GP most often in murder cases followed
by burglary and robbery (both at 22.7%, n = 5). Table 2 presents the frequencies for all
crime types included in the survey. As well, the majority of respondents (68%, n = 15)
would still use GP in cases where the crime series contains more than one crime type.
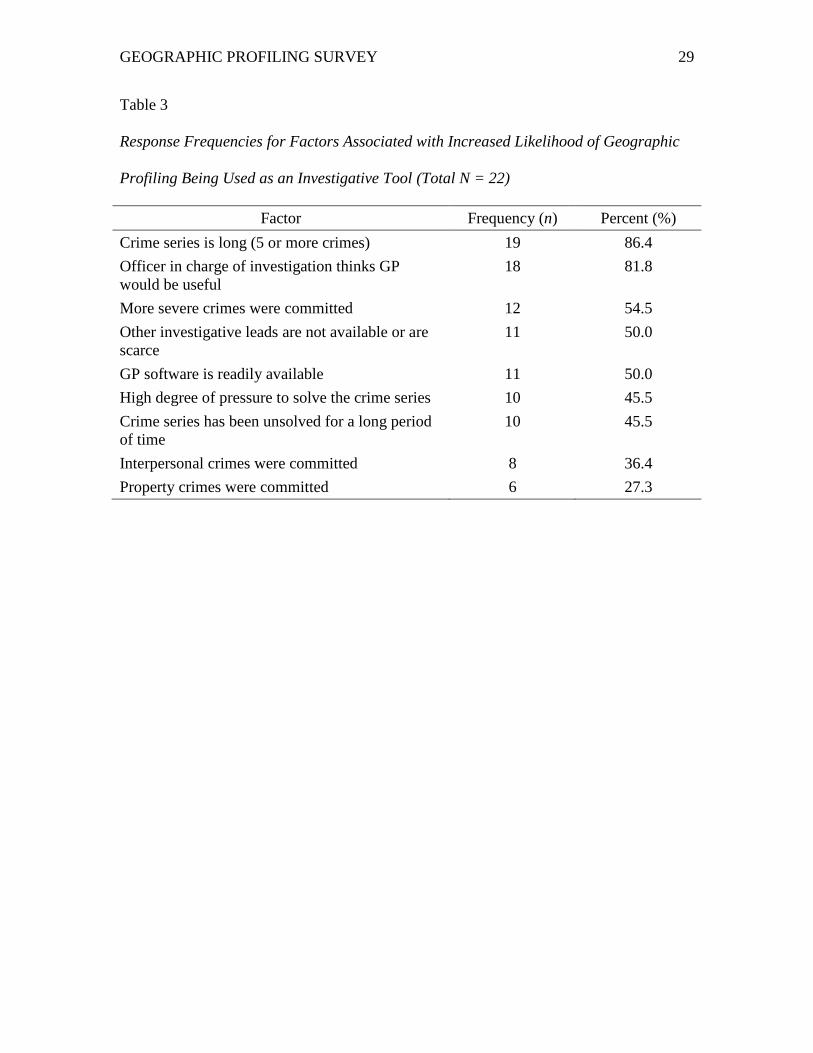
The most commonly cited factors that would increase the likelihood of GP being used as
an investigative tool include a large crime series (86%, n = 19) and the officer in charge
of the investigation thinking that GP would be useful (82%, n = 18) (see Table 3 for
additional factor frequencies).
[Insert Tables 2 and 3 about here]
DISCUSSION
Although the results from the current study are only preliminary in nature, they do begin
to enhance our understanding of how geographic profiling is used in police investigations
around the world, and under what conditions. Overall, the results indicate that geographic
profiles are frequently generated even when GP conditions are violated. More
specifically, GP is still being used in investigative settings even when the crime series

GEOGRAPHIC PROFILING SURVEY
17
contains fewer than 5 crimes, the offender may be a commuter, the offender may have
moved anchor points during the crime series, and the distribution of suitable targets is
non-uniform around the offender’s home.
There are various interpretations possible for the finding that respondents
commonly generate geographic profiles even when GP conditions are violated. First,
respondents could have inappropriately used GP in problematic cases when they should
not have done so, which points to a training issue. Second, respondents could have taken
a calculated risk and knowingly used GP in problematic cases, resulting in a geographic
profile that was potentially helpful, but not as accurate as it would have been if the
conditions had been met. This demonstrates the trade-offs between utility and
performance. Third, respondents used GP in problematic cases and found an effective
means of managing the violated condition(s), which has been shown to be possible in
some cases (Rossmo & Velarde, 2008). This highlights the importance of sharing best
practices in managing the violation of conditions when conducting GP. Regardless of the
interpretation, this finding indicates that assessing GP accuracy using crime data where
one or more of the GP conditions are violated, particularly those that can be hard to
determine at the time of the investigation, may actually provide a more realistic
assessment of real-world GP accuracy. This is in contrast with Rossmo’s (2005)
suggestion that GP studies that rely on crime data where these conditions are violated
bear little resemblance to actual police investigations.
This claim is not completely accurate; the specific quote was, “their laboratory
experiment bears little resemblance to the reality of criminal investigation. Major flaws
exist with both data selection (the cases used may not have met the assumptions

GEOGRAPHIC PROFILING SURVEY
18
underlying geographic profiling, and they only involved a series of three locations, too
low for pattern detection), and methods of analysis (nonlinear error was measured
linearly, and computerized geographic profiling search strategies were distorted)” (p.
651).
The results also suggest that perceptions of GP accuracy and usefulness were
mostly positive among the sample with almost all respondents agreeing that they would
construct and use geographic profiles as an investigative tool again in the future. In
addition, computerized GP systems were used most frequently and were considered to
produce both the most accurate and most useful profiles in comparison to spatial analysis
techniques and educated guesses. This finding is interesting given some error distance
research suggesting that simple GP strategies, such as trained human judges and spatial
distribution methods, can often make GP predictions just as accurate as more complex
forms, such as computerized GP systems (e.g., Bennell, Snook, et al., 2007; Paulsen
2006a; Snook et al., 2002; Snook et al., 2004; Taylor, Bennell, & Snook, 2009).
A greater proportion of trained respondents had generated profiles using
computerized GP systems than untrained respondents. This finding could simply suggest
that geographic profilers are more likely to receive training on how to use computerized
GP programs rather than theory. The majority of respondents indicated that they would
still use GP in cases where the crime series contains more than one crime type. This is not
viewed as overly problematic, however, given that research suggests that the inclusion of
multiple crime types in a series does not negatively impact GP accuracy and can even
result in more accurate and precise profiles (Leitner & Kent, 2009).
GEOGRAPHIC PROFILING SURVEY
19
Limitations of the current study and future research
It is still the consensus of the authors that the sample size in the current study was
sufficient to provide a preliminary examination of geographic profilers’ views and
experiences of GP, which was the goal of this research. In addition, the results reported
are largely in line with the GP literature, which makes us more comfortable reporting on
a sample of only 22 participants. However, it is acknowledged that the small sample size
is problematic in terms of providing a more extensive examination. Thus, the small
sample size is a major limitation to the current study in that it limits the generalizability
of the findings as well as limits the range of possible statistical analyses. Thus, future
research could further enhance understanding of how GP is used in police investigations
around the world, and under what conditions, by including a larger sample size. A larger
sample size would certainly allow for more extensive analyses. For example, the results
could be examined across various factors, such as age, police experience, country, and
level of GP training, in order to determine whether differences exist in terms of GP use
and perceived usefulness and accuracy. It would be particularly interesting to determine
whether GP use varies across geographic region.
In addition, non-completion was an issue in the current study. Thirty-one
individuals who met the participation requirements began the survey, but only 22 of them
completed it. The 29% dropout rate (n = 9) could suggest that the survey was too time-
consuming as longer online survey length has been associated with decreased completion
rates (Galesic & Bosnjak, 2009). Longer online survey length increases the opportunity
for respondents to lose motivation or become distracted (e.g., by time pressure or other
tasks at work), which help explain survey non-completion (Steinbrecher, Roßmann, &

GEOGRAPHIC PROFILING SURVEY
20
Blumenstiel, 2015). The results from the current study, however, could be used to inform
the development of a future GP survey so that a more streamlined version can be created
without the loss of valuable information. As well, a pilot study could be conducted in the
future that involves conducting focus groups with those who have constructed geographic
profiles for investigative purposes in order to develop survey questions that respondents
perceive as more useful, which would help decrease the dropout rate. Response rates in
future research could also be improved by obtaining the support of relevant professional
associations.
In addition, although we asked participants if they would still use GP even if
Rossmo’s various conditions were violated, we did not ask them if they have found that
violating these conditions impacted the quality of the geographic profile produced. A
future GP survey could include a question such as this in order to determine whether
profiles violating the conditions are actually less useful in practice than those not
violating those conditions. It is also important to note that the GP survey used in the
current study was self-report in nature. As with any research relying on self-report data,
there was the potential for participants in this study to be deceptive or dishonest in their
responses.
Participant recruitment was also an issue in the current study, as indicated by the
small sample size. As of 2012, over 600 people worldwide had been trained through a 2-
week Geographic Profiling Analysis course that is available through various universities
and police agencies internationally (Rossmo, 2012). Unfortunately, it appears that the
current study was not successful at reaching those individuals, despite the multiple
methods of survey dissemination (i.e., word of mouth, email, online discussion groups,

GEOGRAPHIC PROFILING SURVEY
21
electronic mailing lists) and frequent survey reminder messages. Thus, sample size could
likely be increased in future research through the adoption of alternative methods of
survey dissemination as well as through the use of a shorter survey.
CONCLUSION
In conclusion, the results from the current study suggest that geographic profiles are
commonly used in operational settings even when geographic profiling conditions are
violated. In addition, computerized GP systems are viewed as the most accurate and most
useful and are used most frequently. The results also suggest that perceptions of GP
accuracy and usefulness are positive with all respondents indicating they would use GP
again in the future. Given that these results suggest that police departments will continue
using GP as an investigative tool, continued research of effective uses of GP appears to
be warranted and useful from an operational standpoint. Thus, although these findings are
preliminary in nature and more research is needed, particularly with larger sample sizes,
they do begin to enhance our understanding of how GP is used in police investigations
around the world, and under what conditions.

GEOGRAPHIC PROFILING SURVEY
22
REFERENCES
Bennell, C., Snook, B., Taylor, P. J., Corey, S., & Keyton, J. (2007). It’s no riddle,
choose the middle: The effect of number of crimes and topographical detail on
police officer predictions of serial burglars’ home locations. Criminal Justice and
Behavior, 34, 119-132.
Bennell, C., Taylor, P. J., & Snook, B. (2007). Clinical versus actuarial geographic
profiling strategies: A review of the research. Police Practice and Research, 8, 335-
345.
Burrell, A., & Bull, R. (2011). A preliminary examination of crime analysts’ views and
experiences of comparative case analysis. International Journal of Police Science
and Management, 13, 2-15.
Canter, D. V., Coffey, T., Huntley, M., & Missen, C. (2000). Predicting serial killers’
home base using a decision support system. Journal of Quantitative Criminology,
16, 457-477.
Canter, D. V., & Larkin, P. (1993). The environmental range of serial rapists. Journal of
Environmental Psychology, 13, 63-69.
Galesic, M., & Bosnjak, M. (2009). Effects of questionnaire length on participation and
indicators of response quality in a web survey. Public Opinion Quarterly, 73, 349-
360.
Jamel, J., Bull, R., & Sheridan, L. (2008). An investigation of the specialist police service
provided to male rape survivors. International Journal of Police Science and
Management, 10, 486-508.
GEOGRAPHIC PROFILING SURVEY
23
Kocsis, R. N., & Irwin, H. J. (1997). An analysis of spatial patterns in serial rape, arson,
and burglary: The utility of the Circle Theory of environmental range for
psychological profiling. Psychiatry, Psychology and Law, 4, 195-206.
Leitner, M., & Kent, J. (2009). Bayesian journey-to-crime modeling of single and
multiple crime-type series in Baltimore, MD. Journal of Investigative Psychology
and Offender Profiling, 6, 213-236.
Paulsen, D. J. (2006a). Connecting the dots: Assessing the accuracy of geographic
profiling software. Policing: An International Journal of Police Strategies and
Management, 29, 306-334.
Paulsen, D. (2006b). Human versus machine: A comparison of the accuracy of
geographic profiling methods. Journal of Investigative Psychology and Offender
Profiling, 3, 77-89.
Paulsen, D. J. (2007). Improving geographic profiling through commuter/marauder
prediction. Police Practice and Research, 8, 347-357.
Rich, T., & Shively, M. (2004). A methodology for evaluating geographic profiling
software. Retrieved September 29, 2015, from
https://www.ncjrs.gov/pdffiles1/nij/grants/208993.pdf.
Rossmo, D. K. (2000). Geographic profiling. Boca Raton: CRC Press.
Rossmo, D. K. (2005). Geographic heuristics or shortcuts to failure?: Response to Snook
et al. Applied Cognitive Psychology, 19, 651-654.
Rossmo, D. K. (2011). Evaluating geographic profiling. Crime Mapping: A Journal of
Research and Practice, 3, 42-65.

GEOGRAPHIC PROFILING SURVEY
24
Rossmo, D. K. (2012). Recent developments in geographic profiling. Policing, 6, 144-
150.
Rossmo, D. K., & Velarde, L. (2008). Geographic profiling analysis: Principles, methods,
and applications. In S. Chainey & L. Tompson (Eds.), Crime mapping case studies:
Practice and research (pp. 35-43). Chichester: John Wiley & Sons.
Santtila, P., Laukkanen, M., & Zappalà, A. (2007). Crime behaviours and distance
travelled in homicides and rapes. Journal of Investigative Psychology and Offender
Profiling, 4, 1-15.
Snook, B., Canter, D. V., & Bennell, C. (2002). Predicting the home location of serial
offenders: A preliminary comparison of the accuracy of human judges with a
geographic profiling system. Behavioral Sciences and the Law, 20, 109-118.
Snook, B., Taylor, P. J., & Bennell, C. (2004). Geographic profiling: The fast, frugal and
accurate way. Applied Cognitive Psychology, 18, 105-121.
Snook, B., Zito, M., Bennell, C., & Taylor, P. J. (2005). On the complexity and accuracy
of geographic profiling strategies. Journal of Quantitative Criminology, 21, 1-26.
Steinbrecher, M., Roßmann, J., & Blumenstiel, J. E. (2015). Why do respondents break
off web surveys and does it matter? Results from four follow-up surveys.
International Journal of Public Opinion Research, 27, 289-302.
Taylor, P. J., Bennell, C., & Snook, B. (2009). The bounds of cognitive heuristic
performance on the geographic profiling task. Applied Cognitive Psychology, 23,
410-430.
GEOGRAPHIC PROFILING SURVEY
25
0 10 20 30 40 50 60 70 80 90 100
Public transit routes
Target/victim distribution
Victimology
Housing type
Land use
Road layout
Crime site locations
Percent of Respondents
Figure 1. Information sources used to generate geographic profiles.

GEOGRAPHIC PROFILING SURVEY
26
Figure 2. Graph comparing percent of respondents who use geographic profiling if
various conditions are violated to those who do not.
0102030405060708090
100
At least 5 crimesin the series
Offender is not acommuter
Anchor point hasnot moved
Uniform targetbackcloth
Only use GP ifcondition metUse GP if conditionviolated
0
10
20
30
40
50
60
70
80
90
100
At least 5 crimesin the series
Offender is not acommuter
Anchor point hasnot moved
Uniform targetbackcloth
Only use GP ifcondition met
Use GP if conditionviolated

GEOGRAPHIC PROFILING SURVEY
27
Table 1
Response Frequencies for how Geographic Profiling has been Implemented as an
Investigative Tool (Total N = 22)
Implementation Frequency (n) Percent (%) Increase patrol intensity in the area where the offender might live or work 17 77.3
Limit the suspect pool 14 63.6 Provide a starting area for door-to-door canvassing 13 59.1 Generate new tips by broadcasting the prioritized search area to the public 8 36.4
Identify an area for mass mail outs 5 22.7 Help determine probable body dump sites 3 13.6 Identify areas for DNA testing 3 13.6 Serve as evidence to help obtain a search or arrest warrant 2 9.1
Other 2 9.1

GEOGRAPHIC PROFILING SURVEY
28
Table 2
Response Frequencies for Crime Types Where Geographic Profiles have been Generated
(Total N = 22)
Crime Type Have Used GP Have Used GP Most Often
Frequency (n) Percent (%) Frequency (n) Percent (%) Burglary 13 59.1 5 22.7 Robbery 11 50.0 5 22.7 Murder 8 36.4 7 31.8 Auto theft 7 31.8 1 4.5 Rape 7 31.8 1 4.5 Arson 6 27.3 0 0 Theft from motor vehicle 3 13.6 2 9.1
Bombings 2 9.1 1 4.5 Shoplifting 2 9.1 0 0 Kidnapping 1 4.5 0 0
GEOGRAPHIC PROFILING SURVEY
29
Table 3
Response Frequencies for Factors Associated with Increased Likelihood of Geographic
Profiling Being Used as an Investigative Tool (Total N = 22)
Factor Frequency (n) Percent (%) Crime series is long (5 or more crimes) 19 86.4 Officer in charge of investigation thinks GP would be useful
18 81.8
More severe crimes were committed 12 54.5 Other investigative leads are not available or are scarce
11 50.0
GP software is readily available 11 50.0 High degree of pressure to solve the crime series 10 45.5 Crime series has been unsolved for a long period of time
10 45.5
Interpersonal crimes were committed 8 36.4 Property crimes were committed 6 27.3


