Roles of Multiple Mechanisms in Regulating Auxin Levels during Plant Growth and Development
A DISSERTATION SUBMITTED TO THE FACULTY OF THE GRADUATE SCHOOL
OF THE UNIVERSITY OF MINNESOTA BY
Xing Liu
IN PARTIAL FULFILLMENT OF THE REQUIREMENTS FOR THE DEGREE OF
DOCTOR OF PHILOSOPHY
Advisers: Jerry Cohen, Gary Gardner
April, 2012
© Copyright by Xing Liu 2012
All Rights Reserved

i
Acknowledgements
First and foremost I would like to sincerely thank my advisors Dr. Jerry Cohen
and Dr. Gary Gardner, who have guided me throughout my thesis work with their
patience, knowledge and experience, while also allowing me the room to develop my
own way of thinking and to work independently. I attribute my achievements during my
graduate studies to their encouragement, continuous support, and open minds, and
without which this dissertation would not be completed. In my scientific career, they
have been great models for me, and their mentoring will continue to help me become a
respectable investigator and educator.
I would like to express my great appreciation for faculty members of my advisory
committee, Dr. Jane Glazebrook, Dr. Neil Olszewski, and Dr. Adrian Hegeman, for their
valuable suggestions, critical comments, and helpful guidance on my graduate work and
thesis research. I also thank faculty members at the University of Minnesota, Dr. Carolyn
Silflow for advice during my first-year graduate studies and recommendations of
exceptional courses, Dr. Bill Gray for suggestions on my experimental design, and Dr.
John Ward for sharing the Arabidopsis nakr1 mutant seeds and his comments on my
project.
During my thesis research, I received generous and enormous support from Dr.
Lana Barkawi and Dr. Wen-Ping Chen, who shared with me their knowledge and
techniques with great patience and warm encouragement. Dr. Angela Hendrickson helped
me better comprehend the knowledge I received early in my graduate career, and Mr.
Doug Brinkman assisted in the preparation of my experimental systems. Further, I want
to give credit to all members in the lab groups associated with Dr. Cohen, Dr. Gardner
and Dr. Hegeman, who have provided comments on my research and helped improve my
presentation and writing skills.
Mentorship from faculty members outside of my university has left a profound
impression. Dr. Gloria Muday (Wake Forest University) taught me the method of
measuring polar auxin transport used in her lab. Dr. Jennifer Normanly (University of
ii
Massachusetts, Amherst), while on sabbatical in my lab, shared with me her professional
life experiences. Dr. Lucia Strader (Washington University in St. Louis) and Dr. Bonnie
Bartel (Rice University) provided Arabidopsis ibr 1 ibr 3 ibr 10 seeds and offered
inspiration in my current research and future career. Dr. Cris Kuhlemeier (University of
Bern, Switzerland) and Dr. Klaus Palme (University of Freiburg, Germany) hosted my
visit in their labs, where I learned techniques in visualizing proteins using florescent tags
and experienced European academic culture.
I thank Cold Spring Harbor Laboratory for holding the “Molecular Techniques in
Plant Science” workshop and providing me the tuition waiver scholarship when I
attended. I also thank Tomato Genetics Resource Center (University of California, Davis)
for offering the cry1, phyA, phyB1, and phyB2 tomato mutant seeds.
My research was funded by the U.S. Department of Agriculture National
Research Initiative (USDA-NRI), the National Science Foundation (NSF), Plant
Biological Science (PBS) Graduate Program, the Minnesota Agricultural Experiment
Station (AES), and the Gordon and Margaret Bailey Endowment for Environmental
Horticulture. I have been fortunate to receive a number of grants and awards that have
supported my travel to international meetings and the presentation of my research,
including funds from the Plant Biological Sciences (PBS) graduate program, the
Microbial and Plant Genomics Institute (MPGI), the Council of Graduate Students
(COGS), the International Plant Growth Substance Association (IPGSA), and the “US-
German Arabidopsis Functional Genomics Exchange Program” from NSF.
Last but not least, I thank my parents, my relatives, and my friends for their
encouragement during my graduate studies. And I thank all the people I met worldwide at
conferences and during my travels that have had a lasting impact on me by sharing their
thoughts and experiences.
iii
Abstract
Auxins, primarily indole-3-acetic acid (IAA), are endogenous plant hormones well
known as key regulators of plant growth and development. Both genetic and biochemical
studies have demonstrated that plants have developed a complex system to regulate the
level of IAA, including biosynthesis of IAA from Trp-dependent and Trp-independent
pathways, polar auxin transport, conjugation and hydrolysis of auxin. To accurately
measure changes in IAA levels and identify pathways that contribute to the changes, I
developed methods for quantitative analyses of auxin levels, auxin biosynthesis, and
polar auxin transport. Using radioisotope labeling and stable-isotope dilution, I found that
in etiolated tomato seedlings, a brief light exposure increased both IAA biosynthesis in
the upper tissue sections and polar IAA transport in hypocotyls in a phytochrome-
dependent manner, leading to unchanged free IAA levels in the top section and increased
free IAA levels in the lower hypocotyl regions. In addition, using stable-isotope labeling
and stable-isotope dilution, I quantified polar auxin transport in Arabidopsis hypocotyls,
and I found that the transport of indole-3-butyric acid (IBA), another endogenous auxin,
was much lower than IAA and that its transport mechanism was distinct from IAA
transport. I also found that a small amount of IBA metabolic products, such as ester-
linked IBA and IAA, was transported, while the majority of transported IAA remained as
free IAA, suggesting that the polar transport of IAA could directly change the level of
IAA while the transport of IBA could be an additional means to regulate IAA. In
summary, my studies provide comprehensive views of auxin regulation in plants under
different physiological conditions, showing that multiple mechanisms cooperatively
regulate local auxin levels.
iv
Table of Contents
List of Figures…………………………………………………………...……………….vi
Chapter 1 Introduction: Regulation of Auxin through Multiple Mechanisms .........1
Figures.....................................................................................................................4
Chapter 2 High-throughput and Quantitative Assays of Auxin and Auxin
Precursors from Minute Tissue Samples ........................................................................7
Introduction.............................................................................................................7
Materials................................................................................................................14
Procedures.............................................................................................................20
Timing...................................................................................................................27
Troubleshooting ....................................................................................................28
Anticipated Results ...............................................................................................30
Supplemental Method 1: Preparation of [13C8,15N1]indole-3-butyric acid............33
Supplemental Method 2: Preparation of [13C11,15N1]indole-3-pyruvic acid .........35
Figures...................................................................................................................38
Chapter 3 Low-Fluence Red Light Increases the Transport and Biosynthesis of
Auxin ................................................................................................................................45
Introduction...........................................................................................................45
Materials and Methods..........................................................................................47
Results...................................................................................................................53
Discussion .............................................................................................................59
Figures...................................................................................................................67
Chapter 4 Transport of Indole-3-Butyric Acid and Indole-3-Acetic Acid in
Arabidopsis thaliana Hypocotyls Using Stable Isotope Labeling ..............................84
Introduction...........................................................................................................84

v
Materials and Methods..........................................................................................87
Results...................................................................................................................91
Discussion .............................................................................................................96
Figures.................................................................................................................105
Addenda .........................................................................................................................113
A. Genetic Dissection of the Role of Ethylene in Regulating Auxin-dependent
Lateral and Adventitious Root Formation in Tomato ...................................114
B. vanishing tassel2 Encodes a Grass-Specific Tryptophan Aminotransferase
Required for Vegetative and Reproductive Development in Maize .............119
C. Arabidopsis Monothiol Glutaredoxin, AtGRXS17, is Critical for Temperature-
dependent Postembryonic Growth and Development via Modulating Auxin
Response .......................................................................................................122
D. Unifoliata-Afila Interactions in Pea Leaf Morphogenesis.............................126
E. The Endoplasmic Reticulum Localized PIN8 Modulates Cell and Plant
Development by Regulating Intracellular Auxin Homeostasis.....................129
F. Role for Apyrases in Polar Auxin Transport in Arabidopsis .........................133
Bibliography ..................................................................................................................137
vi
List of Figures
Figure 1-1. A summary of mechanisms regulating the level of free IAA...........................4
Figure 1-2. Proposed IAA biosynthetic pathways in plants................................................5
Figure 1-3. Potential products of IAA conjugation and oxidation identified in plants.......6
Figure 2-1. A simplified summary of IAA biosynthetic pathways...................................38
Figure 2-2. Experimental procedures for extraction and derivatization of auxin and auxin precursors .....................................................................................................39
Figure 2-3. Setup and utilization of TopTips for SPE extractions....................................40
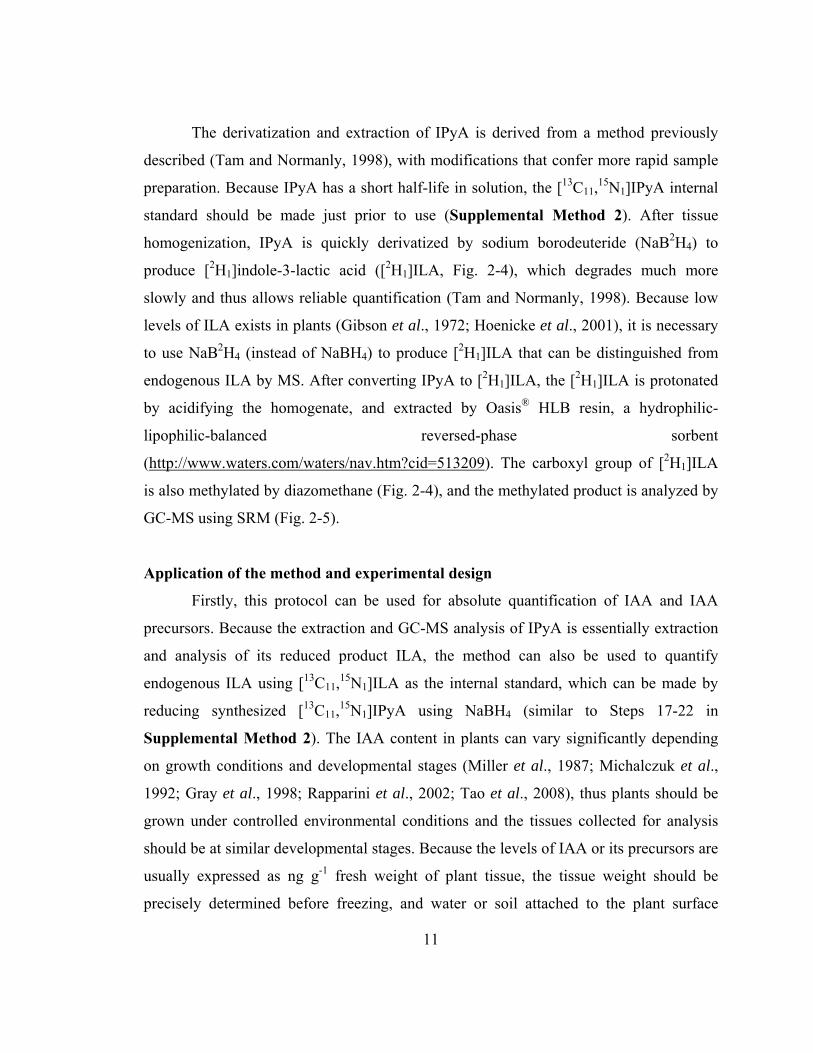
Figure 2-4. Derivatizations of analytes prior to GC-MS analysis.....................................41
Figure 2-5. Ionization and fragmentation of derivatized analytes during MS analyses....42
Figure 2-6. Examples of GC-MS results from typical plant extracts................................44
Figure 3-1. Etiolated Arabidopsis and tomato seedlings had measurable basipetal polar auxin transport (PAT) in excised hypocotyl sections..................................67
Figure 3-2. Light increased PAT in etiolated Arabidopsis and tomato seedlings.............68
Figure 3-3. Increase of PAT in etiolated tomato hypocotyls in response to different blue and red light fluences followed by 1-d darkness..........................................69
Figure 3-4. Red and blue-light induced increase of PAT in etiolated tomato seedlings was mediated by phytochrome............................................................................70
Figure 3-5. Greater than 12-hour darkness after the red light exposure was required for the increase in PAT to occur ........................................................................71
Figure 3-6. PAT velocity was increased by red light exposure ........................................72
Figure 3-7. Light increased the level of free IAA in specific regions of etiolated tomato hypocotyls ....................................................................................................73
Figure 3-8. Light increased biosynthesis of IAA from labeled precursors in the top section of etiolated tomato seedlings ...........................................................74
vii
Figure 3-9. Red-light induced increase in IAA biosynthesis in the top section (meristem, cotyledons, and hook) of tomato seedlings was mediated by phytochrome..75
Figure 3-10. The effect of NPA on IAA biosynthesis from labeled precursors................76
Figure 3-11. A summary of the low fluence red light effect on the transport and biosynthesis of IAA .....................................................................................77
Figure 3-12. Increase in PAT following blue light exposure............................................78
Figure 3-13. Light increased Trp-independent biosynthesis of IAA in the top section of etiolated tomato seedlings............................................................................79
Figure 3-14. Enrichment of [13C] labeled precursors in tissues that synthesize IAA from these precursors............................................................................................80
Figure 3-15. Polar auxin transport was significantly increased in cry1 mutant tomato hypocotyls treated with blue light exposure followed by 1-day darkness ...81
Figure 3-16. Red light exposure followed by 1-day darkness did not alter hypocotyl length............................................................................................................82
Figure 3-17. Spectral photon distributions of the red, far-red, and blue light sources......83
Figure 4-1. Possible metabolic pathways of [3H-5]IBA and [3H-5]IAA ........................105
Figure 4-2. Summary of experimental procedures..........................................................107
Figure 4-3. Polar auxin transport and quantification of free [13C6]IAA, [ 13C1]IBA, and [13C1]IAA derived from [13C1]IBA in wild type Arabidopsis hypocotyls after 5-h transport periods....................................................................................108
Figure 4-4. Polar auxin transport and quantification of free [13C6]IAA, [ 13C1]IBA, and [13C1]IAA derived from [13C1]IBA in wild type and nakr1 mutant Arabidopsis hypocotyls after 5-h transport periods.....................................109
Figure 4-5. Polar auxin transport and quantification of free [13C6]IAA, [ 13C1]IBA, and [13C1]IAA derived from [13C1]IBA in wild type and ibr1 ibr3 ibr10 mutant Arabidopsis hypocotyls after 5-h transport periods.....................................110
Figure 4-6. Quantification of free [13C6]IAA, free [13C1]IBA, and the ester- or amide-linked conjugates they formed in wild type Arabidopsis hypocotyls after 5-h transport periods ..........................................................................................111
viii
Figure 4-7. Transport of free [13C8,15N1]IBA, and [13C8,
15N1]IAA derived from [13C8,
15N1]IBA in maize coleoptiles after 3.5-h transport periods...............112 Figure A--1. In tomato roots, the free IAA content is reduced 2 days after treatment with
1 µM ACC..................................................................................................117
Figure A--2. Effect of ethylene on the free IAA content in tomato hypocotyls .............118
Figure A--3. Measurement of free IAA levels in normal, spi1, vt2 and spi1 vt2 mutants....................................................................................................................121
Figure A--4. Basipetal polar auxin transport but not auxin content was reduced in atgrx 17 KO and RNAi seedlings grown at elevated temperature ......................125
Figure A--5. Polar auxin transport in petioles of expanding leaves for uni-tac compared to its control (WTM) and uni and its control (WT2)......................................128
Figure A--6. Measurement of free and conjugated IAA in different tobacco tissues .....132
Figure A--7. Effects of reduced Arabidopsis apyrase activities on IAA transport and free IAA levels ..................................................................................................136

1
Chapter 1
Introduction:
Regulation of Auxin through Multiple Mechanisms
Phytohormones are chemical messengers that are produced in any one part of a
plant and modulate physiological processes in another part of the plant by interacting
with specific protein receptors (Went and Thimann, 1937; Taiz and Zeiger, 2006). Auxin
was the first phytohormone to be discovered, and the major form of natural auxin is
indole-3-acetic acid (IAA). As suggested by its name—derived from a Greek word
meaning “to grow”—auxin is a key factor that controls the growth of plants and allows
them to react to their environment (Vogel, 2006). Perhaps due to auxin’s critical role in
growth and development, plants have evolved complex systems to regulate the level of
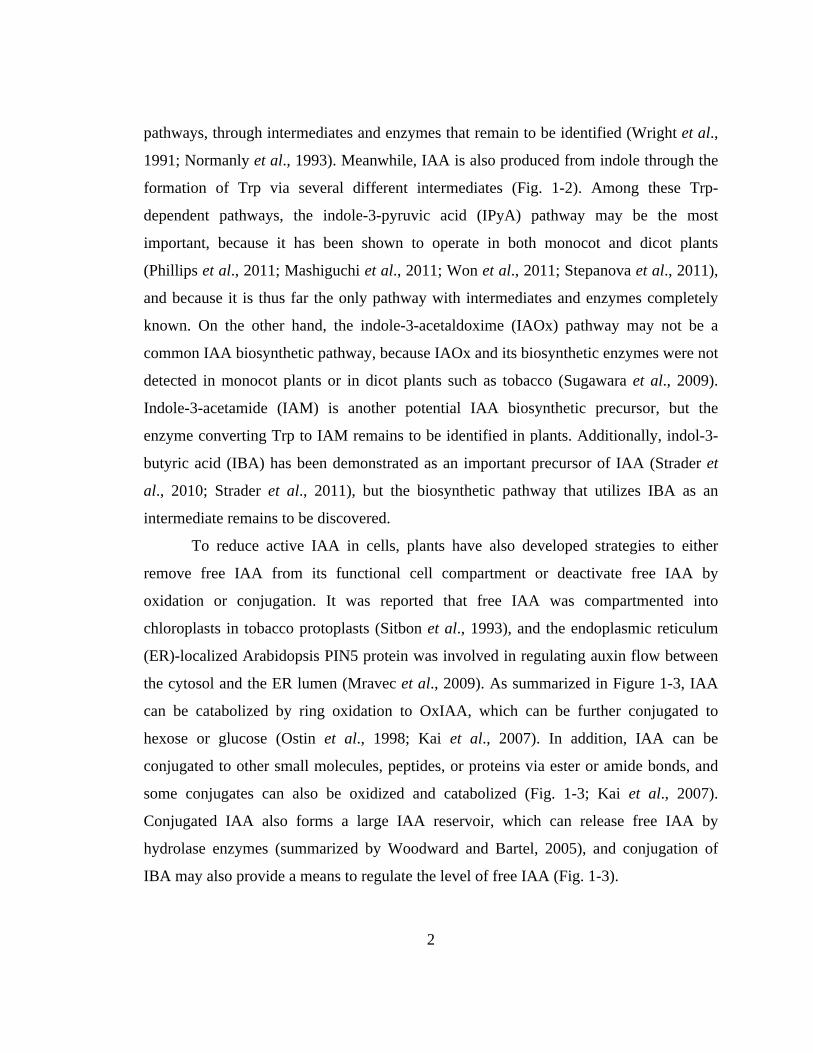
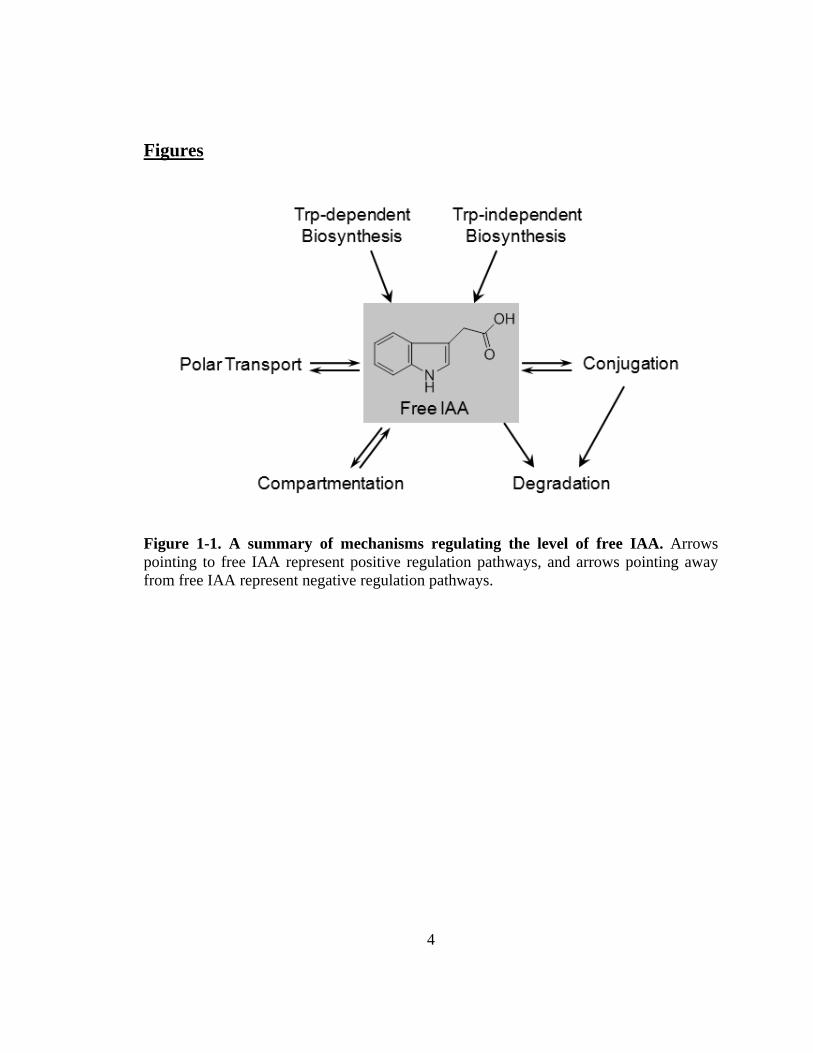
free, active IAA (Fig. 1-1).
IAA can be polarly transported in plants to trigger growth responses at sites
distant from where it is produced or applied, which was the feature leading to the
discovery of auxin (Darwin and Darwin, 1881) and formed the basis for early techniques
of auxin measurement (Went and Thimann, 1937). Auxin transport is controlled by a
series of influx and efflux proteins (Peer et al., 2011) and is considered as a predominant
way to generate and maintain differential distribution of auxin required for many plant
developmental processes (Petrásek and Friml, 2009).
Although some computational models of auxin-regulated development have been
generated exclusively based on auxin transport (Grieneisen et al., 2007; Bayer et al.,
2009), the local biosynthesis of auxin has also been shown to play important roles in
plant development (Zhao, 2010). The knowledge of IAA biosynthesis in plants has been
significantly advanced in the past two decades by both isotope labeling and molecular
genetic studies. IAA can be directly synthesized from indole via Trp-independent
2
pathways, through intermediates and enzymes that remain to be identified (Wright et al.,
1991; Normanly et al., 1993). Meanwhile, IAA is also produced from indole through the
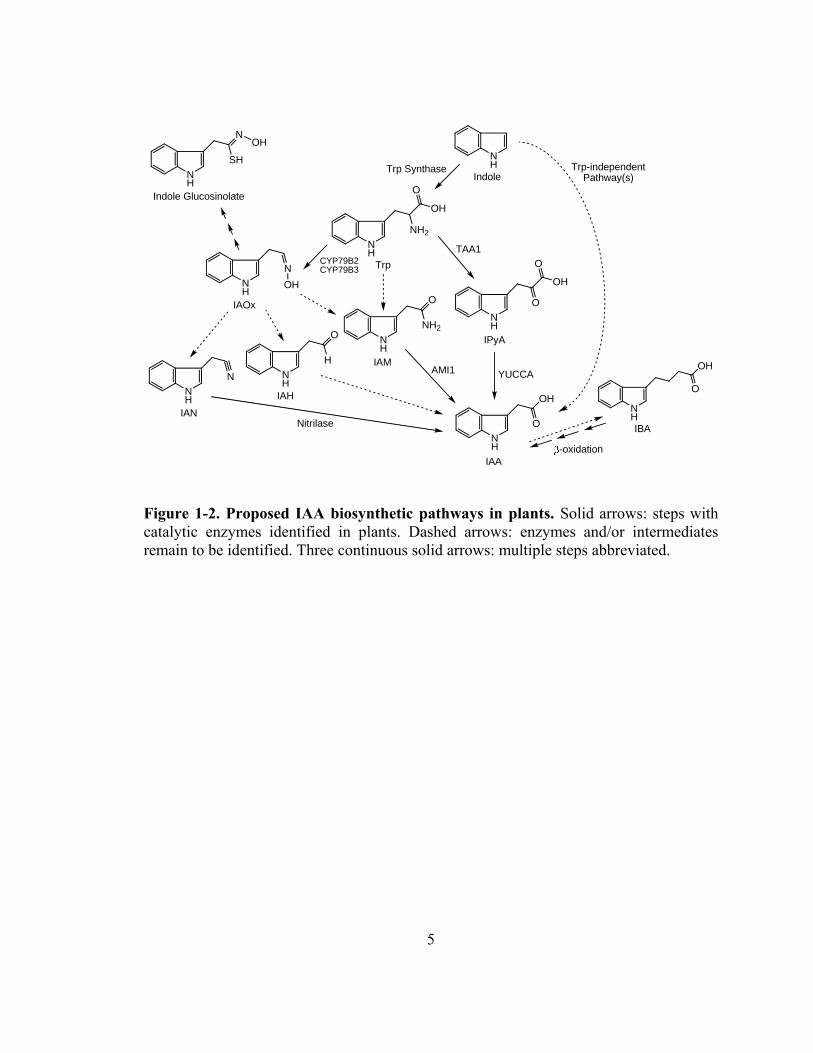
formation of Trp via several different intermediates (Fig. 1-2). Among these Trp-
dependent pathways, the indole-3-pyruvic acid (IPyA) pathway may be the most
important, because it has been shown to operate in both monocot and dicot plants
(Phillips et al., 2011; Mashiguchi et al., 2011; Won et al., 2011; Stepanova et al., 2011),
and because it is thus far the only pathway with intermediates and enzymes completely
known. On the other hand, the indole-3-acetaldoxime (IAOx) pathway may not be a
common IAA biosynthetic pathway, because IAOx and its biosynthetic enzymes were not
detected in monocot plants or in dicot plants such as tobacco (Sugawara et al., 2009).
Indole-3-acetamide (IAM) is another potential IAA biosynthetic precursor, but the
enzyme converting Trp to IAM remains to be identified in plants. Additionally, indol-3-
butyric acid (IBA) has been demonstrated as an important precursor of IAA (Strader et
al., 2010; Strader et al., 2011), but the biosynthetic pathway that utilizes IBA as an
intermediate remains to be discovered.
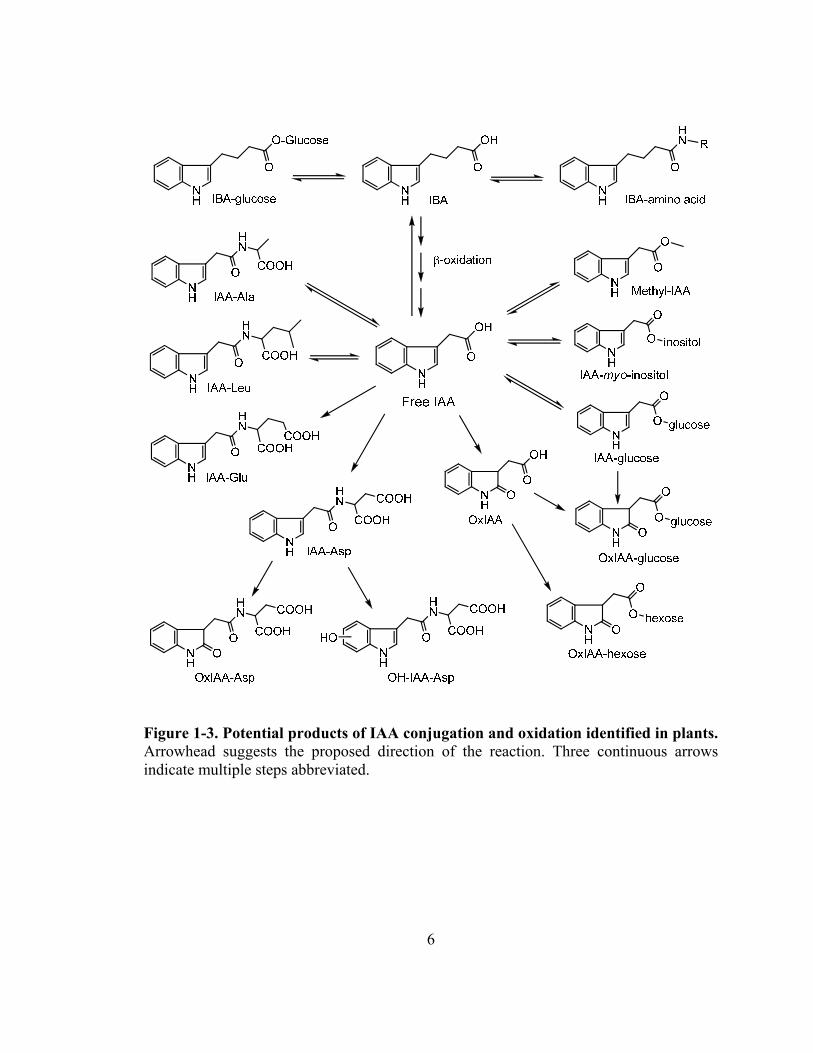
To reduce active IAA in cells, plants have also developed strategies to either
remove free IAA from its functional cell compartment or deactivate free IAA by
oxidation or conjugation. It was reported that free IAA was compartmented into
chloroplasts in tobacco protoplasts (Sitbon et al., 1993), and the endoplasmic reticulum
(ER)-localized Arabidopsis PIN5 protein was involved in regulating auxin flow between
the cytosol and the ER lumen (Mravec et al., 2009). As summarized in Figure 1-3, IAA
can be catabolized by ring oxidation to OxIAA, which can be further conjugated to
hexose or glucose (Ostin et al., 1998; Kai et al., 2007). In addition, IAA can be
conjugated to other small molecules, peptides, or proteins via ester or amide bonds, and
some conjugates can also be oxidized and catabolized (Fig. 1-3; Kai et al., 2007).
Conjugated IAA also forms a large IAA reservoir, which can release free IAA by
hydrolase enzymes (summarized by Woodward and Bartel, 2005), and conjugation of
IBA may also provide a means to regulate the level of free IAA (Fig. 1-3).
3
Although multiple mechanisms are involved in the regulation of free IAA, they do
not work independently. During early seedling development, the hydrolysis of IAA
conjugates serves as an important source for free IAA when there is little or no de novo
biosynthesis (Nowacki and Bandurski, 1980; Bialek and Cohen, 1992; Ljung et al., 2001).
The transport of IAA can be increased by elevated amount of free IAA (Paciorek et al.,
2005), and disruption in either biosynthesis or transport of IAA abolished the shade
avoidance response in Arabidopsis seedlings (Tao et al., 2008; Keuskamp et al., 2010).
Overexpression of IAA biosynthetic genes led to increased levels of not only free IAA,
but also OxIAA and conjugated IAA (Mashiguchi et al., 2011; Stepanova et al., 2011).
When the expression of the ER-localized IAA transport protein PIN5 was induced in
tobacco cells, the level of free IAA was decreased and levels of IAA conjugates were
increased (Mravec et al., 2009). Taken together, these reports suggest that the IAA
regulatory pathways interact with each other, constructing a network that precisely
regulates free IAA levels at targeted locations in plants.
My thesis research studies the roles of these IAA regulatory pathways and how
they interact to regulate physiological processes. Chapter 2 provides protocols for precise,
sensitive and quantitative determination of auxin levels and auxin biosynthesis, which
forms a solid foundation for the work that follows. Chapter 3 describes how etiolated
plants regulate auxin levels in a tissue-specific manner, after their exposure to a small
amount of light. Chapter 4 illustrates that the substrate in the auxin transport stream is
free IAA, but not its precursor IBA or its conjugates. The addenda at the end contain
work I contributed to collaborative projects, which are all aimed at understanding the
regulation of IAA though different pathways under varies environmental and
physiological conditions.
4
Figures
Figure 1-1. A summary of mechanisms regulating the level of free IAA. Arrows pointing to free IAA represent positive regulation pathways, and arrows pointing away from free IAA represent negative regulation pathways.

5
Figure 1-2. Proposed IAA biosynthetic pathways in plants. Solid arrows: steps with catalytic enzymes identified in plants. Dashed arrows: enzymes and/or intermediates remain to be identified. Three continuous solid arrows: multiple steps abbreviated.

6
Figure 1-3. Potential products of IAA conjugation and oxidation identified in plants. Arrowhead suggests the proposed direction of the reaction. Three continuous arrows indicate multiple steps abbreviated.
7
Chapter 2
High-throughput and Quantitative Assays of Auxin and Auxin
Precursors from Minute Tissue Samples
Introduction
Auxin, the first discovered plant hormone, plays critical roles in plant growth,
organ formation, and plant responses to environmental stimuli. As the major form of
natural auxin, indole-3-acetic acid (IAA) has been extensively studied, and mechanisms
of its function and regulation are being revealed. To trigger downstream signaling
responses, IAA functions like molecular glue, which ties its receptor TIR1, an F-box
protein, with Aux/IAA transcriptional repressors, leading to degradation of Aux/IAA and
thus releasing the transcriptional suppression of auxin responsive genes (Tan et al., 2007).
Based on this functional mechanism, auxin responses in cells can be partially controlled
by the cellular concentration of IAA. Because IAA is a mobile signaling molecule that
can be transported among cells to form auxin gradients and auxin maxima that are
essential for plant development (reviewed by Petrásek and Friml, 2009), a method that
allows quick and precise measurement of IAA in specific plant tissues will greatly
facilitate understandings of auxin regulated plant growth and development.
Among the different pathways of IAA regulation (reviewed by Woodward and
Bartel, 2005), the biosynthesis of IAA is a central way to regulate cellular IAA levels and
has been actively studied for the past six decades (reviewed by Zhao, 2010). In general,
two types of pathways exist in plants to synthesize IAA, Trp-dependent and Trp-
independent (Fig. 2-1). The Trp-independent biosynthesis of IAA was implied by a study
showing low incorporation of 15N from [15N-indole]Trp into IAA (Baldi et al., 1991) and
was confirmed by studies showing the production of labeled IAA from its labeled
8
precursors in Trp auxotrophic mutant plants (Wright et al., 1991; Normanly et al., 1993).
Because no genes involved in Trp-independent pathways have been identified, analyzing
the incorporation of labeled atoms into IAA and Trp from their common labeled
precursors has been shown to be a useful tool to study the activity of Trp-independent
IAA biosynthesis (Wright et al., 1991; Normanly et al., 1993; Sztein et al., 2002; Epstein
et al., 2002; Liu et al., 2011, see also Chapter 3). On the other hand, IAA can also be
synthesized from multiple Trp-dependent pathways (Mashiguchi et al., 2011), and
importantly, several recent studies illustrated that in both Arabidopsis (Arabidopsis
thaliana) and maize (Zea mays L.), IAA can be synthesized from Trp via the formation of
indole-3-pyruvic acid (IPyA) (Fig. 2-1; Phillips et al. 2011; Mashiguchi et al., 2011; Won
et al., 2011; Stepanova et al., 2011). Thus, IPyA has been demonstrated as an important
intermediate of Trp-dependent IAA biosynthesis, and quantification of IPyA provides
great potential to reveal mechanisms regulating this IAA biosynthetic pathway.
Indole-3-butyric acid (IBA) is another small molecule that displays auxin activity
and has been identified as an endogenous plant compound (reviewed by Ludwig-Müller,
2000). Recent studies have confirmed that IAA can be produced from IBA via β-
oxidation (Strader et al., 2010), and have shown that the IBA-derived IAA is important
for plant development (Strader et al., 2011). Additionally, the regulation of IBA
metabolism also affects plant development and stress tolerance (Tognetti et al., 2010).
Therefore, analysis of IBA levels and its conversion to IAA also provides insights into
the understanding of IAA regulation.
A method was previously reported for quantitative analyses of IAA and IBA,
using solid phase extraction (SPE) columns and gas chromatography (GC) coupled with
selected ion monitoring (SIM) on a single quadrupole mass spectrometer (MS) (Barkawi
et al., 2008; Barkawi et al., 2010). Here I am describing an improved method that allows
simpler equipment setup for sample preparation and smaller amounts of plant tissues
collected for analysis, using selected reaction monitoring (SRM) on a GC triple-
quadrupole MS (GC-MS/MS). In addition, this protocol describes methods for analyses
of IAA precursors including indole, Trp and IPyA, and methods for rapid synthesis of

9
stable-labeled internal standards. Thus, this protocol can be used to either measure levels
of IAA and its precursors or to analyze IAA biosynthesis in plants.
Development and principles of the protocol
The protocol of high-throughput SPE purification and GC-MS analysis has been
validated as a good approach to quantify auxin levels and auxin biosynthesis (Tam and
Normanly, 1998; Barkawi et al., 2008; Liu et al., 2011, see also Chapter 3). Major
procedures of the protocol are summarized in Fig. 2-2. Briefly, indole, Trp, IAA, and
IBA can be extracted from the same aliquot of plant homogenate and analyzed by GC-
MS/MS separately, except that IAA and IBA are contained in the same sample and are
analyzed in one GC-MS/MS run; using another aliquot of plant homogenate, IPyA can be
extracted, derivatized, and analyzed by GC-MS/MS.
To quantify the level of endogenous compounds using isotope dilution, proper
stable isotope labeled internal standards are required. An ideal internal standard should
contain stable isotopes at non-exchangeable positions on compounds identical to the
analytes, with mass increments of three or more (Cohen et al., 1986). When exchange of
stable isotopes occurs during sample preparation and analysis, the amount of internal
standard would decrease, leading to overestimation of the endogenous compound. When
an internal standard with a small mass increment is used, the interference by natural
abundance would greatly complicate the calculation (for example, [13C1]indole-3-
acetonitrile, Ilic et al., 1996). However, such stable-labeled internal standards are not
always readily available, especially for IPyA which degrades rapidly in solution (Tam
and Normanly, 1998). Therefore, I developed and describe herein protocols to rapidly
synthesize [13C8,15N1]IBA from [13C8,
15N1]indole (Supplemental Method 1) and
[13C11,15N1]IPyA from [13C11,
15N2] Trp (Supplemental Method 2). Considering the high
cost of [13C11,15N2] Trp, [2,4,5,6,7-2H5-indole]Trp can be a good alternative when GC-
MS is used for the analysis (Tam and Normanly, 1998). However, when liquid
chromatography-mass spectrometry (LC-MS) is used, the deuterium atoms on the indole
ring may be lost during the ionization process (Davies et al., 2010), and thus deuterium-
10
labeled indolic compounds should generally not be used as internal standards with LC-
MS. After proper stable-labeled internal standards are available, they should be
introduced into plant samples at the earliest possible step, and as I described in the
protocol, they are added together with the homogenization buffer right before tissue
homogenization.
The SPE purification of IAA and IBA is derived from a protocol previously
published (Barkawi et al., 2010), and the most significant improvement is the use of
TopTips (Fig. 2-3), which can retain SPE resin while letting liquid pass through the 1-2
µl slit at the bottom (http://www.glysci.com/products/TopTip.html). In addition to
commercial TopTips, SPE tips can also be made by inserting small pieces of glass wool
into regular pipette tips (Ribnicky et al., 1998). The first SPE tip used for IAA and IBA
extraction contains amino (NH2) resin, which retains the ionized organic acids at neutral
pH but not Trp, so Trp can be collected in the flow-through and extracted separately (Fig.
2-2). The second SPE tip contains polymethylmethacrylate epoxide (PMME) resin, which
binds protonated IAA and IBA when the pH is around 3.0 and releases them when
methanol is added for elution. Finally, IAA and IBA are methylated by diazomethane in
the presence of methanol (Fig. 2-4), and the methylated IAA and IBA are analyzed by
monitoring the quinolinium ion produced from the molecular ion (SRM; Fig. 2-5) after
GC separation.
The flow-through from the NH2 tip is collected to extract the IAA precursor Trp,
using DOWEX50 resin (Chen et al., 2010). If only amino acids are of interest, they can
be extracted by loading diluted plant homogenate onto DOWEX50 tips, skipping the NH2
tip. DOWEX50 resin retains cations, such as the protonated amino group on Trp at
neutral pH, and releases Trp when the pH is increased by ammonium hydroxide
(NH4OH). Both the amino and carboxyl groups are then derivatized by methyl
chloroformate (MCF) in the presence of methanol and pyridine at basic pH, based on a
mechanism described previously (Chen et al., 2010; Fig. 2-4), and the derivatized Trp is
analyzed by GC-MS using the SIM acquisition mode (Fig. 2-5).
1
Chapter 1
Introduction:
Regulation of Auxin through Multiple Mechanisms
Phytohormones are chemical messengers that are produced in any one part of a
plant and modulate physiological processes in another part of the plant by interacting
with specific protein receptors (Went and Thimann, 1937; Taiz and Zeiger, 2006). Auxin
was the first phytohormone to be discovered, and the major form of natural auxin is
indole-3-acetic acid (IAA). As suggested by its name—derived from a Greek word
meaning “to grow”—auxin is a key factor that controls the growth of plants and allows
them to react to their environment (Vogel, 2006). Perhaps due to auxin’s critical role in
growth and development, plants have evolved complex systems to regulate the level of
free, active IAA (Fig. 1-1).
IAA can be polarly transported in plants to trigger growth responses at sites
distant from where it is produced or applied, which was the feature leading to the
discovery of auxin (Darwin and Darwin, 1881) and formed the basis for early techniques
of auxin measurement (Went and Thimann, 1937). Auxin transport is controlled by a
series of influx and efflux proteins (Peer et al., 2011) and is considered as a predominant
way to generate and maintain differential distribution of auxin required for many plant
developmental processes (Petrásek and Friml, 2009).
Although some computational models of auxin-regulated development have been
generated exclusively based on auxin transport (Grieneisen et al., 2007; Bayer et al.,
2009), the local biosynthesis of auxin has also been shown to play important roles in
plant development (Zhao, 2010). The knowledge of IAA biosynthesis in plants has been
significantly advanced in the past two decades by both isotope labeling and molecular
genetic studies. IAA can be directly synthesized from indole via Trp-independent

2
pathways, through intermediates and enzymes that remain to be identified (Wright et al.,
1991; Normanly et al., 1993). Meanwhile, IAA is also produced from indole through the
formation of Trp via several different intermediates (Fig. 1-2). Among these Trp-
dependent pathways, the indole-3-pyruvic acid (IPyA) pathway may be the most
important, because it has been shown to operate in both monocot and dicot plants
(Phillips et al., 2011; Mashiguchi et al., 2011; Won et al., 2011; Stepanova et al., 2011),
and because it is thus far the only pathway with intermediates and enzymes completely
known. On the other hand, the indole-3-acetaldoxime (IAOx) pathway may not be a
common IAA biosynthetic pathway, because IAOx and its biosynthetic enzymes were not
detected in monocot plants or in dicot plants such as tobacco (Sugawara et al., 2009).
Indole-3-acetamide (IAM) is another potential IAA biosynthetic precursor, but the
enzyme converting Trp to IAM remains to be identified in plants. Additionally, indol-3-
butyric acid (IBA) has been demonstrated as an important precursor of IAA (Strader et
al., 2010; Strader et al., 2011), but the biosynthetic pathway that utilizes IBA as an
intermediate remains to be discovered.
To reduce active IAA in cells, plants have also developed strategies to either
remove free IAA from its functional cell compartment or deactivate free IAA by
oxidation or conjugation. It was reported that free IAA was compartmented into
chloroplasts in tobacco protoplasts (Sitbon et al., 1993), and the endoplasmic reticulum
(ER)-localized Arabidopsis PIN5 protein was involved in regulating auxin flow between
the cytosol and the ER lumen (Mravec et al., 2009). As summarized in Figure 1-3, IAA
can be catabolized by ring oxidation to OxIAA, which can be further conjugated to
hexose or glucose (Ostin et al., 1998; Kai et al., 2007). In addition, IAA can be
conjugated to other small molecules, peptides, or proteins via ester or amide bonds, and
some conjugates can also be oxidized and catabolized (Fig. 1-3; Kai et al., 2007).
Conjugated IAA also forms a large IAA reservoir, which can release free IAA by
hydrolase enzymes (summarized by Woodward and Bartel, 2005), and conjugation of
IBA may also provide a means to regulate the level of free IAA (Fig. 1-3).
3
Although multiple mechanisms are involved in the regulation of free IAA, they do
not work independently. During early seedling development, the hydrolysis of IAA
conjugates serves as an important source for free IAA when there is little or no de novo
biosynthesis (Nowacki and Bandurski, 1980; Bialek and Cohen, 1992; Ljung et al.,
2001). The transport of IAA can be increased by elevated amount of free IAA (Paciorek
et al., 2005), and disruption in either biosynthesis or transport of IAA abolished the shade
avoidance response in Arabidopsis seedlings (Tao et al., 2008; Keuskamp et al., 2010).
Overexpression of IAA biosynthetic genes led to increased levels of not only free IAA,
but also OxIAA and conjugated IAA (Mashiguchi et al., 2011; Stepanova et al., 2011).
When the expression of the ER-localized IAA transport protein PIN5 was induced in
tobacco cells, the level of free IAA was decreased and levels of IAA conjugates were
increased (Mravec et al., 2009). Taken together, these reports suggest that the IAA
regulatory pathways interact with each other, constructing a network that precisely
regulates free IAA levels at targeted locations in plants.
My thesis research studies the roles of these IAA regulatory pathways and how
they interact to regulate physiological processes. Chapter 2 provides protocols for
precise, sensitive and quantitative determination of auxin levels and auxin biosynthesis,
which forms a solid foundation for the work that follows. Chapter 3 describes how
etiolated plants regulate auxin levels in a tissue-specific manner, after their exposure to a
small amount of light. Chapter 4 illustrates that the substrate in the auxin transport stream
is free IAA, but not its precursor IBA or its conjugates. The addenda at the end contain
work I contributed to collaborative projects, which are all aimed at understanding the
regulation of IAA though different pathways under varies environmental and
physiological conditions.

4
Figures
Figure 1-1. A summary of mechanisms regulating the level of free IAA. Arrows pointing to free IAA represent positive regulation pathways, and arrows pointing away from free IAA represent negative regulation pathways.
5
NH
NH
OH
O
OH
O
IBA
NH
NH2
OH
O
Trp
NH
O
OH
O
IPyA
IAA
NH
Indole
-oxidation
Trp-independentPathway(s)
TAA1
YUCCA
NH
N
OH
IAOx
NH
N
IAN
NH
O
NH2
IAMNH
H
O
IAH
NH
SH
N
Indole Glucosinolate
CYP79B2CYP79B3
OH
Nitrilase
AMI1
Trp Synthase
Figure 1-2. Proposed IAA biosynthetic pathways in plants. Solid arrows: steps with catalytic enzymes identified in plants. Dashed arrows: enzymes and/or intermediates remain to be identified. Three continuous solid arrows: multiple steps abbreviated.
6
Figure 1-3. Potential products of IAA conjugation and oxidation identified in plants. Arrowhead suggests the proposed direction of the reaction. Three continuous arrows indicate multiple steps abbreviated.

7
Chapter 2
High-throughput and Quantitative Assays of Auxin and Auxin
Precursors from Minute Tissue Samples
Introduction
Auxin, the first discovered plant hormone, plays critical roles in plant growth,
organ formation, and plant responses to environmental stimuli. As the major form of
natural auxin, indole-3-acetic acid (IAA) has been extensively studied, and mechanisms
of its function and regulation are being revealed. To trigger downstream signaling
responses, IAA functions like molecular glue, which ties its receptor TIR1, an F-box
protein, with Aux/IAA transcriptional repressors, leading to degradation of Aux/IAA and
thus releasing the transcriptional suppression of auxin responsive genes (Tan et al.,
2007). Based on this functional mechanism, auxin responses in cells can be partially
controlled by the cellular concentration of IAA. Because IAA is a mobile signaling
molecule that can be transported among cells to form auxin gradients and auxin maxima
that are essential for plant development (reviewed by Petrásek and Friml, 2009), a
method that allows quick and precise measurement of IAA in specific plant tissues will
greatly facilitate understandings of auxin regulated plant growth and development.
Among the different pathways of IAA regulation (reviewed by Woodward and
Bartel, 2005), the biosynthesis of IAA is a central way to regulate cellular IAA levels and
has been actively studied for the past six decades (reviewed by Zhao, 2010). In general,
two types of pathways exist in plants to synthesize IAA, Trp-dependent and Trp-
independent (Fig. 2-1). The Trp-independent biosynthesis of IAA was implied by a study
showing low incorporation of 15N from [15N-indole]Trp into IAA (Baldi et al., 1991) and
was confirmed by studies showing the production of labeled IAA from its labeled

8
precursors in Trp auxotrophic mutant plants (Wright et al., 1991; Normanly et al., 1993).
Because no genes involved in Trp-independent pathways have been identified, analyzing
the incorporation of labeled atoms into IAA and Trp from their common labeled
precursors has been shown to be a useful tool to study the activity of Trp-independent
IAA biosynthesis (Wright et al., 1991; Normanly et al., 1993; Sztein et al., 2002; Epstein
et al., 2002; Liu et al., 2011, see also Chapter 3). On the other hand, IAA can also be
synthesized from multiple Trp-dependent pathways (Mashiguchi et al., 2011), and
importantly, several recent studies illustrated that in both Arabidopsis (Arabidopsis
thaliana) and maize (Zea mays L.), IAA can be synthesized from Trp via the formation of
indole-3-pyruvic acid (IPyA) (Fig. 2-1; Phillips et al. 2011; Mashiguchi et al., 2011; Won
et al., 2011; Stepanova et al., 2011). Thus, IPyA has been demonstrated as an important
intermediate of Trp-dependent IAA biosynthesis, and quantification of IPyA provides
great potential to reveal mechanisms regulating this IAA biosynthetic pathway.
Indole-3-butyric acid (IBA) is another small molecule that displays auxin activity
and has been identified as an endogenous plant compound (reviewed by Ludwig-Müller,
2000). Recent studies have confirmed that IAA can be produced from IBA via β-
oxidation (Strader et al., 2010), and have shown that the IBA-derived IAA is important
for plant development (Strader et al., 2011). Additionally, the regulation of IBA
metabolism also affects plant development and stress tolerance (Tognetti et al., 2010).
Therefore, analysis of IBA levels and its conversion to IAA also provides insights into
the understanding of IAA regulation.
A method was previously reported for quantitative analyses of IAA and IBA,
using solid phase extraction (SPE) columns and gas chromatography (GC) coupled with
selected ion monitoring (SIM) on a single quadrupole mass spectrometer (MS) (Barkawi
et al., 2008; Barkawi et al., 2010). Here I am describing an improved method that allows
simpler equipment setup for sample preparation and smaller amounts of plant tissues
collected for analysis, using selected reaction monitoring (SRM) on a GC triple-
quadrupole MS (GC-MS/MS). In addition, this protocol describes methods for analyses
of IAA precursors including indole, Trp and IPyA, and methods for rapid synthesis of
9
stable-labeled internal standards. Thus, this protocol can be used to either measure levels
of IAA and its precursors or to analyze IAA biosynthesis in plants.
Development and principles of the protocol
The protocol of high-throughput SPE purification and GC-MS analysis has been
validated as a good approach to quantify auxin levels and auxin biosynthesis (Tam and
Normanly, 1998; Barkawi et al., 2008; Liu et al., 2011, see also Chapter 3). Major
procedures of the protocol are summarized in Fig. 2-2. Briefly, indole, Trp, IAA, and
IBA can be extracted from the same aliquot of plant homogenate and analyzed by GC-
MS/MS separately, except that IAA and IBA are contained in the same sample and are
analyzed in one GC-MS/MS run; using another aliquot of plant homogenate, IPyA can be
extracted, derivatized, and analyzed by GC-MS/MS.
To quantify the level of endogenous compounds using isotope dilution, proper
stable isotope labeled internal standards are required. An ideal internal standard should
contain stable isotopes at non-exchangeable positions on compounds identical to the
analytes, with mass increments of three or more (Cohen et al., 1986). When exchange of
stable isotopes occurs during sample preparation and analysis, the amount of internal
standard would decrease, leading to overestimation of the endogenous compound. When
an internal standard with a small mass increment is used, the interference by natural
abundance would greatly complicate the calculation (for example, [13C1]indole-3-
acetonitrile, Ilic et al., 1996). However, such stable-labeled internal standards are not
always readily available, especially for IPyA which degrades rapidly in solution (Tam
and Normanly, 1998). Therefore, I developed and describe herein protocols to rapidly
synthesize [13C8,15N1]IBA from [13C8,
15N1]indole (Supplemental Method 1) and
[13C11,15N1]IPyA from [13C11,
15N2] Trp (Supplemental Method 2). Considering the high
cost of [13C11,15N2] Trp, [2,4,5,6,7-2H5-indole]Trp can be a good alternative when GC-
MS is used for the analysis (Tam and Normanly, 1998). However, when liquid
chromatography-mass spectrometry (LC-MS) is used, the deuterium atoms on the indole
ring may be lost during the ionization process (Davies et al., 2010), and thus deuterium-
10
labeled indolic compounds should generally not be used as internal standards with LC-
MS. After proper stable-labeled internal standards are available, they should be
introduced into plant samples at the earliest possible step, and as I described in the
protocol, they are added together with the homogenization buffer right before tissue
homogenization.
The SPE purification of IAA and IBA is derived from a protocol previously
published (Barkawi et al., 2010), and the most significant improvement is the use of
TopTips (Fig. 2-3), which can retain SPE resin while letting liquid pass through the 1-2
µl slit at the bottom (http://www.glysci.com/products/TopTip.html). In addition to
commercial TopTips, SPE tips can also be made by inserting small pieces of glass wool
into regular pipette tips (Ribnicky et al., 1998). The first SPE tip used for IAA and IBA
extraction contains amino (NH2) resin, which retains the ionized organic acids at neutral
pH but not Trp, so Trp can be collected in the flow-through and extracted separately (Fig.
2-2). The second SPE tip contains polymethylmethacrylate epoxide (PMME) resin, which
binds protonated IAA and IBA when the pH is around 3.0 and releases them when
methanol is added for elution. Finally, IAA and IBA are methylated by diazomethane in
the presence of methanol (Fig. 2-4), and the methylated IAA and IBA are analyzed by
monitoring the quinolinium ion produced from the molecular ion (SRM; Fig. 2-5) after
GC separation.
The flow-through from the NH2 tip is collected to extract the IAA precursor Trp,
using DOWEX50 resin (Chen et al., 2010). If only amino acids are of interest, they can
be extracted by loading diluted plant homogenate onto DOWEX50 tips, skipping the NH2
tip. DOWEX50 resin retains cations, such as the protonated amino group on Trp at
neutral pH, and releases Trp when the pH is increased by ammonium hydroxide
(NH4OH). Both the amino and carboxyl groups are then derivatized by methyl
chloroformate (MCF) in the presence of methanol and pyridine at basic pH, based on a
mechanism described previously (Chen et al., 2010; Fig. 2-4), and the derivatized Trp is
analyzed by GC-MS using the SIM acquisition mode (Fig. 2-5).
11
The derivatization and extraction of IPyA is derived from a method previously
described (Tam and Normanly, 1998), with modifications that confer more rapid sample
preparation. Because IPyA has a short half-life in solution, the [13C11,15N1]IPyA internal
standard should be made just prior to use (Supplemental Method 2). After tissue
homogenization, IPyA is quickly derivatized by sodium borodeuteride (NaB2H4) to
produce [2H1]indole-3-lactic acid ([2H1]ILA, Fig. 2-4), which degrades much more
slowly and thus allows reliable quantification (Tam and Normanly, 1998). Because low
levels of ILA exists in plants (Gibson et al., 1972; Hoenicke et al., 2001), it is necessary
to use NaB2H4 (instead of NaBH4) to produce [2H1]ILA that can be distinguished from
endogenous ILA by MS. After converting IPyA to [2H1]ILA, the [2H1]ILA is protonated
by acidifying the homogenate, and extracted by Oasis® HLB resin, a hydrophilic-
lipophilic-balanced reversed-phase sorbent
(http://www.waters.com/waters/nav.htm?cid=513209). The carboxyl group of [2H1]ILA
is also methylated by diazomethane (Fig. 2-4), and the methylated product is analyzed by
GC-MS using SRM (Fig. 2-5).
Application of the method and experimental design
Firstly, this protocol can be used for absolute quantification of IAA and IAA
precursors. Because the extraction and GC-MS analysis of IPyA is essentially extraction
and analysis of its reduced product ILA, the method can also be used to quantify
endogenous ILA using [13C11,15N1]ILA as the internal standard, which can be made by
reducing synthesized [13C11,15N1]IPyA using NaBH4 (similar to Steps 17-22 in
Supplemental Method 2). The IAA content in plants can vary significantly depending
on growth conditions and developmental stages (Miller et al., 1987; Michalczuk et al.,
1992; Gray et al., 1998; Rapparini et al., 2002; Tao et al., 2008), thus plants should be
grown under controlled environmental conditions and the tissues collected for analysis
should be at similar developmental stages. Because the levels of IAA or its precursors are
usually expressed as ng g-1 fresh weight of plant tissue, the tissue weight should be
precisely determined before freezing, and water or soil attached to the plant surface
12
should be removed before tissue collection. To minimize the effects of wounding,
samples should be frozen in liquid N2 quickly after weighing, and stored continuously at -
80 ºC until tissue homogenization to avoid changes in IAA content. After
homogenization, internal standards are added and plant metabolic enzymes are denatured
by isopropanol in the homogenization buffer, so the plant homogenate can then be
manipulated or stored at a higher temperature with no alterations to the quantification
results.
Additionally, the protocol can be used to quantify the enrichment of stable-labeled
IAA synthesized from stable-labeled IAA precursors or putative precursors. For this type
of analysis, plants should be incubated with stable-labeled compounds such as
[13C1]indole or [13C8,15N1]IBA for a certain period of time before tissue collection, and
the abundance of both endogenous IAA and putative stable-labeled IAA should be
monitored by GC-MS/MS. Because the enrichment is determined by the abundance of
labeled IAA divided by abundance of endogenous IAA (see “anticipated result”), it is
often not necessary to record the fresh weight of plant tissue or add internal standards
prior to homogenization, unless the yield of labeled IAA is to be quantified. To quantify
the amount of labeled IAA, the internal standard should contain a mass significantly
different from the mass of labeled tracer IAA. For example, to quantify the amount of
[13C8,15N1]IAA synthesized from [13C8,
15N1]IBA, [13C6]IAA was used as the internal
standard (Strader et al., 2010); and to quantify the amount of transported [13C6]IAA in
Arabidopsis hypocotyls, [4,5,6,7-2H4-indole]IAA was added as the internal standard (Liu
et al., 2012, see also Chapter 4 ).
Using this protocol, the activity of IAA biosynthetic pathways can also be
analyzed. By comparing the incorporation of 13C from [13C1]indole into Trp and IAA
pools (Fig. 2-6, D and E), it is possible to identify biotic and abiotic factors that change
the activity of Trp-independent and/or Trp-dependent IAA biosynthesis (Epstein et al.,
2002; Rapparini et al., 2002; Liu et al., 2011, see also Chapter 3). Similarly, by
quantifying the enrichment of labeled IAA and IPyA, the significance of IPyA-dependent
13
IAA biosynthesis under various biological conditions can be analyzed (Cooney and
Nonhebel, 1991).
Advantage of the method
A major advantage of this method is the improved detectability of analytes. The
SRM acquisition mode confers an order of magnitude higher sensitivity compared with
the SIM acquisition mode, so the amount of plant tissue required in this protocol is at
least ten times less than in the previous method (Barkawi et al., 2010). Considering the
accuracy of weighing, a minimal amount of 2 mg tissue is recommended for
quantification of IAA and IBA (Fig. 2-6A). The lower requirement for plant tissue allows
faster tissue collection and tissue-specific analysis, which enables detection of localized
changes in IAA content and IAA biosynthesis (Ljung et al., 2005; Ikeda et al., 2009; Liu
et al., 2011, see also Chapter 3) and thus provides better understanding of IAA-regulated
biological processes. In addition, with the more sensitive assay, plants can be incubated
with IAA precursors for shorter periods of time and still yield sufficient amounts of
labeled IAA for detection while reducing artifacts generated by exogenous compounds
(Ribnicky et al., 1996; Liu et al., 2011, see also Chapter 3). Therefore, this more sensitive
method can also provide more accurate assessments of IAA regulatory mechanisms.
To better quantify the trace amount of plant endogenous compounds in a high-
throughput manner, I modified the inlet port of the GC (see “GC-MS/MS system setup”).
I replaced the standard septum with a Merlin Microseal™ high pressure seal to reduce
injection of the septum material into the GC column and permit less frequent change of
the septum. I used a custom Teflon washer to provide a better seal between the Merlin
seal adaptor and the GC inlet and to avoid interaction between the seal material and
injected analytes. I also replaced the inlet liner with a custom quartz liner to minimize the
effect of residual analytes from earlier injections carried-over to later injections and thus
increased the accuracy of the assay.
Another highlight of the protocol is the use of SPE tips. Compared with SPE
columns which usually require a manifold connected with a vacuum pump for liquid
14
manipulation, SPE tips can be manipulated by a standard microcentrifuge, allowing
simpler instrumental setup, less solvent consumption/waste, and preparation of more
samples at one time. Because the SPE resin can be packed into tips simply by adding the
resin suspension, SPE tips can be easily customized, which significantly reduces the cost
and greatly facilitates development of new methods. Based on my experimental design, I
decided to use 200-µl TopTips, but other tip sizes such as 10-µl or 1000-µl tips can also
be used when different sample sizes are to be applied.
Materials
REAGENTS
Nitrogen gas [ultra high purity (UHP)]
Helium gas (UHP)
Argon gas (UHP)
Hexane (HPLC grade; Fisher, cat. no. H302) ►CAUTION: flammable
Ethyl acetate (HPLC grade; Fisher, cat. no. E195) ►CAUTION: flammable
Acetonitrile (HPLC grade; Fisher, cat. no. A998) ►CAUTION: flammable
Methanol (HPLC grade; Fisher, cat. no. A452) ►CAUTION: flammable
Dichloromethane (Sigma-Aldrich, cat. no. 154792) ►CAUTION: harmful
Pyridine (ACS grade; EMC Chemicals, cat. no. PX2020) ►CAUTION: flammable
Diethyl ether (HPLC grade; Sigma-Aldrich, cat. no. 309966) ►CAUTION:
flammable; forms peroxides
[13C6]IAA (Cambridge Isotope Laboratories, cat. no. CLM-1896)
► CRITICAL: keep container tightly closed and store in a dry place at -20 ºC.
[13C8,15N1]Indole (Cambridge Isotope Laboratories, cat. no. CNLM-4786)
► CRITICAL: keep container tightly closed and store in a dry place at -20 ºC.
[13C11,15N2]L- Trp (Cambridge Isotope Laboratories, cat. no. CNLM-2475)
► CRITICAL: keep container tightly closed and store in a dry place at -20 ºC.
[13C8,15N1]IBA [synthesized from [13C8,
15N]indole as described in Supplemental
Method 1 (Cohen and Schulze, 1981; Barkawi et al. 2008)]
15
[13C11,15N1]IPyA (synthesized from [13C11,
15N2] Trp as described in Supplemental
Method 2)
Sodium sulfate (Na2SO4, anhydrous; Sigma-Aldrich, cat. no. 239313)
Sodium borodeuteride (NaB2H4; Sigma-Aldrich, cat. no. 205591)
Methanol : water (8:1, v:v)
Methanol : 8 M ammonium hydroxide (NH4OH; Fisher, cat. no. A669) (1:1, v:v)
0.3 N Sodium hydroxide (NaOH; Sigma-Aldrich, cat. no. S8045)
0.1 M Sodium bicarbonate, pH 7.0 (NaHCO3; Mallinckrodt, cat. no. 7412)
50 mM NaHCO3
0.2 M Imidazole, pH 7.0 (Sigma-Aldrich, cat. no. 56750) ►CAUTION: corrosive
• NOTE: yellows with storage and yellowed material is not suitable for use. It may be
recrystallized; otherwise should be discarded
50% (v/v) Isopropanol (HPLC grade; Fisher, cat. no. A451)
Homogenization buffer: 65% isopropanol and 35% 0.2 M imidazole (pH 7.0)
0.25% Phosphoric acid (PA) (ACS grade; Fisher, cat. no. A242)
0.1 M Succinic acid, pH 6.0 (SA) (Sigma-Aldrich, cat. no. 224731)
► CRITICAL: store in refrigerator or prepare freshly, because bacteria grow well on
succinic acid solutions.
PA:SA (5:1, v:v), pH 3.0
► CRITICAL: store in refrigerator or prepare freshly, because bacteria grow well on
succinic acid solutions.
25% (w/v) Polymethylmethacrylate epoxide resin (PMME, Macro-Prep; Bio-Rad, cat.
no. 156-0000) suspension in 0.1 M NaHCO3 (pH 7.0)
25% (w/v) NH2 resin (Agilent, cat. no. 12213020) suspension in distilled water
25% (w/v) DOWEX® 50X2-400 ion-exchange resin (Sigma-Aldrich, cat. no. 217476),
H+ form, suspension in distilled water
25% (w/v) Oasis® HLB resin (collected from HLB cartridges; Waters, cat. no.
WAT106202) suspension in methanol
16
Ethereal diazomethane [prepared as previously described (Cohen, 1984; Barkawi and
Cohen, 2010)]
Methyl chloroformate (MCF; Sigma-Aldrich, cat. no. M35304) ►CAUTION:
flammable, highly toxic by inhalation, toxic by ingestion, corrosive.
EQUIPMENT
MICROMAN positive-displacement pipettes (Gilson, cat. no. F148501, F148502,
F148503, F148504, F148505, F148506)
MICROMAN positive-displacement pipette tips (Gilson, cat. no. F148412, F148112,
F148113, F148414, F148114, F148560)
10-200 µl Empty TopTip for solid phase extraction (SPE) and adaptors for
centrifugation (Glygen, cat. no. TT2EMT)
Repeater® plus positive displacement pipette (Eppendorf, cat. no. 022260201)
Eppendorf Combitips plus (1.0 ml, 5.0 ml; Eppendorf, cat. no. 022266209,
022266403)
Tungsten-carbide beads (2.38 mm; Craig Ball Sales, cat. no. CATU.002380.000.0010)
SealRite® microcentrifuge tubes (0.5 ml, 2.0 ml; USA Scientific, cat. no. 1605-0000,
1620-2700)
Teflon Mixer-Mill adapter for 1.5- to 2-ml microcentrifuge tubes (Qiagen, cat. no.
69984)
Vibration Mill (Mixer-Mill; Qiagen, cat. no. MM300)
Microcentrifuge (Eppendorf, cat. no. 5417R)
2-ml Screw capped micro tubes (Sarstedt, cat. no. 72.694)
2-ml Clear glass vials with polytetrafluoroethylene (PTFE)-lined caps (Fisher
Scientific, cat. no. 03-391-7A)
2-ml Amber glass vials with PTFE-lined caps (Fisher Scientific, cat. no. 03-391-8A)
8-ml Clear glass vials with PTFE-lined caps (Fisher Scientific, cat. no. 03-391-7C)
4-ml Amber glass vials with PTFE-lined caps (Fisher Scientific, cat. no. 03-391-8B)
17
Color pHast Strips (Fisher Scientific, cat. no. S60170)
Wide-mouth crimp vials (Chrom Tech, cat. no. CTV-1104)
250 µl Glass inserts with bottom spring (Chrom Tech, cat. no. CTI-9425)
Crimp cap with silicone rubber septum, PTFE coated (Chrom Tech, cat. no. 515011)
Crimper for 11-mm crimp caps (Sigma-Aldrich, cat. no. 33195)
Decapping pliers (Chrom Tech, cat. no. 904371)
Micro-dissecting forceps (Sigma-Aldrich, cat. no. F4017)
Gas chromatograph (GC)-mass spectrometer (MS): Trace GC Ultra with TriPlus
autosampler, TSQ Quantum triple quadrupole MS (Thermo Scientific®)
GC capillary column 1: HP-5ms, 30 m, 0.25 mm diameter, 0.25 µm film thickness
(Agilent Technologies, cat. no. 19091S-433UI)
GC capillary column 2 (for analysis of indole-3-pyruvic acid only): DB-17ms, 30 m,
0.25 mm diameter, 0.25 µm film thickness (Agilent Technologies, cat. no. 122-4732)
EQUIPMENT SETUP
Diazomethane derivatization equipment
The following items are needed:
Glass diazomethane generator with clear-seal joints as described in Cohen (1984)
Teflon tubing (3 mm, Cole-Parmer, cat. no. C-06407-10)
8-ml Clear glass vials with PTFE-lined caps (Fisher Scientific, cat. no. 03-391-7C
Stainless steel evaporator (six-position evaporator, Barvap 6, Zanntek, cat. no. 11-
06000)
Sand bath heated to 55 ºC
The stainless steel evaporator is connected with N2 gas tank by Teflon tubing, and the
probes of the evaporator are positioned above the sand bath so that samples can be heated
while being evaporated by flowing N2 gas. The Teflon tubing can be connected with the
diazomethane generator during the diazomethane generation process (Cohen, 1984;
Barkawi and Cohen, 2010).
18
SPE TopTips
Insert empty TopTips into adaptors that are placed on top of 2-ml screw capped micro
tubes (Fig. 2-3A). Load SPE resin suspension into each tip from the top of the tip. For
NH2 resin, DOWEX® 50X2-400 ion-exchange resin, or Oasis® HLB resin, load 20 µl
suspensions; for PMME resin, load 80 µl suspension. Then, spin the micro tubes together
with the tips at 3,000 g for a few seconds (use “short” button on centrifuge). Repeat with
higher centrifugal force and/or longer time if liquid does not pass though the tips.
GC-MS/MS system setup
The following items are used to set up the GC:
Merlin Microseal™ high pressure kit (Thermo Scientific®, part no. 19050205, or
contact Thermo Scientific® for the current part number)
Merlin Microseal high pressure replacement septum (Merlin, part no. 410)
Customized Teflon washer (made by Metro Industries, Inc. to the exact dimensions of
the vespel/graphite washer supplied by Thermo Scientific®; a number of extras are
available directly from our laboratory)
10 µl Syringe with an 80-mm needle (SGE Analytical Science, cat. no. 002989)
Custom liners: Quartz glass tubes (outside diameter: 8 mm, inside diameter: 4 mm;
part no. 4x8, Technical Glass Products, Inc.) cut to a length of 105 mm, lightly fire-
polished and treated by Sylon CT™ (Sigma-Aldrich, cat. no. 33065-U) to deactivate
the surface.
Silanized quartz wool (Alltech, cat. no. 4233)
The GC was equipped with a split/splitless capillary inlet, and the standard septum was
replaced by an adapter to accept the Merlin Microseal™ high pressure seal. To provide a
better seal of the inlet and avoid adsorption of indolic compounds, the original
vespel/graphite seal from the Thermo Scientific adapter kit was replaced by the custom
Teflon washer, which was placed under the hexagonal adapter. A 10-µl syringe with an
80-mm needle was installed in the injector of the autosampler, and the injector position
was adjusted to match the position and height of the Merlin Microseal™ valve. The
19
original straight inlet liner (Restek, cat. no. 20939) was replaced by a custom quartz liner
with a cluster of quartz wool inserted at the center. The MS was equipped with an
electron impact (EI) source with an electron emission of 70 eV.
GC-MS/MS program
Software XcaliburTM 2.1 (Thermo Scientific®, part. no. XCALI-64155) and TSQ Series
2.0.6 (Thermo Scientific®, part. no. XCALI-64251) were installed to operate the GC-
MS/MS.
TriPlus Autosampler: Sample volume was 1.0 µl; injection depth was standard; pre-
and post-injection dwell time was 0 s; sampling depth mode was custom and sampling
vial depth was 88%; sample type was “non viscous”.
TRACE GC Ultra: in the “Oven” tab, under “Ramps”, the initial oven temperature was
70 ºC and the hold time was 2 minutes; the Ramp 1 rate was 20 ºC/min until
temperature reached 280 ºC, and the hold time was 5 minutes. In the “Right SSL” tab,
the inlet mode was splitless; the inlet temperature was 240 ºC; the split flow was 10
ml/min, and the splitless time was 1 min; the “constant septum purge” was checked. In
the “Right Carrier” tab, the carrier gas was run under “constant flow” mode, and the
flow rate was 1.0 ml/min; the “vacuum compensation” was checked. In the “Aux
Zones” tab, the MS transfer line temperature was set to 280 ºC.
TSQ Quantum (Condition 1): in the “EI/CI” tab, the number of states was 2; the state
at start of run was “off”, and the state duration was 4 min; the emission current was
100 µA. The calibration gas setting was “off” and the CI method was unchecked. In
the “scan editor” tab, the calibration correction method was unchecked; the MS
acquire time was 17.50 min; scan type can be either SRM (selected reaction
monitoring) or SIM (selected ion monitoring), and scan time was 0.025 s; the polarity
was positive and the data type was centroid. When SRM mode was used, the argon
collision gas pressure was 1.5 mTorr, and the collision energy was 10 V. The masses
of ions to be monitored depended on the metabolites analyzed and will be described in
the “procedure” section.
20
TSQ Quantum (Condition 2, for analysis of indole-3-pyruvic acid only): similar to
Condition 1, but the emission current in the “EI/CI” tab was 120 µA, the scan type in
the “scan editor” tab was SRM, and the collision energy was 25 V.
Procedures
Plant sample preparation and homogenization
1. Collect plant material in 0.5-ml microcentrifuge tubes, and quickly freeze the tubes in
liquid N2. If performing absolute quantification of endogenous metabolites, determine the
exact fresh weight (FW) of plant material quickly and accurately before freezing the
tubes. Keep tubes on dry ice or store them at -80 ºC.
CRITICAL STEP: Sufficient plant material is necessary for the yield of satisfactory
GC-MS/MS signals. Usually, 2-10 mg plant tissue is enough for the analysis of
IAA/IBA, indole, and Trp; about 10 mg plant tissue is needed for the analysis of
IPyA alone. Because IAA, IBA, indole, and Trp are extracted from the same aliquot
of plant homogenate while IPyA is extracted from a separate aliquot of plant
homogenate, this protocol assumes that ~20 mg plant tissue is collected as one
sample.
PAUSE POINT: Frozen samples can be stored at -80 ºC or shipped in a dry ice
package.
2. Add 40 µl homogenization buffer and a tungsten carbide bead to each tube. If
performing absolute quantification of endogenous compounds, add known amounts of
internal standards together with homogenization buffer. Samples need to be kept on dry
ice before next step.
CRITICAL STEP: Add 20 µl homogenization buffer for a sample containing no more
than 10 mg plant tissue. For every increment of 10 mg plant tissue, add an additional
20 µl homogenization buffer.
CRITICAL STEP: For absolute quantification, in 40 µl homogenization buffer, 0.4-1
ng of [13C6]IAA, [13C8,15N]IBA, [13C8,
15N1]indole, [13C11,15N]IPyA are added, and
(or) 100 ng of [13C11,15N2]Trp is added.
21
3. Place the sample tubes into a vibration mill (with the Teflon adaptor and de-capped
2.0-ml microcentrifuge tubes placed in the adaptor), and homogenize for 4 min at 20-25
Hz. Repeat this step if tissues are not fully homogenized. If tissues are difficult to
homogenize, add more tungsten carbide beads and increase the vibration frequency.
Extraction and derivatization of IPyA
4. Transfer 20 µl plant homogenate into a new tube. Leave the rest of plant homogenate
on ice (see Step 24).
5. Add 8 µl 20 mg/ml NaB2H4 into each tube, and mix well.
► CRITICAL: The 20 mg/ml NaB2H4 needs to be freshly prepared in 0.3 N NaOH,
because NaB2H4 decomposes over time in aqueous solutions (Andrieux et al., 2011).
Perform this step soon after homogenization to avoid significant degradation of IPyA.
6. Incubate samples at 35ºC for 1 h.
PAUSE POINT: IPyA is reduced to [2H1]indole-3-lactic acid ([2H1]ILA), which is
much more stable than IPyA, so samples can be stored at -20 ºC for a few days.
7. Add 5 µl 25% PA to acidify the sample and consume the residual NaB2H4.
8. Dilute the sample 10 fold by adding 200 µl distilled water and mixing well.
9. Check the pH of the diluted sample using a pH strip. The pH should be 2.5-3.0.
10. Wash the TopTips containing Oasis® HLB resin two times with 80 µl methanol and
two times with 80 µl PA:SA (pH 3.0). Use repeater pipette to dispense the liquid into
multiple TopTips. Liquid is forced to pass through TopTips by centrifugation at 3,000-
6,000 g for a few seconds (Fig. 2-3B).
► CRITICAL: The 2-ml screw capped micro tubes can hold up to 500 µl liquid before
the liquid reaches the bottom of the TopTips. Therefore, discard the liquid waste when
~400 µl liquid is passed through TopTips. If 2-ml microcentrifuge tubes are used instead
of screw capped tubes, less liquid can be held and the liquid waste needs to be discarded
more frequently.
11. Spin the diluted samples at 12,000 g for 10 min.
12. Load the supernatant of each sample into individual TopTip.

22
13. Spin TopTips at 2,000 g to allow samples to pass through slowly and completely.
14. Wash the TopTips two times with 60 µl PA:SA (pH 3.0).
15. Wash the TopTips with 10 µl methanol. Spin the TopTips at 10,000 g for 1-2 min.
CRITICAL STEP: The methanol wash and long period of centrifugation are designed
to remove the water residue in the resin. If a significant amount of water is retained in
the resin, the efficiency of methylation (by ethereal diazomethane) will be reduced,
and the drying process will be elongated.
16. Transfer the TopTips to new 2-ml tubes to collect the eluate.
17. Elute TopTips three times with 70 µl methanol.
18. Discard the TopTips.
19. Transfer the methanol eluate into a 2-ml clear glass vial.
PAUSE POINT: Samples can be stored in capped vials at -20 ºC for a few days.
20. Fill each glass vial with ethereal diazomethane, and incubate for ~5 minutes.
21. Evaporate the solvents to complete dryness using a gentle N2 gas stream in a sand
bath heated to 55 ºC.
► Caution: Diazomethane is a toxic and explosive gaseous compound, and it is
potentially explosive on contact with sharp edges such as scratched or broken glass. It
should be prepared and used only in a fume hood and handled by hands protected with
gloves. Read precautions in Cohen (1984) and Barkawi et al. (2010) before use.
22. Use 15 µl of ethyl acetate to re-suspend the sample, and transfer the ethyl acetate
solution into a glass insert.
23. Place the glass insert into a crimp vial, and cap the vial.
PAUSE POINT: Methylated samples can be stored at -20 ºC for a few days before
GC-MS/MS analysis.
Extraction of Indole, IAA, and IBA
24. Leave the rest of plant homogenate on ice for at least 1 h for isotopic equilibration.
NOTE: This step follows Step 4.
PAUSE POINT: Homogenized samples can be stored at -20 ºC overnight.

23
25. Spin samples shortly to pellet plant homogenate debris to the bottom of the tubes.
26. Dilute the sample 10 fold by adding 180 µl distilled water and mix thoroughly.
27. Add 80 µl hexane and mix thoroughly.
28. Spin samples shortly to allow the organic and aqueous phases to separate clearly.
29. Transfer ~60 µl of the organic layer (upper layer) to a glass insert. Place the glass
insert into a crimp vial, and cap the vial. This sample contains indole and can be analyzed
by GC-MS/MS without derivatization.
NOTE: Step 27-29 are designed to extract indole. These steps can be skipped if
indole is not a targeted analyte. The samples of indole can be stored in sealed vials at
4 ºC in the dark for one week, but because indole is volatile do not let the sample dry.
30. Wash the TopTips containing NH2 resin sequentially with 60 µl of hexane,
acetonitrile, ethyl acetate, 0.2 M imidazole, followed by three times with 100 µl of
distilled water.
31. Transfer the TopTips to new 2-ml tubes to collect the flow-through from NH2
TopTips.
32. Spin the diluted samples at 12,000 g for 10 min.
33. Load the supernatant of each sample into individual TopTip.
34. Spin TopTips at 2,000 g to allow samples to pass through slowly and completely.
35. Transfer the TopTips to new 2-ml tubes. Cap the tubes containing the flow-through
from the NH2 tips and store in a refrigerator. The flow-through contains Trp.
NOTE: the flow-through is collected to extract Trp (See Step 53). It can be discarded
if only IAA and IBA are of interest. The flow-through can be stored at 4 ºC for one
month.
36. Wash the TopTips with 60 µl each of hexane and methanol.
37. Transfer the TopTips to new 2-ml tubes, each of which contains 25 µl of SA.
38. Elute IAA and IBA from the TopTips using 50 µl, 100 µl, and 50 µl PA, separately.
39. Discard the NH2 TopTips, and collect 2-ml tubes containing the acidic eluate.
40. Prewash the TopTips containing PMME resin two times with 100 µl methanol,
followed by two times with 100 µl PA:SA.
24
41. Load the acidic eluate into the PMME TopTips.
42. Spin TopTips at 2,000 g to allow liquid to pass through slowly and completely.
43. Wash the TopTips three times with 60 µl PA:SA.
44. Wash the TopTips with 10 µl methanol. Spin the TopTips at 10,000 g for 1-2 min.
CRITICAL STEP: Remove the water residue in the PMME resin to gain good
methylation efficiency (similar to Step 15).
45. Remove the plastic spring from the bottom of the 250-µl glass inserts, and put the
glass inserts into 2-ml screw capped micro tubes (Fig. 2-3C).
46. Transfer the PMME TopTips to the micro tubes containing glass inserts. Make sure
that the TopTips insert into the glass inserts (Fig. 2-3C).
47. Elute IAA and IBA two times with 50 µl methanol. The eluate contains both IAA and
IBA and is collected in the glass inserts in the micro tubes.
48. Discard the PMME TopTips.
49. Use the micro-dissecting forceps to take the glass inserts out of the micro tubes. Re-
install the plastic spring at the bottom of the glass inserts, and put the glass inserts into
crimp vials (Fig. 2-3D).
PAUSE POINT: Vials can be capped and stored at -20 ºC overnight.
Derivatization of IAA and IBA
50. Add ethereal diazomethane into each glass insert until the insert is full, and incubate
for ~5 minutes (Fig. 2-3D).
51. Evaporate the solvents until complete dryness using a gentle N2 gas stream in a sand
bath heated to 55 ºC in a solvent hood.
► Caution: Diazomethane is toxic and potentially explosive (see Step 21).
52. Add 15 µl of ethyl acetate into each glass insert to re-suspend the methylated IAA
and IBA. Cap the vials.
PAUSE POINT: Methylated samples can be stored at -20 ºC for a few months or at -
80 ºC for up to one year.
25
Extraction and derivatization of Trp
53. Wash the TopTips containing DOWEX® 50X2-400 resins two times with 100 µl
methanol and two times with 100 µl distilled water.
54. Load the TopTips with the flow-through from NH2 TopTips collected in Step 35.
55. Spin TopTips at 2,000 g to allow liquid to pass through slowly and completely.
56. Wash the TopTips with methanol : water (8:1, v:v).
57. Transfer the TopTips onto new 2-ml tubes.
58. Elute Trp two times with 100 µl methanol : 8 M NH4OH (1:1, v:v).
PAUSE POINT: Trp eluate can be stored at 4 ºC for a few days.
59. Transfer 100 µl of the eluate containing Trp into a 2-ml clear glass vial.
60. In a fume hood, add 20 µl pyridine to each glass vial, and gently shake the vial to
make sure the solvents mix.
61. Continuing in the fume hood, add 20 µl MCF into each vial. Wait for a minute to
allow the reaction to complete.
62. Sequentially add 300 µl each of 50 mM NaHCO3 and then dichloromethane into the
vial. Cap the vial and mix thoroughly. Keep the vials still until two layers form clearly.
63. In a new 2-ml clear glass vial, add 10-20 mg anhydrous Na2SO4 (add enough to cover
the bottom of the vial).
64. Transfer the dichloromethane layer (bottom layer) into the glass vial containing
Na2SO4. Cap the vial. The dichloromethane contains derivatized Trp.
65. Wait for 30-60 min to allow Na2SO4 to absorb water from the dichloromethane
solution.
PAUSE POINT: Derivatized Trp is less stable than Trp, and it can be stored at -20 ºC
for a few days. The actual time length for storage depends on the abundance of the
compound in each sample. It is recommended to analyze the samples soon after
derivatization.
66. Transfer 50 µl of the dichloromethane sample solution into a glass insert. Place the
glass insert into a crimp vial, and cap the vial.

26
GC-SRM-MS/MS analysis of derivatized IPyA
67. SRM is used as the acquisition mode, and the quinolinium ions produced from the
molecular ions (Fig. 2-5A) are monitored. For unlabeled methyl-[2H1]ILA, the parent
mass is 220 and the product mass is 130; for the methyl-[13C11,15N, 2H1]ILA internal
standard, the parent mass is 232 and the product mass is 140.
► CRITICAL: Because only the product (quinolinium) ions are monitored in the
SRM mode, it is important to know what atoms are included in the quinolinium ions
(Fig. 2-5A) when stable-labeled IPyA is analyzed. Some stable-labeled atoms are
missing from the quinolinium ions after fragmentation.
GC-SIM-MS/MS analysis of Indole
68. SIM is used as the acquisition mode and the molecular ions are monitored. The MS
mode under “Scan Modes” is set to “Q1MS”. For the unlabeled indole, ion m/z 117 is
monitored; for the [13C8,15N]indole, ion m/z 126 is monitored; for other types of labeled
indole, the m/z of the monitored ion equals the nominal molecular mass.
GC-SRM-MS/MS analysis of derivatized IAA and IBA
69. SRM is used as the acquisition mode and the quinolinium ions produced from the
molecular ions (Fig. 2-5, B and C) are monitored. Under the “Run Settings” in the “Scan
Editor” tab (of TSQ Quantum), the “Segments” are set to 2; “Segment Time” is 10.5 min
for Segment 1 and 7.0 min for Segment 2. In Segment 1, methyl-IAA is monitored. For
unlabeled methyl-IAA, the parent mass is 189 and the product mass is 130; for the
methyl-[13C6]IAA internal standard, the parent mass is 195 and the product mass is 136.
In Segment 2, methyl-IBA is monitored. For unlabeled methyl-IBA, the parent mass is
217 and the product mass is 130; for the methyl-[13C8,15N]IBA internal standard, the
parent mass is 226 and the product mass is 139.
CRITICAL STEP: methyl-IAA and methyl-IBA are analyzed in one GC-MS/MS run,
and the GC retention time of Me-IBA is about 1 min longer than Me-IAA under the
conditions described in the “Materials” section. Under these conditions, the retention
27
time is about 10 min for Me-IAA and about 11 min for Me-IBA, so the division of the
two segments in the run is set at 10.5 min. However, if different conditions are used
(e.g., different GC column type or length, different oven temperatures), this setting
needs to be adjusted based on the actual retention time of Me-IAA and Me-IBA.
► CRITICAL: Because only the product (quinolinium) ions are monitored in the
SRM mode, it is important to know what atoms are included in the quinolinium ions
(Fig. 2-5. B and C) when stable-labeled IAA and IBA are analyzed. Some stable-
labeled atoms are missing from the quinolinium ions after the fragmentation.
GC-SIM-MS/MS analysis of derivatized Trp
70. SIM is used as the acquisition mode, and both the molecular ions and the quinolinium
product ions are monitored. For unlabeled Trp, the molecular ion m/z 276 and
quinolinium ion m/z 130 (Fig. 2-5D) are monitored; for the [13C11,15N2]Trp, the
molecular ion m/z 289 and quinolinium ion m/z 140 are monitored. The quinolinium ions
are much more abundant than the molecular ions, so the abundance of the quinolinium
ions is used for quantification.
Timing
Step 1: Variable
Step 2: 15 min per 16 samples
Step 3: 5-10 min
Step 4-5: 10 min per 16 samples
Step 7-19: 30 min per 16 samples
Step 20-23: 30 min per 16 samples
Step 25-29: 30 min per 16 samples
Step 30-49: 50 min per 16 samples
Step 50-52: 30 min per 16 samples
Step 53-58: 20 min per 16 samples
28
Step 59-64: 30 min per 16 samples
Step 66: 10 min per 16 samples
Step 67-70: 17.5 min per sample
Troubleshooting
Problems Possible Reasons Possible Solutions
Liquid does not pass
through TopTips
before loading plant
samples
The slit on TopTips is
too narrow
Increase the centrifugal force to make
liquid pass through. Or, switch to a
new TopTip.
Liquid does not pass
through TopTips
after loading plant
samples
Plant debris blocks the
TopTip
Always try to avoid transferring plant
debris into TopTips. Increase the
centrifugal force to make liquid pass
through. Use a dissecting probe to
remove visible plant debris.
Drift of GC retention
time
Deuterium labeled
compounds are
analyzed
It is normal for deuterium labeled
compounds to have slightly shorter
retention times.
Carrier gas leaks
significantly
Use a leak detector to find out where
the leak is. Often, a worn Merlin
Microseal septum is the source of the
leak.
Change of carrier gas If the drift of GC retention time occurs
after the change of carrier gas
cylinders, check if correct gas
cylinders are used.
29
Low yield of both
endogenous
IAA/IBA and
IAA/IBA internal
standards
Water in the methanol
eluate reduces the
methylation efficiency
If it takes a long time to evaporate the
solvents to dryness, the samples are
likely to contain residual water. Re-
methylate samples by adding ethereal
diazomethane and 10% methanol, and
run samples again after drying and re-
suspension.
Wrong NH2 resin Make sure that correct NH2 resin is
used to extract IAA/IBA. Some brands
of NH2 resin do not bind IAA/IBA
sufficiently.
The pH of solutions
loaded onto PMME
TopTips is too high
The pH has to be between 3 and 3.5.
Cut a pH strip into narrower strips,
and dip a strip in the solution to check
the pH. Make sure that correct
concentration of PA is made (pH ≤
1.8), and avoid adding too much SA
which increases the pH.
Low yield of
endogenous
IAA/IBA, but
normal yield of
IAA/IBA internal
standard
Insufficient tissue
homogenization and/or
equilibration
Make sure that plant tissues are well
homogenized. Allow longer time
period for equilibration, e.g., overnight
in the dark at 4 ºC.
Low endogenous
IAA/IBA content in
plant tissues
Collect more plant material for
extraction. Usually, more plant
material is required for IBA analysis
as compared with IAA analyses.
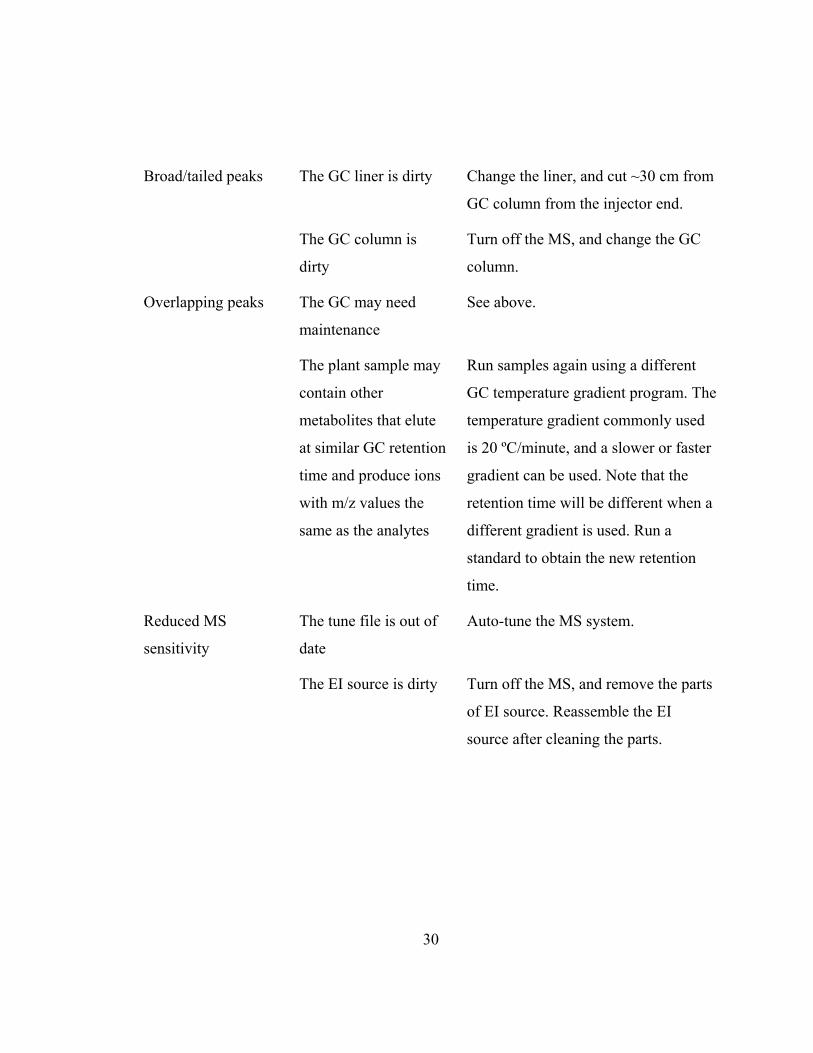
30
Broad/tailed peaks The GC liner is dirty Change the liner, and cut ~30 cm from
GC column from the injector end.
The GC column is
dirty
Turn off the MS, and change the GC
column.
Overlapping peaks The GC may need
maintenance
See above.
The plant sample may
contain other
metabolites that elute
at similar GC retention
time and produce ions
with m/z values the
same as the analytes
Run samples again using a different
GC temperature gradient program. The
temperature gradient commonly used
is 20 ºC/minute, and a slower or faster
gradient can be used. Note that the
retention time will be different when a
different gradient is used. Run a
standard to obtain the new retention
time.
Reduced MS
sensitivity
The tune file is out of
date
Auto-tune the MS system.
The EI source is dirty Turn off the MS, and remove the parts
of EI source. Reassemble the EI
source after cleaning the parts.
31
Anticipated Results
A group of results generated from extractions of IAA and IAA precursors is
shown in Figure 6. The results were displayed by Qual Browser in XcaliburTM 2.1
software, and the chromatogram of each ion (SIM) or reaction product ion (SRM)
selected to be monitored is shown in each panel. Peaks were detected automatically by
the software, and peak areas were also determined by the software. When necessary,
peaks can also be determined manually by defining the start and end points of the peak.
All the chromatograms should be evaluated before calculations are applied. Each
peak should be completely separated from its surrounding peaks, if any, and should be
well resolved from the background, with a signal-to-noise ratio of greater than three. In
general, it is more likely to have a second peak overlapping with the peak of analyte
when the SIM acquisition mode is used, but this may also occur in the SRM acquisition
mode. If peak overlapping forms a problem, samples can be analyzed again by GC-
MS/MS using a different GC temperature gradient program (see Troubleshooting).
For absolute quantification, the amount of plant endogenous compounds can be
calculated from peak areas of the endogenous compound and the labeled internal
standard. For example, in Figure 6A, IAA and IBA from 2 mg Arabidopsis root tissue
were extracted together with 0.2 ng each of [13C6]IAA and [13C8,15N1]IBA. Using the
isotope dilution equation that was fully discussed previously (Barkawi et al., 2010), the
masses of endogenous IAA and IBA can be calculated (R-value: 1.13 for IAA; 1.33 for
IBA), which are then divided by the fresh weight (FW) of the plant sample in order to
calculate concentrations of IAA and IBA. Therefore, the sample shown in Figure 6A
contains 4.25 ng g-1 FW of IAA and 1.18 ng g-1 FW of IBA. Similarly, in Figure 6B,
IPyA from 9.5 mg Arabidopsis seedlings was extracted with 0.5 ng [13C11,15N1]IPyA.
Because the amount of [13C11,15N1]IPyA was determined based on unlabeled IPyA using
reverse isotope dilution (Supplemental Method 2), the R-value is not necessary for the
calculation, and the sample shown in Figure 6B contains 15.02 ng g-1 FW of IPyA.
To study the activity of auxin biosynthesis, isotopic enrichment of stable-labeled
auxin and auxin precursors can be analyzed. Figure 6C, 6D, and 6E show the enrichment
32
of 13C in tomato seedlings after incubation with 0.1 mM [13C1]indole for four hours.
Figure 6C shows that [13C1]indole is greatly enriched in the plant indole pool, suggesting
that [13C1]indole was taken up into plants effectively. Figure 6D shows the enrichment of
[13C1]Trp in the plant Trp pool (3,355,515 divided by 8,196,046), and, after subtraction of
the natural abundance of [13C1]Trp (10%, a constant determined from unlabeled Trp), the
enrichment of [13C1]Trp synthesized from [13C1]indole was determined to be 30.9%.
Similarly, Figure 6E shows the enrichment of [13C1]IAA in the plant IAA pool (23,394
divided by 48,276), and, after subtraction of the natural abundance of [13C1]IAA (10%, a
constant determined from unlabeled IAA), the enrichment of [13C1]IAA synthesized from
[13C1]indole was determined to be 38.5%. Because the enrichment of [13C1]IAA
synthesized from [13C1]indole exceeded the enrichment of [13C1]Trp synthesized from
[13C1]indole, it can be concluded that a portion of [13C1]IAA was synthesized in the
tomato plants via the Trp-independent biosynthetic pathway.
33
Supplemental Method 1: Preparation of [13C8,15N1]indole-3-butyric acid
Materials:
[13C8,15N1]Indole
Solid NaOH
Ethyl acetate
50% Isopropanol
γ-Butyrolactone (Sigma-Aldrich, cat. no. B103608) ►CAUTION: harmful
Chloroform (HPLC grade; Sigma-Aldrich, cat. no. 650498) ►CAUTION: toxic
6 N Hydrogen chloride (HCl; Fisher Scientific, cat. no. A144-212) ►CAUTION: open
in fume hood; protect eyes, hands and clothing
Equipment:
Teflon cup with cover, 23 ml (Parr Instruments, cat. no. A280-AC)
Screw-top reaction bomb (Parr Instruments, cat. no. 276AC-T304-012304)
Aluminum housed heating mantle (Glas-Col®, cat. no. 102B 5101977001)
PowrTrol temperature control (Glas-Col®, cat. no. 104A PL912)
Separatory funnels (250 ml, 500 ml; Fisher Scientific, cat. no. 10-436-1B, 10-436-1C)
Rotary evaporator (Buchi, Rotavapor®, R-110)
UV-visible spectrophotometer (Agilent 8453, cat. no. G1812AA)
Quartz cuvette (LabShopOnline.com, cat. no. TCQ24)
Protocol:
1. In a Teflon cup, add 0.05 g of [13C8,15N1]indole, 3.2 g of NaOH, and 6.09 ml of γ-
butyrolactone. It is common that the solid does not dissolve in the liquid.
2. Cover the Teflon insert and fit it into the screw-top reaction bomb. Close reaction
bomb securely.
3. Heat the reaction bomb to 220 ºC at a rate of 2 ºC/minute in the heating mantle with
the temperature control, and incubate at 220 ºC for a total time of 24 hours.
4. Turn off the temperature control and let the system cool to room temperature.
5. Dissolve the reaction mixture in the Teflon insert completely in ~50 ml distilled water.
34
6. Transfer the 50 ml reaction mixture solution into a 500-ml separatory funnel.
7. Add 120 ml chloroform in a separatory funnel to partition unreacted [13C8,15N1]indole.
8. Remove the chloroform phase (bottom phase).
9. Repeat Step 7-8 twice.
10. Transfer the aqueous layer to a beaker and adjust the pH to 2.5 by adding 6 N HCl.
11. Transfer the acidified solution into a 250-ml separatory funnel.
12. Add 50 ml ethyl acetate to partition the synthesis product.
13. Remove the aqueous layer (bottom layer) and collect the ethyl acetate layer.
14. Repeat Step 11-13 three times and combine the ethyl acetate extracts.
15. Evaporate the ethyl acetate using a rotary evaporator.
16. Re-dissolve the product in a minimal amout of 50% isopropanol. This concentrated
[13C8,15N1]IBA solution can be stored at -20 ºC for a few years.
17. Verify the product by GC-MS/MS after diazomethane methylation (see the procedure
in the main text). The product can be further purified by reverse phase liquid
chromatography. Similar to IAA (Barkawi et al., 2010), the concentration of IBA can be
determined by spectrophotometry, with λmax at 282 nm and an absorption coefficient of
6,060 M-1 cm-1.
35
Supplemental Method 2: Preparation of [13C11,15N1]indole-3-pyruvic acid
► CRITICAL: For absolute quantification of IPyA in biological samples, a known
amount of [13C11,15N]IPyA is added into each sample as the internal standard, and
[13C11,15N]IPyA has to be synthesized just prior to or no more than 2 days before use.
Materials:
50 mM Phosphate buffer (pH 8.0), made from sodium phosphate monobasic
(NaH2PO4, Sigma-Aldrich, cat. no. S8282) and sodium phosphate dibasic (Na2HPO4;
Sigma-Aldrich, cat. no. S7907)
0.2 mg/ml Transaminase (Sigma-Aldrich, cat. no. T7684) in 50 mM phosphate buffer
► CRITICAL: store as 100 µl aliquots at -20 ºC. Use one aliquot for each reaction.
[13C11,15N2]L-Trp (Cambridge Isotope Laboratories, cat. no. CNLM-2475)
α-Ketoglutarate (Sigma-Aldrich, cat. no. K-1750)
5 mM Pyridoxal 5′-phosphate (PLP; Sigma-Aldrich, cat. no. 82870)
10 mM Ascorbic acid (Sigma-Aldrich, cat. no. A4544)
25% Phosphoric acid (PA) (ACS grade; Fisher, cat. no. A242)
Indole-3-pyruvic acid (Sigma-Aldrich, cat. no. I7017)
► CRITICAL: the compound is sensitive to oxygen. Keep container tightly closed and
store in a dry place at -20 ºC.
Ethyl acetate
50% Isopropanol
Synthesis of [13C11,15N]IPyA using an enzyme-catalyzed transamination reaction
1. Let one aliquot of transaminase solution thaw on ice.
2. In 1 ml of 50 mM phosphate buffer (pH 8.0), add 1 mg [13C11,15N2]Trp and 1 mg α-
ketoglutarate.
3. Add 20 µl 5 mM PLP and one aliquot of transaminase solution.
4. Mix the solution gently by inverting the tube several times.
5. Incubate the reaction mixture at 37 ºC in the dark for 3 h.
36
6. Add 1 ml 10 mM ascorbic acid and 50 µl 25% PA to bring the pH to 2.5.
7. Add 600 µl ethyl acetate to partition the synthesized [13C11,15N]IPyA.
8. Collect ethyl acetate (upper layer) into a 2-ml amber glass vial.
9. Add another 600 µl ethyl acetate to partition, and collect the ethyl acetate into the same
amber glass vial.
10. Evaporate ethyl acetate to complete dryness using a gentle N2 gas stream in a sand
bath heated to 55 ºC.
11. Re-suspend [13C11,15N]IPyA in 1 ml 50% isopropanol.
12. Cap the vial and store the solution at -20 ºC.
13. The yield of [13C11,15N]IPyA is about 0.1 mg.
► CRITICAL: The concentration of the [13C11,15N]IPyA solution has to be determined
immediately before use (Step 2 in “Procedure”).
Determine the concentration of [13C11,15N]IPyA solution by reverse isotope dilution
14. Freshly prepare 0.1 mg/ml unlabeled IPyA in 50% isopropanol.
15. Freshly prepare 20 mg/ml NaB2H4 in 0.3 N NaOH.
16. In a 0.5-ml microcentrifuge tube, accurately add 5 µl each of unlabeled IPyA and
synthesized [13C11,15N]IPyA solution.
CRITICAL STEP: for the ease of calculation in Step 15, it is recommended to add
equal volumes of IPyA and [13C11,15N]IPyA solutions.
17. Add 8 µl NaB2H4 solution and mix well.
18. Incubate the tube at 37 ºC for 30 min.
19. Add 5 µl 25% PA to acidify the mixture and consume the residual NaB2H4.
20. Add 200 µl water and mix well.
21. Extract the reduced IPyA (now ILA) by adding 100 µl ethyl acetate to partition.
22. Collect the ethyl acetate extract in a 2-ml clear glass vial.
23. Add 100 µl methanol into the vial.
24. Methylate the sample by filling the vial with ethereal diazomethane.
25. Evaporate the solvents until complete dryness using a N2 gas stream.
37
26. Re-suspend the compounds in 1 ml of ethyl acetate.
27. Analyze the sample using GC-MS/MS under SRM mode. For unlabeled methyl-ILA,
the transition of parent ion m/z 220 to the product ion m/z 130 is monitored; for methyl-
[13C11,15N]ILA, the transition of parent ion m/z 232 to the product ion m/z 140 is
monitored.
28. The ion abundance ratio of m/z 130 over m/z 140 equals the ratio of IPyA
concentration over [13C11,15N]IPyA concentration in the initial sample.

38
Figures
Figure 2-1. A simplified summary of IAA biosynthetic pathways. A solid line represents an enzymatic step. Dashed lines suggest multiple steps or pathways abbreviated. TAA1: Trp aminotransferase of Arabidopsis. YUCCA: an Arabidopsis flavin monooxygenase (Mashiguchi et al., 2011, Woodward and Bartel, 2005).
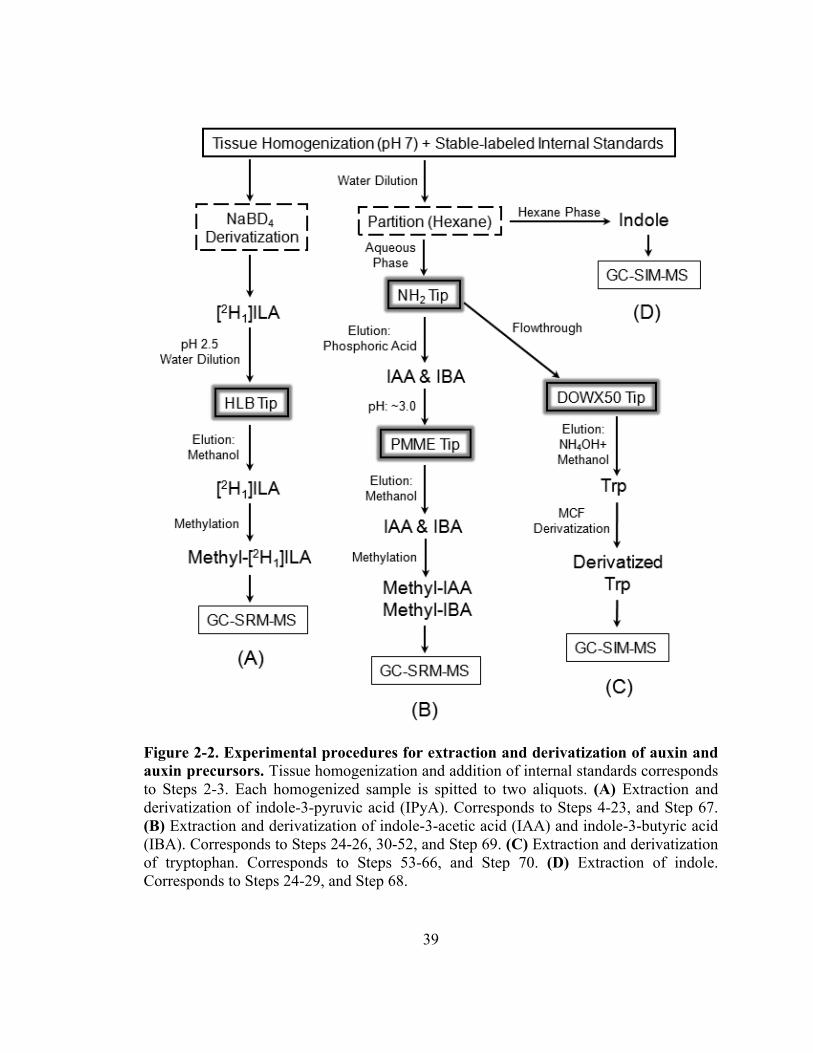
39
Figure 2-2. Experimental procedures for extraction and derivatization of auxin and auxin precursors. Tissue homogenization and addition of internal standards corresponds to Steps 2-3. Each homogenized sample is spitted to two aliquots. (A) Extraction and derivatization of indole-3-pyruvic acid (IPyA). Corresponds to Steps 4-23, and Step 67. (B) Extraction and derivatization of indole-3-acetic acid (IAA) and indole-3-butyric acid (IBA). Corresponds to Steps 24-26, 30-52, and Step 69. (C) Extraction and derivatization of tryptophan. Corresponds to Steps 53-66, and Step 70. (D) Extraction of indole. Corresponds to Steps 24-29, and Step 68.
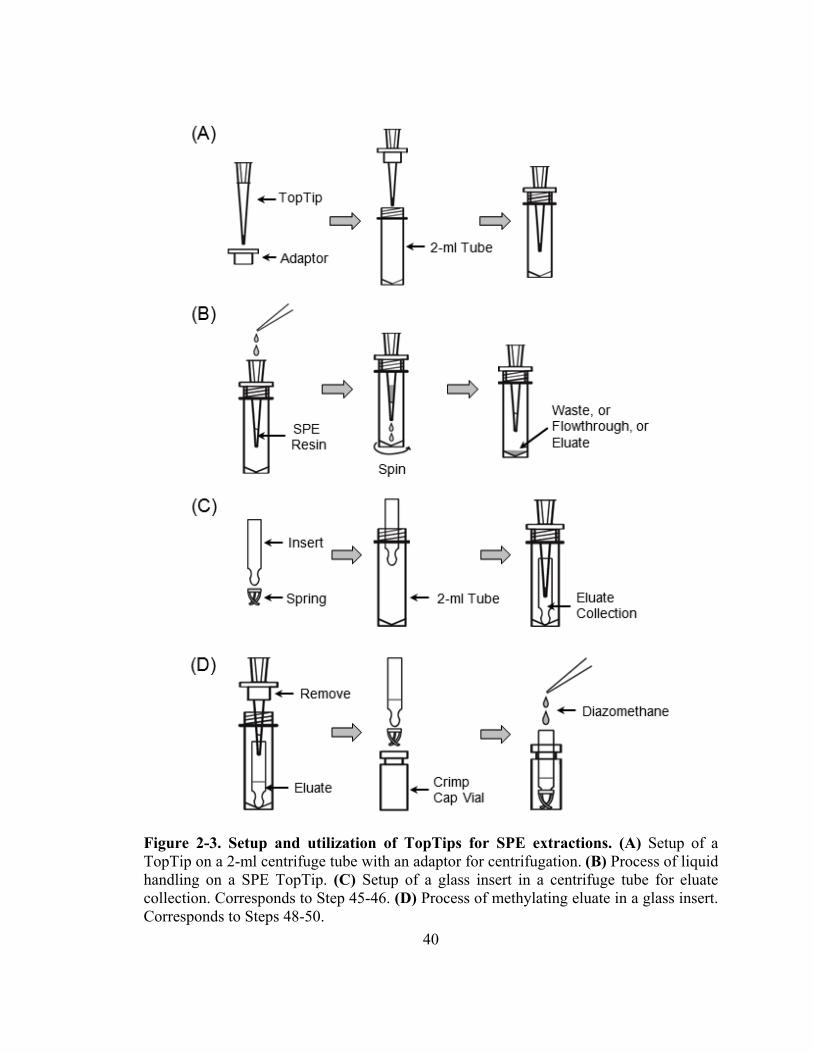
40
Figure 2-3. Setup and utilization of TopTips for SPE extractions. (A) Setup of a TopTip on a 2-ml centrifuge tube with an adaptor for centrifugation. (B) Process of liquid handling on a SPE TopTip. (C) Setup of a glass insert in a centrifuge tube for eluate collection. Corresponds to Step 45-46. (D) Process of methylating eluate in a glass insert. Corresponds to Steps 48-50.
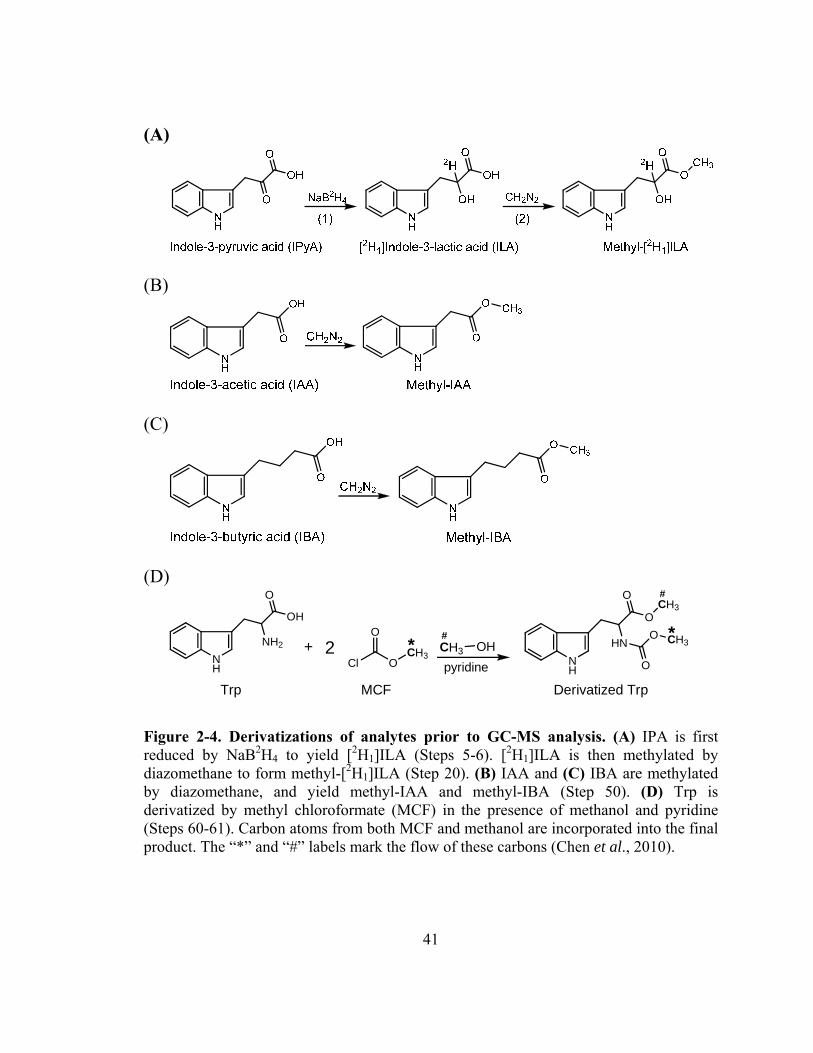
41
(A)
(B)
(C)
(D)
NH
NH2
OH
O
NH
HN
O
O
Trp
+Cl O
O
CH32
MCF
OHCH3
pyridine
CH3
O
O CH3
Derivatized Trp
*#
#
*
Figure 2-4. Derivatizations of analytes prior to GC-MS analysis. (A) IPA is first reduced by NaB2H4 to yield [2H1]ILA (Steps 5-6). [2H1]ILA is then methylated by diazomethane to form methyl-[2H1]ILA (Step 20). (B) IAA and (C) IBA are methylated by diazomethane, and yield methyl-IAA and methyl-IBA (Step 50). (D) Trp is derivatized by methyl chloroformate (MCF) in the presence of methanol and pyridine (Steps 60-61). Carbon atoms from both MCF and methanol are incorporated into the final product. The “*” and “#” labels mark the flow of these carbons (Chen et al., 2010).
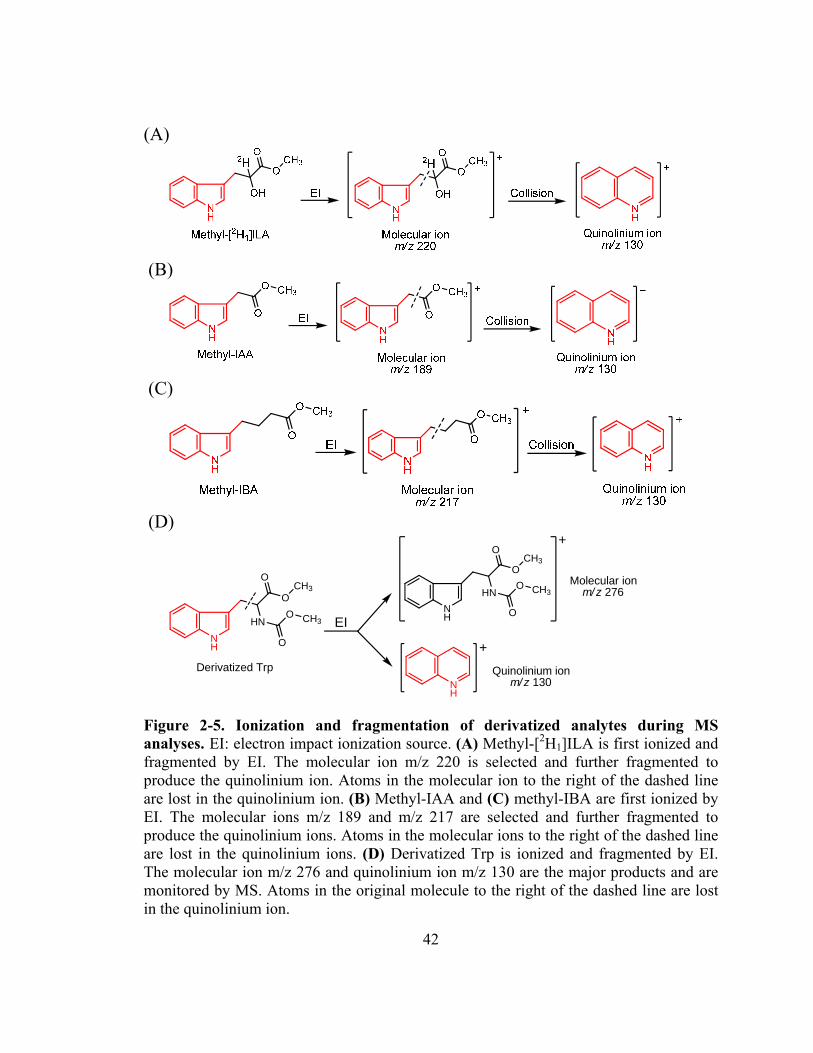
42
(A)
(B)
(C)
(D)
NH
HN
O
OCH3
O
O CH3
Derivatized Trp
EINH
HN
O
OCH3
O
O CH3Molecular ion
m/z 276
NH
+
Quinolinium ionm/z 130
+
Figure 2-5. Ionization and fragmentation of derivatized analytes during MS analyses. EI: electron impact ionization source. (A) Methyl-[2H1]ILA is first ionized and fragmented by EI. The molecular ion m/z 220 is selected and further fragmented to produce the quinolinium ion. Atoms in the molecular ion to the right of the dashed line are lost in the quinolinium ion. (B) Methyl-IAA and (C) methyl-IBA are first ionized by EI. The molecular ions m/z 189 and m/z 217 are selected and further fragmented to produce the quinolinium ions. Atoms in the molecular ions to the right of the dashed line are lost in the quinolinium ions. (D) Derivatized Trp is ionized and fragmented by EI. The molecular ion m/z 276 and quinolinium ion m/z 130 are the major products and are monitored by MS. Atoms in the original molecule to the right of the dashed line are lost in the quinolinium ion.
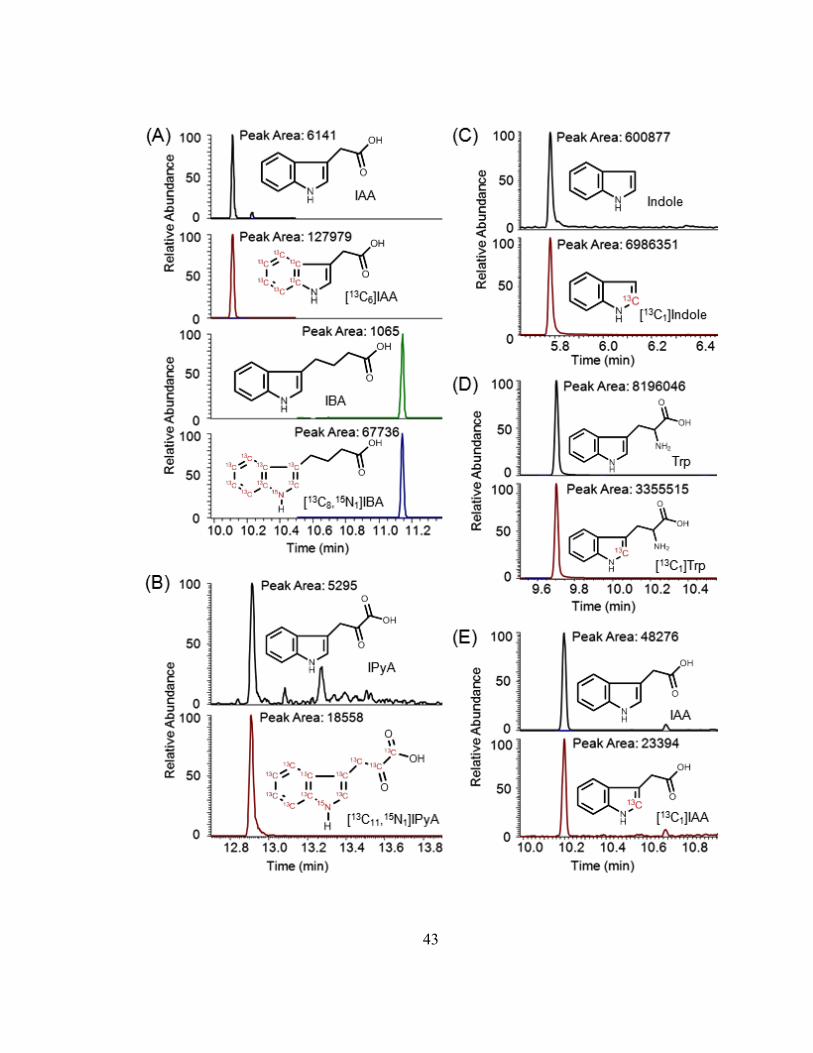
43
44
Figure 2-6. Examples of GC-MS results from typical plant extracts. Structures of starting compounds analyzed and their peak areas are shown. (A) Quantification of IAA and IBA from 2 mg Arabidopsis root tissue using GC-SRM-MS. (B) Quantification of IPyA in 9.5 mg Arabidopsis seedlings using GC-SRM-MS. (C) Enrichment of [13C1]indole using GC-SIM-MS. (D) Enrichment of [13C1]Trp synthesized from [13C1]indole using GC-SIM-MS. (E) Enrichment of [13C1]IAA synthesized from [13C1]indole using GC-SRM-MS.
45
Chapter 3
Low-Fluence Red Light Increases the Transport
and Biosynthesis of Auxin1
Introduction
Indole-3-acetic acid (IAA), the major form of auxin in plants, is involved in a
number of developmental processes and allows plants to react to their environment.
Consistent with its importance, plants have evolved a complex system to regulate the
level of free, active IAA (Normanly et al., 2005). IAA can be actively transported in a
polar fashion, maintaining concentration gradients among plant tissues and cells.
Biochemical and genetic studies have shown that higher plants synthesize IAA directly
from indole by a Trp-independent (TI) pathway, while at least four Trp-dependent (TD)
pathways are also potentially operative. IAA can be conjugated to other molecules via
covalent bonds, forming an IAA reservoir that can release free IAA via hydrolysis
(reviewed by Woodward and Bartel, 2005; Seidel et al., 2006). Clearly, multiple IAA
regulatory pathways exist in plants, and they function cooperatively to precisely control
the level of free IAA, especially when plants perceive environmental changes, such as
high temperature (Gray et al., 1998), wounding (Sztein et al., 2002), and cold stress
(Shibasaki et al., 2009).
Light also acts as a critical environmental signal that controls plant growth and
development. Upon transition from dark growth to light growth, hypocotyl elongation
rate decreases, hooks unfold, cotyledons open, and the photosynthetic machinery
develops. Such changes are rapid and complex, and a series of photoreceptors are 1 This chapter has been published in Plant Physiology, 2011, Vol. 157, pp. 891-904. All the work presented
here was done by me.

46
involved in sensing the quantity and quality of light, including phytochromes (red [R]
light and far-red [FR] light receptors), cryptochromes (blue [B] and UV-A light
receptors), phototropins (B light receptors), and UV-B photoreceptors (Casal et al., 1998;
Briggs and Olney, 2001). Once the photoreceptors are activated, the light signals are then
transferred to the downstream molecular networks that trigger growth and developmental
responses, including networks that involve phytohormones (Kraepiel and Miginiac,
1997). Interactions between light and auxin have been reported at multiple levels. In
dark-grown corn (Zea mays) seedlings, both a single flash and hours of light exposure
were found to induce a decrease in free IAA and an increase in conjugated IAA
(Bandurski et al., 1977; Jones et al., 1991; Barker-Bridges et al., 1998; Zelená, 2000a),
and the effects varied in different tissue types (Zelená, 2000b). After a short period of R
light exposure, IAA synthesized from Trp in corn coleoptiles was decreased, and free
IAA that diffused out of excised coleoptile tips was greatly reduced (Iino, 1982a;
Koshiba et al., 1995; Nishimura et al., 2006), which could result in a reduction of IAA
supply to mesocotyl tissues below the coleoptiles (Iino, 1982b). Light effects on auxin
levels and metabolism were also found in dicotyledonous plants. Behringer and Davies
(1992) reported that after etiolated pea (Pisum sativum) seedlings were exposed to R light
for 3 h, the free IAA level stayed constant in upper stem sections but decreased in
epidermal peels. When etiolated pea seedlings were exposed to a long period of
continuous white light, Symons and Reid (2003) found a transient increase of IAA that
started at 24 h, peaked at 48 h, and disappeared at 96 h. In response to decreased R/FR
light ratios that mimic a shade condition, IAA biosynthesis and the free IAA level were
increased in Arabidopsis (Arabidopsis thaliana) seedlings during the shade avoidance
response (Tao et al., 2008). The shade avoidance response also required polar auxin
transport (PAT), and the auxin transport facilitator protein PIN-FORMED3 (PIN3) was
recently found to play a critical role in this process (Steindler et al., 1999; Keuskamp et
al., 2010).
Close interaction between light and auxin transport was inferred from the work of
Jensen et al. (1998). The elongation of 7-d light-grown Arabidopsis hypocotyls was
47
greatly inhibited by the PAT inhibitor N-1-naphthylphthalamic acid (NPA), but 7-d dark-
grown plants lacked this inhibitory response. Their studies using different light quality
and photoreceptor mutants suggested that both phytochrome and cryptochrome were
involved in the light-dependent NPA effects on hypocotyl elongation. A later report
further supported this finding: when the transport of [3H]IAA was quantified in dark- and
light-grown Arabidopsis hypocotyls, auxin transport in dark-grown seedlings was lower
than in low-light-grown seedlings, and NPA reduced [3H]IAA transport in light-grown
seedlings but not in dark-grown seedlings (Rashotte et al., 2003). Partially consistent
with their report, Shinkle et al. (1998) found that 30 or 50 h of continuous dim R light
increased the transport of [3H]IAA in etiolated cucumber (Cucumis sativus) hypocotyl
segments. However, the transport of [3H]IAA in dark-grown cucumber hypocotyls was
greatly inhibited by NPA, suggesting that the lack of NPA inhibition on auxin transport
in etiolated Arabidopsis hypocotyls was either species specific or non-detectable by the
assay applied. Although these studies established a link between light and auxin
transport, they did not address the questions of whether auxin transport affected the level
of free IAA or if light changed auxin metabolism in addition to changing auxin transport.
To better understand light effects on PAT in etiolated seedlings, I established a
sensitive [3H]IAA transport assay with low background noise and found that PAT in
etiolated Arabidopsis and tomato (Solanum lycopersicum) hypocotyls was detectable and
inhibited by NPA. Light increased PAT in both Arabidopsis and tomato hypocotyl
sections, but only in tomato could the increase be induced by low fluences of R or B light
followed by a dark period. I also found that this low-fluence response in tomato involved
phytochromes but not cryptochrome. In addition to the increase in transport, IAA
biosynthesis and free IAA levels were changed by low-fluence R light in a tissue
dependent manner, and the level of free IAA was a consequence of both the biosynthesis
and transport of IAA.
48
Materials and Methods
Plant Materials and Growth Conditions
Tomato (Solanum lycopersicum ‘Ailsa Craig’) seeds were purchased from
Thompson and Morgan Wholesale and were grown to increase seed quantity in an
isolated field in Hugo, Minnesota, during the summer of 2007. Seeds of cv MoneyMaker
were purchased from Gourmet Seed International. Mono genic mutants (in a background
of cv MoneyMaker) phyA, phyB1, phyB2, and cry1 were from the Tomato Genetics
Resource Center at the University of California and were grown for seed increase in a
greenhouse at 27 °C with 16 h of light per day. Individual plants were grown in 5-gallon
pots, watered daily, and fertilized with slow-release fertilizer (Osmocote Plus; Scotts-
Sierra Horticultural Products). All seeds were imbibed under running tap water overnight,
surface sterilized by incubation in 0.1% Micro 90 (International Products) and 10%
commercial bleach (0.6% sodium hypochlorite) for 10 min with constant slow shaking,
and then washed 10 times with sterile water. Seeds were sown onto Murashige and Skoog
medium (4.33 g L-1 Murashige and Skoog salts [MSP01-50LT; Caisson Laboratories]) in
0.8% (w/v) Phytoblend agar (PTP01-500GM; Caisson Laboratories), pH 5.7, in Magenta
GA-7 Plant Culture Boxes (765200; bio-WORLD [http://www.bio-
world.com/index.php]) that were capped by Magenta G-7 boxes with couplers (765201;
bio-WORLD). Boxes were placed in a physiological dark room at 24 °C, with only brief
exposure to a dim green safelight as needed for manipulations. Seeds germinated on day
3 after sowing were allowed to grow in the dark for 3 d before being used for light
treatments or other experiments.
Arabidopsis (Arabidopsis thaliana ecotype Colombia) seeds were surface
sterilized in 2.0-mL microcentrifuge tubes with 1 mL of 70% ethanol for 2 min, followed
by 1 mL of 30% commercial bleach (to yield 1.8% sodium hypochlorite) for 5 min, and
washed with sterile water five times. Seeds were sown on Murashige and Skoog medium,
0.8% (w/v) Phytoblend agar, 1.0% (w/v) sucrose (Sigma-Aldrich), pH 5.7, and agar
plates were wrapped with Parafilm (Pechiney Plastic Packaging) and kept in a dark room
at 24 °C for 4 d before seedlings were used for light treatments.
49
Light Sources and Light Treatments
All the light treatments were done in a physiological dark room at 24 °C. R light
was provided by two R fluorescent lamps (Sylvania F48T12/2364/HO) filtered through
an Encapsulite R tube guard (Lighting Plastics of Minnesota) and a single layer of
Roscolux 66 cool blue filter; and FR light was provided by two FR fluorescent lamps
(Sylvania F48T12/232/HO) filtered through an Encapsulite FR tube guard (Lighting
Plastics of Minnesota) and a single layer of Lee 85 deeper blue filter (Howe et al., 1996).
B light was provided by two B fluorescent lamps (Science-Lite Blue-64805), and W light
was provided by two or four W fluorescent tubes (Philips F34T12/CW/RS/EW and
Philips F48T12/CW/HO). The radiometric spectra of the R, FR, and B light sources are
shown in Figure 3-17. Photosynthetically active radiation (total irradiance between 400
and 700 nm) was measured with a LI-250A Light Meter (LI-COR Biosciences). R and
FR light fluences were measured with an SKR 110, 660/730-nm sensor (Skye
Instruments). Spectral quality was measured with a model SPEC-UV/PAR
Spectroradiometer (Apogee Instruments). Specific light intensity was obtained by
adjusting the distance between the plants and the light sources or by covering the plants
with neutral density plastic filters. When 10 µmol m-2 or lower R light fluence was
applied, plants were kept in a steel canister (diameter = 11.5 cm, height = 23.5 cm), and
light was allowed to reach the plants only through a neutral density filter on top of the
canister. Different light fluences were achieved by adjusting light intensity and the
duration of light exposure. Fluence rates varied from 0.07 to 5 µmol m-2 s-1 for R and 2 to
5 µmol m-2 s-1 for B, and durations varied from 2 s to 100 min.
Quantification of PAT in Hypocotyls
The hypocotyl basipetal IAA transport assay was modified from that described
previously (Gardner and Sanborn, 1989; Lewis and Muday, 2009). Six millimeters of an
etiolated tomato hypocotyl section 2 mm below the hook tip, or 6 mm of an etiolated
Arabidopsis hypocotyl section directly below the shoot apex, was placed on an agar plate
after excision, and an auxin donor agar block of 1.5% agar (Sigma-Aldrich) containing
50
0.2 M MES (Sigma-Aldrich) and 10-7 M [3H]IAA (Amersham, GE Healthcare; original
specific activity of 25 Ci mmol-1, diluted to 15 Ci mmol-1 by the addition of
nonradioactive IAA) was placed in contact with the apical end of the tissue section, while
a receiver agar block containing 0.2 M MES (pH 6.5) was placed in contact with the
basal end. Receiver blocks containing 0.2 M MES (pH 6.5) and 10 µM NPA
(ChemService) were used as the +NPA control, and a second control was used where the
orientation of the tissue section was inverted (acropetal control). Two strips of
polyethylene film (Saran Original; S.C. Johnson & Sons) were placed between the agar
blocks and the support agar on the plates to avoid diffusion of [3H]IAA through the
support agar and thus prevent an undesirable increase in background counts. The agar
plates were placed vertically with donor blocks down in a chamber with high humidity
for 3 h, and each of the hypocotyl sections was then divided into apical and basal halves.
The receiver block and each half-section of the hypocotyl were extracted individually in
scintillation cocktail (Econo-Safe; Research Products International) overnight, and the
radioactivity was determined by liquid scintillation counting (LS 6500; Beckman). All
the manipulations before scintillation cocktail extraction were done in a dark room under
dim green safelight.
Measurement of Auxin Transport Velocity in Hypocotyls
The setup used for the assay was similar to the PAT assay described above. Two
centimeters of a tomato hypocotyl section cut from 2 mm below the hook tip was
incubated for 20 min with an auxin donor agar block containing 10-7 M [3H]IAA on its
apical end and a receiver agar block on the basal end. Next, the auxin donor agar block
was replaced by a new auxin donor agar block containing 10-7 M unlabeled IAA (Sigma)
and again placed in the humid chamber. After different incubation time periods, each 2-
cm hypocotyl section was cut into 3-mm segments, except that the apical top segment
was 2 mm. Each segment of the hypocotyl and the receiver block was incubated
individually in scintillation cocktail overnight, and the radioactivity was determined by
liquid scintillation counting.

51
Quantification of Free IAA and Conjugated IAA
Six tomato seedlings were dissected into different tissue sections as shown in
Figure 3-7D, and the six replicates from each tissue section were pooled into one
microcentrifuge tube, weighed, frozen in liquid nitrogen, and stored in a 280 °C freezer.
For every 10 mg of frozen tissue, 70 µL of homogenization buffer (35% 0.2 M imidazole,
65% isopropanol, pH 7) containing 1.4 ng of [13C6] IAA was added, and tissues were
homogenized using a Mixer Mill (MM 300; Qiagen) with tungsten carbide beads (3-mm
beads for 1.5-mL tubes and 2.3-mm beads for 0.5-mL tubes; Craig Ball Sales).
Micro solid phase extraction (SPE) methods were modified from methods
described in Chapter 2. Each SPE resin (5 mg of NH2 and 20 mg of
polymethylmethacrylate epoxide) was packed into 200 µL of TopTips (TT2EMT.96;
Glygen Corp) that were placed over 2-mL microcentrifuge tubes with adaptors, and
solvents were added and passed through the tips by centrifugation at 3,000 g to 6,000 g
for a few seconds.
After 1 h on ice, 20 µL of the homogenate was diluted with 180 µL of water and
the extract was purified by micro SPE, similar to that described in Chapter 2. Free IAA
was eluted using methanol and methylated by ethereal diazomethane in a 250-µL glass
insert. The solvents were evaporated under a stream of N2 gas and the sample was
redissolved in 15 µL of ethyl acetate.
For the rest of the homogenate, 10 µL was hydrolyzed in 1 N NaOH (1 h, room
temperature; Baldi et al., 1989) for measurement of free plus ester-linked IAA and 10 µL
was hydrolyzed in 7 N NaOH (3 h, 100 °C under N2; Bialek and Cohen, 1989) for
measurement of total IAA (free plus ester-linked and amidelinked IAA). After
hydrolysis, the pH of the hydrolysate was adjusted to 2.7, and the free IAA plus that
released from the conjugates was purified from the extracts using TopTips containing 7.5
mg of C18 resin (12213020; Varian), washed twice with 60 µL of water, eluted twice
with 50 µL of methanol, collected in 250-µL glass inserts, and methylated as described
above.
52
The methylated IAA was analyzed using gas chromatography (GC)-selected
reaction monitoring-mass spectrometry (MS) on a Thermo Trace GC Ultra coupled to a
TSQ Vantage triple quadrupole MS system (Thermo Scientific). The GC column and
separation conditions were as described in Chapter 2. Compounds eluted from the GC
device were ionized in the electron impact mode with electron emission at 70 eV and
emission current of 100 mA. The molecular ions (mass-to-charge ratio [m/z] 189 for
endogenous IAA and m/z 195 for [13C6]IAA) were selected by the first quadrupole and
collided with argon in the second quadrupole using 10 V of collision energy and a 1.5-
mTorr collision gas pressure. The quinolinium ions produced from the molecular ions
(m/z 130 from m/z 189 and m/z 136 from m/z 195) were selected by the third quadrupole
and detected using 0.025-s scan times. Levels of free IAA, free plus ester-linked IAA,
and total IAA were quantified by isotope dilution analysis based on the [13C6]IAA
internal standard, as described previously (Barkawi et al., 2010).
Stable Isotope Labeling and Isotopic Enrichment Analysis
Tomato seeds were planted on vertical agar plates on a sheet of 20-µm nylon filter
screen (146510; Spectrum Laboratories) that had been placed on top of the agar medium.
The nylon screen allowed tomato seedlings to grow straight on the surface and prevented
root hairs from penetrating into the agar medium. This procedure ensured that a rapid
switch of the tomato plants from normal growth agar to growth agar containing stable
isotope-labeled compounds could be accomplished. It also minimized the effects of
wounding and gravitropic responses during seedling movement. The growth conditions
and light treatments were the same as those described above. To start the labeling
process, tomato plants were transferred to labeling medium by picking up the filter screen
with sterile forceps and transferring the screen and the attached tomato seedlings onto
agar medium containing either 0.1 mM [2-13C]indole (CLM-1863; Cambridge Isotope
Laboratories) or 0.5 mM L-[13C-indole 2]Trp (CLM-1543; Cambridge Isotope
Laboratories). To uniformly label all the tissues, the entire seedlings were attached to the
nylon filter. Seedlings fed by [13C1]Trp (four per plate) were covered by a 11-cm × 11-cm
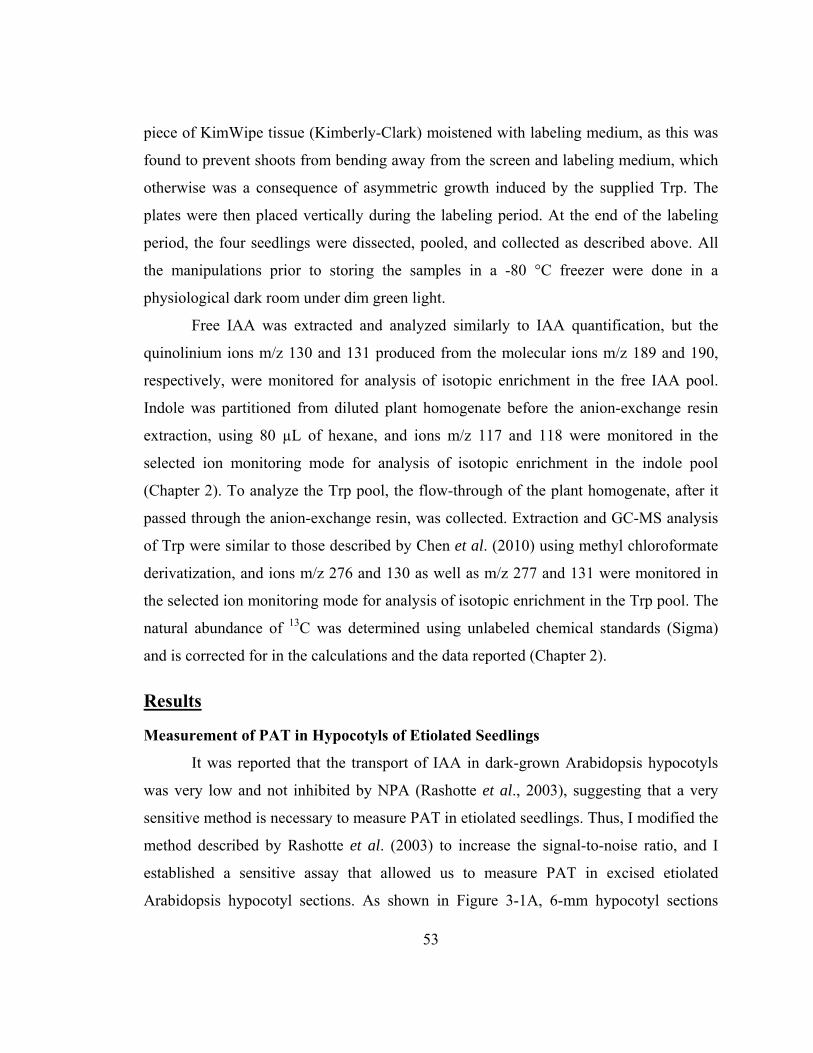
53
piece of KimWipe tissue (Kimberly-Clark) moistened with labeling medium, as this was
found to prevent shoots from bending away from the screen and labeling medium, which
otherwise was a consequence of asymmetric growth induced by the supplied Trp. The
plates were then placed vertically during the labeling period. At the end of the labeling
period, the four seedlings were dissected, pooled, and collected as described above. All
the manipulations prior to storing the samples in a -80 °C freezer were done in a
physiological dark room under dim green light.
Free IAA was extracted and analyzed similarly to IAA quantification, but the
quinolinium ions m/z 130 and 131 produced from the molecular ions m/z 189 and 190,
respectively, were monitored for analysis of isotopic enrichment in the free IAA pool.
Indole was partitioned from diluted plant homogenate before the anion-exchange resin
extraction, using 80 µL of hexane, and ions m/z 117 and 118 were monitored in the
selected ion monitoring mode for analysis of isotopic enrichment in the indole pool
(Chapter 2). To analyze the Trp pool, the flow-through of the plant homogenate, after it
passed through the anion-exchange resin, was collected. Extraction and GC-MS analysis
of Trp were similar to those described by Chen et al. (2010) using methyl chloroformate
derivatization, and ions m/z 276 and 130 as well as m/z 277 and 131 were monitored in
the selected ion monitoring mode for analysis of isotopic enrichment in the Trp pool. The
natural abundance of 13C was determined using unlabeled chemical standards (Sigma)
and is corrected for in the calculations and the data reported (Chapter 2).
Results
Measurement of PAT in Hypocotyls of Etiolated Seedlings
It was reported that the transport of IAA in dark-grown Arabidopsis hypocotyls
was very low and not inhibited by NPA (Rashotte et al., 2003), suggesting that a very
sensitive method is necessary to measure PAT in etiolated seedlings. Thus, I modified the
method described by Rashotte et al. (2003) to increase the signal-to-noise ratio, and I
established a sensitive assay that allowed us to measure PAT in excised etiolated
Arabidopsis hypocotyl sections. As shown in Figure 3-1A, 6-mm hypocotyl sections

54
were used to measure PAT, and [3H]IAA tracer was added in the donor agar block
adjacent to the apical end of the section while a receiver agar block was placed adjacent
to the basal end of the section. After a 3-h transport period, the hypocotyl section was cut
into halves (Fig. 3-1B), and the basipetal transport of IAA was determined as a
percentage of radioactivity in the basal section and the receiver block divided by the total
radioactivity in the tissue plus the receiver block.
As shown in Figure 3-1C, about 10% of the [3H]IAA taken up by the etiolated
Arabidopsis hypocotyl section was transported to the basal end of the hypocotyl section.
This transport was reduced by at least 50% when 10 mM of the transport inhibitor NPA
was added to the receiver agar block, indicating that the measured transport of [3H]IAA
was polar and inhibited by NPA.
In the acropetal control, auxin transport was as low as 1% of the total, showing a low
amount of diffusion of [3H]IAA in the assay, and percentage PAT was determined by
subtracting the apparent acropetal auxin transport from the basipetal auxin transport. This
assay was also successfully applied to dark-grown tomato hypocotyls and similar results
were obtained, except that PAT in etiolated tomato seedlings was about twice as much as
in etiolated Arabidopsis seedlings (Fig. 3-1C).
PAT in Etiolated Seedlings Was Increased by Light
To explore the light effect on PAT in etiolated seedlings, Arabidopsis plants were
kept in the dark for 4 d after sowing and tomato plants were kept in the dark for 3 d after
germination before light exposure. Seedlings were then exposed to continuous white (W)
light for 2 d, while control plants were kept in the dark for the same length of time. As
shown in Figure 3-2, A and B, 2 d of continuous W light doubled the PAT in Arabidopsis
hypocotyls and increased PAT in tomato hypocotyls by about 60%. When the W light
exposure period was shortened to 1 d, the promotion of PAT in Arabidopsis still occurred
but was reduced relative to a 2-d exposure, while tomato showed the same amount of
PAT promotion as with 2 d of W. I further shortened the light exposure period to 1 h and
then returned plants to the dark for an additional 1 d (tomato) or 2 d (Arabidopsis) to
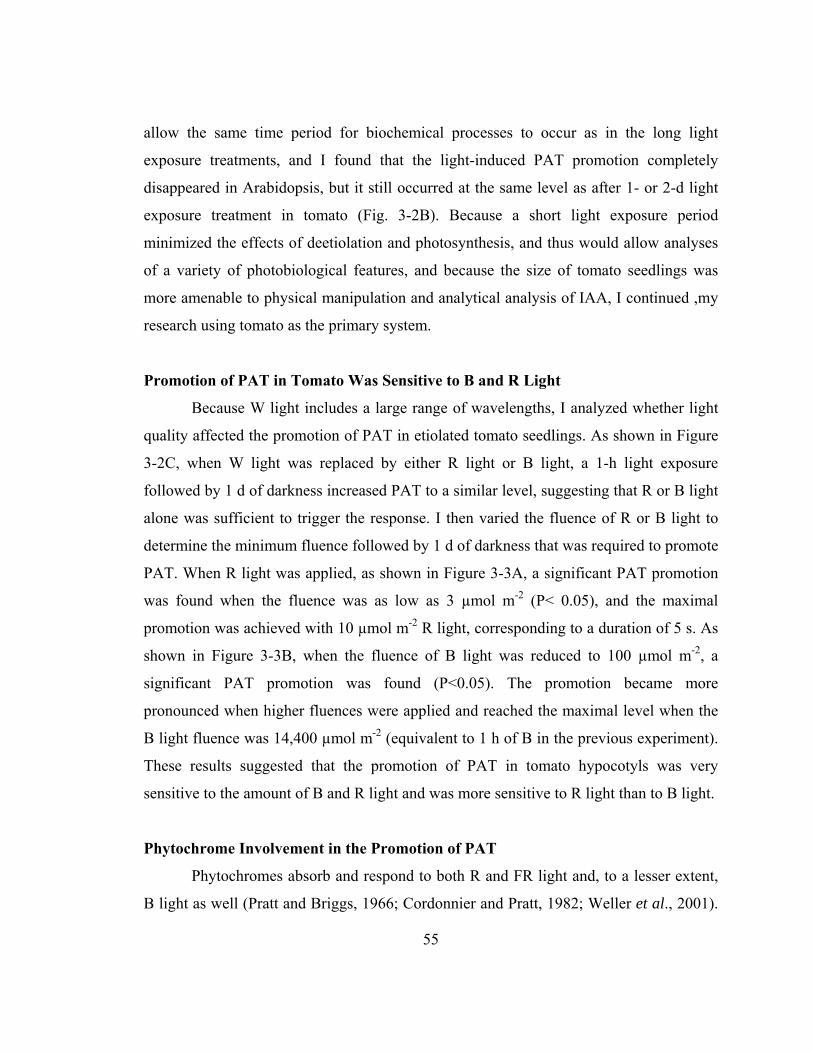
55
allow the same time period for biochemical processes to occur as in the long light
exposure treatments, and I found that the light-induced PAT promotion completely
disappeared in Arabidopsis, but it still occurred at the same level as after 1- or 2-d light
exposure treatment in tomato (Fig. 3-2B). Because a short light exposure period
minimized the effects of deetiolation and photosynthesis, and thus would allow analyses
of a variety of photobiological features, and because the size of tomato seedlings was
more amenable to physical manipulation and analytical analysis of IAA, I continued ,my
research using tomato as the primary system.
Promotion of PAT in Tomato Was Sensitive to B and R Light
Because W light includes a large range of wavelengths, I analyzed whether light
quality affected the promotion of PAT in etiolated tomato seedlings. As shown in Figure
3-2C, when W light was replaced by either R light or B light, a 1-h light exposure
followed by 1 d of darkness increased PAT to a similar level, suggesting that R or B light
alone was sufficient to trigger the response. I then varied the fluence of R or B light to
determine the minimum fluence followed by 1 d of darkness that was required to promote
PAT. When R light was applied, as shown in Figure 3-3A, a significant PAT promotion
was found when the fluence was as low as 3 µmol m-2 (P< 0.05), and the maximal
promotion was achieved with 10 µmol m-2 R light, corresponding to a duration of 5 s. As
shown in Figure 3-3B, when the fluence of B light was reduced to 100 µmol m-2, a
significant PAT promotion was found (P<0.05). The promotion became more
pronounced when higher fluences were applied and reached the maximal level when the
B light fluence was 14,400 µmol m-2 (equivalent to 1 h of B in the previous experiment).
These results suggested that the promotion of PAT in tomato hypocotyls was very
sensitive to the amount of B and R light and was more sensitive to R light than to B light.
Phytochrome Involvement in the Promotion of PAT
Phytochromes absorb and respond to both R and FR light and, to a lesser extent,
B light as well (Pratt and Briggs, 1966; Cordonnier and Pratt, 1982; Weller et al., 2001).
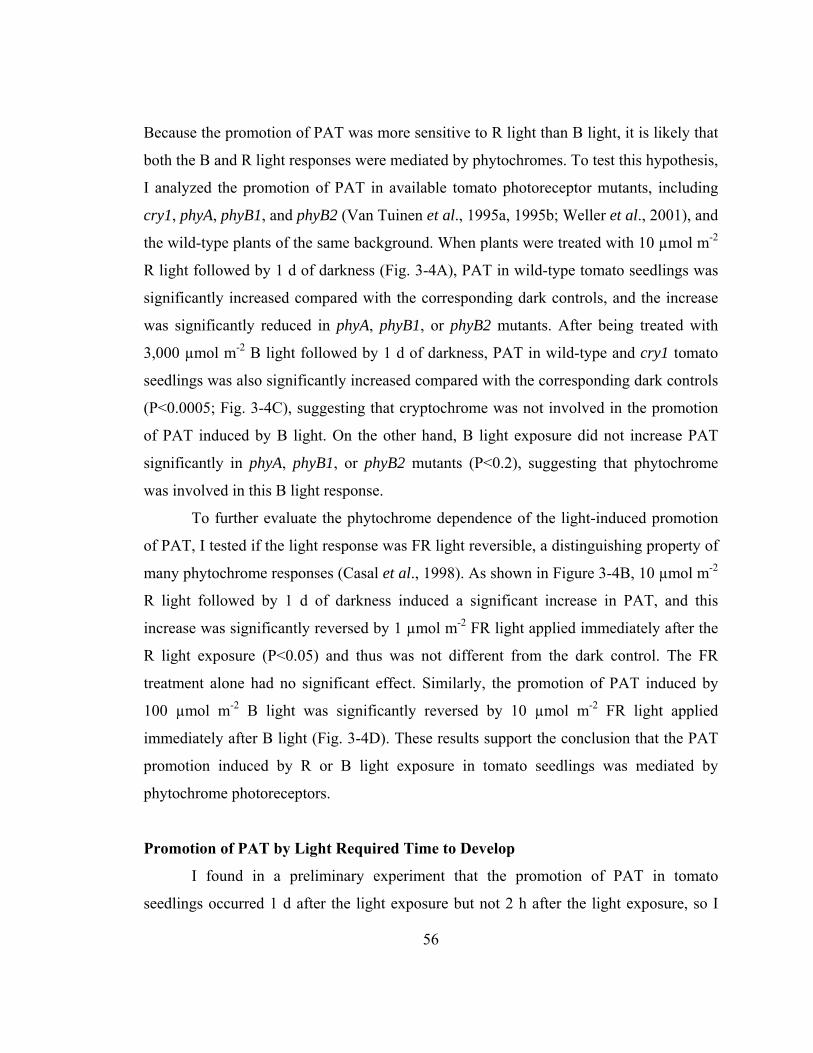
56
Because the promotion of PAT was more sensitive to R light than B light, it is likely that
both the B and R light responses were mediated by phytochromes. To test this hypothesis,
I analyzed the promotion of PAT in available tomato photoreceptor mutants, including
cry1, phyA, phyB1, and phyB2 (Van Tuinen et al., 1995a, 1995b; Weller et al., 2001), and
the wild-type plants of the same background. When plants were treated with 10 µmol m-2
R light followed by 1 d of darkness (Fig. 3-4A), PAT in wild-type tomato seedlings was
significantly increased compared with the corresponding dark controls, and the increase
was significantly reduced in phyA, phyB1, or phyB2 mutants. After being treated with
3,000 µmol m-2 B light followed by 1 d of darkness, PAT in wild-type and cry1 tomato
seedlings was also significantly increased compared with the corresponding dark controls
(P<0.0005; Fig. 3-4C), suggesting that cryptochrome was not involved in the promotion
of PAT induced by B light. On the other hand, B light exposure did not increase PAT
significantly in phyA, phyB1, or phyB2 mutants (P<0.2), suggesting that phytochrome
was involved in this B light response.
To further evaluate the phytochrome dependence of the light-induced promotion
of PAT, I tested if the light response was FR light reversible, a distinguishing property of
many phytochrome responses (Casal et al., 1998). As shown in Figure 3-4B, 10 µmol m-2
R light followed by 1 d of darkness induced a significant increase in PAT, and this
increase was significantly reversed by 1 µmol m-2 FR light applied immediately after the
R light exposure (P<0.05) and thus was not different from the dark control. The FR
treatment alone had no significant effect. Similarly, the promotion of PAT induced by
100 µmol m-2 B light was significantly reversed by 10 µmol m-2 FR light applied
immediately after B light (Fig. 3-4D). These results support the conclusion that the PAT
promotion induced by R or B light exposure in tomato seedlings was mediated by
phytochrome photoreceptors.
Promotion of PAT by Light Required Time to Develop
I found in a preliminary experiment that the promotion of PAT in tomato
seedlings occurred 1 d after the light exposure but not 2 h after the light exposure, so I
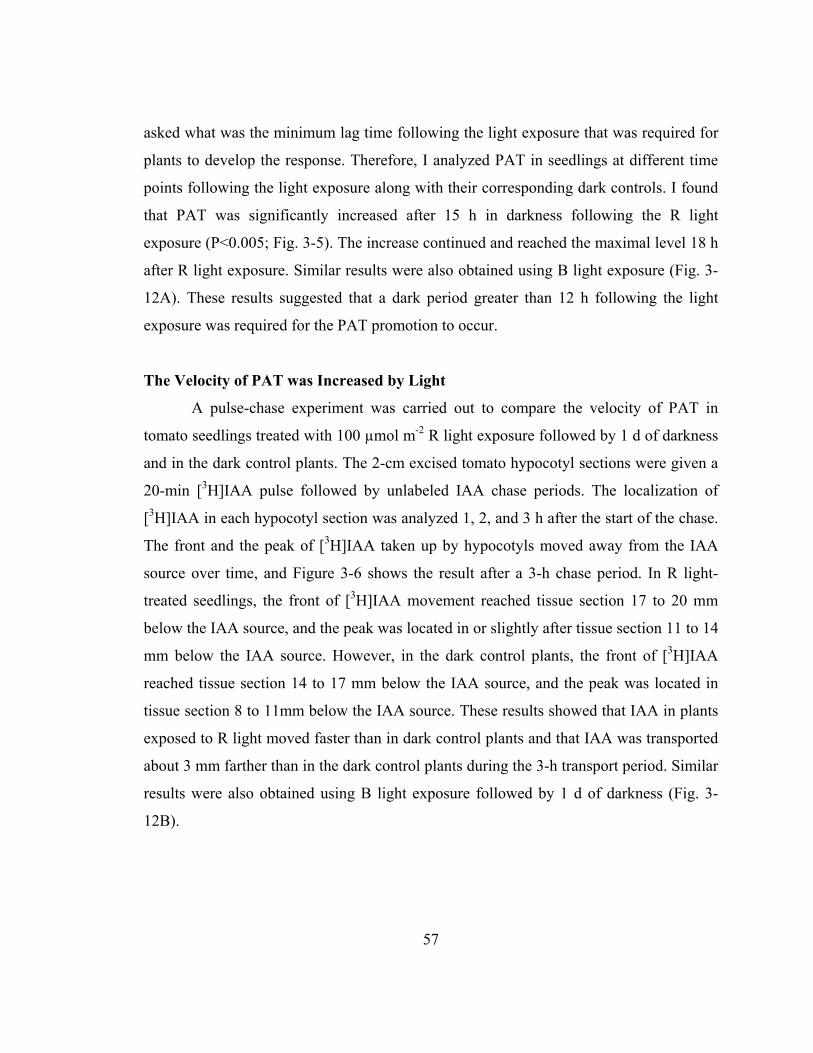
57
asked what was the minimum lag time following the light exposure that was required for
plants to develop the response. Therefore, I analyzed PAT in seedlings at different time
points following the light exposure along with their corresponding dark controls. I found
that PAT was significantly increased after 15 h in darkness following the R light
exposure (P<0.005; Fig. 3-5). The increase continued and reached the maximal level 18 h
after R light exposure. Similar results were also obtained using B light exposure (Fig. 3-
12A). These results suggested that a dark period greater than 12 h following the light
exposure was required for the PAT promotion to occur.
The Velocity of PAT was Increased by Light
A pulse-chase experiment was carried out to compare the velocity of PAT in
tomato seedlings treated with 100 µmol m-2 R light exposure followed by 1 d of darkness
and in the dark control plants. The 2-cm excised tomato hypocotyl sections were given a
20-min [3H]IAA pulse followed by unlabeled IAA chase periods. The localization of
[3H]IAA in each hypocotyl section was analyzed 1, 2, and 3 h after the start of the chase.
The front and the peak of [3H]IAA taken up by hypocotyls moved away from the IAA
source over time, and Figure 3-6 shows the result after a 3-h chase period. In R light-
treated seedlings, the front of [3H]IAA movement reached tissue section 17 to 20 mm
below the IAA source, and the peak was located in or slightly after tissue section 11 to 14
mm below the IAA source. However, in the dark control plants, the front of [3H]IAA
reached tissue section 14 to 17 mm below the IAA source, and the peak was located in
tissue section 8 to 11mm below the IAA source. These results showed that IAA in plants
exposed to R light moved faster than in dark control plants and that IAA was transported
about 3 mm farther than in the dark control plants during the 3-h transport period. Similar
results were also obtained using B light exposure followed by 1 d of darkness (Fig. 3-
12B).

58
The Level of Free IAA was Increased by Light in Some Tissue Sections
Because altered PAT can be associated with an altered distribution of free IAA
among different plant tissues, I quantified the levels of IAA in different tomato tissue
sections. In a preliminary experiment, when levels of free IAA were measured in the 6-
mm hypocotyl sections used for the PAT assay and in tissues above (meristem,
cotyledons, and hook) and below (remaining hypocotyl tissues) the sections, no change in
free IAA was found after plants were treated by light followed by 1 d of darkness.
However, because the change in IAA levels might be very localized, I measured IAA
levels in more discrete tissue sections, as shown in Figure 3-7D. Consistent with the
preliminary result, the level of free IAA was not changed in the top section (consisting of
meristem, cotyledons, and hook), H1, and H5 sections, but free IAA was increased 20%
to 30% in H2, H3, and H4 sections after 100 µmol m-2 R light followed by 1 d of
darkness (P<0.05; Fig. 3-7A). I also measured the level of conjugated IAA, including
ester-linked IAA and amide-linked IAA, but neither type of IAA conjugate showed
significant changes (Fig. 3-7, B and C), suggesting that the increased free IAA was not
due to a change in the rate of release of free IAA from IAA conjugates via hydrolysis.
Biosynthesis of IAA in the Top Section was Increased by Light
IAA can be synthesized from [13C1]indole directly via the Trp-independent
pathway or, following [13C1] indole conversion to Trp, the [13C1]indole-derived Trp can
be used in the Trp-dependent pathways. IAA can be synthesized from supplied labeled
Trp only via Trp-dependent pathways (Fig. 3-8C). To understand if IAA biosynthesis was
altered by R light followed by 1 d of darkness, I used stable isotope-labeled indole or Trp
to feed tomato seedlings, and I analyzed the enrichment of labeled IAA derived from
each labeled precursor. I found that 100 µmol m-2 R light followed by 1 d of darkness
induced a significant increase of [13C1]indole-derived IAA in the top section (P<0.05;
Fig. 3-8A; Fig. 3-13A) and a marginally significant increase of [13C1]indole-derived IAA
in H3 (P<0.6; Fig. 3-8A). This R light-induced increase of [13C1]indole-derived IAA in
the top section does not occur in phyA, phyB1, or phyB2 mutants (Fig. 3-9), suggesting
59
that phytochromes are involved in the regulation of IAA biosynthesis. Importantly, the
level of [13C1]indole-derived IAA in the top section after R exposure was significantly
higher than the level of [13C1]indole-derived Trp (P<0.05), while the levels were the same
in dark control plants (Fig. 3-8A); this difference was more obvious when a shorter
labeling period was applied (Fig. 3-13B), and these results suggest that TI biosynthesis of
IAA was increased by R light and became the predominant path for de novo IAA
biosynthesis. Similarly, a significant increase of [13C1]Trp-derived IAA was found in the
top section after R light exposure (P<0.05; Fig. 3-8B). I also found that the isotopic
enrichment in the indole or Trp pool was not different in plants with or without light
treatment (Fig. 3-14), supporting the conclusion that the increased amount of labeled IAA
was not due to increased availability of labeled precursors but because the biosynthesis of
IAA was increased by light. Interestingly, when plants were fed with [13C1]indole and 10
mM NPA simultaneously, labeled IAA was greatly reduced in tissue sections H1, H2,
H3, and H4 compared with controls without NPA (Fig. 3-10), suggesting that IAA
synthesized in the top section moved basipetally in the PAT stream while IAA was also
synthesized locally in hypocotyl tissues and/or that NPA directly affected IAA
biosynthesis as well.
Discussion
A goal of this study was to understand the effects of light on the transport,
biosynthesis, and distribution of IAA in etiolated seedlings. It was reported previously
that auxin transport in dark-grown Arabidopsis seedlings was not reduced by NPA
(Rashotte et al., 2003). Here, I found that 10% of the IAA taken up by dark-grown
Arabidopsis hypocotyls was transported basipetally and that transport was reduced by
50% when NPA was applied to the basal end of the sections (Fig. 3-1C). This suggested
that, similar to other etiolated dicotyledonous plants such as cucumber and tomato, PAT
occurs in dark-grown Arabidopsis hypocotyls, and the lack of measured NPA inhibition
of PAT in Rashotte et al. (2003) was likely due to the sensitivity limit of the transport
60
assay used. My results are consistent with those of Nagashima et al. (2008), who showed
that NPA inhibited the elongation of 3-d dark-grown Arabidopsis seedlings, but the
inhibition was not as great in 5-d dark-grown seedlings. Because hypocotyl growth
approached a maximum in 5-d dark-grown etiolated Arabidopsis, probably due to the
exhaustion of seed reserves (Gardner et al., 2009), it seemed that NPA-treated dark-
grown seedlings could still growat a lower rate and finally reach their maximal lengths;
this may explain why Jensen et al. (1998) found no effect of NPA on the elongation of 7-
d-old Arabidopsis seedlings. The slow growth of dark-grown seedlings treated with NPA
could be a contribution of the local biosynthesis of IAA (discussed below), but local IAA
biosynthesis alone was not sufficient to support the growth of light-grown seedlings,
which had a higher level of PAT (Fig. 3-2A). Therefore, it would appear that auxin
transport is required for hypocotyl elongation in both dark-grown and light-grown
Arabidopsis seedlings, but it limits the growth of light-grown seedlings to a greater
extent.
The promotion of PAT by light seems to be regulated differently in Arabidopsis
and tomato seedlings. In tomato, the promotion could be achieved using light fluences in
the range of 1 to 1,000 µmol m-2, which fits the definition of a low-fluence response
(LFR; Neff et al., 2000), and this response was further confirmed by the R/FR
reversibility test. However, the promotion in Arabidopsis required a much longer period
of light exposure and also a higher fluence rate; thus, effects such as greening and active
photosynthesis could also play an important role in this promotion. LFR has often been
considered to be controlled by phyB (Shinomura et al., 1996; Casal et al., 1998), while
LFR controlled by phyA has also been reported (Long and Iino, 2001; Stowe-Evans et
al., 2001; Shen et al., 2009). I found that the promotion of PAT induced by low-fluence
R light was greatly reduced in phyA, phyB1, and phyB2 tomato mutants (Fig. 3-4A),
providing an additional example of LFR mediated by both phyA and phyB. B light-
induced PAT promotion was also reduced in these phytochrome mutants (Fig. 3-4C),
which is consistent with the role of phytochromes in B light perception in tomato (Weller
et al., 2001). This response was not reduced in a cry1 mutant, and PAT was significantly
61
increased in the cry1 mutant after B exposure (Fig. 3-15), suggesting a negative role of
cryptochrome in PAT, as reported previously (Zeng et al., 2010). In the absence of
tomato mutants defective in phototropin functions, I could not test for effects of
phototropins on the B light induced PAT promotion, but I found that a FR light pulse
following the B light pulse reversed the B light effects (Fig. 3-4D), suggesting that this B
light response was mostly, if not entirely, mediated by phytochromes.
The low-fluence-induced PAT promotion did not occur immediately after light
exposure but required a dark period of over 12 h to develop (Fig. 3-5). This means that
the effect of the light pulse persisted over a long period of time, and a series of
downstream changes triggered by the light signal, such as changes in the expression and
localization of PAT transporters and facilitators, were required to increase PAT.
Keuskamp et al. (2010) showed regulation of PIN3 by phytochrome signaling in a shade-
avoidance response, and Ding et al. (2011) showed that unilateral W light (which induced
phototropic curvature) polarized PIN3 localization to the inner side of hypocotyl
endodermis cells (facing the vasculature). These studies suggest that R light could induce
polarly localized PIN3, which restricts IAA to the basipetal transport stream in the stele
(Petrášek and Friml, 2009), and thus this could increase the basipetal transport of IAA.
Interestingly, I found that a brief light pulse increased PAT velocity (Fig. 3-6), which was
also reported in cucumber seedlings after a long period of R light treatment (Shinkle et
al., 1998). Although a mechanism for regulating the auxin transport rate in hypocotyls
has not been established as yet, light was shown to change the intracellular distribution of
PIN2 in Arabidopsis roots (Laxmi et al., 2008). Thus, light may increase the PAT rate by
promoting the plasma membrane localization of auxin transporters and facilitators as well
as by increasing the turnover rate of these proteins.
PAT is usually considered as a means of controlling the distribution of free IAA,
so the transport direction may imply the relative level of free IAA. Thus, when PAT was
promoted in the hypocotyl segment by a light pulse, I expected the level of free IAA to be
increased in lower regions of the hypocotyl and decreased in the top section. My free
IAA measurement was partially consistent with this expectation, which showed that the
62
free IAA level was significantly increased in H2, H3, and H4 segments (Fig. 3-7A), but
this difference was not significant when all tissues below H1 were pooled together,
suggesting that the significant increase in free IAA was localized. On the other hand, the
free IAA levels in H1 and in the top section above H1 were not changed by the light
pulse, suggesting that transporting IAA away from these tissue sections did not
necessarily decrease the level of free IAA. This result was not surprising given that Jones
et al. (2005) found no change in the distribution of free IAA in the upper and lower
regions of inflorescence stems of the Arabidopsis pin1-1 mutant, where PAT was
dramatically decreased (Okada et al., 1991). Furthermore, this result could be explained
when IAA biosynthesis was taken into consideration (discussed below). Indeed, the lack
of light effects on free IAA levels in these tissues was a result of the combined effects of
increased IAA biosynthesis and increased PAT, and transporting newly synthesized IAA
basipetally to lower regions of the hypocotyls maintained a constant level of free IAA in
the top section.
I used both [13C]indole and [13C]Trp to label the seedlings in order to explore if
light had different effects on the TI and TD IAA biosynthetic pathways. The rationale for
this approach is that [13C]Trp forms IAA only via TD pathways while [13C]indole forms
IAA directly via the TI pathway or, alternatively, can be converted to Trp and
subsequently used by the TD pathways. Because the level of [13C]Trp-derived IAA was
increased in the top section, it can be concluded that TD IAA biosynthesis was increased
by R light (Fig. 3-8B). In addition, the enrichment of [13C]indole-derived [13C]IAA in the
top section in dark control plants was equal to the [13C]indole-derived [13C]Trp, so the
[13C]IAA in dark tissue could all have been derived from [13C]Trp via TD pathways;
thus, the TD pathways could be the predominant path for de novo IAA biosynthesis in
dark-grown plants. On the other hand, in the case of R light-exposed plants, an increased
enrichment of [13C]indole-derived [13C]IAA was noted, while the enrichment of
[13C]indole-derived [13C]Trp in the same samples was unaffected. This resulted in the
enrichment of [13C]IAA exceeding that of [13C]Trp (Fig. 3-8A). Therefore, it can be
concluded that the TI IAA biosynthesis was also increased by R light, and that the TI
63
IAA biosynthetic pathway was the predominant path for de novo IAA biosynthesis in the
top section after R light exposure. Moreover, when the enrichment of [13C]indole-derived
[13C] IAA was analyzed in the top section of phyA, phyB1, and phyB2 mutants, I found
that IAA biosynthesis in these tissues did not change in response to low-fluence R light
(Fig. 3-9), suggesting that the R light effect on IAA biosynthesis is under the control of
phytochrome. Additionally, IAA biosynthesis in these phytochrome mutants was lower
than in the wild type both in the presence and absence of R light exposure (Fig. 3-9).
Thus, in addition to the red1/cyp83b1 mutant (Hoecker et al., 2004) and the shade
avoidance response (Tao et al., 2008), my work provides an additional link between
phytochrome signaling and auxin biosynthesis, confirming that auxin biosynthesis plays
an important role in phytochrome-regulated photomorphogenesis.
I also noticed that the predominance of TI IAA biosynthesis after R light exposure
was even more evident when a shorter labeling period was analyzed (Fig. 3-13B). This
result suggests the possibility that one could fail to see the differential labeling if too long
a labeling period was used and the Trp pool became saturated by [13C]Trp derived from
[13C]indole. Changes in the use of TI and TD IAA biosynthetic pathways were reported
previously as a result of plant organ development and as a response to stress (Ljung et al.,
2001b; Epstein et al., 2002; Rapparini et al., 2002; Sztein et al., 2002), indicating that the
different IAA biosynthetic pathways play distinct roles under different developmental
and environmental conditions. Additionally, my data showed that the biosynthesis of
[13C]Trp from [13C]indole was also increased by R light exposure in sections H1 and H2
but not in any other tissue section (Fig. 3-8A). This change could potentially be hidden if
the whole seedling was used for analysis, as was done for microarray analyses (where
both R and FR exposure decrease Trp synthase-β At1g01010 gene expression in
Arabidopsis; http://bbc.botany.utoronto.ca/efp/cgi-bin/efpWeb.cgi). The change in Trp
biosynthesis was not associated with changes in TD IAA biosynthesis in these tissue
sections (Fig. 3-8B), suggesting that it is a consequence or trigger for photomorphogenic
changes other than IAA biosynthesis. While, to my knowledge, phytochrome regulation
of Trp synthase-b activity has not been reported, phytochrome is known to regulate the
64
expression, translation, and thus activity of a plethora of other plastid-localized enzymes
(Christopher, 2003).
It is worth pointing out that the amount of [13C]IAA derived from [13C]Trp or
[13C]indole was different in different tissue sections, and one might conclude that the
utilization of these precursors for IAA biosynthesis was different in different tissues.
However, the enrichment of [13C]Trp was not uniform among the tissue sections (Fig. 3-
13B), and the relative abundance corresponded to that of [13C]Trp-derived IAA,
suggesting that the amount of [13C]Trp-derived IAA was associated with the availability
of [13C]Trp in the tissue. However, the enrichment of [13C]indole was uniform in all
tissue sections (Fig. 3-14A), so the abundance of [13C]indole-derived IAA in each tissue
section represented IAA biosynthesis activity. Therefore, compared with Trp, indole is a
better precursor for comparative study of IAA biosynthesis across different tissues, not
only because it covers both TD and TI biosynthetic pathways but also because it labels
the endogenous pool uniformly.
The role of localized IAA biosynthesis in different regions of the hypocotyl was
further explored using NPA to disrupt PAT. When seedlings were treated with NPA to
inhibit PAT (Fig. 3-10), the enrichment of newly synthesized labeled IAA in the H1, H2,
H3, and H4 segments was greatly reduced, and the slight increase of labeled IAA by the
light pulse was also abolished in these segments but not in the top section, suggesting that
light increased IAA biosynthesis only in the top section and thus the increased amount of
free IAA in the H2, H3, and H4 segments resulted from increased IAA biosynthesis in
the top section. Because IAA has been found to promote the plasma membrane
localization of PIN proteins and therefore increase IAA’s own efflux from cells (Paciorek
et al., 2005), the increased IAA biosynthesis at the top section may be the driving force
for increased PAT triggered by light exposure. Although it was expected that the level of
labeled IAA at the top section might be increased by NPA due to disrupted PAT, it was
actually unchanged, suggesting a feedback regulation of IAA biosynthesis by IAA itself,
which has also been reported in other systems (Ribnicky et al., 1996; Ljung et al.,
2001a). The level of labeled IAA in the major portion (H5) of the hypocotyls was not
65
changed by NPA during the 4-h feeding period, suggesting that the enrichment of labeled
IAA in this tissue section was primarily due to local biosynthesis of IAA at a rate that
was lower than that found in the upper part of the shoot. In fact, the enrichment of labeled
IAA in the H5 tissue section in untreated plants could be detected in a 2-h feeding period
(Fig. 3-13A), and it would be impossible for IAA synthesized at the top section to reach
this region within a 2-h period, because the transport rate in hypocotyls was at most 6
mm h-1 (calculated from Fig. 3-5). Therefore, the top section of the seedling was not the
only tissue for de novo IAA biosynthesis, and local biosynthesis of IAA might also
contribute to hypocotyl growth. Although the hypocotyl tissues were capable of
synthesizing IAA, the top section contained the majority of the IAA conjugates (Fig. 3-7,
B and C), which could serve as IAA precursors that slowly release free IAA (Nowacki
and Bandurski, 1980; Chisnell and Bandurski, 1988; Bialek and Cohen, 1992; Ljung et
al., 2001b). Thus, PAT plays an important role in supplying free IAA to lower parts of
seedlings by basipetal transport of newly synthesized and conjugate-derived IAA in the
top section.
The increase of free IAA in a region of tomato hypocotyls after a R light pulse
was consistent with what Behringer and Davies (1992) reported in pea. However, in this
work, the increase in free IAAwas not associated with a differential hypocotyl elongation
rate, and the growth of hypocotyls in plants that were exposed to R light followed by 1 d
of darkness was not different from dark control plants (Fig. 3-16). Thus, instead of
regulating hypocotyl elongation, it is likely that the redistribution of free IAA triggered
other developmental changes, such as promoting vascular development in the stem
tissues (Mattsson et al., 1999; Aloni, 2010). Alternatively, the altered PAT might be a
way to tightly regulate the level of free IAA in the top section, where growth was most
active, or to supply free IAA in root tissues to initiate lateral root formation and promote
root development (Bhalerao et al., 2002; Ljung et al., 2005; Salisbury et al., 2007).
Although I have found that a single very brief R light pulse was sufficient to alter auxin
biosynthesis and transport in etiolated tomato seedlings, no dramatic change in hypocotyl
elongation was observed in this LFR (Fig. 3-16). However, it was previously shown that
66
hypocotyl elongation was decreased when dark-grown tomato seedlings were exposed to
R light pulses with hourly repeats (Van Tuinen et al., 1995a), which was also defined as a
LFR (Casal et al., 1998), and the R light effect was reversible by FR light pulses
following each R light pulse (Van Tuinen et al., 1995a). The mechanism related to the
requirement of repeated R light pulses for the inhibition of hypocotyl elongation during
the de-etiolation process remains to be further studied.
In summary (Fig. 3-11), I have found that in the absence of light, IAA is
synthesized in all regions in the shoot, with more synthesized at the top section, while
PAT also occurs to transport IAA produced at the top section to lower regions in the
hypocotyl, maintaining free IAA gradients across the shoot with maxima at the top
section. When etiolated seedlings are exposed to low-fluence R light, IAA biosynthesis at
the top section is increased and PAT in the adjacent hypocotyl tissue is also increased to
transport more IAA to the basal part of the seedling, leading to an unchanged level of free
IAA in the top section and an increased level of free IAA in the lower regions of the
hypocotyl.
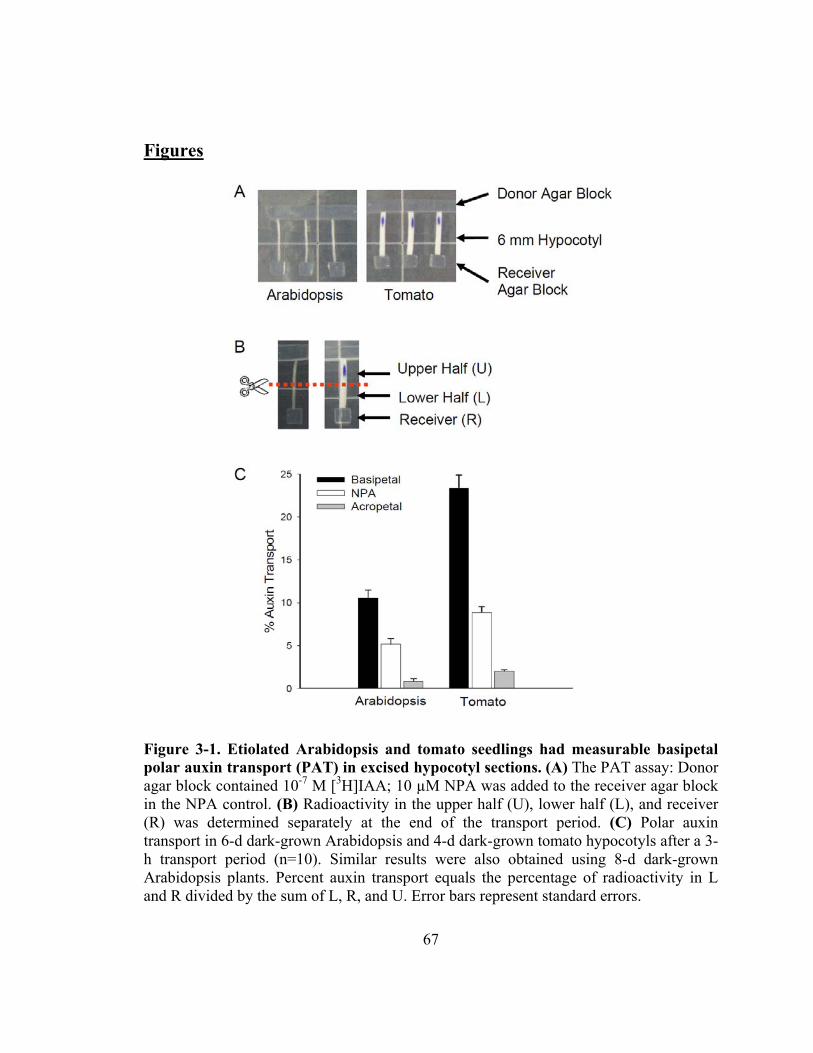
67
Figures
Figure 3-1. Etiolated Arabidopsis and tomato seedlings had measurable basipetal polar auxin transport (PAT) in excised hypocotyl sections. (A) The PAT assay: Donor agar block contained 10-7 M [3H]IAA; 10 µM NPA was added to the receiver agar block in the NPA control. (B) Radioactivity in the upper half (U), lower half (L), and receiver (R) was determined separately at the end of the transport period. (C) Polar auxin transport in 6-d dark-grown Arabidopsis and 4-d dark-grown tomato hypocotyls after a 3-h transport period (n=10). Similar results were also obtained using 8-d dark-grown Arabidopsis plants. Percent auxin transport equals the percentage of radioactivity in L and R divided by the sum of L, R, and U. Error bars represent standard errors.
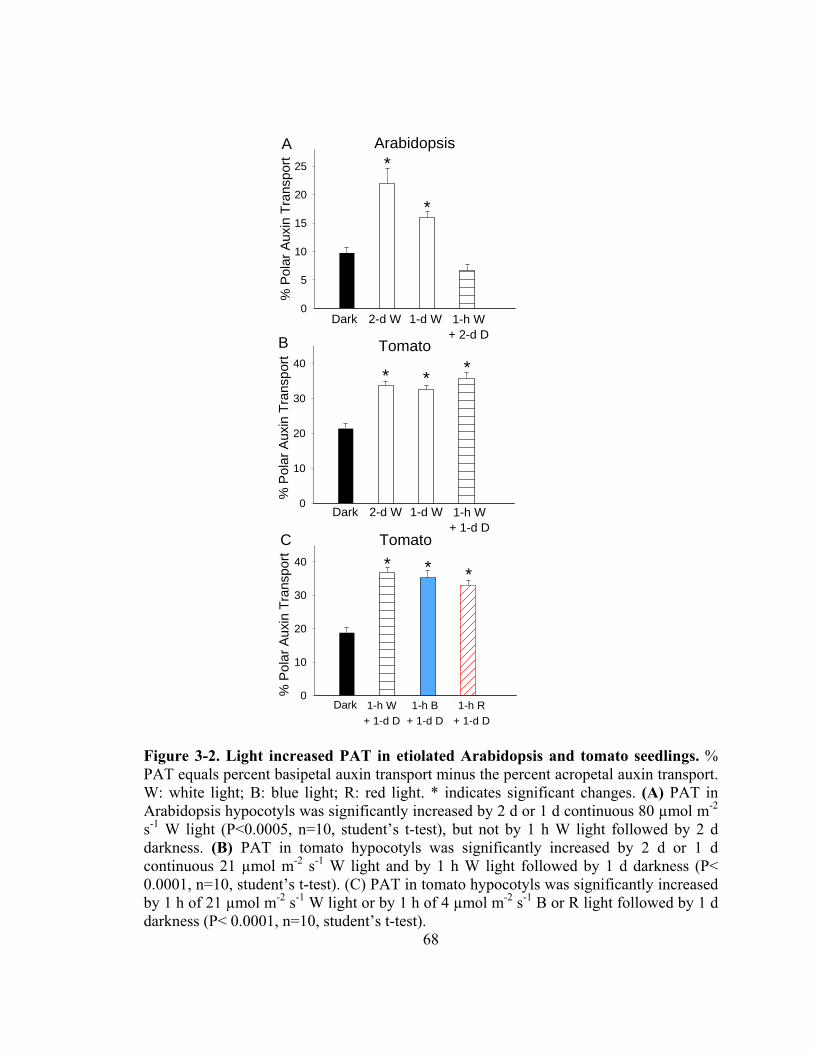
68
% P
ola
r A
uxin
Tra
nsp
ort
0
10
20
30
40
% P
ola
r A
uxi
n T
rans
port
0
10
20
30
40
Arabidopsis
Dark 2-d W 1-d W 1-h W+ 2-d D
A
Tomato
Dark 2-d W 1-d W 1-h W+ 1-d D
B
Tomato
Dark 1-h W
+ 1-d D
1-h B
+ 1-d D
1-h R
+ 1-d D
C
% P
olar
Aux
in T
rans
por
t
0
5
10
15
20
25 *
*
* **
* * *
Figure 3-2. Light increased PAT in etiolated Arabidopsis and tomato seedlings. % PAT equals percent basipetal auxin transport minus the percent acropetal auxin transport. W: white light; B: blue light; R: red light. * indicates significant changes. (A) PAT in Arabidopsis hypocotyls was significantly increased by 2 d or 1 d continuous 80 µmol m-2 s-1 W light (P<0.0005, n=10, student’s t-test), but not by 1 h W light followed by 2 d darkness. (B) PAT in tomato hypocotyls was significantly increased by 2 d or 1 d continuous 21 µmol m-2 s-1 W light and by 1 h W light followed by 1 d darkness (P< 0.0001, n=10, student’s t-test). (C) PAT in tomato hypocotyls was significantly increased by 1 h of 21 µmol m-2 s-1 W light or by 1 h of 4 µmol m-2 s-1 B or R light followed by 1 d darkness (P< 0.0001, n=10, student’s t-test).
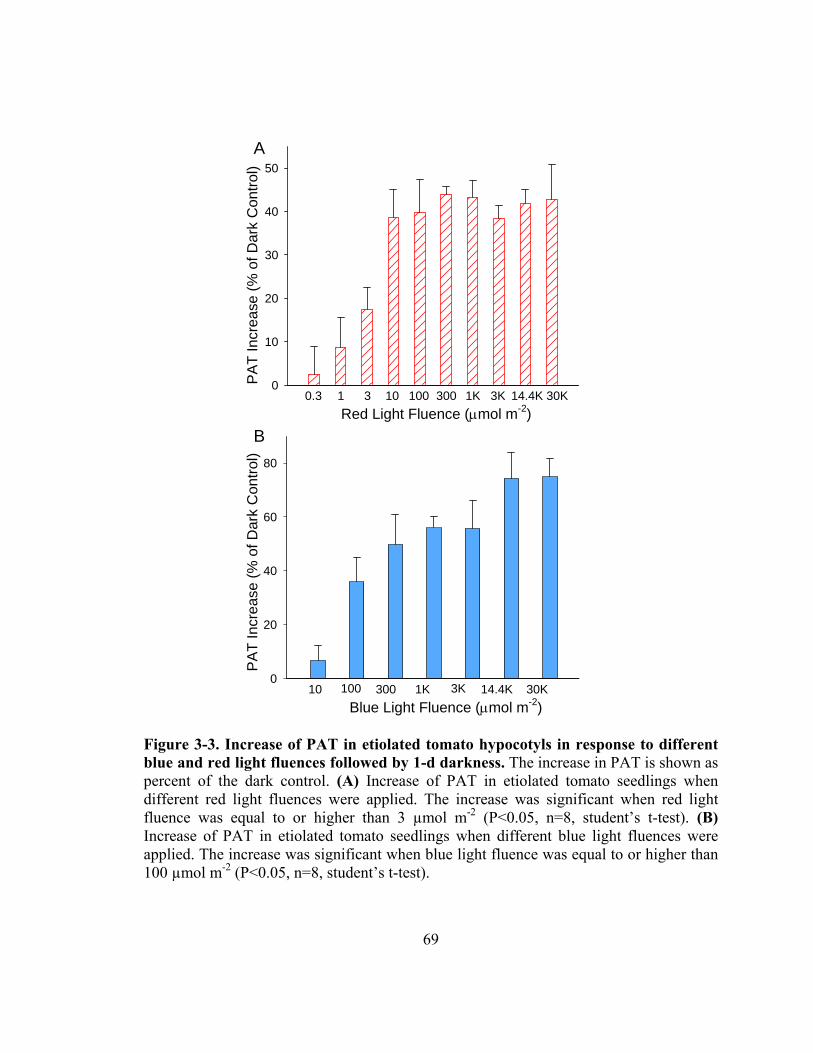
69
Blue Light Fluence (mol m-2)
PA
T In
cre
ase
(%
of D
ark
Con
trol
)
0
20
40
60
80
PA
T In
crea
se (
% o
f Dar
k C
ontr
ol)
0
10
20
30
40
50
10 100 300 1K 3K 14.4K 30K
10 100 300 1K 3K 14.4K 30K310.3
Red Light Fluence (mol m-2)
A
B
Figure 3-3. Increase of PAT in etiolated tomato hypocotyls in response to different blue and red light fluences followed by 1-d darkness. The increase in PAT is shown as percent of the dark control. (A) Increase of PAT in etiolated tomato seedlings when different red light fluences were applied. The increase was significant when red light fluence was equal to or higher than 3 µmol m-2 (P<0.05, n=8, student’s t-test). (B) Increase of PAT in etiolated tomato seedlings when different blue light fluences were applied. The increase was significant when blue light fluence was equal to or higher than 100 µmol m-2 (P<0.05, n=8, student’s t-test).
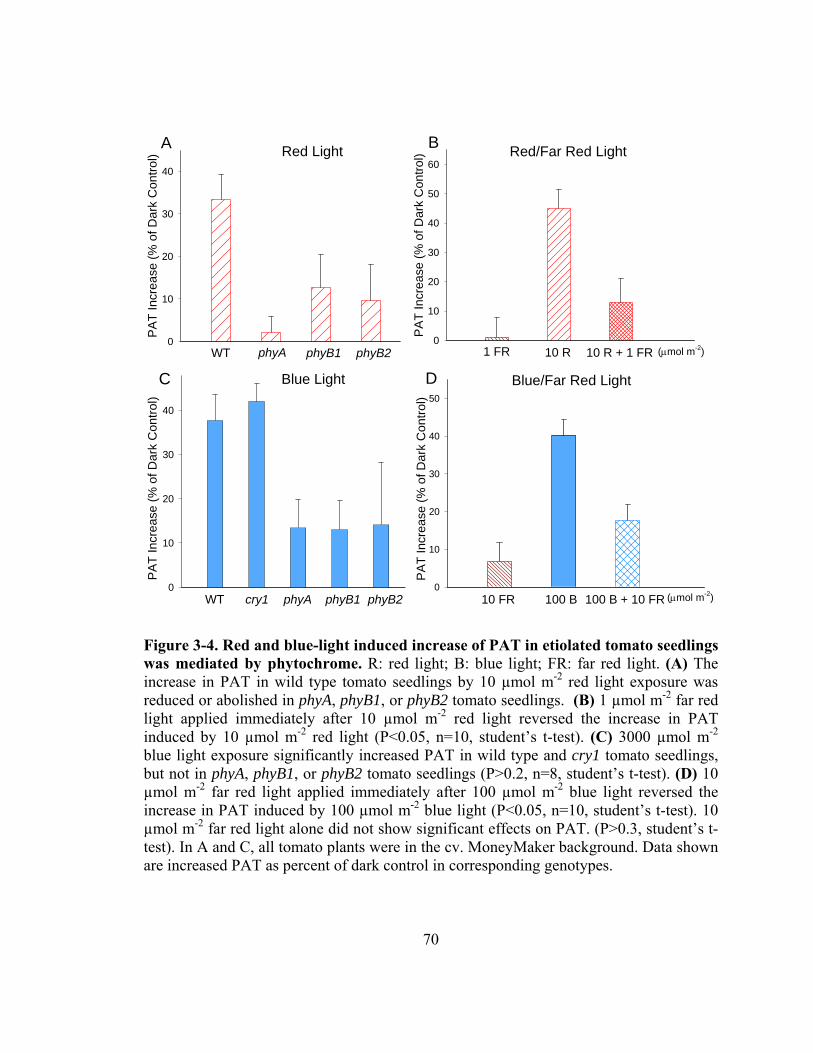
70
PA
T In
crea
se (
% o
f Dar
k C
ontr
ol)
0
10
20
30
40
PA
T In
crea
se (
% o
f Dar
k C
ontr
ol)
0
10
20
30
40
10 R 10 R + 1 FR (mol m-2)
A B
D
WT cry1 phyA phyB1 phyB2
WT phyA phyB1 phyB2
Blue Light
Red Light Red/Far Red Light
100 B 100 B + 10 FR (mol m-2)
Blue/Far Red LightC
PA
T In
crea
se (
% o
f Dar
k C
ontr
ol)
0
10
20
30
40
50
60
1 FR
PA
T In
crea
se (
% o
f Dar
k C
ontr
ol)
0
10
20
30
40
50
10 FR
Figure 3-4. Red and blue-light induced increase of PAT in etiolated tomato seedlings was mediated by phytochrome. R: red light; B: blue light; FR: far red light. (A) The increase in PAT in wild type tomato seedlings by 10 µmol m-2 red light exposure was reduced or abolished in phyA, phyB1, or phyB2 tomato seedlings. (B) 1 µmol m-2 far red light applied immediately after 10 µmol m-2 red light reversed the increase in PAT induced by 10 µmol m-2 red light (P<0.05, n=10, student’s t-test). (C) 3000 µmol m-2 blue light exposure significantly increased PAT in wild type and cry1 tomato seedlings, but not in phyA, phyB1, or phyB2 tomato seedlings (P>0.2, n=8, student’s t-test). (D) 10 µmol m-2 far red light applied immediately after 100 µmol m-2 blue light reversed the increase in PAT induced by 100 µmol m-2 blue light (P<0.05, n=10, student’s t-test). 10 µmol m-2 far red light alone did not show significant effects on PAT. (P>0.3, student’s t-test). In A and C, all tomato plants were in the cv. MoneyMaker background. Data shown are increased PAT as percent of dark control in corresponding genotypes.
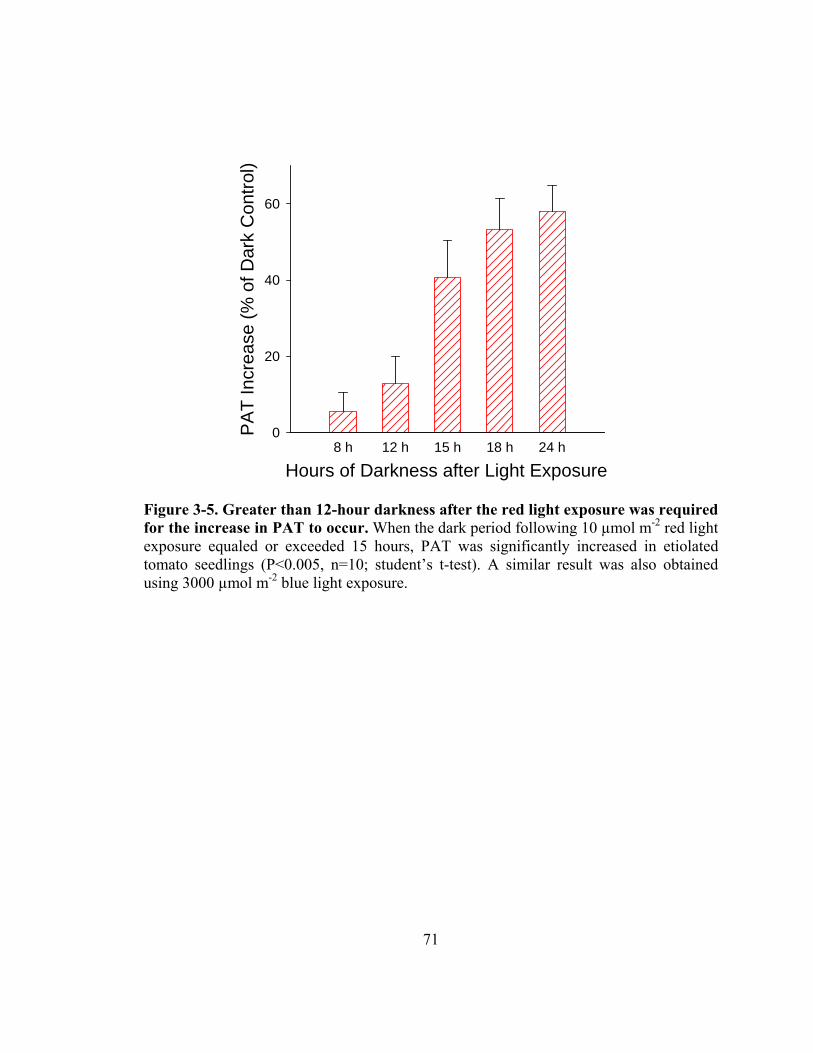
71
Hours of Darkness after Light Exposure8 h 12 h 15 h 18 h 24 h
PA
T In
crea
se (
% o
f D
ark
Con
trol
)
0
20
40
60
Figure 3-5. Greater than 12-hour darkness after the red light exposure was required for the increase in PAT to occur. When the dark period following 10 µmol m-2 red light exposure equaled or exceeded 15 hours, PAT was significantly increased in etiolated tomato seedlings (P<0.005, n=10; student’s t-test). A similar result was also obtained using 3000 µmol m-2 blue light exposure.
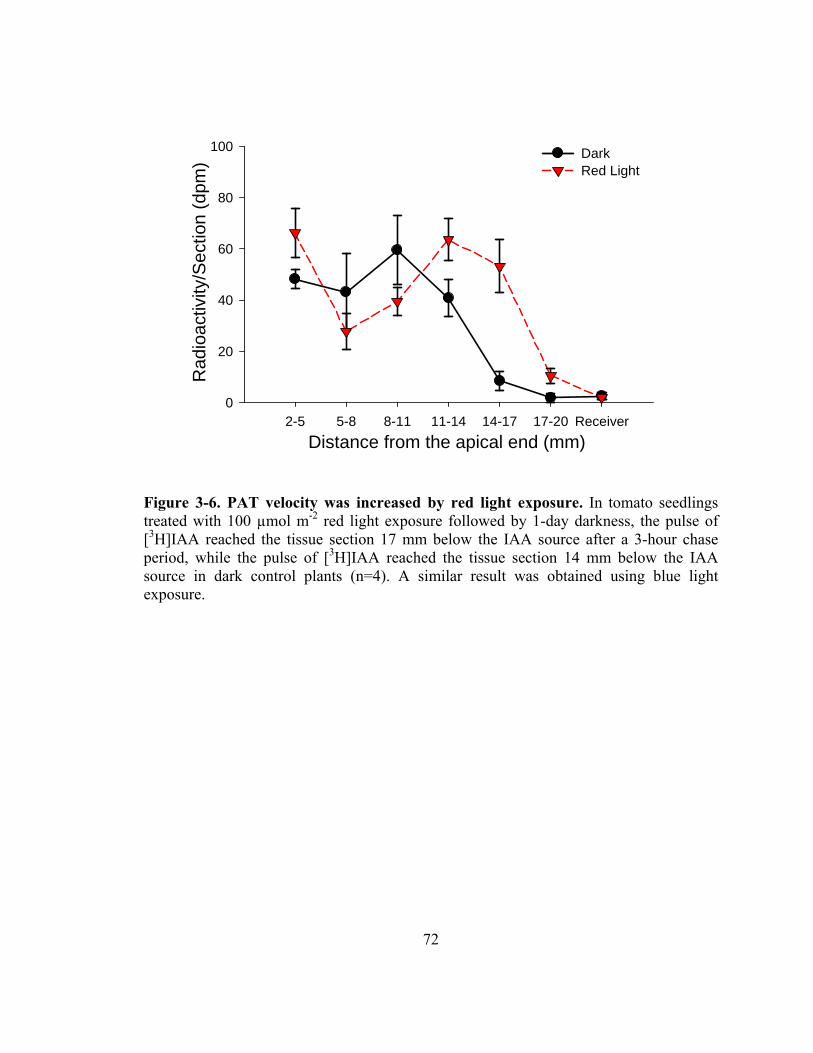
72
Distance from the apical end (mm)2-5 5-8 8-11 11-14 14-17 17-20 Receiver
Rad
ioac
tivity
/Sec
tion
(dpm
)
0
20
40
60
80
100 Dark Red Light
Figure 3-6. PAT velocity was increased by red light exposure. In tomato seedlings treated with 100 µmol m-2 red light exposure followed by 1-day darkness, the pulse of [3H]IAA reached the tissue section 17 mm below the IAA source after a 3-hour chase period, while the pulse of [3H]IAA reached the tissue section 14 mm below the IAA source in dark control plants (n=4). A similar result was obtained using blue light exposure.
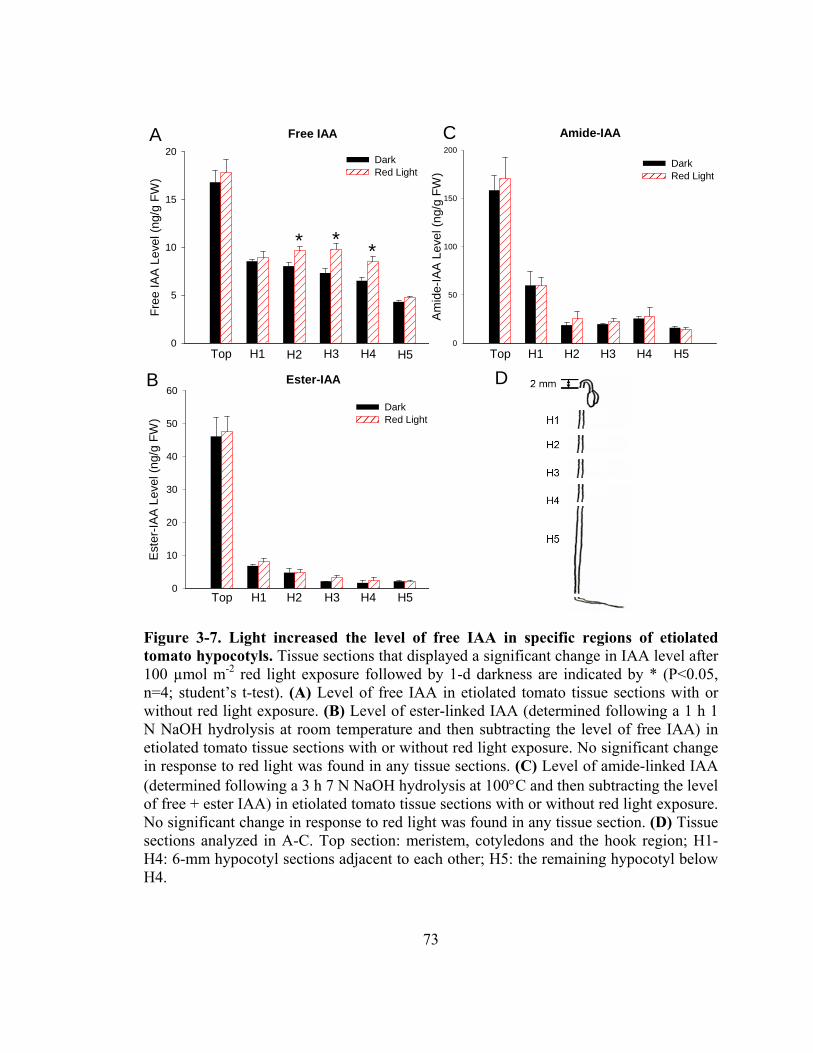
73
Free IAA
Fre
e I
AA
Le
vel (
ng/g
FW
)
0
5
10
15
20Dark Red Light
Ester-IAA
Est
er-I
AA
Lev
el (
ng/
g F
W)
0
10
20
30
40
50
60
DarkRed Light
Amide-IAA
Am
ide-
IAA
Lev
el (
ng/
g F
W)
0
50
100
150
200
DarkRed Light
* **
Top H1 H2 H3 H4 H5 Top H1 H2 H3 H4 H5
Top H1 H2 H3 H4 H5 Figure 3-7. Light increased the level of free IAA in specific regions of etiolated tomato hypocotyls. Tissue sections that displayed a significant change in IAA level after 100 µmol m-2 red light exposure followed by 1-d darkness are indicated by * (P<0.05, n=4; student’s t-test). (A) Level of free IAA in etiolated tomato tissue sections with or without red light exposure. (B) Level of ester-linked IAA (determined following a 1 h 1 N NaOH hydrolysis at room temperature and then subtracting the level of free IAA) in etiolated tomato tissue sections with or without red light exposure. No significant change in response to red light was found in any tissue sections. (C) Level of amide-linked IAA (determined following a 3 h 7 N NaOH hydrolysis at 100C and then subtracting the level of free + ester IAA) in etiolated tomato tissue sections with or without red light exposure. No significant change in response to red light was found in any tissue section. (D) Tissue sections analyzed in A-C. Top section: meristem, cotyledons and the hook region; H1-H4: 6-mm hypocotyl sections adjacent to each other; H5: the remaining hypocotyl below H4.
A
B
C
D
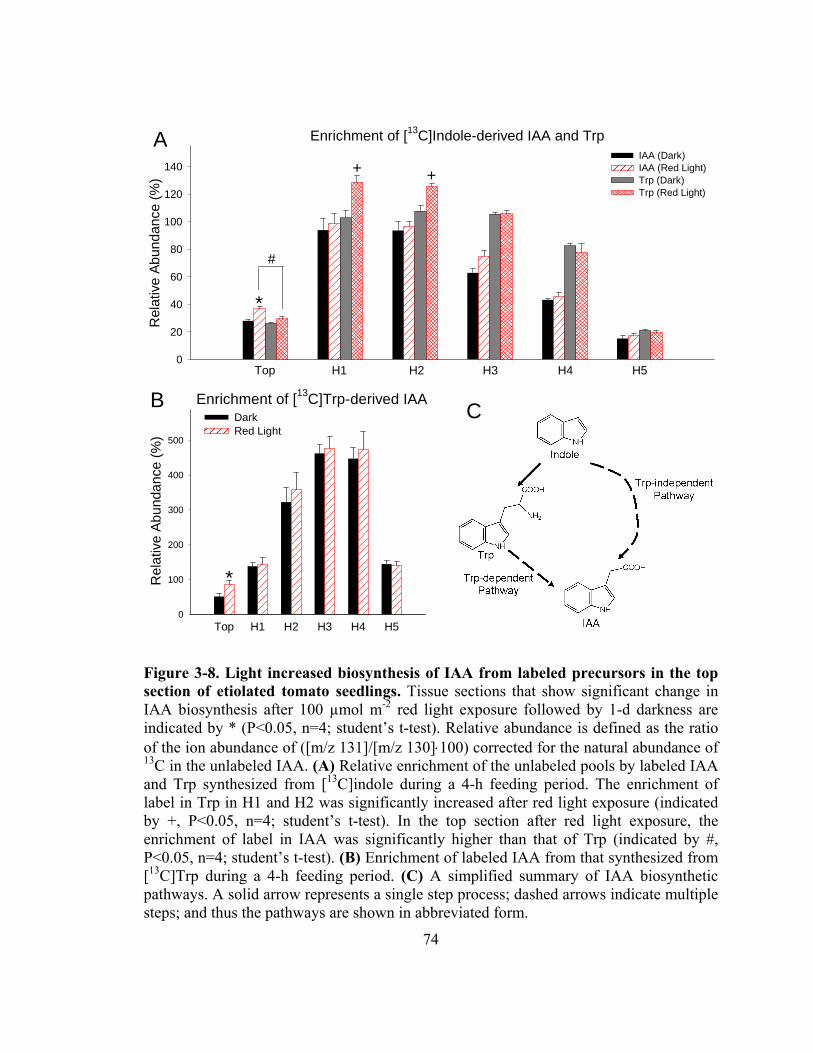
74
Enrichment of [13C]Indole-derived IAA and TrpR
elat
ive
Ab
unda
nce
(%)
0
20
40
60
80
100
120
140IAA (Dark) IAA (Red Light) Trp (Dark) Trp (Red Light)
+ +
#
*
Enrichment of [13C]Trp-derived IAA
Top H1 H2 H3 H4 H5
Rel
ativ
e A
bund
ance
(%
)
0
100
200
300
400
500
DarkRed Light
*
Top H1 H2 H3 H4 H5
Figure 3-8. Light increased biosynthesis of IAA from labeled precursors in the top section of etiolated tomato seedlings. Tissue sections that show significant change in IAA biosynthesis after 100 µmol m-2 red light exposure followed by 1-d darkness are indicated by * (P<0.05, n=4; student’s t-test). Relative abundance is defined as the ratio of the ion abundance of ([m/z 131]/[m/z 130]100) corrected for the natural abundance of 13C in the unlabeled IAA. (A) Relative enrichment of the unlabeled pools by labeled IAA and Trp synthesized from [13C]indole during a 4-h feeding period. The enrichment of label in Trp in H1 and H2 was significantly increased after red light exposure (indicated by +, P<0.05, n=4; student’s t-test). In the top section after red light exposure, the enrichment of label in IAA was significantly higher than that of Trp (indicated by #, P<0.05, n=4; student’s t-test). (B) Enrichment of labeled IAA from that synthesized from [13C]Trp during a 4-h feeding period. (C) A simplified summary of IAA biosynthetic pathways. A solid arrow represents a single step process; dashed arrows indicate multiple steps; and thus the pathways are shown in abbreviated form.
A
B C
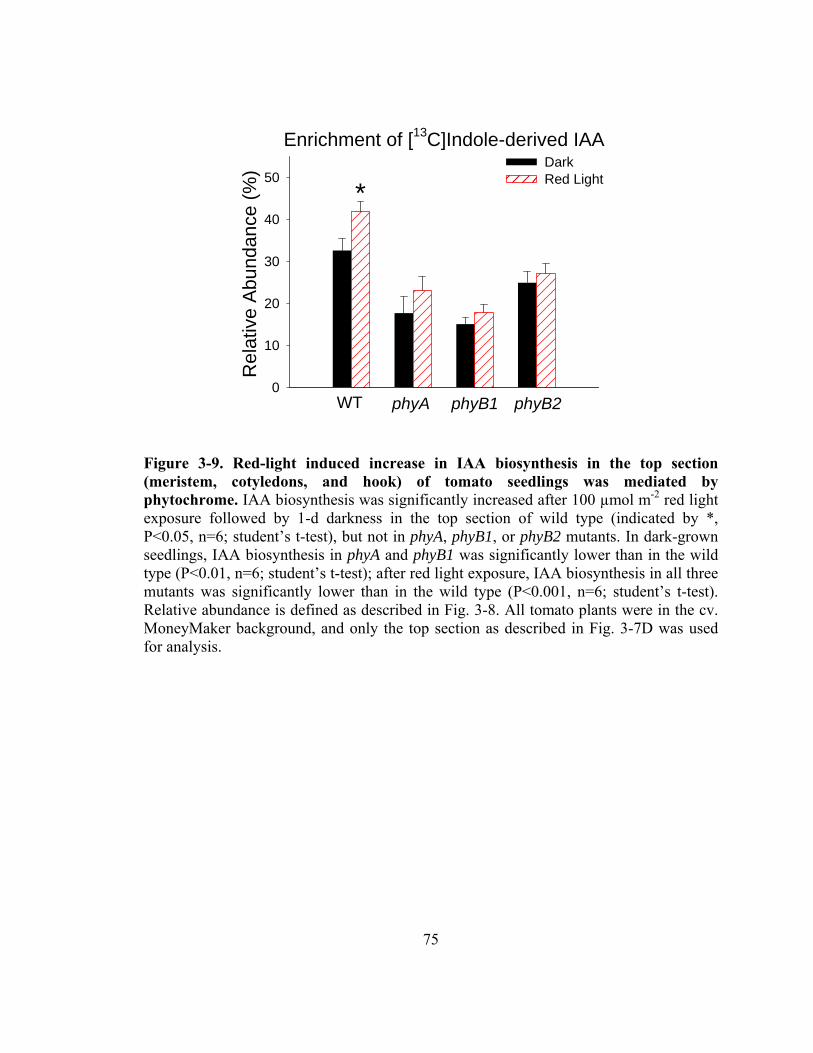
75
Enrichment of [13C]Indole-derived IAA
Rel
ativ
e A
bund
ance
(%
)
0
10
20
30
40
50Dark Red Light
WT phyA phyB1 phyB2
*
Figure 3-9. Red-light induced increase in IAA biosynthesis in the top section (meristem, cotyledons, and hook) of tomato seedlings was mediated by phytochrome. IAA biosynthesis was significantly increased after 100 µmol m-2 red light exposure followed by 1-d darkness in the top section of wild type (indicated by *, P<0.05, n=6; student’s t-test), but not in phyA, phyB1, or phyB2 mutants. In dark-grown seedlings, IAA biosynthesis in phyA and phyB1 was significantly lower than in the wild type (P<0.01, n=6; student’s t-test); after red light exposure, IAA biosynthesis in all three mutants was significantly lower than in the wild type (P<0.001, n=6; student’s t-test). Relative abundance is defined as described in Fig. 3-8. All tomato plants were in the cv. MoneyMaker background, and only the top section as described in Fig. 3-7D was used for analysis.
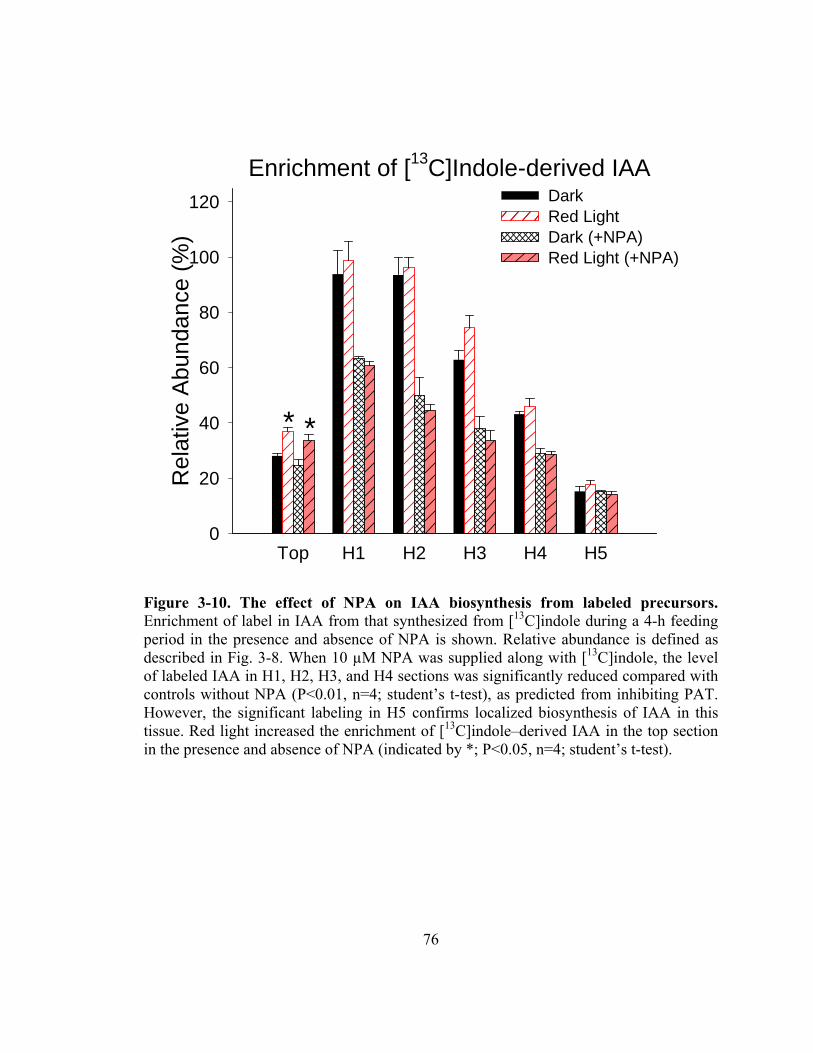
76
Enrichment of [13C]Indole-derived IAA
Top H1 H2 H3 H4 H5
Rel
ativ
e A
bund
ance
(%
)
0
20
40
60
80
100
120 Dark Red Light Dark (+NPA) Red Light (+NPA)
* *
Figure 3-10. The effect of NPA on IAA biosynthesis from labeled precursors. Enrichment of label in IAA from that synthesized from [13C]indole during a 4-h feeding period in the presence and absence of NPA is shown. Relative abundance is defined as described in Fig. 3-8. When 10 µM NPA was supplied along with [13C]indole, the level of labeled IAA in H1, H2, H3, and H4 sections was significantly reduced compared with controls without NPA (P<0.01, n=4; student’s t-test), as predicted from inhibiting PAT. However, the significant labeling in H5 confirms localized biosynthesis of IAA in this tissue. Red light increased the enrichment of [13C]indole–derived IAA in the top section in the presence and absence of NPA (indicated by *; P<0.05, n=4; student’s t-test).
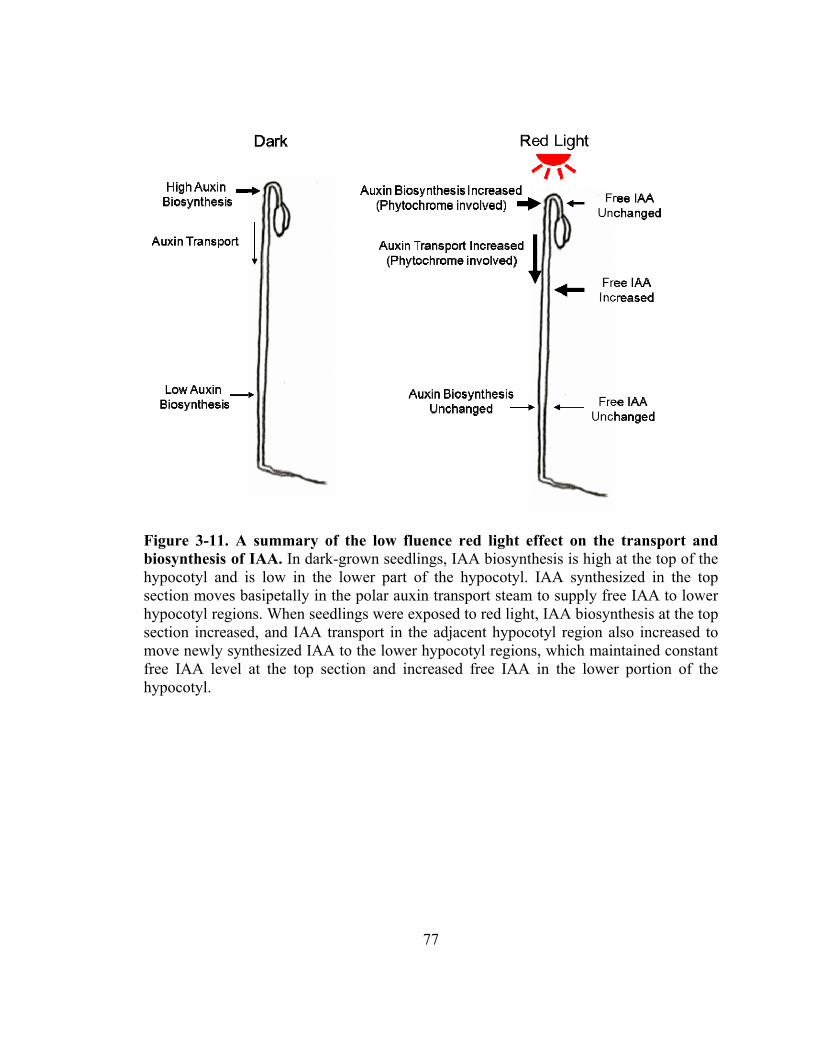
77
Figure 3-11. A summary of the low fluence red light effect on the transport and biosynthesis of IAA. In dark-grown seedlings, IAA biosynthesis is high at the top of the hypocotyl and is low in the lower part of the hypocotyl. IAA synthesized in the top section moves basipetally in the polar auxin transport steam to supply free IAA to lower hypocotyl regions. When seedlings were exposed to red light, IAA biosynthesis at the top section increased, and IAA transport in the adjacent hypocotyl region also increased to move newly synthesized IAA to the lower hypocotyl regions, which maintained constant free IAA level at the top section and increased free IAA in the lower portion of the hypocotyl.
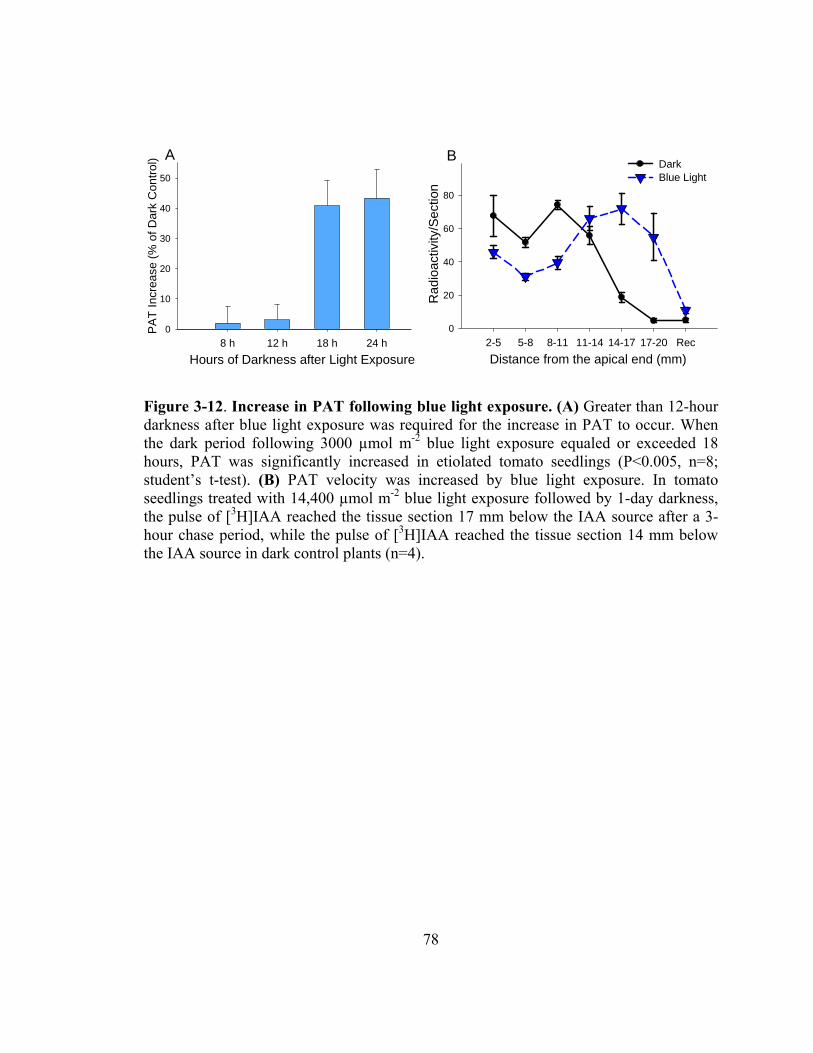
78
Distance from the apical end (mm)2-5 5-8 8-11 11-14 14-17 17-20 Rec
Rad
ioac
tivity
/Sec
tion
0
20
40
60
80
Dark Blue Light
B
Hours of Darkness after Light Exposure8 h 12 h 18 h 24 h
PA
T I
ncre
ase
(% o
f D
ark
Con
trol
)
0
10
20
30
40
50
A
Figure 3-12. Increase in PAT following blue light exposure. (A) Greater than 12-hour darkness after blue light exposure was required for the increase in PAT to occur. When the dark period following 3000 µmol m-2 blue light exposure equaled or exceeded 18 hours, PAT was significantly increased in etiolated tomato seedlings (P<0.005, n=8; student’s t-test). (B) PAT velocity was increased by blue light exposure. In tomato seedlings treated with 14,400 µmol m-2 blue light exposure followed by 1-day darkness, the pulse of [3H]IAA reached the tissue section 17 mm below the IAA source after a 3-hour chase period, while the pulse of [3H]IAA reached the tissue section 14 mm below the IAA source in dark control plants (n=4).
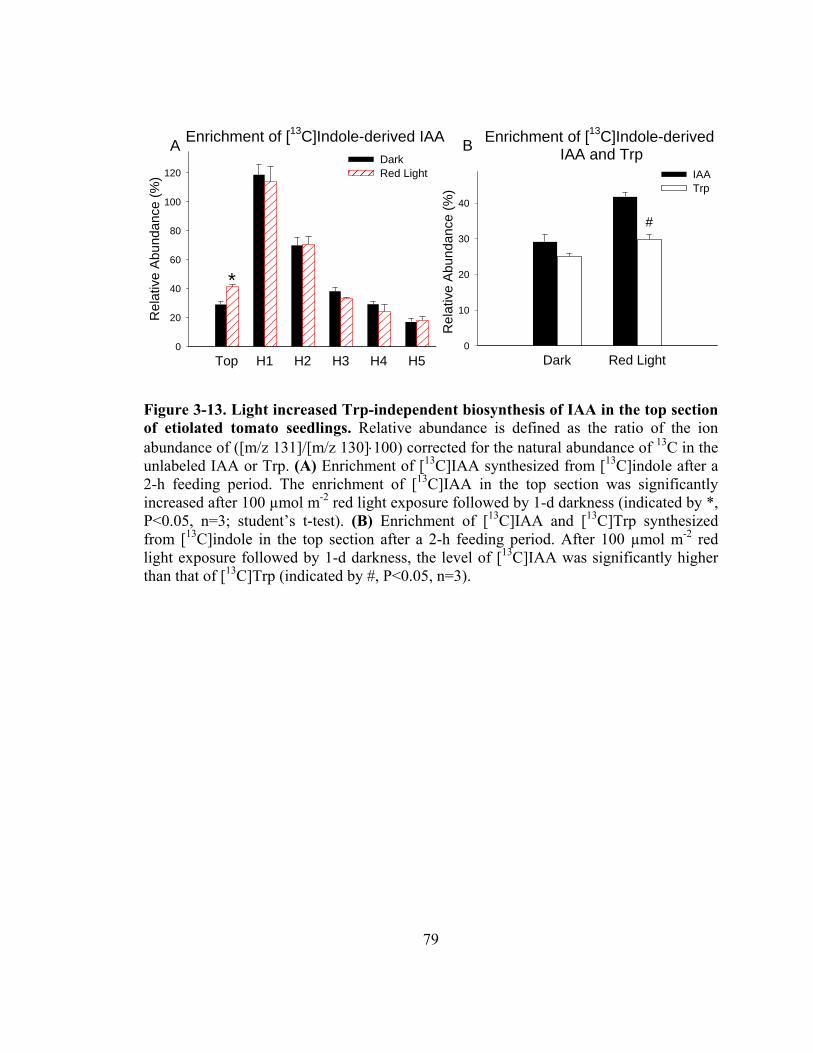
79
Enrichment of [13C]Indole-derived IAA and Trp
Dark Red Light
Rel
ativ
e A
bund
ance
(%
)
0
10
20
30
40
IAA Trp
Enrichment of [13C]Indole-derived IAA
Top H1 H2 H3 H4 H5
Re
lativ
e A
bund
ance
(%
)
0
20
40
60
80
100
120Dark Red Light
*
#
A B
Figure 3-13. Light increased Trp-independent biosynthesis of IAA in the top section of etiolated tomato seedlings. Relative abundance is defined as the ratio of the ion abundance of ([m/z 131]/[m/z 130]100) corrected for the natural abundance of 13C in the unlabeled IAA or Trp. (A) Enrichment of [13C]IAA synthesized from [13C]indole after a 2-h feeding period. The enrichment of [13C]IAA in the top section was significantly increased after 100 µmol m-2 red light exposure followed by 1-d darkness (indicated by *, P<0.05, n=3; student’s t-test). (B) Enrichment of [13C]IAA and [13C]Trp synthesized from [13C]indole in the top section after a 2-h feeding period. After 100 µmol m-2 red light exposure followed by 1-d darkness, the level of [13C]IAA was significantly higher than that of [13C]Trp (indicated by #, P<0.05, n=3).
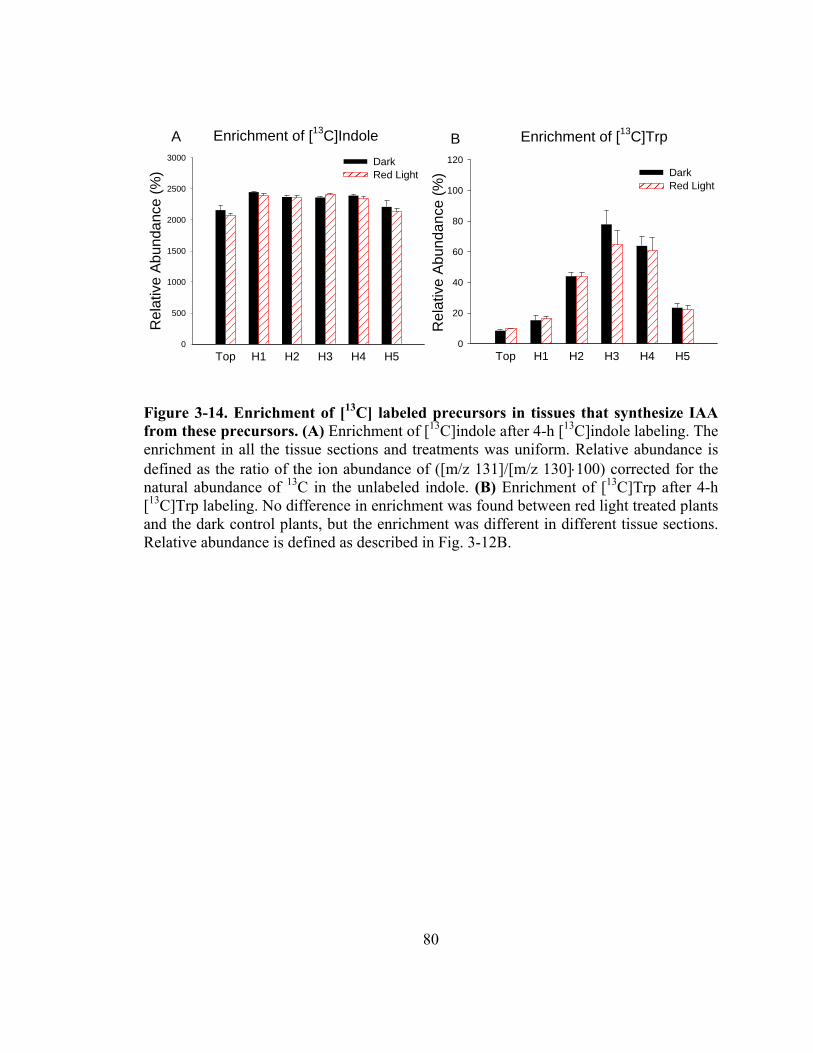
80
Enrichment of [13C]Indole
Top H1 H2 H3 H4 H5
Rel
ativ
e A
bun
danc
e (%
)
0
500
1000
1500
2000
2500
3000 Dark Red Light
Enrichment of [13C]Trp
Top H1 H2 H3 H4 H5
Rel
ativ
e A
bun
danc
e (%
)
0
20
40
60
80
100
120DarkRed Light
A B
Figure 3-14. Enrichment of [13C] labeled precursors in tissues that synthesize IAA from these precursors. (A) Enrichment of [13C]indole after 4-h [13C]indole labeling. The enrichment in all the tissue sections and treatments was uniform. Relative abundance is defined as the ratio of the ion abundance of ([m/z 131]/[m/z 130]100) corrected for the natural abundance of 13C in the unlabeled indole. (B) Enrichment of [13C]Trp after 4-h [13C]Trp labeling. No difference in enrichment was found between red light treated plants and the dark control plants, but the enrichment was different in different tissue sections. Relative abundance is defined as described in Fig. 3-12B.
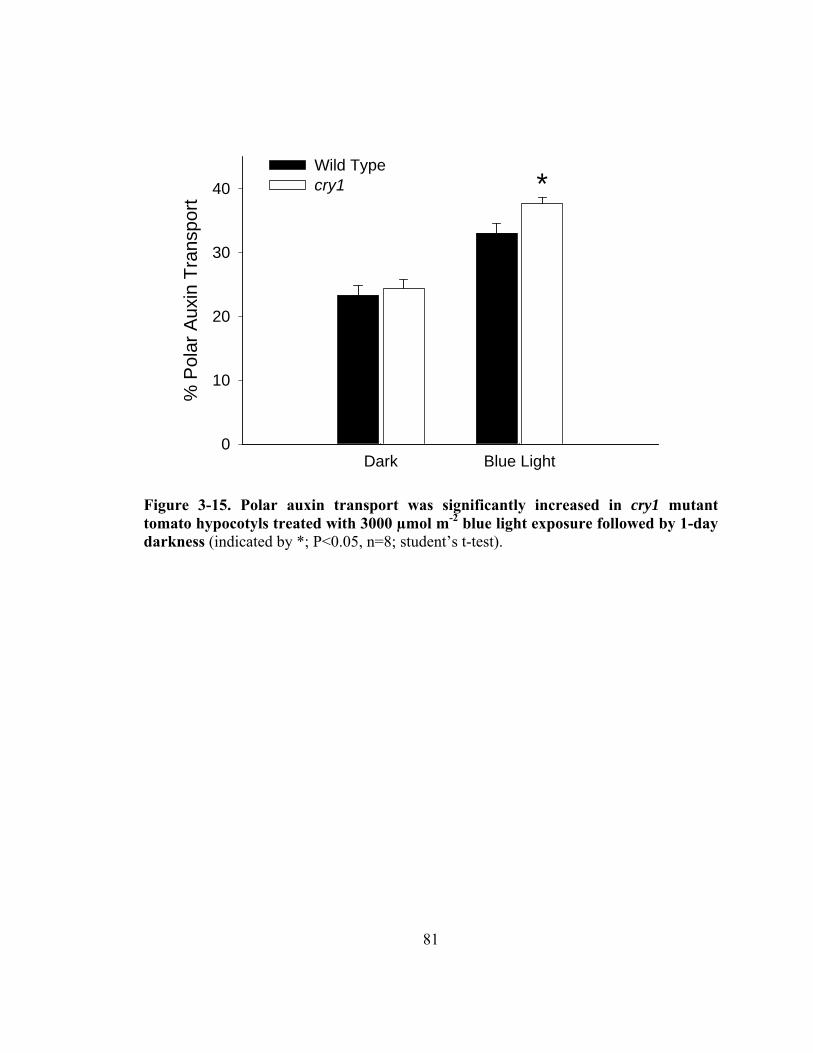
81
Dark Blue Light
% P
olar
Aux
in T
rans
port
0
10
20
30
40
Wild Type cry1 *
Figure 3-15. Polar auxin transport was significantly increased in cry1 mutant tomato hypocotyls treated with 3000 µmol m-2 blue light exposure followed by 1-day darkness (indicated by *; P<0.05, n=8; student’s t-test).

82
mol m-2) Dark 100 Red 1000 Red
Hyp
ocot
yl le
ngth
(cm
)
0
2
4
6
8
10
12
Figure 3-16. Red light exposure followed by 1-day darkness did not alter hypocotyl length. Three-day dark-grown tomato seedlings with similar hypocotyl lengths were irradiated with 100 µmol m-2 or 1000 µmol m-2 red light and returned to the dark, along with non-irradiated control plants. After one additional day in the dark, seedlings were photographed, and hypocotyl lengths were measured with the NIH image analysis program, ImageJ (http://rsb.info.nih.gov/ij/). No significant change as a result of red light exposure was observed (P>0.3, n=20; student’s t-test).
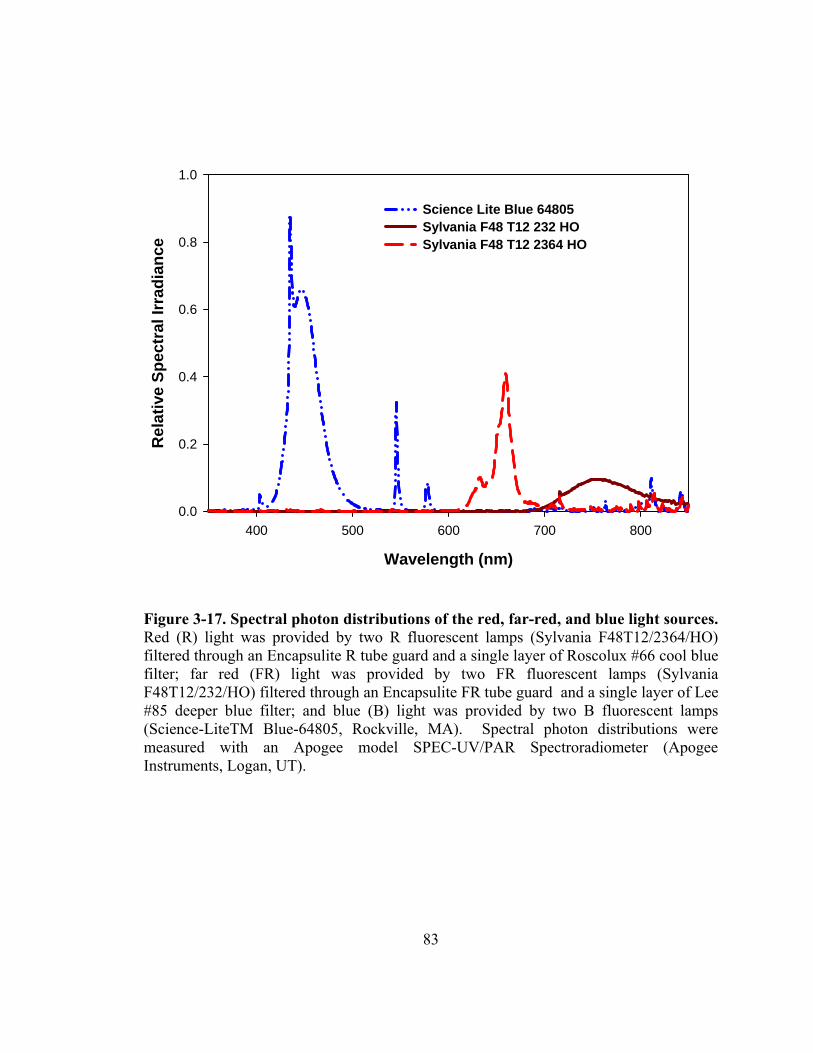
83
Wavelength (nm)
400 500 600 700 800
Rel
ativ
e S
pec
tral
Irra
dia
nce
0.0
0.2
0.4
0.6
0.8
1.0
Science Lite Blue 64805 Sylvania F48 T12 232 HO Sylvania F48 T12 2364 HO
Figure 3-17. Spectral photon distributions of the red, far-red, and blue light sources. Red (R) light was provided by two R fluorescent lamps (Sylvania F48T12/2364/HO) filtered through an Encapsulite R tube guard and a single layer of Roscolux #66 cool blue filter; far red (FR) light was provided by two FR fluorescent lamps (Sylvania F48T12/232/HO) filtered through an Encapsulite FR tube guard and a single layer of Lee #85 deeper blue filter; and blue (B) light was provided by two B fluorescent lamps (Science-LiteTM Blue-64805, Rockville, MA). Spectral photon distributions were measured with an Apogee model SPEC-UV/PAR Spectroradiometer (Apogee Instruments, Logan, UT).
84
Chapter 4
Transport of Indole-3-Butyric Acid and Indole-3-Acetic Acid in
Arabidopsis thaliana Hypocotyls Using
Stable Isotope Labeling2
Introduction
Indole-3-acetic acid (IAA), the most abundant form of the plant hormone auxin, is
critical for plant growth and development. IAA levels are regulated in plants by multiple
means, including biosynthesis of IAA through both tryptophan (Trp) dependent and Trp-
independent pathways, conjugation of IAA via ester or amide bonds that can be
hydrolyzed to release free IAA, polar transport of IAA over long distances, and
degradation of IAA (reviewed by Woodward and Bartel, 2005; Seidel et al., 2006).
Indole-3-butyric acid (IBA), which has had a long history of use as a synthetic
auxin to promote root initiation, has been identified as an endogenous compound in a
variety of plants (reviewed by Ludwig-Müller, 2000), including Arabidopsis
(Arabidopsis thaliana) (Ludwig-Müller et al., 1993). IBA can be synthesized from IAA
by a microsomal membrane preparation from maize (Zea mays L.) seedlings and by an
enzyme preparation from Arabidopsis seedlings in the presence of acetyl CoA and ATP
(Ludwig-Müller et al., 1995a; Ludwig-Müller, 2007), but no mutants defective in this
IAA-to-IBA conversion have been identified. Similar to IAA, IBA can be conjugated via
both ester and amide bonds (reviewed by Ludwig-Müller, 2000), and the major conjugate
of exogenous IBA in Arabidopsis was identified as IBA-glucose (Ludwig-Müller and
Epstein, 1993). Endogenous IBA-glucose was also found to be present in Arabidopsis at
2 This chapter has been published in Plant Physiology, 2012, Vol. 158. All the work presented here was
done by me, except that results in Figure 4-7 were generated by Dr. Lana Barkawi.
85
a high concentration, and this conjugation activity significantly affected plant
development and tolerance to environmental stress (Tognetti et al., 2010). Importantly,
IBA is converted to IAA via β-oxidation in a peroxisome-dependent manner (reviewed
by Woodward and Bartel, 2005; Strader and Bartel, 2011), and the IBA-derived IAA has
been shown to be important for organ development in Arabidopsis (Strader et al., 2010;
Strader et al., 2011).
Distinct transport streams occur in plants to transport IAA in a polar fashion. In
hypocotyls, IAA moves basipetally from the shoot apex towards the roots. The machinery
for IAA polar transport includes passive diffusion of protonated IAA, influx proteins
(AUX1/LAX) that transport IAA into the cell, and efflux proteins (PIN, ABCB/PGP) that
transport IAA out of the cell (reviewed by Peer et al., 2011). The transport of IBA over
long distances was suggested by an early study showing that IBA promotes growth of
Avena tissue distant from the application site, and the transport of IBA was found to be
lower than IAA (Went and White, 1938). A study using intact peas (Pisum sativam L.)
led to similar conclusions (Yang and Davies, 1999). The transport of IBA was also
directly measured using radioactive IBA tracers. In midrib sections of Cleopatra
mandarin (Citrus reticulate Blanco), the basipetal transport of IBA was lower than IAA
and was only about twice the acropetal transport (Epstein and Sagee, 1992). Using
Arabidopsis inflorescence stems, Ludwig-Müller et al. (1995b) reported that [3H]IBA
was taken up to a greater extent than [14C]IAA and was transported more rapidly.
However, the acropetal transport of both [3H]IBA and [14C]IAA was greater than the
basipetal transport in their system, suggesting that the measured transport was not polar
(Rashotte et al., 2003). Also using radioactive IBA and IAA, Rashotte et al. (2003)
performed a detailed study of auxin transport in different Arabidopsis tissues. They found
basipetal transport of IAA but no transport of IBA in inflorescence stems, greater
basipetal transport of IBA than IAA in hypocotyls, and both basipetal and acropetal
transport of IAA and IBA in roots. Taken together, these reports suggest that similar to
IAA, IBA can be transported over long distances in some plant tissues. However,
knowing that IBA is converted to IAA (Strader et al., 2010) and that detecting
86
radioactivity alone in plant tissues cannot distinguish [3H]IBA from its metabolites (Fig.
4-1), it is possible that the transported compound was a metabolite of [3H]IBA, such as
[3H]IAA. Consistent with this hypothesis, using HPLC to distinguish [3H]IBA from
[3H]IAA, Ruzicka et al. (2010) found that after [3H]IBA was applied to Arabidopsis root
columella cells, most of the [3H]IBA was converted to [3H]IAA when the radioactivity
reached the region up to 4 mm above the root tip, which suggests that only IAA derived
from IBA can be transported to areas distant from the IBA application site. To better
distinguish IBA and IAA derived from IBA, I decided to use gas chromatography (GC)-
mass spectrometry (MS) to analyze the transported compounds after application of
stable-isotope labeled IBA, where both IAA and IBA from the same plant sample can be
measured simultaneously (Sutter and Cohen, 1992; Barkawi et al., 2008). In preliminary
studies (Fig. 4-7), my colleague Dr. Lana Barkawi found that when [13C8,15N1]IBA was
applied to maize coleoptile sections, a significant portion of the stable-labeled
compounds detected in the agar receiver block was [13C8,15N1]IAA derived from
[13C8,15N1]IBA, and NPA inhibited the movement of [13C8,
15N1]IAA into the receiver.
She also found that a very small amount of [13C8,15N1]IBA moved basipetally in a polar
fashion, but this movement was not inhibited by NPA. These results suggest that by using
specific labeled compounds and GC-MS analysis, the movement and metabolic changes
of the labeled compounds can be accurately measured.
To evaluate the role of IBA-to-IAA conversion and IBA metabolism in the
transport of IBA in Arabidopsis hypocotyls, I applied [13C1]IBA instead of radioactive
tracers in my established system for polar auxin transport measurement in Arabidopsis
hypocotyls (Liu et al., 2011, see also Chapter 3), and I quantified the transported
compounds by GC-MS/MS, using [13C8,15N1]IBA and [2H4]IAA as internal standards. As
a comparison, I used the same approach and quantified the transport of [13C6]IAA in
Arabidopsis hypocotyls. I found that a significant portion of [13C6]IAA taken up by
Arabidopsis hypocotyls moved basipetally and the majority of the transported [13C6]IAA
remained as free [13C6]IAA. In contrast, a large portion of [13C1]IBA was converted to
[13C1]IAA and ester-linked [13C1]IBA during the transport period, and the proportion of
87
the applied [13C1]IBA transported basipetally was much lower than the proportion of
applied [13C6]IAA transported basipetally, suggesting that long distance transport of IBA
has a much smaller effect on IBA pools than transport of IAA has on IAA pools.
Materials and Methods
Plant Materials and Growth Conditions
Wild-type Arabidopsis (Arabidopsis thaliana) and ibr 1 ibr 3 ibr 10 seeds were a
gift from Dr. Bonnie Bartel (Rice University, TX), and nakr1 seeds were from Dr. John
Ward (University of Minnesota). All experiments were performed with ecotype
Columbia. Seeds were imbibed in distilled water for a few hours, surface sterilized in 2.0-
mL microcentrifuge tubes with 1 mL 70% ethanol for 2 min followed by 1 mL 30%
commercial bleach (to yield 2% sodium hypochlorite) for 5 min, and washed with sterile
water five times. Seeds were sown onto MS medium (4.33 g/L Murashige and Skoog
salts, MSP01-50LT; Caisson Labs, North Logan, UT), 0.8% (w/v) Phytoblend agar
(PTP01-500GM; Caisson Labs), 1.5% (w/v) sucrose (Sigma-Aldrich, Inc., St. Louis,
MO), pH 5.7. After seeding, agar plates were wrapped with Parafilm (Pechiney Plastic
Packaging, Menasha, WI) and kept at 4°C for three days, and seedlings were grown
vertically on the plates at room temperature (22°C) under 5 μmol m-2 (photosynthetically
active radiation) continuous cool white fluorescent light for five days before the
measurement of auxin transport. These growth conditions were similar to those described
in Rashotte et al. (2003).
Synthesis of Stable Isotope Labeled IBA
Synthesis of [13C8,15N1]IBA was as described in Chapter 2. The same synthesis
and purification methods were used to synthesize [13C1]IBA, using [2-13C]indole (CLM-
1863; Cambridge Isotope Laboratories) as the starting material for synthesis. The
concentration of the [13C1]IBA product was determined by UV absorbance at 282 nm (ε =
6,060) and confirmed by reverse-isotope dilution selected ion monitoring GC-MS with an
unlabeled IBA standard.
88
Hypocotyl Auxin Transport Assays
The hypocotyl basipetal IAA transport assay was modified from that described in
Chapter 3. Six mm of an Arabidopsis hypocotyl section harvested directly below the
shoot apex was placed on an agar plate after excision, and an auxin donor block of 1.5%
agar (Sigma-Aldrich, Inc.) containing 0.2 M 2-(N-morpholine)-ethanesulfonic acid
(MES; Sigma-Aldrich, Inc.) and 10-5 M [13C6]IAA (CLM-1896; Cambridge Isotope
Laboratories) or 10-5 M [13C1]IBA was placed in contact with the apical end of the tissue
section, while a receiver agar block containing 0.2 M MES (pH 6.5) was placed in
contact with the basal end. Receiver blocks containing 0.2 M MES (pH 6.5) and 10 μM
NPA (ChemService, Inc., West Chester, PA) were used as the +NPA control, and a
second control was used in which the orientation of the tissue section was inverted
(acropetal control). Two strips of polyethylene film (Saran™ Original, S.C. Johnson &
Sons, Inc., Racine, WI) were placed between the agar blocks and the support agar on the
plates to avoid diffusion of stable-labeled auxin through the support agar and thus prevent
an undesirable increase in background. The agar plates were placed vertically with donor
blocks down for 5 h in a chamber with high humidity provided by moist filter paper, and
each of the hypocotyl sections was then divided into apical and basal halves. When
[13C6]IAA was added in the donor blocks, five replicates of basal half hypocotyl sections
and receiver blocks were pooled into one microcentrifuge tube, and the corresponding
apical half hypocotyl sections were pooled into another microcentrifuge tube. Samples
were collected in a similar way when [13C1]IBA was added in the donor blocks, but 20
replicates of hypocotyl sections were pooled into one microcentrifuge tube. The samples
were frozen in liquid nitrogen quickly after collection and stored in a -80 °C freezer
before quantification of free stable-labeled auxins. When conjugated stable-labeled
auxins were quantified, sample sizes were doubled and twice the number of tissue
sections were pooled into one sample.
89
Quantification of Free Stable Isotope Labeled IAA and IBA
The quantification methods were modified from methods described in Chapter 2
and Chapter 3. For samples that were treated with [13C6]IAA in the donor block, 20 μL
homogenization buffer (35% 0.2 M imidazole, 65% isopropanol, pH 7) containing 0.2 ng
of [2H4]IAA (a gift from Prof. R.S. Bandurski; Magnus et al., 1980) and 0.2 ng of
[13C8,15N1]IBA was added; for samples that were treated with [13C1]IBA, 40 μL
homogenization buffer containing 0.2 ng of [2H4]IAA and 0.2 ng of [13C8,15N1]IBA was
added. Tissues were homogenized using a Mixer Mill (MM 300; Qiagen, Valencia, CA)
with tungsten carbide beads (3 mm beads for 1.5-mL tubes, and 2.3 mm beads for 0.5-mL
tubes; Craig Ball Sales, Seaford, DE). After 1 hr on ice, the homogenate was diluted ten
times by adding water and then centrifuged at 10,000 g for 10 min. The supernatant was
passed through a 200 μL TopTips (TT2EMT.96; Glygen Corp) solid phase extraction
(SPE) column containing 5 mg NH2 anion exchange resin (12213020, Varian) and then
washed by a series of solvents and solutions essentially the same as that described in
Chapter 2. To reduce the loss of IBA during extraction, IAA and IBA were both eluted
from the NH2 SPE tip by 3 x 80 μL 0.25% phosphoric acid (A242; Fisher Chemicals),
and the eluate was partitioned against 100 μL ethyl acetate (E195-4; Fisher Chemicals).
The ethyl acetate layer was collected and transferred to a 250-μL glass insert (CTI-9425;
ChromTech), and the sample was methylated in the insert by adding ethereal
diazomethane in the presence of 10% methanol (34860; Sigma-Aldrich) and waiting 5
min, and then the solvents were evaporated under a stream of N2 gas and the sample was
redissolved in 15 μL ethyl acetate. The methylated IAA and IBA were analyzed using gas
chromatography-selected reaction monitoring-mass spectrometry (GC-SRM-MS) on a
Thermo Trace GC Ultra coupled to a TSQ Vantage triple quadrupole MS system
(Thermo Scientific, San Jose, CA) under conditions described in Chapter 2 and Chapter
3. The quinolinium ions produced from the molecular ions of IAA (Fig. 4-2B) (m/z 130
from m/z 189, m/z 131 from m/z 190, m/z 134 from m/z 193, and m/z 136 from m/z 195)
were selected by the third quadrupole and monitored for the first 10.5 min of the
chromatographic run. The quinolinium ions produced from the molecular ions of IBA
90
(Fig. 4-2C) (m/z 130 from m/z 217, m/z 131 from m/z 218, m/z 136 from m/z 223, and
m/z 139 from m/z 226) were selected and monitored starting at 10.5 min until the end of
the run. Levels of [13C6]IAA or [13C1]IAA derived from [13C1]IBA were quantified by
isotope dilution analysis based on the [2H4]IAA internal standard; levels of [13C1]IBA
were quantified by isotope dilution analysis based on the [13C8,15N1]IBA internal
standard. The natural abundance of [13C] was determined using unlabeled chemical
standards (Sigma) and is corrected for in the calculations and the data reported.
Quantification of [13C6] IAA and [13C1]IBA in Donor Agar Blocks
Donor agar blocks containing 10-5 M [13C6]IAA and 10-5 M [13C1]IBA were
placed on top of the apical end of Arabidopsis hypocotyl sections as described above.
The agar blocks were collected into microcentrifuge tubes after 0-h and 5-h transport
periods, and the tubes were weighed and quickly frozen in liquid N2. The agar blocks
were homogenized using the Mixer Mill as described above, after adding 400 μL of
methanol containing 10 μL each of 10-5 M IAA and 10-5 M [13C8,15N1]IBA as the internal
standards. After 1-h incubation on ice, 100 μL of supernatant from the homogenate was
transferred into a 2-ml glass vial and was methylated by ethereal diazomethane. The
methylated samples were dried under a stream of N2 gas, re-suspended in 20 μL of ethyl
acetate, and analyzed by GC-MS. The amounts of [13C6]IAA and [13C1]IBA present per
mg of the donor agar block were calculated based on the internal standards and the
weight of the agar block. Finally, the percent of [13C6]IAA and [13C1]IBA remaining in
the 5-h samples (divided by the initial 0-h time point) was determined.
Quantification of Ester-linked and Amide-linked [13C6] IAA and [13C1]IBA
For samples that were treated with [13C6]IAA in the donor block, 40 μL
homogenization buffer containing 0.6 ng of [2H4]IAA and 0.6 ng of [13C8,15N1]IBA was
added. After homogenization and 1 hr on ice as described above, 20 μL of the
homogenate was used for quantification of free [13C6]IAA in the same way as that
described above. Of the remainder of the homogenate, 15 μL was hydrolyzed in 1 N

91
NaOH (1 hr, room temperature) for measurement of free plus ester-linked [13C6]IAA, and
10 μL was hydrolyzed in 7 N NaOH (3 h, 100°C under N2) for measurement of total
[13C6]IAA (free plus ester-linked and amide-linked [13C6]IAA). Extraction and
methylation of free IAA plus that released from the conjugates were the same as
described in Chapter 3, and the method for GC-SRM-MS analysis was the same as
described above. Levels of free [13C6]IAA, free plus ester-linked [13C6]IAA, and total
[13C6]IAA were quantified by isotope dilution analysis based on the [2H4]IAA internal
standard, as described above. The results were displayed as pg IAA eq. since the
chemical structures of every conjugate formed are not known.
For samples that were treated with [13C1]IBA in the donor block, 80 μL
homogenization buffer containing 0.6 ng of [2H4]IAA and 0.6 ng of [13C8,15N1]IBA was
added, and the homogenate was divided into three parts: 40 μL was used for quantitation
of free [13C1]IBA and [13C1]IAA derived from the [13C1]IBA; 30 μL was used for
measurement of free plus ester-linked [13C1]IBA; and 10 μL was used for measurement of
total [13C1]IBA. Hydrolysis, extraction, methylation, GC-SRM-MS analysis, and
quantification of free and conjugated [13C1]IBA were the same as described above.
Results
Absolute Quantification of Auxin Transport using Stable Isotope Labeled Tracers
I previously established a sensitive [3H]IAA transport assay with low background
noise to measure the transport of IAA in Arabidopsis hypocotyls (Liu et al., 2011, see
also Chapter 3). To achieve better compound identification, isotope analysis, and the
quantification of transported IAA and IBA, I modified the assay and changed from a
radioactive auxin tracer to a stable isotope system using either [13C6]IAA or [13C1]IBA
(Fig. 4-2A). In order to recover a sufficient quantity of transported [13C6]IAA and
[13C1]IBA for GC-MS/MS analysis, I applied stable-labeled auxin in the donor agar block
at 10-5 M, a concentration that was reported to yield maximal basipetal auxin transport
(Rashotte et al., 2003). After a five-hour transport period, auxins were determined in
pools of lower hypocotyl sections and receivers. Five plants were needed for facile
92
detection of [13C6]IAA, while 20 plants were needed for detection of [13C1]IBA and
[13C1]IAA derived from [13C1]IBA. As shown in Figure 4-2B, when [13C6]IAA was added
in the donor agar block, unlabeled endogenous IAA, [13C6]IAA tracer, and the [2H4]IAA
internal standard were detected separately, thus the [13C6]IAA tracer could be
distinguished from endogenous IAA, and the amount of [13C6]IAA could be quantified
based on the [2H4]IAA internal standard. Potential [13C6]IBA derived from [13C6]IAA was
also monitored but was not detected, which may be due to a low rate of conversion of
[13C6]IBA that may require more tissue for detection. Similarly, when [13C1]IBA was
added in the donor agar block (Fig. 4-2C), both IAA and IBA were monitored, and their
retention times on GC were about 1 min apart. Therefore, unlabeled endogenous IBA and
IAA, [13C1]IBA tracer and its metabolic product [13C1]IAA, and [13C8,15N1]IBA and
[2H4]IAA internal standards were all detected separately, and the amount of [13C1]IBA
and [13C1]IAA could be quantified based on the internal standards. Clearly, using stable
isotope labeled auxins and GC-MS/MS, I are able to quantify the absolute amount of both
endogenous and applied IAA and IBA transported.
Transport of Free [13C6]IAA and [13C1]IBA in Arabidopsis Hypocotyls
When [13C6]IAA was supplied in donor agar blocks and incubated with
Arabidopsis hypocotyl sections for 5 h, 42 pg [13C6]IAA was detected per upper section
(Fig. 4-3A), and 17 pg [13C6]IAA was detected per lower section and receiver (Fig. 4-
3B). Therefore, about 29%3 of the [13C6]IAA in the hypocotyl section was transported
basipetally to the lower section and receiver (Fig 4-3C). When 10 µM of the auxin
transport inhibitor N-1-naphthylphthalamic acid (NPA) was added in the receiver block,
the level of [13C6]IAA per lower section and receiver was reduced to 1 pg without a
concomitant reduction in the level of [13C6]IAA per upper section (Fig. 4-3,A and B).
3 The percent transport is defined for [13C6]IAA as the amount of free auxin in the lower section and
receiver (17 pg, Fig. 3B) divided by the sum of free auxin in upper + lower sections and the receiver (59 pg)
and, similarly, for [13C1]IBA, 0.26 pg in the lower section and receiver divided by 42.26 pg in upper +
lower sections and the receiver.
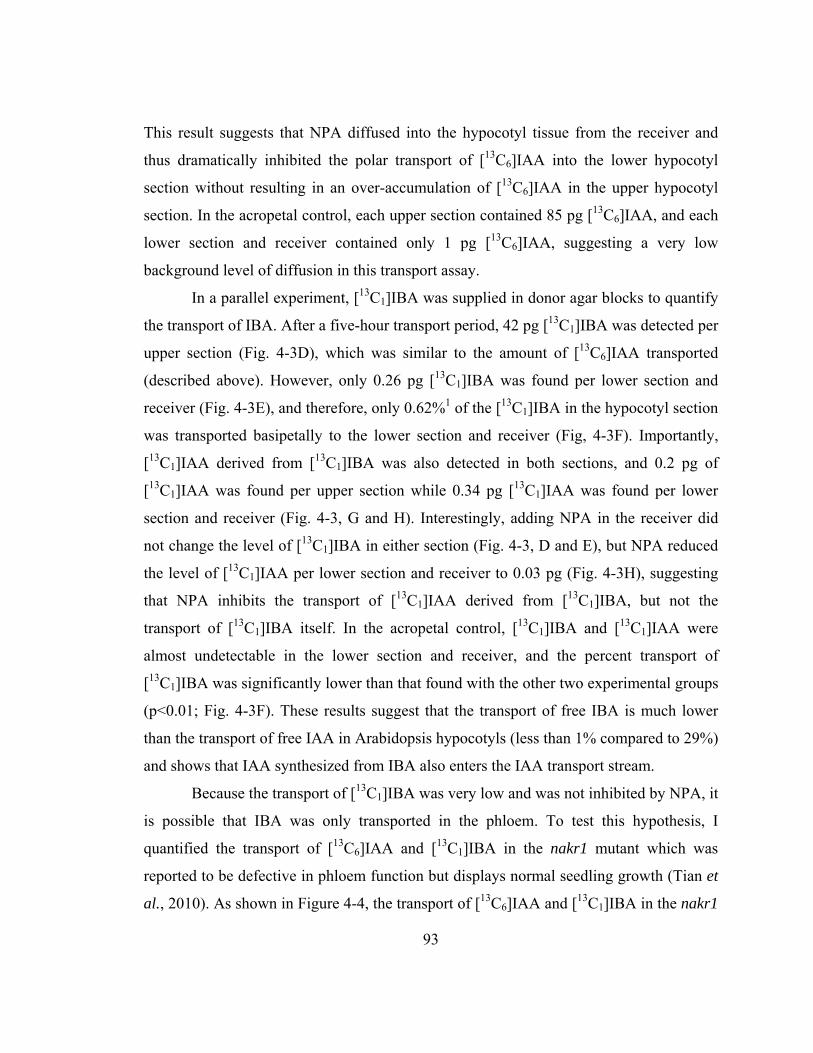
93
This result suggests that NPA diffused into the hypocotyl tissue from the receiver and
thus dramatically inhibited the polar transport of [13C6]IAA into the lower hypocotyl
section without resulting in an over-accumulation of [13C6]IAA in the upper hypocotyl
section. In the acropetal control, each upper section contained 85 pg [13C6]IAA, and each
lower section and receiver contained only 1 pg [13C6]IAA, suggesting a very low
background level of diffusion in this transport assay.
In a parallel experiment, [13C1]IBA was supplied in donor agar blocks to quantify
the transport of IBA. After a five-hour transport period, 42 pg [13C1]IBA was detected per
upper section (Fig. 4-3D), which was similar to the amount of [13C6]IAA transported
(described above). However, only 0.26 pg [13C1]IBA was found per lower section and
receiver (Fig. 4-3E), and therefore, only 0.62%1 of the [13C1]IBA in the hypocotyl section
was transported basipetally to the lower section and receiver (Fig, 4-3F). Importantly,
[13C1]IAA derived from [13C1]IBA was also detected in both sections, and 0.2 pg of
[13C1]IAA was found per upper section while 0.34 pg [13C1]IAA was found per lower
section and receiver (Fig. 4-3, G and H). Interestingly, adding NPA in the receiver did
not change the level of [13C1]IBA in either section (Fig. 4-3, D and E), but NPA reduced
the level of [13C1]IAA per lower section and receiver to 0.03 pg (Fig. 4-3H), suggesting
that NPA inhibits the transport of [13C1]IAA derived from [13C1]IBA, but not the
transport of [13C1]IBA itself. In the acropetal control, [13C1]IBA and [13C1]IAA were
almost undetectable in the lower section and receiver, and the percent transport of
[13C1]IBA was significantly lower than that found with the other two experimental groups
(p<0.01; Fig. 4-3F). These results suggest that the transport of free IBA is much lower
than the transport of free IAA in Arabidopsis hypocotyls (less than 1% compared to 29%)
and shows that IAA synthesized from IBA also enters the IAA transport stream.
Because the transport of [13C1]IBA was very low and was not inhibited by NPA, it
is possible that IBA was only transported in the phloem. To test this hypothesis, I
quantified the transport of [13C6]IAA and [13C1]IBA in the nakr1 mutant which was
reported to be defective in phloem function but displays normal seedling growth (Tian et
al., 2010). As shown in Figure 4-4, the transport of [13C6]IAA and [13C1]IBA in the nakr1
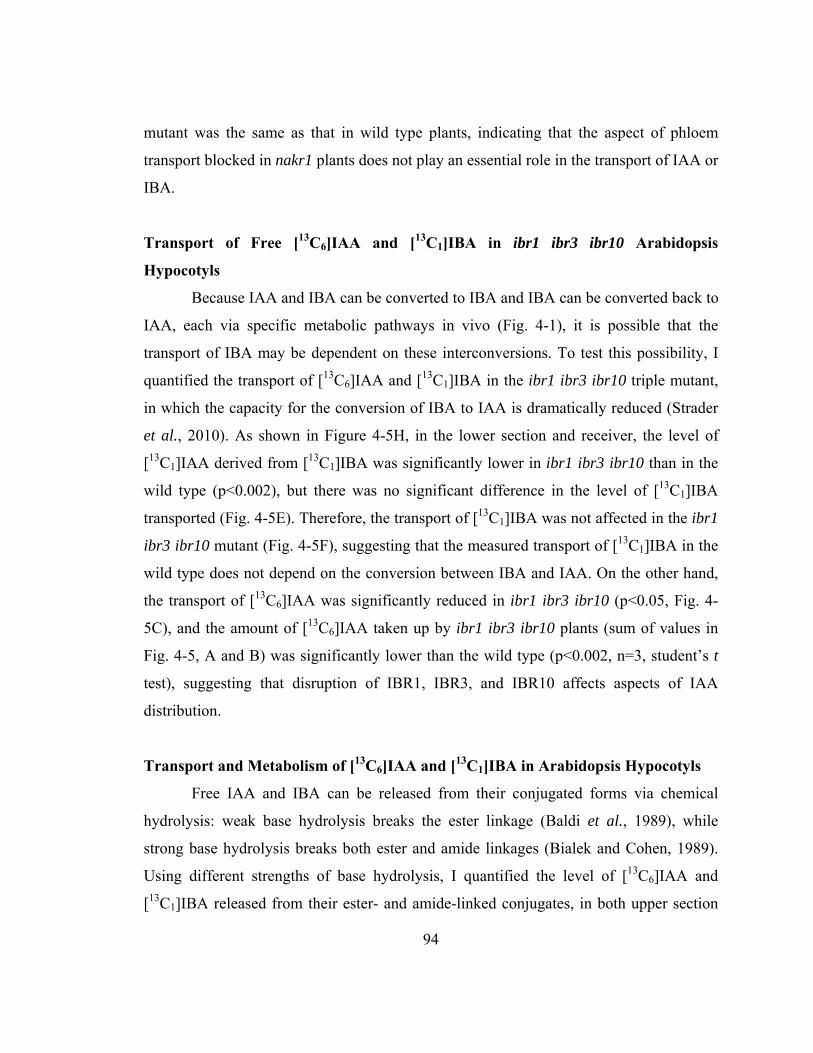
94
mutant was the same as that in wild type plants, indicating that the aspect of phloem
transport blocked in nakr1 plants does not play an essential role in the transport of IAA or
IBA.
Transport of Free [13C6]IAA and [13C1]IBA in ibr1 ibr3 ibr10 Arabidopsis
Hypocotyls
Because IAA and IBA can be converted to IBA and IBA can be converted back to
IAA, each via specific metabolic pathways in vivo (Fig. 4-1), it is possible that the
transport of IBA may be dependent on these interconversions. To test this possibility, I
quantified the transport of [13C6]IAA and [13C1]IBA in the ibr1 ibr3 ibr10 triple mutant,
in which the capacity for the conversion of IBA to IAA is dramatically reduced (Strader
et al., 2010). As shown in Figure 4-5H, in the lower section and receiver, the level of
[13C1]IAA derived from [13C1]IBA was significantly lower in ibr1 ibr3 ibr10 than in the
wild type (p<0.002), but there was no significant difference in the level of [13C1]IBA
transported (Fig. 4-5E). Therefore, the transport of [13C1]IBA was not affected in the ibr1
ibr3 ibr10 mutant (Fig. 4-5F), suggesting that the measured transport of [13C1]IBA in the
wild type does not depend on the conversion between IBA and IAA. On the other hand,
the transport of [13C6]IAA was significantly reduced in ibr1 ibr3 ibr10 (p<0.05, Fig. 4-
5C), and the amount of [13C6]IAA taken up by ibr1 ibr3 ibr10 plants (sum of values in
Fig. 4-5, A and B) was significantly lower than the wild type (p<0.002, n=3, student’s t
test), suggesting that disruption of IBR1, IBR3, and IBR10 affects aspects of IAA
distribution.
Transport and Metabolism of [13C6]IAA and [13C1]IBA in Arabidopsis Hypocotyls
Free IAA and IBA can be released from their conjugated forms via chemical
hydrolysis: weak base hydrolysis breaks the ester linkage (Baldi et al., 1989), while
strong base hydrolysis breaks both ester and amide linkages (Bialek and Cohen, 1989).
Using different strengths of base hydrolysis, I quantified the level of [13C6]IAA and
[13C1]IBA released from their ester- and amide-linked conjugates, in both upper section
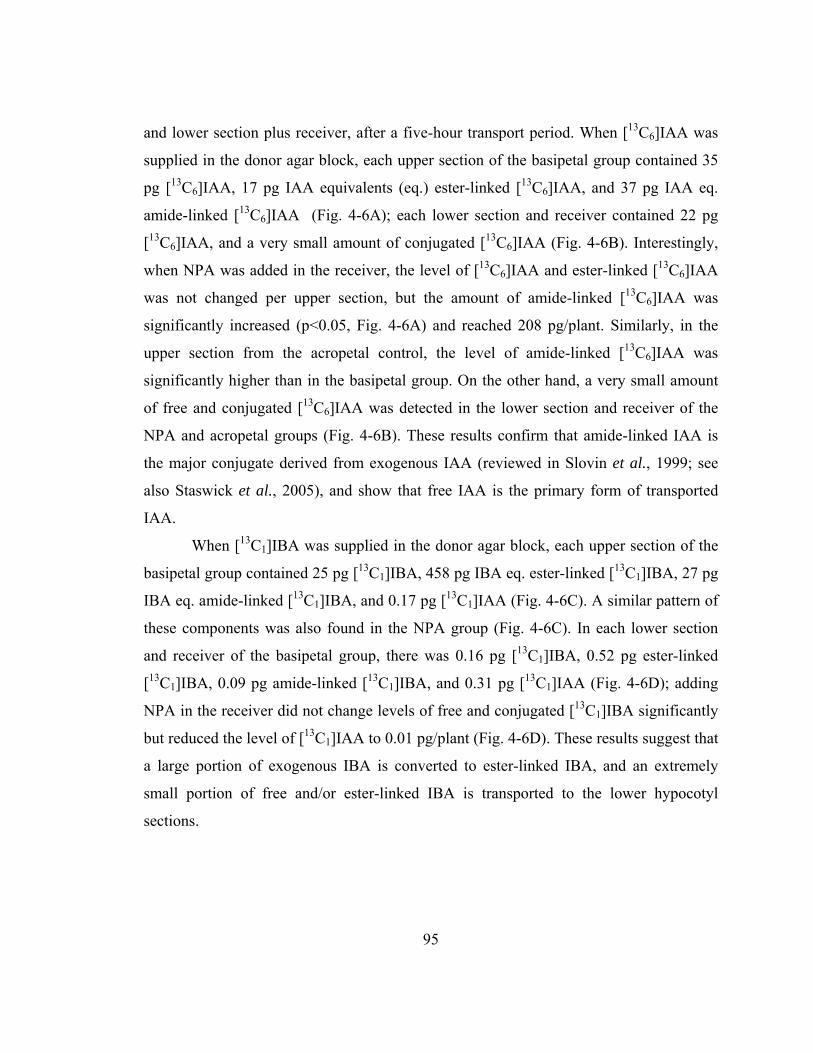
95
and lower section plus receiver, after a five-hour transport period. When [13C6]IAA was
supplied in the donor agar block, each upper section of the basipetal group contained 35
pg [13C6]IAA, 17 pg IAA equivalents (eq.) ester-linked [13C6]IAA, and 37 pg IAA eq.
amide-linked [13C6]IAA (Fig. 4-6A); each lower section and receiver contained 22 pg
[13C6]IAA, and a very small amount of conjugated [13C6]IAA (Fig. 4-6B). Interestingly,
when NPA was added in the receiver, the level of [13C6]IAA and ester-linked [13C6]IAA
was not changed per upper section, but the amount of amide-linked [13C6]IAA was
significantly increased (p<0.05, Fig. 4-6A) and reached 208 pg/plant. Similarly, in the
upper section from the acropetal control, the level of amide-linked [13C6]IAA was
significantly higher than in the basipetal group. On the other hand, a very small amount
of free and conjugated [13C6]IAA was detected in the lower section and receiver of the
NPA and acropetal groups (Fig. 4-6B). These results confirm that amide-linked IAA is
the major conjugate derived from exogenous IAA (reviewed in Slovin et al., 1999; see
also Staswick et al., 2005), and show that free IAA is the primary form of transported
IAA.
When [13C1]IBA was supplied in the donor agar block, each upper section of the
basipetal group contained 25 pg [13C1]IBA, 458 pg IBA eq. ester-linked [13C1]IBA, 27 pg
IBA eq. amide-linked [13C1]IBA, and 0.17 pg [13C1]IAA (Fig. 4-6C). A similar pattern of
these components was also found in the NPA group (Fig. 4-6C). In each lower section
and receiver of the basipetal group, there was 0.16 pg [13C1]IBA, 0.52 pg ester-linked
[13C1]IBA, 0.09 pg amide-linked [13C1]IBA, and 0.31 pg [13C1]IAA (Fig. 4-6D); adding
NPA in the receiver did not change levels of free and conjugated [13C1]IBA significantly
but reduced the level of [13C1]IAA to 0.01 pg/plant (Fig. 4-6D). These results suggest that
a large portion of exogenous IBA is converted to ester-linked IBA, and an extremely
small portion of free and/or ester-linked IBA is transported to the lower hypocotyl
sections.
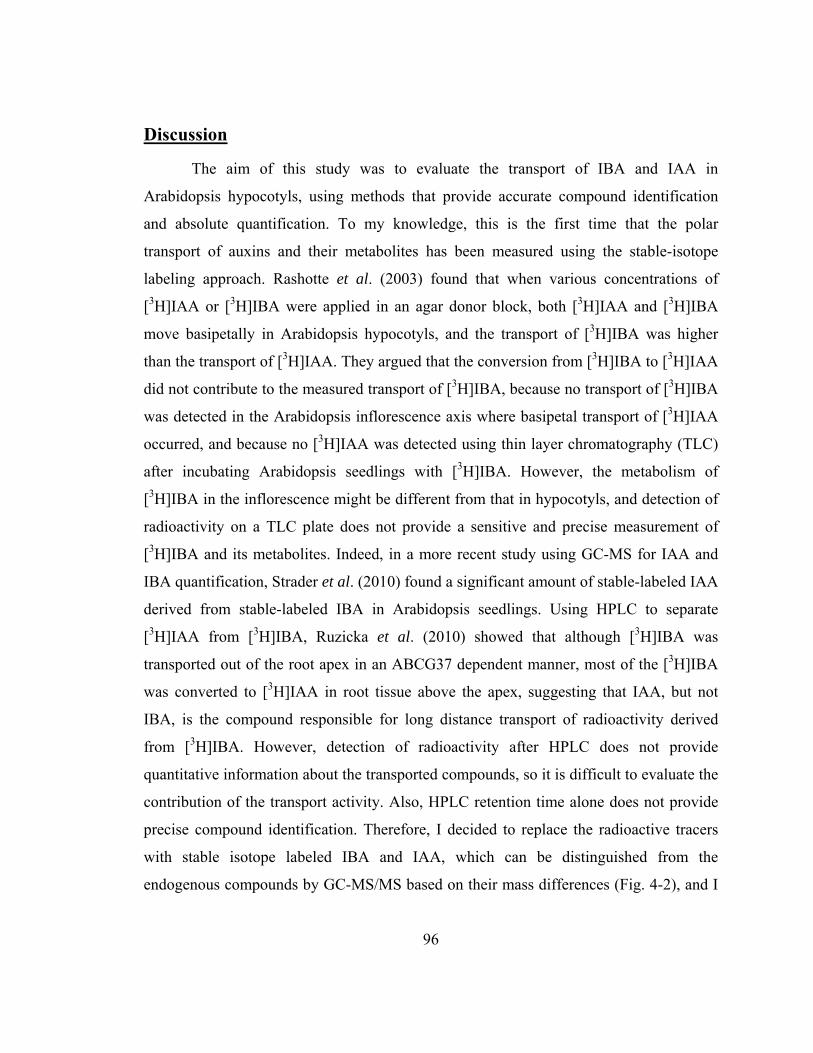
96
Discussion
The aim of this study was to evaluate the transport of IBA and IAA in
Arabidopsis hypocotyls, using methods that provide accurate compound identification
and absolute quantification. To my knowledge, this is the first time that the polar
transport of auxins and their metabolites has been measured using the stable-isotope
labeling approach. Rashotte et al. (2003) found that when various concentrations of
[3H]IAA or [3H]IBA were applied in an agar donor block, both [3H]IAA and [3H]IBA
move basipetally in Arabidopsis hypocotyls, and the transport of [3H]IBA was higher
than the transport of [3H]IAA. They argued that the conversion from [3H]IBA to [3H]IAA
did not contribute to the measured transport of [3H]IBA, because no transport of [3H]IBA
was detected in the Arabidopsis inflorescence axis where basipetal transport of [3H]IAA
occurred, and because no [3H]IAA was detected using thin layer chromatography (TLC)
after incubating Arabidopsis seedlings with [3H]IBA. However, the metabolism of
[3H]IBA in the inflorescence might be different from that in hypocotyls, and detection of
radioactivity on a TLC plate does not provide a sensitive and precise measurement of
[3H]IBA and its metabolites. Indeed, in a more recent study using GC-MS for IAA and
IBA quantification, Strader et al. (2010) found a significant amount of stable-labeled IAA
derived from stable-labeled IBA in Arabidopsis seedlings. Using HPLC to separate
[3H]IAA from [3H]IBA, Ruzicka et al. (2010) showed that although [3H]IBA was
transported out of the root apex in an ABCG37 dependent manner, most of the [3H]IBA
was converted to [3H]IAA in root tissue above the apex, suggesting that IAA, but not
IBA, is the compound responsible for long distance transport of radioactivity derived
from [3H]IBA. However, detection of radioactivity after HPLC does not provide
quantitative information about the transported compounds, so it is difficult to evaluate the
contribution of the transport activity. Also, HPLC retention time alone does not provide
precise compound identification. Therefore, I decided to replace the radioactive tracers
with stable isotope labeled IBA and IAA, which can be distinguished from the
endogenous compounds by GC-MS/MS based on their mass differences (Fig. 4-2), and I

97
can quantify the amount of transported compounds using differently labeled internal
standards and the isotope dilution technique.
Rashotte et al. (2003) found that when concentrations of IAA and IBA in the
donor agar block were increased from 10-7 M to 2 x 10⁻⁵ M, the transport of [3H]IAA and
[3H]IBA in Arabidopsis hypocotyls was also increased and saturated at high
concentrations. Because sufficient amounts of transported [13C6]IAA and [13C1]IBA are
required for GC-MS analysis but high concentrations of auxin can significantly induce
auxin conjugation activities (Sudi, 1966; Li et al., 1999), I applied 10-5 M [13C6]IAA or
[13C1]IBA in the donor agar block, a concentration that does not seem to increase auxin
conjugation dramatically during a short period of treatment (Sudi, 1966; Venis, 1972) and
also yielded detectable amounts of labeled auxins from pooled hypocotyl sections (the
amount of transported [13C1]IBA from 20 hypocotyl sections was just above the detection
limit). Using Arabidopsis seedlings grown under conditions similar to those used by
Rashotte et al. (2003), I found that a significant portion (29%) of the free [13C6]IAA in
the hypocotyl sections was transported basipetally, and this basipetal transport was
dramatically inhibited by NPA (Fig. 4-3, A, B and C). This is consistent with results from
assays using [3H]IAA tracers previously described (Liu et al., 2011, see also Chapter 3),
and it confirms that transport of IAA plays an important role in regulating levels of free
IAA. In contrast, very little (0.26 pg/plant, less than 1%) free [13C1]IBA was transported,
and the amount of transported [13C1]IBA was dramatically lower than the [13C6]IAA (Fig.
4-3, D, E and F). This result does not agree with the previous findings where [3H]IBA
was used (Rashotte et al., 2003), suggesting that a large portion of the transported
radioactivity in hypocotyls was not [3H]IBA. Interestingly, similar to Rashotte et al.
(2003), the transport of [13C1]IBA was not inhibited by NPA (Fig. 4-3E). Because NPA is
an auxin-efflux inhibitor (Thomson et al., 1973; Goldsmith, 1982), this result suggests
that IBA is not transported by the same efflux proteins that transport IAA. This
conclusion is consistent with Ruzicka et al. (2010), which illustrated that the
heterologously expressed IAA efflux proteins (PINs and ABCBs) did not use IBA as
their substrates, and the heterologously expressed ABCG37 protein displayed substrate
98
specificity for IBA but not IAA. On the other hand, Rashotte et al. (2003) showed that
the transport of [3H]IBA was not reduced in Arabidopsis aux1 mutant roots, and both
Yang et al. (2006) and Swarup et al. (2008) showed that 20 µM IBA did not
competitively inhibit the uptake of 0.1 µM [3H]IAA by heterologously expressed AUX1
protein, suggesting that the transport influx protein AUX1 recognizes only IAA but not
IBA. Swarup et al. (2008) also showed that 20 µM IBA reduced the uptake of 0.1 µM
[3H]IAA by heterologously expressed LAX3 protein, but not as effectively as 20 µM
IAA, suggesting that IBA may be a substrate for IAA influx protein LAX3, with a lower
affinity than IAA. However, considering that the endogenous level of free IBA is
dramatically lower than free IAA (Tognetti et al., 2010), it is not likely that IBA can be
transported by LAX3 under physiological conditions. Taken together, my results and
previous reports support the conclusion that the mechanisms of IAA and IBA transport
are partially, if not completely, distinct.
It is difficult to distinguish the low percentage of [13C1]IBA transported from
diffusion or phloem transport. Even though I found that [13C1]IBA transport was not
altered in the nakr1 mutant (Fig. 4-4), which is defective in some aspects of long-distance
phloem transport (Tian et al., 2010), this does not exclude the possibility that [13C1]IBA
transport might be reduced in mutants that have defects in other aspects of phloem
transport. The Arabidopsis suc2 mutant, defective in loading sucrose into the phloem,
could be a candidate for such a test, however the mutant seedlings are severely dwarfed
(Srivastava et al., 2008; Gottwald et al., 2000) and are thus not easily applicable for use
in the hypocotyl transport assay (Dr. John Ward, personal communication). Nevertheless,
it would be useful to measure IBA transport in mutants that are defective in long-distance
phloem transport if the seedlings are either not dramatically stunted or alternative
methods can be devised. Such studies could potentially reveal aspects of the mechanism
of IBA transport. The low rates of movement I measured, however, are also consistent
with a primarily diffusion-mediated mechanism, and the passive diffusion of protonated
IBA can be greater than protonated IAA due to the higher hydrophobicity of IBA. On the
99
other hand, basipetal transport of over 60%4 of the [13C1]IAA derived from [13C1]IBA
was detected in the hypocotyl tissues (Fig. 4-3, G, H and I), and this transport was
significantly inhibited by NPA, suggesting that [13C1]IAA was synthesized from
[13C1]IBA before it transported basipetally in the hypocotyl, and thus the IBA-to-IAA
conversion could partially contribute to the transported radioactivity found by Rashotte et
al. (2003).
There is an important distinction between the use of radiolabeled auxin
measurement of transport and that using stable isotopes and GC-MS. With both
procedures the amount of IAA in the upper hypocotyl section is likely overestimated due
to labeled IAA adhering to the plant surfaces and, thus, the percent transported IAA is
potentially underestimated. With stable labels, however, catabolism of IAA or IBA
results in compounds, such as oxidized IAA and its conjugates (Ostin et al., 1998; Kai et
al., 2007), not detected by the analytical methods used here. Thus, oxidative degradation
at the cut hypocotyl surface (Sanchez-Bravo et al., 1988) could result in an underestimate
of total transport only when using the radioisotope method (since with [3H]IAA its
catabolites would still be radioactive, localized to the top section, and would contribute to
the calculated IAA content). Similarly, catabolism of IAA in the lower section following
transport would result in an underestimate of transport by the stable isotope method. The
products of IAA and IBA catabolism could potentially be identified by using a modified
extraction and derivatization method prior to GC-MS analysis, or by using liquid
chromatography (LC)-MS based methods (Ostin et al., 1998; Tam et al., 2000;
Kowalczyk and Sandberg, 2001; Kai et al., 2007), but the stable labeled standards for
each corresponding compound would need to be synthesized for quantification.
Nevertheless, I found that the percent transport of [13C1]IBA-derived [13C1]IAA (Fig. 4-
3I) was twice as much as the percent transport of [13C6]IAA (Fig. 4-3C). However,
4 The percent transport is defined for [13C1]IAA as the amount of [13C1]IAA in the lower section and
receiver (0.34 pg, Fig. 3H) divided by the sum of [13C1]IAA in upper + lower sections and the receiver
(0.54 pg).
100
because of these adhesion and metabolic concerns I cannot be certain that the IBA-
derived IAA is preferentially used for polar transport.
Although I could not detect [13C6]IBA derived from [13C6]IAA from five
Arabidopsis hypocotyl sections, IAA was previously found to be converted to IBA by
enzyme preparations from Arabidopsis seedlings (Ludwig-Müller, 2007). Therefore, the
transported [13C1]IBA measured in my assay might also contain [13C1]IBA derived from
transported [13C1]IAA. To gain a clearer view of the transport of IBA itself, I analyzed
IBA transport in mutants that are defective in the conversions between IAA and IBA
(Fig. 4-1). Because no mutants have been demonstrated to show defects in IAA-to-IBA
conversion in vivo, I only analyzed [13C1]IBA transport in ibr1 ibr3 ibr10 triple mutant
Arabidopsis hypocotyls defective in IBA-to-IAA conversion (Strader et al., 2010; Fig. 4-
5, G, H and I). I found that [13C1]IBA transport was not altered in the ibr1 ibr3 ibr10
mutant (Fig. 4-5, D, E and F), suggesting that the small amount of transport of IBA does
not depend on the inter-conversion between IBA and IAA. Interestingly, I found that the
transport of [13C6]IAA in the ibr1 ibr3 ibr10 mutant was significantly lower than the wild
type (Fig. 4-5C). Although I do not know how the IBR proteins might play a role in the
transport of IAA, this result could partially explain why the ibr1 ibr3 ibr10 mutant does
not respond to exogenous IAA in a wild-type manner (Strader et al., 2011).
Because both IAA and IBA can be converted to their conjugate forms (Fig. 4-1),
and because the ester-linked IAA conjugate IAA-myo-inositol was found to be
transported in maize seedlings (Chisnell and Bandurski, 1988), it is also possible that
both IAA and IBA conjugates are transported over long distances and thus contributed to
the transported radioactivity measured by Rashotte et al. (2003) but were excluded in my
assay where only free IAA and IBA were measured (Fig. 4-3, Fig. 4-4, and Fig. 4-5).
Therefore, I further quantified the pools of IAA and IBA conjugates, using base
hydrolysis that selectively breaks ester and amide conjugate bonds. Although the base
hydrolysis treatment is relatively harsh, it provides unbiased quantification of the entire
IAA and IBA conjugate pools. However, if specific IAA and IBA conjugates had been of
interest, alternative methods using either GC-MS or LC-MS could have been applied. As
101
shown in Figure 4-6B, free [13C6]IAA was the dominant form of transported IAA, and
only a very small amount of conjugated [13C6]IAA could be detected after transport.
Although my analysis did not include metabolites of [13C6]IAA that do not maintain the
indole ring and the two-carbon side chain, this result, together with the percent of
transported free [13C6]IAA (discussed above), leads to the conclusion that IAA itself is
the major substrate in the polar transport system. Therefore, transported radioactivity
measured in assays with [3H]IAA tracers primarily represents the transport of free IAA in
Arabidopsis hypocotyls. However, this does not exclude the possibility that the transport
of some IAA conjugates occurs in some plant tissues during some developmental periods
to provide free IAA in the target tissue, such as the transport of IAA-myo-inositol from
the maize kernel to the shoot (Epstein et al., 1980; Nowacki and Bandurski, 1980;
Chisnell and Bandurski, 1988). When pools of IBA conjugates were quantified in the
lower hypocotyl section and receiver block (Fig. 4-6D), ester-linked [13C1]IBA was
detected at a level significantly higher than free [13C1]IBA, and its level was not affected
by NPA applied in the receiver. This result suggests that ester-linked IBA may also be
transported basipetally in Arabidopsis hypocotyls and is consistent with what Epstein and
Ackerman (1993) found in Leucadendron discolor, except that the movement was in a
different direction. However, the sum of transported [13C1]IBA and its metabolites
analyzed in my assay was still significantly lower than the amount of transported
[13C6]IAA, suggesting that the majority of the transported radioactivity derived from
[3H]IBA measured by Rashotte et al. (2003) was not from [3H]IBA or [3H]IBA-derived
conjugates and [3H]IAA. Therefore, unlike IAA, measurement of transported
radioactivity does not represent the transport of IBA.
Although I found a small amount of transported free and conjugated IBA, the
amount is considerably lower than that of IAA, so it is difficult to consider IBA transport
as an important means of IBA regulation, in comparison with IAA transport. Because
over 29% of the free IAA was transported basipetally (Fig. 4-3C; discussed above),
changes in IAA transport can significantly change the level of free IAA (Liu et al., 2011,
see also Chapter 3) and play important roles in root development (Reed et al., 1998;
102
Bhalerao et al., 2002; Salisbury et al., 2007). In contrast, with less than 1% transport of
exogenous IBA (Fig. 4-3I), it is not likely that this transport contributes substantially to
the IBA pools at sites distant from where the IBA is applied. In addition, Strader et al.
(2011) found that only IAA, but not IBA, could induce lateral root formation in
Arabidopsis mutants that were defective in IBA-to-IAA conversion, suggesting that IBA
is essentially an auxin precursor rather than active auxin. Because plants have developed
a robust and tightly regulated system to transport the active auxin IAA over long distance
(reviewed by Peer et al., 2011), it may not be necessary to develop another system to
continuously transport the auxin precursor IBA similarly over long distances.
Additionally, similar to what was suggested by Ruzicka et al. (2010), the transport of
IBA may only serve as an additional way to regulate the production of IAA, and the
transport may be altered when environmental conditions are changed and IAA production
is differently regulated.
The exogenous IAA and IBA were converted to their conjugates in the upper
hypocotyl section after the five-hour period (Fig. 4-6, A and C). IAA formed more
amide-linked conjugates than ester-linked conjugates, while IBA was mostly converted to
ester-linked conjugates. Interestingly, the level of amide-linked [13C6]IAA in the upper
section was significantly increased when NPA was added in the receiver block, while the
level of free [13C6]IAA was not changed (Fig. 4-6A). Because transport of [13C6]IAA into
the lower section was significantly inhibited by NPA (Fig. 4-6B) and thus [13C6]IAA
could accumulate in the upper section, this result suggests that conjugating IAA via
amide linkages might be a way to regulate the level of free IAA by removing the excess
amount of IAA, and at least for the amide-linked IAA conjugates IAA-apartate and IAA-
glutamate, they may be further metabolized by oxidative degradation (Tuominen et al.,
1994).
The formation of the large amount of ester-linked IBA is consistent with what
was found previously, and the major conjugate is most likely to be IBA-glucose (Ludwig-
Müller and Epstein, 1993; Epstein and Ackerman, 1993; Baraldi et al., 1995). On the
other hand, the total amount of free and conjugated [13C1]IBA in the upper section was
103
dramatically higher than the amount of total [13C6]IAA, suggesting the uptake of
[13C1]IBA through the cut surface was greater than that for [13C6]IAA. However, it was
found that the uptake of [3H]IBA was the same as the uptake of [3H]IAA in intact
Arabidopsis seedlings (Ludwig-Müller et al., 1995b). I also analyzed the stability of
[13C1]IBA and [13C6]IAA in the donor agar block and found that the same proportion
(65%) of [13C1]IBA and [13C6]IAA remained in the donor agar block after the five-hour
transport period, suggesting that the higher uptake of [13C1]IBA is not due to a higher
stability of [13C1]IBA in the donor agar block. Because Tognetti et al. (2010) found that
the gene encoding the IBA-glucose conjugating enzyme (UGT74E2) was rapidly and
strongly induced by oxidative stress and the level of IBA-glucose was dramatically
increased under stress conditions, it is possible that the IBA-glucose conjugating activity
was significantly induced at the cut surface of the hypocotyl, and the formation of IBA-
glucose conjugates led to more IBA taken up into the plant tissue. This finding can also
be linked to the phenomenon that IBA is better than IAA in stimulating adventitious root
formation in plant cuttings, possibly because plant tissues store more exogenous IBA
than IAA in a conjugate form, which can release free IBA over a long period of time after
the application of exogenous IBA (Epstein et al., 1993) and eventually provide free IAA
for root primordia induction (Liu and Reid, 1992).
In summary, I evaluated the transport of IAA and IBA in Arabidopsis hypocotyls
using stable isotope labeled tracers and GC-MS/MS. I found that, in contrast to previous
reports using radioactive assays, the transport of free IBA was much lower than the
transport of free IAA and was not inhibited by NPA; and IBA was metabolized to IAA
and IBA conjugates during the transport, while IAA remained as free IAA after transport.
I conclude that the mechanism of IBA transport is fundamentally different from IAA, and
the transport and metabolism of IBA can be an additional means to regulate levels of free
IAA which can trigger physiological responses.
My study also shows that by using stable isotope labeling and mass spectrometry,
the movement and metabolism of both endogenous and applied compounds in plants can
be accurately identified and quantified. Therefore, in addition to analysis of auxin
104
transport and metabolism, I have also demonstrated a model system that should prove
useful for the analysis of the transport and metabolism of other plant hormones and small
molecules that have potential regulatory activity.
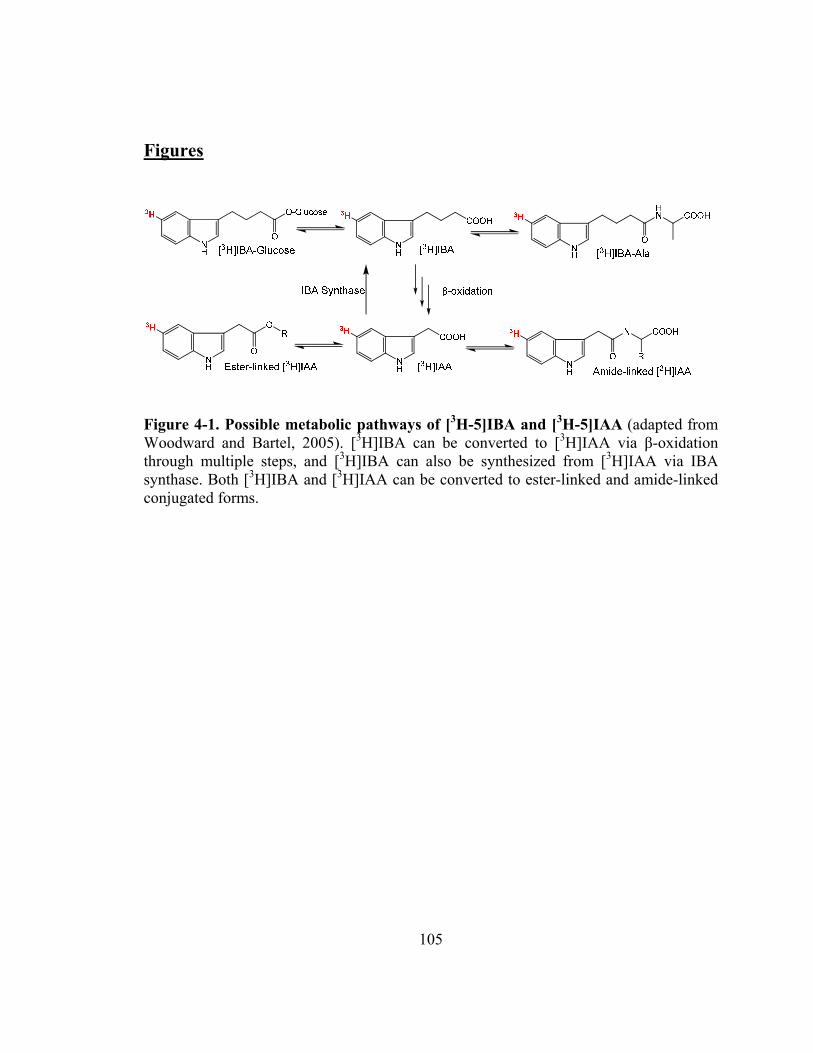
105
Figures
Figure 4-1. Possible metabolic pathways of [3H-5]IBA and [3H-5]IAA (adapted from Woodward and Bartel, 2005). [3H]IBA can be converted to [3H]IAA via β-oxidation through multiple steps, and [3H]IBA can also be synthesized from [3H]IAA via IBA synthase. Both [3H]IBA and [3H]IAA can be converted to ester-linked and amide-linked conjugated forms.
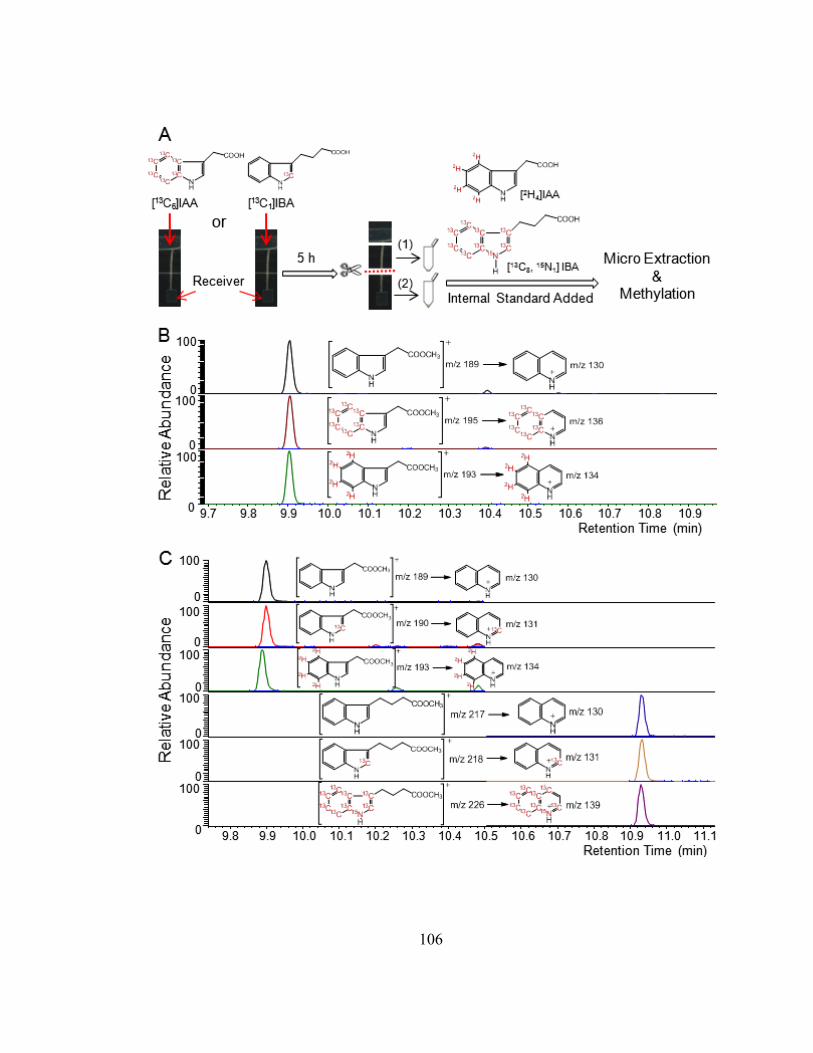
106
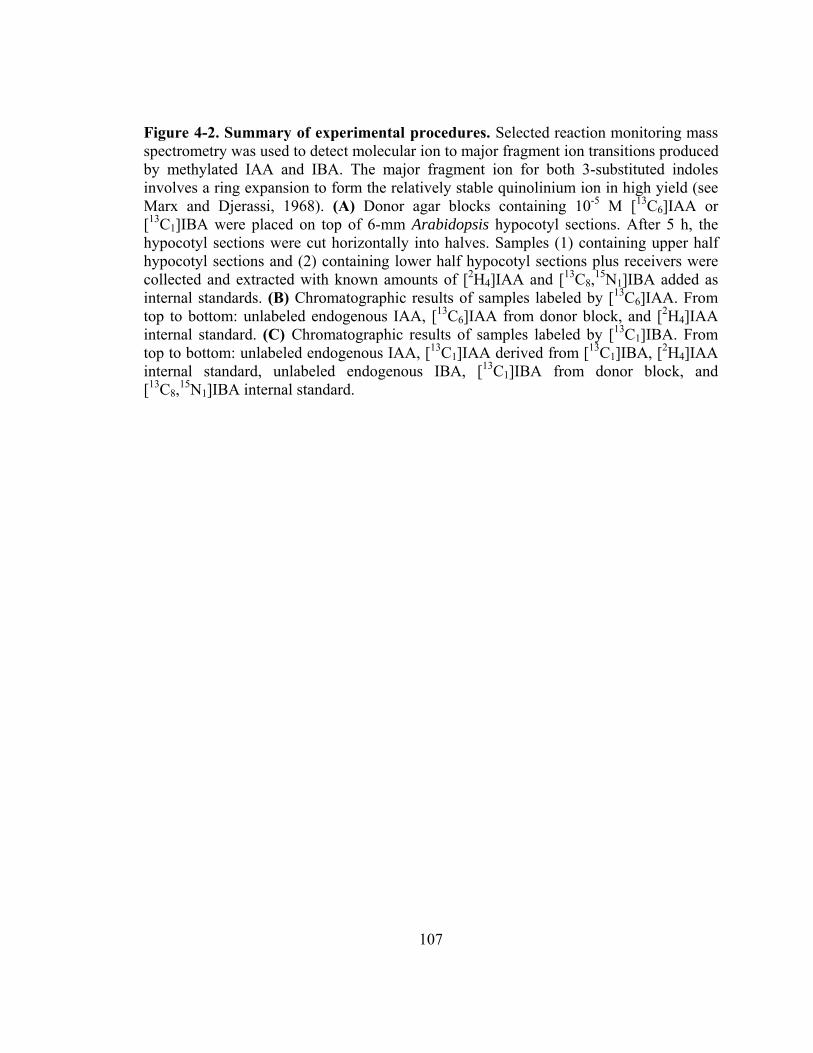
107
Figure 4-2. Summary of experimental procedures. Selected reaction monitoring mass spectrometry was used to detect molecular ion to major fragment ion transitions produced by methylated IAA and IBA. The major fragment ion for both 3-substituted indoles involves a ring expansion to form the relatively stable quinolinium ion in high yield (see Marx and Djerassi, 1968). (A) Donor agar blocks containing 10-5 M [13C6]IAA or [13C1]IBA were placed on top of 6-mm Arabidopsis hypocotyl sections. After 5 h, the hypocotyl sections were cut horizontally into halves. Samples (1) containing upper half hypocotyl sections and (2) containing lower half hypocotyl sections plus receivers were collected and extracted with known amounts of [2H4]IAA and [13C8,
15N1]IBA added as internal standards. (B) Chromatographic results of samples labeled by [13C6]IAA. From top to bottom: unlabeled endogenous IAA, [13C6]IAA from donor block, and [2H4]IAA internal standard. (C) Chromatographic results of samples labeled by [13C1]IBA. From top to bottom: unlabeled endogenous IAA, [13C1]IAA derived from [13C1]IBA, [2H4]IAA internal standard, unlabeled endogenous IBA, [13C1]IBA from donor block, and [13C8,
15N1]IBA internal standard.
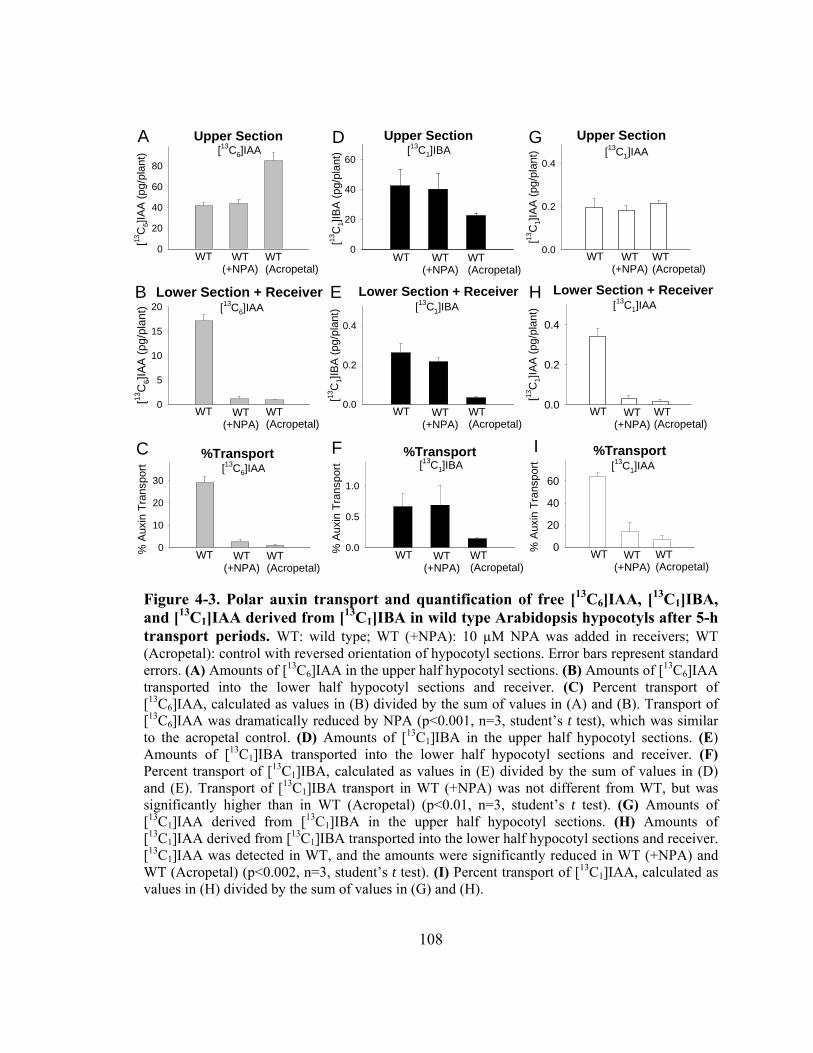
108
Upper Section[13
C6]
IAA
(pg
/pla
nt)
0
20
40
60
80
WT WT(+NPA)
WT(Acropetal)
A
Lower Section + Receiver
[13C
6]IA
A (
pg/p
lant
)
0
5
10
15
20B
%Transport
% A
uxin
Tra
nspo
rt
0
10
20
30
C
D
E
F
WT WT(+NPA)
WT(Acropetal)
WT WT(+NPA)
WT(Acropetal)
G
H
I
Upper Section
[13 C
1]IB
A (
pg/p
lant
)
0
20
40
60
WT WT(+NPA)
WT(Acropetal)
Lower Section + Receiver
[13 C
1]IB
A (
pg/p
lant
)
0.0
0.2
0.4
WT WT(+NPA)
WT(Acropetal)
%Transport
% A
uxin
Tra
nspo
rt
0.0
0.5
1.0
WT WT(+NPA)
WT(Acropetal)
Upper Section
[13 C
1]I
AA
(pg
/pla
nt)
0.0
0.2
0.4
WT WT(+NPA)
WT(Acropetal)
Lower Section + Receiver
[13 C
1]IA
A (
pg/p
lant
)
0.0
0.2
0.4
WT WT(+NPA)
WT(Acropetal)
%Transport
% A
uxin
Tra
nspo
rt0
20
40
60
WT WT(+NPA)
WT(Acropetal)
[13C6]IAA
[13C6]IAA
[13C6]IAA
[13C1]IBA
[13C1]IBA
[13C1]IBA
[13C1]IAA
[13C1]IAA
[13C1]IAA
Figure 4-3. Polar auxin transport and quantification of free [13C6]IAA, [13C1]IBA, and [13C1]IAA derived from [13C1]IBA in wild type Arabidopsis hypocotyls after 5-h transport periods. WT: wild type; WT (+NPA): 10 µM NPA was added in receivers; WT (Acropetal): control with reversed orientation of hypocotyl sections. Error bars represent standard errors. (A) Amounts of [13C6]IAA in the upper half hypocotyl sections. (B) Amounts of [13C6]IAA transported into the lower half hypocotyl sections and receiver. (C) Percent transport of [13C6]IAA, calculated as values in (B) divided by the sum of values in (A) and (B). Transport of [13C6]IAA was dramatically reduced by NPA (p<0.001, n=3, student’s t test), which was similar to the acropetal control. (D) Amounts of [13C1]IBA in the upper half hypocotyl sections. (E) Amounts of [13C1]IBA transported into the lower half hypocotyl sections and receiver. (F) Percent transport of [13C1]IBA, calculated as values in (E) divided by the sum of values in (D) and (E). Transport of [13C1]IBA transport in WT (+NPA) was not different from WT, but was significantly higher than in WT (Acropetal) (p<0.01, n=3, student’s t test). (G) Amounts of [13C1]IAA derived from [13C1]IBA in the upper half hypocotyl sections. (H) Amounts of [13C1]IAA derived from [13C1]IBA transported into the lower half hypocotyl sections and receiver. [13C1]IAA was detected in WT, and the amounts were significantly reduced in WT (+NPA) and WT (Acropetal) (p<0.002, n=3, student’s t test). (I) Percent transport of [13C1]IAA, calculated as values in (H) divided by the sum of values in (G) and (H).

109
Upper Section[13
C6]
IAA
(pg
/pla
nt)
0
20
40
60
nakr1WT
A
Lower Section + Receiver
[13 C
6]IA
A (
pg/
pla
nt)
0
10
20
30
B
%Transport
% A
uxin
Tra
nsp
ort
0
10
20
30
40
C
D
E
F
G
H
I
Upper Section
[13C
1]IB
A (
pg/p
lant
)
0
20
40
60
Lower Section + Receiver
[13C
1]IB
A (
pg/p
lant
)
0.0
0.2
0.4
%Transport
% A
uxin
Tra
nspo
rt
0.0
0.5
1.0
Upper Section
[13C
1]IA
A (
pg/p
lant
)
0.0
0.2
0.4
Lower Section + Receiver
[13C
1]IA
A (
pg/p
lant
)
0.0
0.2
0.4
0.6
%Transport
% A
uxi
n T
rans
port
0
20
40
60
nakr1WT
nakr1WT
nakr1WT
nakr1WT
nakr1WT
nakr1WT
nakr1WT
nakr1WT
[13C6]IAA
[13C6]IAA
[13C6]AA
[13C1]IBA
[13C1]IBA
[13C1]IBA
[13C1]IAA
[13C1]IAA
[13C1]IAA
Figure 4-4. Polar auxin transport and quantification of free [13C6]IAA, [13C1]IBA, and [13C1]IAA derived from [13C1]IBA in wild type and nakr1 mutant Arabidopsis hypocotyls after 5-h transport periods. WT: wild type. Error bars represent standard errors. (A) Amounts of [13C6]IAA in the upper half hypocotyl sections. (B) Amounts of [13C6]IAA transported into the lower half hypocotyl sections and receiver. (C) Percent transport of [13C6]IAA, calculated as values in (B) divided by the sum of values in (A) and (B). Transport of [13C6]IAA in nakr1 mutant was not different from WT. (D) Amounts of [13C1]IBA in the upper half hypocotyl sections. (E) Amounts of [13C1]IBA transported into the lower half hypocotyl sections and receiver. (F) Percent transport of [13C1]IBA, calculated as values in (E) divided by the sum of values in (D) and (E). Transport of [13C1]IBA in nakr1 mutant was not different from WT. (G) Amounts of [13C1]IAA derived from [13C1]IBA in the upper half hypocotyl sections. (H) Amounts of [13C1]IAA derived from [13C1]IBA transported into the lower half hypocotyl sections and receiver. (I) Percent transport of [13C1]IAA, calculated as values in (H) divided by the sum of values in (G) and (H).
110
Upper Section[13
C6]
IAA
(pg
/pla
nt)
0
20
40
60
ibr 1 ibr 3ibr 10
WT
A
Lower Section + Receiver
[13C
6]IA
A (
pg/p
lant
)
0
5
10
15
20
B
%Transport
% A
uxin
Tra
nspo
rt
0
10
20
30
C
D
E
F
ibr 1 ibr 3ibr 10
WT
ibr 1 ibr 3ibr 10
WT
G
H
I
Upper Section
[13C
1]I
BA
(pg
/pla
nt)
0
20
40
60
ibr 1 ibr 3ibr 10
WT
Lower Section + Receiver
[13C
1]IB
A (
pg/p
lant
)
0.0
0.2
0.4
ibr 1 ibr 3ibr 10
WT
%Transport
% A
uxin
Tra
nspo
rt
0.0
0.5
1.0
ibr 1 ibr 3ibr 10
WT
Upper Section
[13C
1]IA
A (
pg/p
lant
)
0.0
0.2
0.4
ibr 1 ibr 3ibr 10
WT
Lower Section + Receiver
[13C
1]I
AA
(pg
/pla
nt)
0.0
0.2
0.4
0.6
ibr 1 ibr 3ibr 10
WT
%Transport
% A
uxi
n T
rans
port
0
20
40
60
ibr 1 ibr 3ibr 10
WT
[13C6]IAA
[13C6]IAA
[13C6]IAA
[13C1]IBA
[13C1]IBA
[13C1]IBA
[13C1]IAA
[13C1]IAA
[13C1]IAA
Figure 4-5. Polar auxin transport and quantification of free [13C6]IAA, [13C1]IBA, and [13C1]IAA derived from [13C1]IBA in wild type and ibr1 ibr3 ibr10 mutant Arabidopsis hypocotyls after 5-h transport periods. WT: wild type. Error bars represent standard errors. The +NPA and acropetal controls were also performed using ibr1 ibr3 ib10 mutant plants, and the results were similar to the wild type shown in Figure 3. (A) Amounts of [13C6]IAA in the upper half hypocotyl sections. (B) Amounts of [13C6]IAA transported into the lower half hypocotyl sections and receiver. (C) Percent transport of [13C6]IAA, calculated as values in (B) divided by the sum of values in (A) and (B). Transport of [13C6]IAA in ibr1 ibr3 ibr10 mutant was significantly lower than in the WT (indicated by *; p<0.05, n=3, student’s t test). (D) Amounts of [13C1]IBA in the upper half hypocotyl sections. (E) Amounts of [13C1]IBA transported into the lower half hypocotyl sections and receiver. (F) Percent transport of [13C1]IBA, calculated as values in (E) divided by the sum of values in (D) and (E). Transport of [13C1]IBA in ibr1 ibr3 ibr10 mutant was not different from WT. (G) Amounts of [13C1]IAA derived from [13C1]IBA in the upper half hypocotyl sections. (H) Amounts of [13C1]IAA derived from [13C1]IBA transported into the lower half hypocotyl sections and receiver. The amount of [13C1]IAA was significantly reduced in ibr1 ibr3 ibr10 mutant compared with the WT (indicated by ***; p<0.002, n=3, student’s t test). (I) Percent transport of [13C1]IAA, calculated as values in (H) divided by the sum of values in (G) and (H).
* *
***
***
**
**
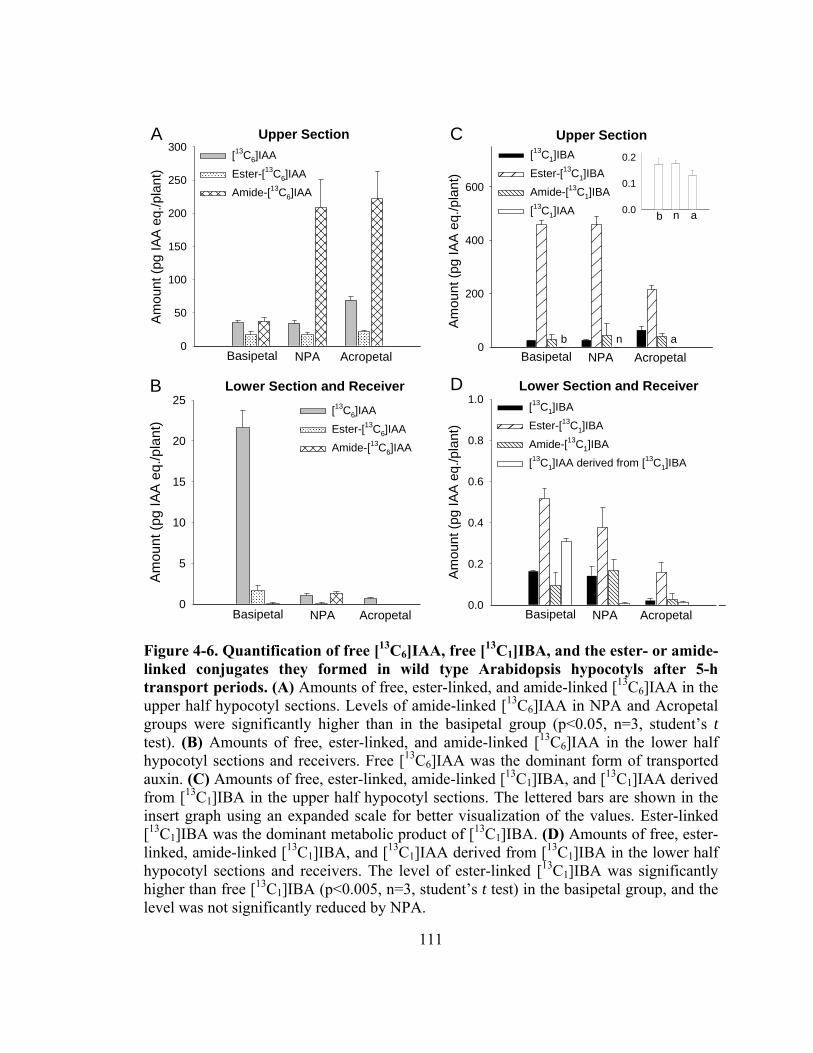
111
Upper Section
Am
ount
(pg
IAA
eq.
/pla
nt)
0
200
400
600
[13C1]IBA
Ester-[13C1]IBA
Amide-[13C1]IBA
[13C1]IAA 0.0
0.1
0.2
Basipetal NPA Acropetal
b n a
Lower Section and Receiver
Am
ount
(pg
IAA
eq.
/pla
nt)
0.0
0.2
0.4
0.6
0.8
1.0[13C1]IBA
Ester-[13C1]IBA
Amide-[13C1]IBA
[13C1]IAA derived from [13C1]IBA
Basipetal NPA Acropetal
Upper Section
Am
ount
(pg
IAA
eq.
/pla
nt)
0
50
100
150
200
250
300[13C6]IAA
Ester-[13C6]IAA
Amide-[13C6]IAA
Basipetal NPA Acropetal
Lower Section and Receiver
Am
oun
t (pg
IAA
eq
./pla
nt)
0
5
10
15
20
25[13C6]IAA
Ester-[13C6]IAA
Amide-[13C6]IAA
Basipetal NPA Acropetal
A
B
C
D
b n a
Figure 4-6. Quantification of free [13C6]IAA, free [13C1]IBA, and the ester- or amide-linked conjugates they formed in wild type Arabidopsis hypocotyls after 5-h transport periods. (A) Amounts of free, ester-linked, and amide-linked [13C6]IAA in the upper half hypocotyl sections. Levels of amide-linked [13C6]IAA in NPA and Acropetal groups were significantly higher than in the basipetal group (p<0.05, n=3, student’s t test). (B) Amounts of free, ester-linked, and amide-linked [13C6]IAA in the lower half hypocotyl sections and receivers. Free [13C6]IAA was the dominant form of transported auxin. (C) Amounts of free, ester-linked, amide-linked [13C1]IBA, and [13C1]IAA derived from [13C1]IBA in the upper half hypocotyl sections. The lettered bars are shown in the insert graph using an expanded scale for better visualization of the values. Ester-linked [13C1]IBA was the dominant metabolic product of [13C1]IBA. (D) Amounts of free, ester-linked, amide-linked [13C1]IBA, and [13C1]IAA derived from [13C1]IBA in the lower half hypocotyl sections and receivers. The level of ester-linked [13C1]IBA was significantly higher than free [13C1]IBA (p<0.005, n=3, student’s t test) in the basipetal group, and the level was not significantly reduced by NPA.

112
Figure 4-7. Transport of free [13C8,15N1]IBA, and [13C8,
15N1]IAA derived from [13C8,
15N1]IBA in maize coleoptiles after 3.5-h transport periods. Coleoptile tissues were collected from 6-day old dark-grown maize seedlings (cv. Silverqueen), and 6-mm sections were dissected 2-mm below the apical tips. Donor agar blocks containing 6 x 10⁻⁵ M [13C8,
15N1]IBA were placed on the apical end of coleoptile sections, while receiver agar blocks were placed on the basal end. After 3.5-h transport period, the coleoptile sections were dissected into three 2-mm segments and collected separately for analysis. IBA and IAA were extracted and quantified from each of the 2-mm coleoptile segment and the receiver block exactly as previously described (Barkawi et al., 2008). The enrichment of [13C8,
15N1]IBA and [13C8,15N1]IAA over the unlabeled endogenous IBA
and IAA pool was determined, and average values of three replicates are presented in the figure. Tip: the uppermost 2-mm coleoptile tissue; D: donor agar block; U: upper 2-mm coleoptile segment; M: middle 2-mm coleoptile segment; L: lower 2-mm coleoptile segment; R: receiver agar block. *IBA represents [13C8,
15N1]IBA; *IAA represents [13C8,
15N1]IAA derived from [13C8,15N1]IBA. (A) Basipetal transport of auxin. Both
[13C8,15N1]IBA and [13C8,
15N1]IAA derived from [13C8,15N1]IBA was transported into the
receiver agar block. (B) Basipetal transport of auxin in the presence of 20 µM NPA. NPA added in the receiver agar block significantly reduced the transport of [13C8,
15N1]IAA into the receiver agar block, but did not reduce the transport of [13C8,
15N1]IBA. (C) Acropetal transport of auxin, a negative control where the orientation of coleoptile sections was reversed. [13C8,
15N1]IBA or [13C8,15N1]IAA was not detected in the receiver, lower or
middle coleoptile segment.
113
Addenda
The following sections provide information about six of my collaborative projects, which
are all aimed at better understand in the role of auxin transport and auxin metabolism in
plant growth and development. Each section starts with an abstract summarizing the
goals and conclusions of the project, followed by a detailed description of the work I
contributed. Figures showing my experimental results are also presented, which have
been or will be included in research journal articles.
114
A.
Genetic Dissection of the Role of Ethylene in Regulating
Auxin-dependent Lateral and Adventitious Root Formation in Tomato
Sangeeta Negi, Poornima Sukumar, Xing Liu, Jerry D. Cohen and Gloria K. Muday§
§ Corresponding author; Department of Biology, Wake Forest University, Winston-
Salem, North Carolina, USA
Published in The Plant Journal (2010) 61: 3-15
Abstract
In this study we investigated the role of ethylene in the formation of lateral and
adventitious roots in tomato (Solanum lycopersicum) using mutants isolated for altered
ethylene signaling and fruit ripening. Mutations that block ethylene responses and delay
ripening -Nr (Never ripe), gr (green ripe), nor (non ripening), and rin (ripening inhibitor)
- have enhanced lateral root formation. In contrast, the epi (epinastic) mutant, which has
elevated ethylene and constitutive ethylene signaling in some tissues, or treatment with
the ethylene precursor 1-aminocyclopropane carboxylic acid (ACC), reduces lateral root
formation. Treatment with ACC inhibits the initiation and elongation of lateral roots,
except in the Nr genotype. Root basipetal and acropetal indole-3-acetic acid (IAA)
transport increase with ACC treatments or in the epi mutant, while in the Nr mutant there
is less auxin transport than in the wild type and transport is insensitive to ACC. In
contrast, the process of adventitious root formation shows the opposite response to
ethylene, with ACC treatment and the epi mutation increasing adventitious root formation
and the Nr mutation reducing the number of adventitious roots. In hypocotyls, ACC
treatment negatively regulated IAA transport while the Nr mutant showed increased IAA
transport in hypocotyls. Ethylene significantly reduces free IAA content in roots, but only
subtly changes free IAA content in tomato hypocotyls. These results indicate a negative
role for ethylene in lateral root formation and a positive role in adventitious root
115
formation with modulation of auxin transport as a central point of ethylene-auxin
crosstalk.
Quantification of Free IAA in Tomato Roots and Hypocotyls
The Nr mutant in the Pearson background was provided by Harry Klee
(University of Florida, Gainesville, FL) (Wilkinson et al., 1995); epi (in the VFN8
background) mutant seeds were provided by Jim Giovannoni (Boyce Thompson Institute,
Ithaca, NY) (Barry et al., 2001). All seeds were sterilized by incubation for 5 min in 95%
ethanol, then for 30 min in freshly prepared 20% (v/v) bleach plus 0.01% (v/v) Triton X-
100, and then washed with sterile water. The sterilized seeds were sown on sterilized blue
filter papers and after emergence of the radicle they were transferred to control plates:
0.8% (w/v) Type M agar (A-4800; Sigma), MS nutrients (macro and micro salts,
MSP0501; Caisson Labs) (Murashige and Skoog, 1962), vitamins (1 µg ml-1 thiamine, 1
µg ml-1 pyridoxine HCl, and 0.5 µg ml-1 nicotinic acid), 0.05% (w/v) 2-(N-morpholine)-
ethanesulfonic acid (MES), with pH adjusted to 5.8. For root samples, seeds were
germinated and after radicle emergence transferred to control or 1 µM ACC plates for 48
h. Roots were excised and frozen in liquid nitrogen. For hypocotyl tissues, samples were
grown in low light for 3 days and transferred to high-light conditions onto media with
and without 1 or 10 µM ACC for 48 h; hypocotyls were collected and frozen. For both
types of sample, 50-80 mg of frozen tissue was homogenized with a bead beater in 150
µL of homogenization buffer (35% of 0.2 M imidazole, 65% isopropanol, pH 7),
containing 4 ng of [13C6]IAA as an internal standard. The level of free IAA was analyzed
by solid phase extraction followed by GC-SIM-MS as previously described (Barkawi et
al., 2010).
As shown in Figure A-1, free IAA levels were higher in Nr roots than in wild-type
plants, and consistent with these results, ACC-treated wild-type roots contained a
significantly lower level of free IAA than untreated roots (P<0.05). The effect of ACC
was similar in all backgrounds (Pearson, AC, and VFN8) with a statistically significant
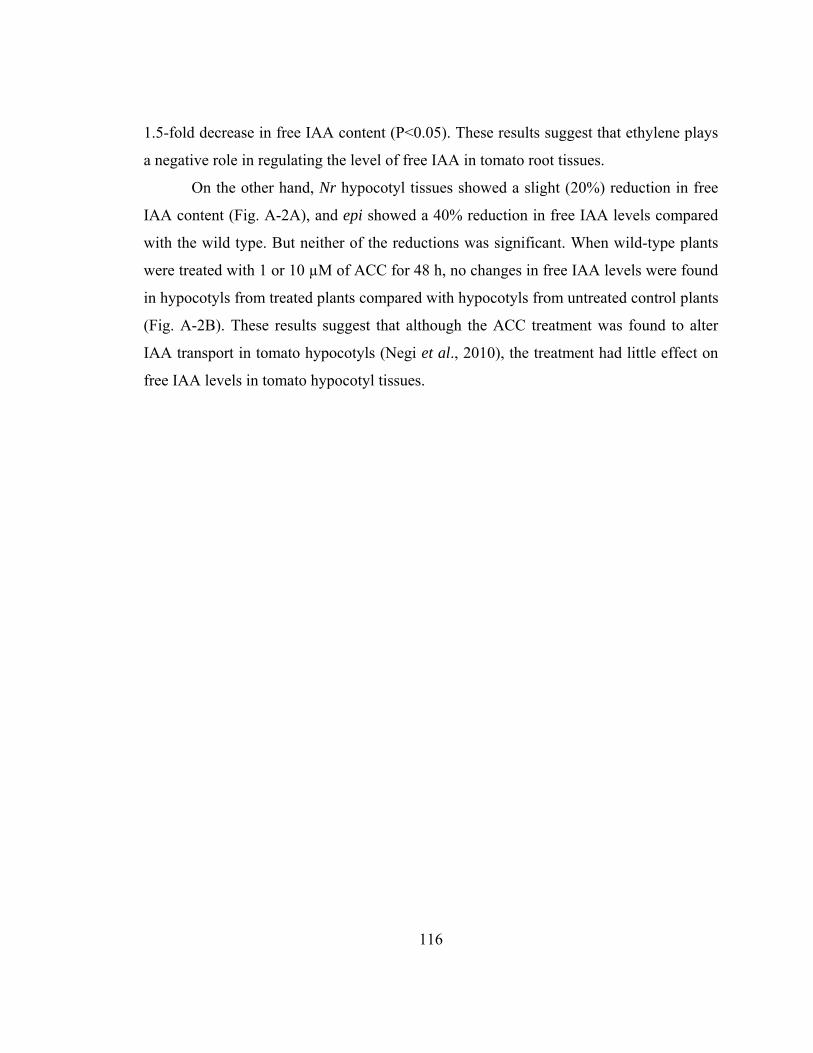
116
1.5-fold decrease in free IAA content (P<0.05). These results suggest that ethylene plays
a negative role in regulating the level of free IAA in tomato root tissues.
On the other hand, Nr hypocotyl tissues showed a slight (20%) reduction in free
IAA content (Fig. A-2A), and epi showed a 40% reduction in free IAA levels compared
with the wild type. But neither of the reductions was significant. When wild-type plants
were treated with 1 or 10 µM of ACC for 48 h, no changes in free IAA levels were found
in hypocotyls from treated plants compared with hypocotyls from untreated control plants
(Fig. A-2B). These results suggest that although the ACC treatment was found to alter
IAA transport in tomato hypocotyls (Negi et al., 2010), the treatment had little effect on
free IAA levels in tomato hypocotyl tissues.
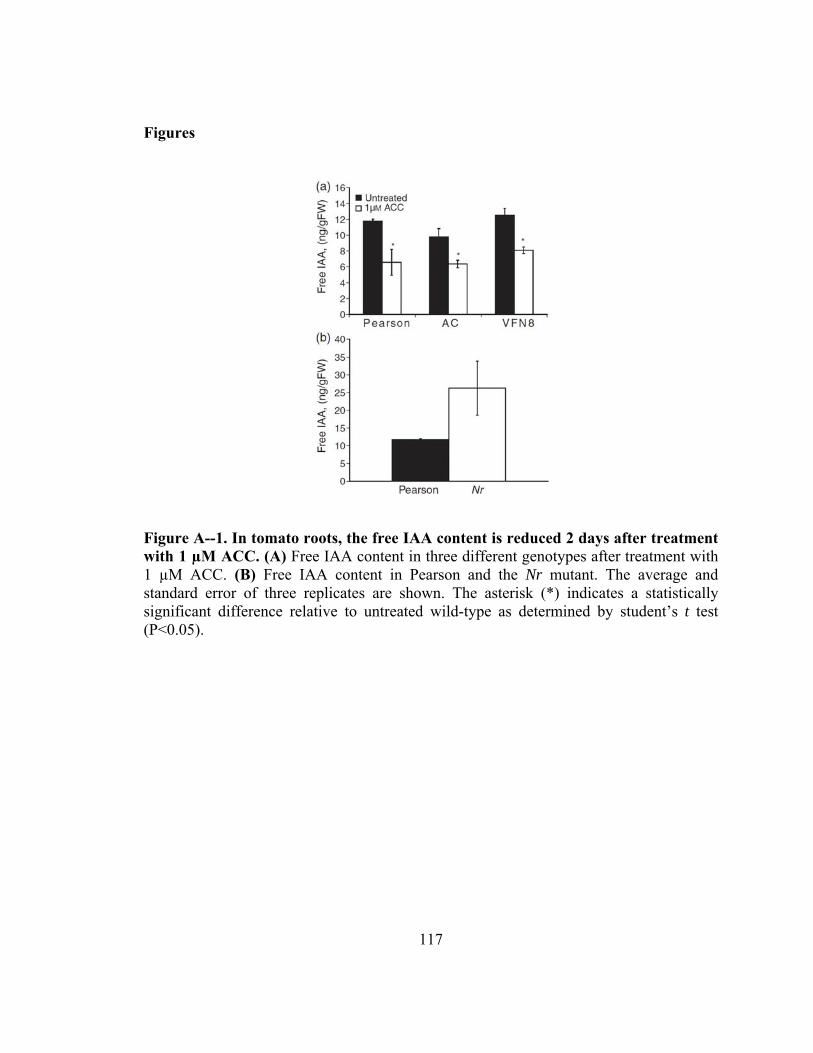
117
Figures
Figure A--1. In tomato roots, the free IAA content is reduced 2 days after treatment with 1 µM ACC. (A) Free IAA content in three different genotypes after treatment with 1 µM ACC. (B) Free IAA content in Pearson and the Nr mutant. The average and standard error of three replicates are shown. The asterisk (*) indicates a statistically significant difference relative to untreated wild-type as determined by student’s t test (P<0.05).
118
Figure A--2. Effect of ethylene on the free IAA content in tomato hypocotyls. (A) Free IAA in the ethylene mutants Nr and epi are compared with the respective wild types. (B) Free IAA in tomato hypocotyls treated with ACC for 48 h. In both panels the average and standard error of three replicates are reported.

119
B.
vanishing tassel2 Encodes a Grass-Specific
Tryptophan Aminotransferase Required for Vegetative and
Reproductive Development in Maize
Kimberly A. Phillips, Andrea L. Skirpan, Xing Liu, Ashley Christensen, Thomas L.
Slewinski, Christopher Hudson, Solmaz Barazesh, Jerry D. Cohen, Simon Malcomber,
and Paula McSteen§
§ Corresponding author; Department of Biology, Pennsylvania State University,
University Park, Pennsylvania, USA
Published in The Plant Cell (2011) 23: 550-566
Abstract
Auxin plays a fundamental role in organogenesis in plants. Multiple pathways for auxin
biosynthesis have been proposed, but none of the predicted pathways are completely
understood. Here, we report the positional cloning and characterization of the vanishing
tassel2 (vt2) gene of maize (Zea mays). Phylogenetic analyses indicate that vt2 is a co-
ortholog of TRYPTOPHAN AMINOTRANSFERASE OF ARABIDOPSIS1 (TAA1), which
converts Trp to indole-3-pyruvic acid in one of four hypothesized Trp-dependent auxin
biosynthesis pathways. Unlike single mutations in TAA1, which cause subtle
morphological phenotypes in Arabidopsis thaliana, vt2 mutants have dramatic effects on
vegetative and reproductive development. vt2 mutants share many similarities with
sparse inflorescence1 (spi1) mutants in maize. spi1 is proposed to encode an enzyme in
the tryptamine pathway for Trp-dependent auxin biosynthesis, although this biochemical
activity has recently been questioned. Surprisingly, spi1 vt2 double mutants had only a
slightly more severe phenotype than vt2 single mutants. Furthermore, both spi1 and vt2
single mutants exhibited a reduction in free auxin levels, but the spi1 vt2 double mutants
did not have a further reduction compared with vt2 single mutants. Therefore, both spi1
120
and vt2 function in auxin biosynthesis in maize, possibly in the same pathway rather than
independently as previously proposed.
Quantification of Free IAA in Maize Leaf Tissues
Maize families segregating for both spi1 and vt2 in the B73 genetic background
were grown for 2 weeks and genotyped as described in Phillips et al (2011). Samples of
leaf tissue were collected from the fifth leaf that was just emerging from the whorl. Leaf
tissue (50 to 80 mg) was weighed, frozen in liquid nitrogen, and stored at -80 ºC. For
each sample, 150 µL of homogenization buffer (35% of 0.2 M imidazole and 65%
isopropanol, pH 7) containing 3 or 4 ng of [13C6]IAA was added before homogenization.
The level of free IAA was analyzed by solid phase extraction followed by GC-SIM-MS
as previously described (Barkawi et al., 2010).
As shown in Figure A-3, wild-type maize leaves contained 10 to 11 ng/g fresh
weight of free IAA, while spi1 and vt2 single mutants had an average 82% and 34% of
normal IAA levels, respectively. The reduction of free IAA levels in spi1 vt2 double
mutants was not statistically significantly different from that in vt2 single mutants
(P=0.845), which supported the conclusion from the genetic evidence that spi1 acted
downstream of vt2 in the same IAA biosynthetic pathway. These results for the first time
provide experimental support for the hypothesis that vt2 (TAA1) and spi1 (YUCCA)
actually function in the same pathway for auxin biosynthesis, at least in maize leaf
tissues.
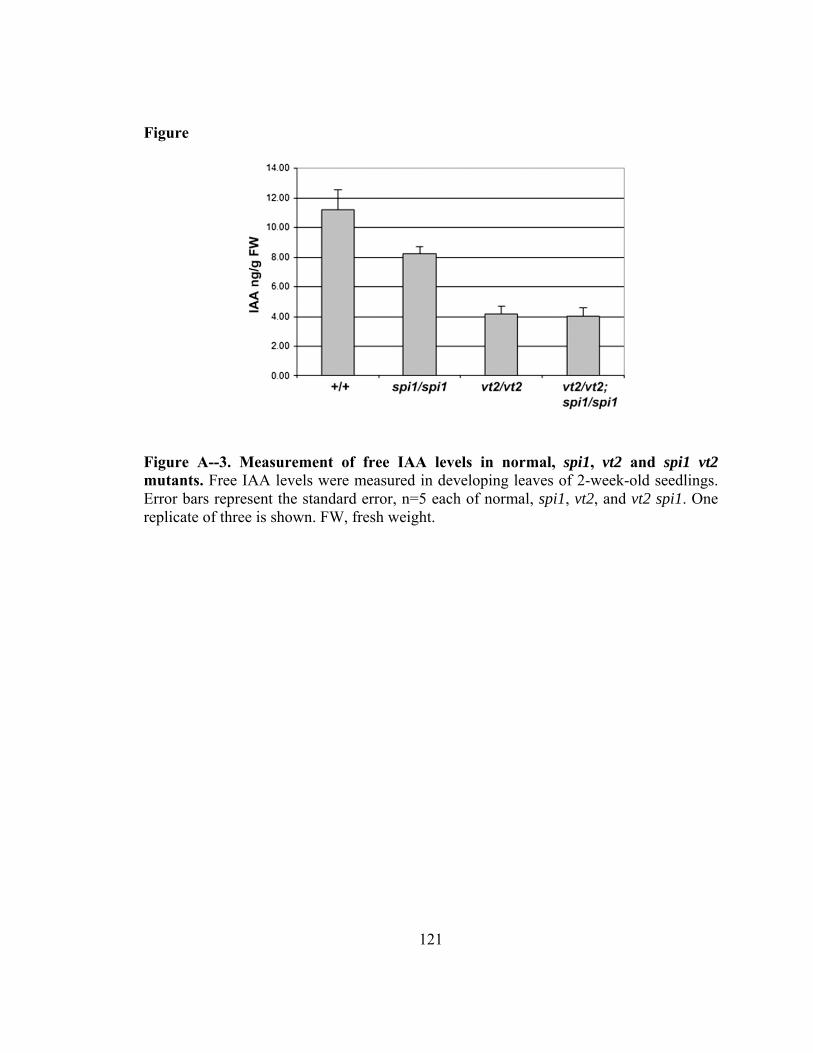
121
Figure
Figure A--3. Measurement of free IAA levels in normal, spi1, vt2 and spi1 vt2 mutants. Free IAA levels were measured in developing leaves of 2-week-old seedlings. Error bars represent the standard error, n=5 each of normal, spi1, vt2, and vt2 spi1. One replicate of three is shown. FW, fresh weight.
122
C.
Arabidopsis Monothiol Glutaredoxin, AtGRXS17, is Critical for
Temperature-dependent Postembryonic Growth and Development via
Modulating Auxin Response
Ning-Hui Cheng§, Jian-Zhong Liu, Xing Liu, Qingyu Wu, Sean M. Thompson, Julie Lin,
Joyce Change, Seven A. Whitham, Sunghun Park, Jerry D. Cohen, and Kendal D. Hirschi
§ Corresponding author; United States Department of Agriculture/Agricultural Research
Service, Children’s Nutrition Research Center, Baylor College of Medicine, Houston,
Texas, USA
Published in The Journal of Biological Chemistry (2011) 286: 20398-20406
Abstract
Global environmental temperature changes threaten innumerable plant species. Although
various signaling networks regulate plant responses to temperature fluctuations, the
mechanisms unifying these diverse processes are largely unknown. Here, we demonstrate
that an Arabidopsis monothiol glutaredoxin, AtGRXS17 (At4g04950), plays a critical
role in redox homeostasis and hormone perception to mediate temperature-dependent
postembryonic growth. AtGRXS17 expression was induced by elevated temperatures.
Lines altered in AtGRXS17 expression were hypersensitive to elevated temperatures and
phenocopied mutants altered in the perception of the phytohormone auxin. We show that
auxin sensitivity and polar auxin transport were perturbed in these mutants, whereas
auxin biosynthesis was not altered. In addition, atgrxs17 plants displayed phenotypes
consistent with defects in proliferation and/or cell cycle control while accumulating
higher levels of reactive oxygen species and cellular membrane damage under high
temperature. Together, our findings provide a nexus between reactive oxygen species
homeostasis, auxin signaling, and temperature responses.
123
Quantification of Free and Conjugated IAA in Arabidopsis Seedlings
Ten-day-old wild type, atgrxs17 KO, and AtGRXS17 RNAi seedlings were
harvested after growth at 22 or 28 °C. For each seedling type, 150-200 mg of frozen
tissue was homogenized using a Mixer Mill (MM 300; Qiagen, Valencia, CA), with a 3-
mm tungsten carbide bead in 300 µl of homogenization buffer (35% of 0.2 M imidazole,
65% isopropanol, pH 7) containing 20 ng of [13C6]IAA and 200 ng of
[13C]indoleacetonitrile (IAN) as internal standards (Ilić et al., 1996).
After 1 h on ice, 150 µl of the homogenate was purified through two sequential
solid phase extraction (SPE) columns, anion exchange and plastic affinity, using a Gilson
SPE 215 system, methylated, dried, and redissolved in ethyl acetate exactly as described
previously (Barkawi et al., 2010). The flow-through from the amino anion exchange SPE
column was collected for IAN analysis. The samples were then analyzed using GC-SIM-
MS on an Agilent 6890/5973 system. The level of free IAA was quantified by isotope
dilution analysis based on the [13C6]IAA internal standard (Barkawi et al., 2010).
For IAN analysis, the flowthrough collected from the amino SPE column was
passed through a C18 SPE column (100 mg; Varian) and then washed with 3 × 0.6 ml
water, eluted with 3 × 0.3 ml acetonitrile, evaporated to complete dryness, and
derivatized with 50 µl of bis(trimethylsily)trifluoroacetamide plus 1%
trimethylchlorosilane at 45 °C for 45 min. The samples were analyzed using GC-SIM-
MS, and the correction factor for nonenzymatic conversion of IAN to IAA was
determined (Ilić et al., 1996).
For the rest of the homogenate, 100 µl was hydrolyzed in 1 N NaOH (1 h, room
temperature) for measurement of free plus ester-linked IAA, and 50 µl was hydrolyzed in
7 N NaOH (3 h, 100 °C under nitrogen gas) for measurement of total IAA. After
hydrolysis, the pH of the homogenate was adjusted to 2.7 and desalted by passing
through a C18 SPE column (100 mg; Varian), washed with 3 × 0.6 ml water, eluted with
3 × 0.3 ml methanol, evaporated to dryness, and redissolved in 150 µl of homogenization
buffer. The purification of IAA released from the conjugates was subsequently the same
as used for the purification of free IAA. The samples were analyzed using GC-SIM-MS,
124
and the levels of free plus ester-linked IAA and total IAA were quantified with correction
for IAN hydrolysis (Ilić et al., 1996).
As shown in Figure A-4, no significant difference in IAA levels was found in
atgrxs17 KO or RNAi seedlings compared with wild-type control plants, grown at either
22 °C or 28 °C. This result suggest that the auxin-related phenotypes observed in
atgrxs17 mutant plants (Cheng et al., 2011) were not due to altered IAA levels or auxin
metabolism.
Polar Auxin Transport in Arabidopsis Hypocotyls
Wild type, atgrxs17 KO, and AtGRXS17 RNAi line seeds were surface-sterilized
and plated on one-half strength MS medium. After 3 days in the dark at 4 °C and 12 h
under cool white fluorescent lights (photosynthetically active radiation = 80 µmol m-2 s-
1), the seeds were grown at either 22 or 28 °C continuously in darkness for 4 days and
then exposed to continuous cool white fluorescent lights (photosynthetically active
radiation = 80 µmol m-2 s-1) for an additional 2 days. The basipetal IAA transport in
hypocotyl tissues was measured as previously described (Liu et al., 2011, see also
Chapter 3).
As shown in Figure A-4D, basipetal transport of auxin in the hypocotyls of
atgrxs17 KO and RNAi seedlings was reduced compared with wild-type controls at 22
°C, but this difference was not statistically significant. At 28 °C, basipetal transport of
auxin in the hypocotyls of wild-type seedlings was increased but not in atgrxs17 KO or
RNAi seedlings, and therefore, the basipetal transport of auxin in atgrxs17 mutant plants
was significantly lower than that in wild-type seedlings (p<0.001). Additionally, the
higher temperature promoted polar auxin transport in wild type controls, but not in either
atgrxs17 KO or RNAi seedlings, indicating that temperature-dependent promotion of
polar auxin transport was lost in both atgrxs17 KO and RNAi seedlings. These results
suggest that the reduction of polar auxin transport activity in AtGRXS17 loss-of-function
plants contributes to auxin-related growth defects under high temperature (Cheng et al.,
2011).
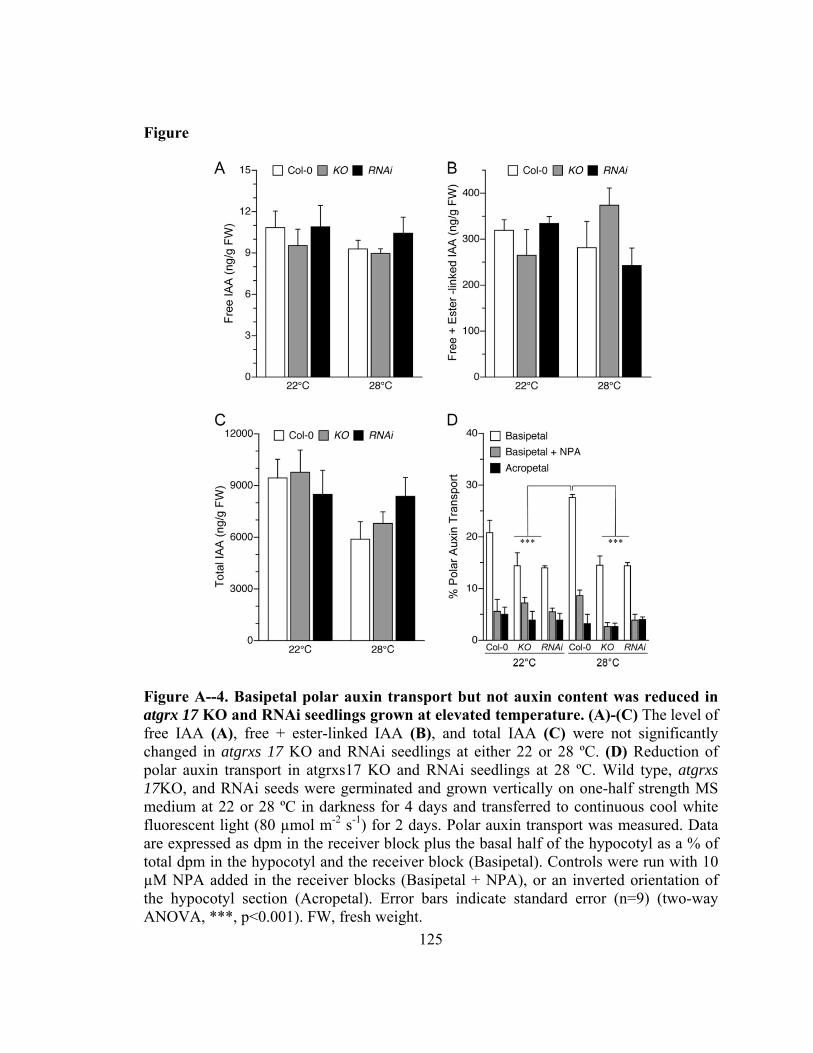
125
Figure
Figure A--4. Basipetal polar auxin transport but not auxin content was reduced in atgrx 17 KO and RNAi seedlings grown at elevated temperature. (A)-(C) The level of free IAA (A), free + ester-linked IAA (B), and total IAA (C) were not significantly changed in atgrxs 17 KO and RNAi seedlings at either 22 or 28 ºC. (D) Reduction of polar auxin transport in atgrxs17 KO and RNAi seedlings at 28 ºC. Wild type, atgrxs 17KO, and RNAi seeds were germinated and grown vertically on one-half strength MS medium at 22 or 28 ºC in darkness for 4 days and transferred to continuous cool white fluorescent light (80 µmol m-2 s-1) for 2 days. Polar auxin transport was measured. Data are expressed as dpm in the receiver block plus the basal half of the hypocotyl as a % of total dpm in the hypocotyl and the receiver block (Basipetal). Controls were run with 10 µM NPA added in the receiver blocks (Basipetal + NPA), or an inverted orientation of the hypocotyl section (Acropetal). Error bars indicate standard error (n=9) (two-way ANOVA, ***, p<0.001). FW, fresh weight.
126
D.
Unifoliata-Afila Interactions in Pea Leaf Morphogenesis
Darleen A. DeMason§, Venkateswari Chetty, Lana S. Barkawi, Xing Liu, and Jerry D.
Cohen
§ Corresponding author; Botany and Plant Sciences, University of California, Riverside,
California, USA
Manuscript in preparation
Abstract
Processes of leaf morphogenesis provide the basis for the great diversity of leaf form
among higher plants. The common garden pea provides a developmental model system
for understanding how gene and hormone interactions provide a large array of mutant
leaf phenotypes. We compared the range of leaf phenotypes on afila (af) and unifoliata
(uni) double mutants, measured auxin levels in shoot tips of a range of mutants, crossed
the DR5::GUS reporter into a range of leaf mutants and used qRT-PCR of four auxin-
regulated genes to understand the role of auxin in AF and UNI gene function and
interaction. The af/uni double mutants have intermediate levels of leaf complexity
between af and uni single mutants. The two mutants of UNI (uni-tac and uni) differ in the
auxin content of their shoot tips, auxin perception, and auxin transport. Auxin content of
the shoot tips of the af mutants is higher than that of wild type. The af mutants have
higher levels of auxin responsive genes and the uni mutants have lower expression
compared to wild type. AF and UNI have an antagonistic relationship. AF spreads into the
leaf tip in the absence of UNI, and UNI expression spreads into the pinna primordia in the
absence of AF. The mechanism may be modulation of auxin mediated by one or both
genes.
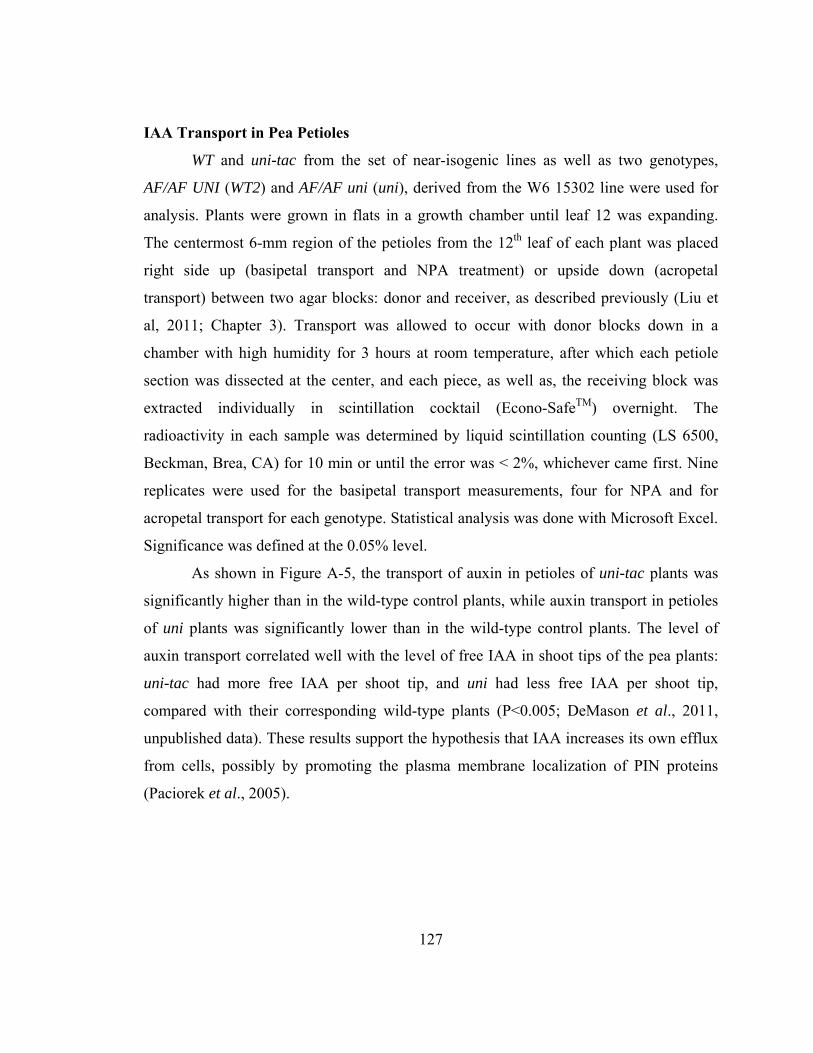
127
IAA Transport in Pea Petioles
WT and uni-tac from the set of near-isogenic lines as well as two genotypes,
AF/AF UNI (WT2) and AF/AF uni (uni), derived from the W6 15302 line were used for
analysis. Plants were grown in flats in a growth chamber until leaf 12 was expanding.
The centermost 6-mm region of the petioles from the 12th leaf of each plant was placed
right side up (basipetal transport and NPA treatment) or upside down (acropetal
transport) between two agar blocks: donor and receiver, as described previously (Liu et
al, 2011; Chapter 3). Transport was allowed to occur with donor blocks down in a
chamber with high humidity for 3 hours at room temperature, after which each petiole
section was dissected at the center, and each piece, as well as, the receiving block was
extracted individually in scintillation cocktail (Econo-SafeTM) overnight. The
radioactivity in each sample was determined by liquid scintillation counting (LS 6500,
Beckman, Brea, CA) for 10 min or until the error was < 2%, whichever came first. Nine
replicates were used for the basipetal transport measurements, four for NPA and for
acropetal transport for each genotype. Statistical analysis was done with Microsoft Excel.
Significance was defined at the 0.05% level.
As shown in Figure A-5, the transport of auxin in petioles of uni-tac plants was
significantly higher than in the wild-type control plants, while auxin transport in petioles
of uni plants was significantly lower than in the wild-type control plants. The level of
auxin transport correlated well with the level of free IAA in shoot tips of the pea plants:
uni-tac had more free IAA per shoot tip, and uni had less free IAA per shoot tip,
compared with their corresponding wild-type plants (P<0.005; DeMason et al., 2011,
unpublished data). These results support the hypothesis that IAA increases its own efflux
from cells, possibly by promoting the plasma membrane localization of PIN proteins
(Paciorek et al., 2005).
128
Figure
Figure A--5. Polar auxin transport in petioles of expanding leaves for uni-tac compared to its control (WTM) and uni and its control (WT2). Mean basipetal (nine replicates), basipetal + NPA (four replicates) and acropetal (four replicates) auxin transport and standard errors in petioles of expanding leaves for uni-tac compared to its control (WTM) and uni and its control (WT2). The asterisk (*) indicates a statistically significant difference relative to wild-type as determined by student’s t test (P<0.05).
129
E.
The Endoplasmic Reticulum Localized PIN8 Modulates Cell and Plant
Development by Regulating Intracellular Auxin Homeostasis
Cristina Dal Bosco, Alexander Dovzhenko, Xing Liu, Nina Woerner, Tatiana Rensch,
Margitta Eismann, Stefan Eimer, Jan Hegermann, Ivan Paponov, Benedetto Ruperti,
Alisher Touraev, Jerry D. Cohen, Klaus Palme§
§ Corresponding author; Insitute of Biology II, Molecular Plant Physiology, Faculty of
Biology, Albert-Ludwigs University Freiburg, Freiburg, Germany
1. Poster abstract published in 22nd International Conference on Arabidopsis Research;
Madison, Wisconsin, June 22-25, 2011 (Abstract Number: 386)
2. Manuscript in preparation
Abstract
The plant hormone auxin is a mobile signal which effects nuclear transcription by
regulating the stability of AUX/IAA repressor proteins. Auxin is polarly transported from
cell to cell by auxin efflux proteins of the PIN family, but it is not clear how auxin levels
are regulated within cells and how auxin access to the nucleus is controlled. The
Arabidopsis genome contains eight PIN genes, encoding proteins with a similar
membrane topology. While five of them are typically targeted polarly to plasma
membranes, the smallest members of the family, PIN5 and PIN8, seem to be located not
at the plasma membrane, but at internal membranes. Here we demonstrate by electron-
microscopic analysis that PIN8 which is specifically expressed in pollen resides in the
endoplasmic reticulum membrane and that it remains internally localized during pollen
tube growth. Dominant mutants were generated by overexpressing functional PIN8 and
its role in control of auxin homeostasis was tested in transgenic Arabidopsis and tobacco
plants. Plants with elevated PIN8 levels showed strong auxin related phenotypes with
reduced overall size, hyponastic leaves and longer vegetative growth periods. The
severity of phenotypes depended on protein levels, suggesting a rate-limiting activity of
130
PIN8. Phenotypes were correlated with elevated levels of free IAA and ester-conjugated
IAA. Activation of the auxin-regulated synthetic DR5 promoter was strongly repressed in
seedlings with elevated PIN8 levels when exposed to externally applied 1-NAA. Thus
our data show a novel function of endoplasmic reticulum-localized PIN8 in controlling
auxin thresholds in nucleus, thereby regulating auxin-dependent transcriptional activity.
Quantification of Free and Conjugated IAA in Tobacco Tissues
Tobacco leaf tissue, cotyledons and pollen grains from plants grown on soil, and
roots from seedlings grown on plates were collected, weighted and immediately frozen in
liquid nitrogen. Each type of frozen tissue was homogenized using a Mixer Mill (MM
300; Qiagen, Valencia, CA), with a 3 mm tungsten carbide bead in 300 µl
homogenization buffer (35% of 0.2 M imidazole, 65% isopropanol, pH 7) containing
known amount of [13C6]IAA as an internal standard. After 1 hr on ice, 150 µl of the
homogenate was purified through two sequential solid phase extraction columns and
analyzed by GC-SIM-MS as previously described (Barkawi et al., 2010). The level of
free IAA was quantified by isotope dilution analysis based on the [13C6]IAA internal
standard.
For the rest of the homogenate, 100 µl was hydrolyzed in 1 N NaOH (1 hr, room
temperature) for measurement of free plus ester-linked IAA, and 50 µl was hydrolyzed in
7 N NaOH (3 hours, 100 ºC under nitrogen gas) for measurement of total IAA (Bialek
and Cohen, 1989). After hydrolysis, the pH of the homogenate was adjusted to 2.7, and
was desalted by passing through a C18 SPE column (100 mg; Varian), washed with 3 ×
0.6 ml water, eluted with 3 × 0.3 ml methanol, evaporated to dryness, and dissolved in
150 µl homogenization buffer. The purification of IAA released from the conjugates was
subsequently the same as used for the purification of free IAA. The samples were
analyzed using GC-SIM-MS, and the levels of free plus ester-linked IAA and total IAA
were determined by isotope dilution analysis based on the [13C6]IAA internal standard.
As shown in Figure A-6A, tobacco plants overexpressing Arabidopsis PIN8
contained significantly more free and ester-linked IAA, compared with the wild-type
131
plants. This effect was stronger in fully developed leaves compared with cotyledons.
However, the level of free IAA in PIN8OX tobacco roots was significantly lower than in
the wild-type roots (Figure A-6B). These results suggest that changes in the activity of
ER-localized PIN8 lead to changes in both IAA levels and IAA metabolism, which is
likely a consequence of altered intracellular distribution of IAA. Also, this effect was
different in shoots and roots, suggesting that the regulation of IAA metabolism differs in
different tissue and/or cell types. In addition, Figure A-6C illustrates the different
composition of IAA pools in different tobacco tissues. In cotyledons, the level of free
IAA was 1.2 ng/g, which represented 1.4% of the total IAA (free + ester-linked + amide-
linked IAA) pool; in anthers, the level of free IAA was 45 ng/g, which represented 2.2%
of the total IAA pool; and in pollen, the level of free IAA was 177 ng/g, which
represented 11% of the total IAA pool. These results further support the hypothesis that
different plant tissues differently regulate IAA metabolism.
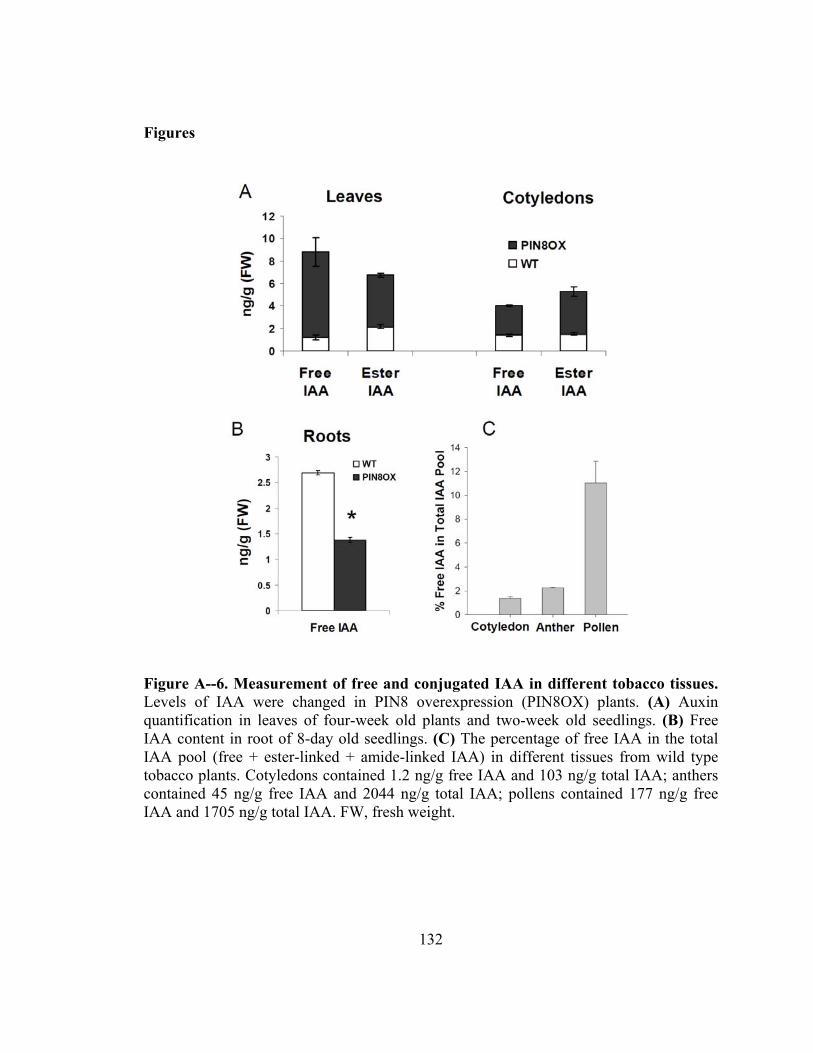
132
Figures
Figure A--6. Measurement of free and conjugated IAA in different tobacco tissues. Levels of IAA were changed in PIN8 overexpression (PIN8OX) plants. (A) Auxin quantification in leaves of four-week old plants and two-week old seedlings. (B) Free IAA content in root of 8-day old seedlings. (C) The percentage of free IAA in the total IAA pool (free + ester-linked + amide-linked IAA) in different tissues from wild type tobacco plants. Cotyledons contained 1.2 ng/g free IAA and 103 ng/g total IAA; anthers contained 45 ng/g free IAA and 2044 ng/g total IAA; pollens contained 177 ng/g free IAA and 1705 ng/g total IAA. FW, fresh weight.
133
F.
Role for Apyrases in Polar Auxin Transport in Arabidopsis
Xing Liu*, Jian Wu*, Greg Clark*, Minhui Lim, David Arnold, Gary Gardner, Stanley J.
Roux§
* Denotes equal contribution
§ Corresponding author; Section of Molecular Cell and Developmental Biology,
University of Texas, Austin, Texas, USA
1. Poster abstract published in Plant Biology 2011, Annual Meeting of the American
Society of Plant Biologists, Minneapolis, Minnesota, August 6-10, 2011
(Poster abstract link, http://abstracts.aspb.org/pb2011/public/P20/P20041.html)
2. Manuscript in preparation
Abstract
Included in the recent evidence that extracellular nucleotides regulate plant growth is the
discovery that exogenous ATP can block auxin transport and gravitropic growth in
primary roots of Arabidopsis. Cells limit the concentration of extracellular ATP in part
through the activity of ectoapyrases (ecto-nucleoside triphosphate diphosphohydrolases),
and two nearly identical Arabidopsis apyrases, APY1 and APY2, appear to share this
function. These findings, plus the fact that suppression of APY1 and APY2 blocks
growth in Arabidopsis, suggested that the expression of these apyrases could influence
auxin transport. This report tests that hypothesis. The polar movement of [3H]IAA in
Arabidopsis hypocotyl sections was measured after applying [3H]IAA in donor blocks to
the apical end of the sections. This assay revealed that basipetal auxin transport was
greatly reduced in apy2 null mutants when they were induced by estradiol to suppress the
expression of APY1 by RNAi. In these plants the basal halves of hypocotyls contained
considerably lower free IAA levels when compared to wild-type plants, and there were
significant morphological abnormalities in the primary root, consistent with disrupted
auxin transport. When a GFP fluorescence signal encoded by a DR5:GFP construct was
134
measured in these mutants after apyrase suppression, their primary roots showed no
signal asymmetry following gravistimulation, and both their growth and gravitropic
curvature were inhibited. Chemicals that suppress apyrase activity also inhibit gravitropic
curvature and, to a lesser extent, growth. Taken together these results indicate that a
critical step connecting apyrase suppression to growth suppression is the inhibition of
polar auxin transport.
Polar Auxin Transport in Arabidopsis Hypocotyls
Wild type and an apy2 mutant containing an inducible RNAi construct targeting
APY1 in the Wassilewskija (Ws) ecotype were the same as previously described (Wu et
al., 2007). Seeds were surface-sterilized and plated on MS medium containing 1%
sucrose. To induce expression of the RNAi constructs, 4 µM estradiol (Sigma) was
supplied in the growth medium (Wu et al., 2007). After 3 days in the dark at 4 °C and 12
h under cool white fluorescent lights (photosynthetically active radiation = 80 µmol m-2 s-
1), the seeds were grown at 24 °C continuously in darkness for 6 days and then exposed
to continuous cool white fluorescent lights (photosynthetically active radiation = 80 µmol
m-2 s-1) for an additional 2 days. The basipetal IAA transport in hypocotyl tissues was
measured as previously described (Liu et al., 2011, see also Chapter 3).
As shown in Figure A-7A, polar auxin transport in the apy2 single mutant
hypocotyl [RNAi (-)] was not different from the wild type control [Ws (-)]. However,
when the expression of RNAi was induced by estradiol [RNAi (+)], polar auxin transport
was dramatically decreased compared with the wild type control treated with estradiol
[Ws(+)]. These results suggest that the activities of APY1 and APY2 are required for
auxin transport in Arabidopsis hypocotyls.
Quantification of Free IAA in Arabidopsis Seedlings
The wild-type and transformed plants were grown exactly as described above.
After two-days of growth under continuous white light, the apices, apical halves of
hypocotyl tissues, and basal halves of the hypocotyl tissues were harvested separately,
135
with a minimum of 20 mg fresh weight per sample. The frozen tissue samples were
homogenized using a Mixer Mill (MM 300; Qiagen, Valencia, CA), with a 3-mm
tungsten carbide bead in 150 µl of homogenization buffer (35% of 0.2 M imidazole, 65%
isopropanol, pH 7) containing 4 ng of [13C6]IAA as the internal standard. The level of
free IAA was analyzed by solid phase extraction followed by GC-SIM-MS as previously
described (Barkawi et al., 2010).
As shown in Figure A-7B, when the expression of RNAi in apy2 mutant was
induced by estradiol, a condition that led to significant reduction of auxin transport
(Figure A-7A), free IAA content was significantly reduced in the basal half of hypocotyl
tissues compared with the wild type control [Ws (+estradiol)]. The free IAA level was
not changed in the apical half hypocotyl tissues but was increased in the apices tissues at
a marginally significant level (P=0.076, n=3, student’s t test). These results suggest that
the defect in hypocotyl auxin transport resulting from disrupted apyrase activities leads to
altered distribution of free IAA in plant tissues, especially a reduction of free IAA supply
in the lower part of the plant.
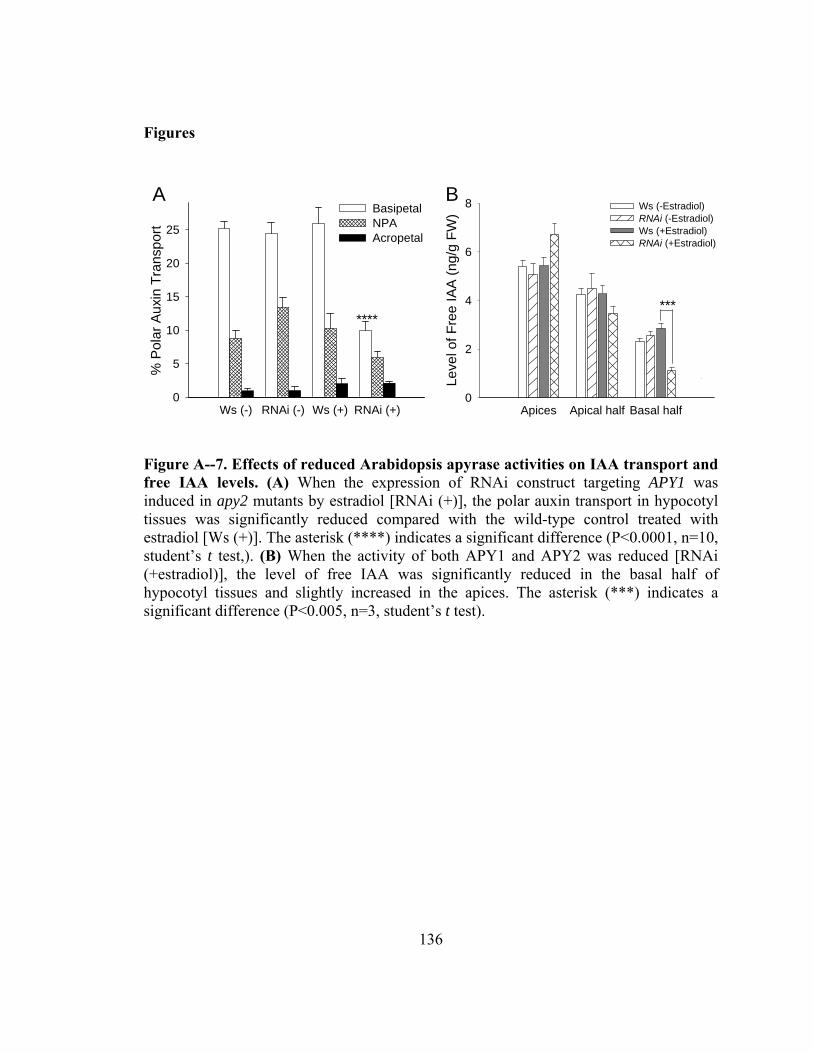
136
Figures
Ws (-) RNAi (-) Ws (+) RNAi (+)
% P
olar
Au
xin
Tra
nsp
ort
0
5
10
15
20
25
Basipetal NPA Acropetal
****
Apices Apical half Basal half
Leve
l of
Fre
e IA
A (
ng/
g F
W)
0
2
4
6
8 Ws (-Estradiol) RNAi (-Estradiol) Ws (+Estradiol) RNAi (+Estradiol)
***
A B
Figure A--7. Effects of reduced Arabidopsis apyrase activities on IAA transport and free IAA levels. (A) When the expression of RNAi construct targeting APY1 was induced in apy2 mutants by estradiol [RNAi (+)], the polar auxin transport in hypocotyl tissues was significantly reduced compared with the wild-type control treated with estradiol [Ws (+)]. The asterisk (****) indicates a significant difference (P<0.0001, n=10, student’s t test,). (B) When the activity of both APY1 and APY2 was reduced [RNAi (+estradiol)], the level of free IAA was significantly reduced in the basal half of hypocotyl tissues and slightly increased in the apices. The asterisk (***) indicates a significant difference (P<0.005, n=3, student’s t test).
137
Bibliography
Aloni R (2010) The induction of vascular tissues by auxin. In P Davies, ed, Plant Hormones, Ed 3. Springer, Dordrecht, The Netherlands, pp 485-518
Andrieux J, Demirci UB, Hannauer J, Gervais C, Goutaudier C, Miele P (2011) Spontaneous hydrolysis of sodium borohydride in harsh conditions. International Journal of Hydrogen Energy 36: 224-233
Baldi BG, Maher BR, Cohen JD (1989) Hydrolysis of indole-3-acetic acid esters exposed to mild alkaline conditions. Plant Physiology 91: 9-12
Baldi BG, Maher BR, Slovin JP, Cohen JD (1991) Stable isotope labeling in vivo of D- and L- tryptophan pools in Lemna gibba and the low incorporation of label into indole-3-acetic acid. Plant Physiology 95: 1203-1208
Bandurski RS, Schulze A, Cohen JD (1977) Photo-regulation of the ratio of ester to free indole-3-acetic acid. Biochemical and Biophysical Research Communications 79: 1219-1223
Baraldi R, Bertazza G, Bregoli AM, Fasolo F, Rotondi A, Predieri S, Serafinifracassini D, Slovin JP, Cohen JD (1995) Auxins and polyamines in relation to differential in vitro root induction on microcuttings of two pear cultivars. Journal of Plant Growth Regulation 14: 49-59
Barkawi LS, Cohen JD (2010) A method for concurrent diazomethane synthesis and substrate methylation in a 96-sample format. Nature Protocols 5: 1619-1626
Barkawi LS, Tam YY, Tillman JA, Normanly J, Cohen JD (2010) A high-throughput method for the quantitative analysis of auxins. Nature Protocols 5: 1609-1618
Barkawi LS, Tam YY, Tillman JA, Pederson B, Calio J, Al-Amier H, Emerick M, Normanly J, Cohen JD (2008) A high-throughput method for the quantitative analysis of indole-3-acetic acid and other auxins from plant tissue. Analytical Biochemistry 372: 177-188
Barker-Bridgers M, Ribnicky DM, Cohen JD, Jones AM (1998) Red light-regulated growth: changes in the abundance of indoleacetic acid in the maize (Zea mays L.) mesocotyl. Planta 204: 207-211
138
Bayer EM, Smith RS, Mandel T, Nakayama N, Sauer M, Prusinkiewicz P, Kuhlemeier C (2009) Integration of transport-based models for phyllotaxis and midvein formation. Genes & Development 23: 373-384
Behringer FJ, Davies PJ (1992) Indole-3-acetic acid levels after phytochrome-mediated changes in the stem elongation rate of dark-and light-grown Pisum seedlings. Planta 188: 85-92
Bhalerao RP, Eklof J, Ljung K, Marchant A, Bennett M, Sandberg G (2002) Shoot-derived auxin is essential for early lateral root emergence in Arabidopsis seedlings. Plant Journal 29: 325-332
Bialek K, Cohen JD (1989) Quantitation of indoleacetic acid conjugates in bean seeds by direct tissue hydrolysis. Plant Physiology 90: 398-400
Bialek K, Cohen JD (1992) Amide-linked indoleacetic acid conjugates may control levels of indoleacetic acid in germinating seedlings of Phaseolus vulgaris. Plant Physiology 100: 2002-2007
Briggs WR, Olney MA (2001) Photoreceptors in plant photomorphogenesis to date. Five phytochromes, two cryptochromes, one phototropin, and one superchrome. Plant Physiology 125: 85-88
Casal JJ, Sanchez RA, Botto JF (1998) Modes of action of phytochromes. Journal of Experimental Botany 49: 127-138
Chen WP, Yang XY, Hegeman AD, Gray WM, Cohen JD (2010) Microscale analysis of amino acids using gas chromatography-mass spectrometry after methyl chloroformate derivatization. Journal of Chromatography B-Analytical Technologies in the Biomedical and Life Sciences 878: 2199-2208
Chisnell JR, Bandurski RS (1988) Translocation of radiolabeled indole-3-acetic acid and indole-3-acetyl-myo-inositol from kernel to shoot of Zea mays L. Plant Physiology 86: 79-84
Christopher D (2003) Photosensory pathways regulating chloroplast gene expression. In M Abdel-Mottaleb, H Nalwa, eds, Handbook of Photochemistry and Photobiology, Vol 4. American Scientific Publishers, Valencia, CA, pp 249-268
Clark G, Wu J, Liu X, Pham T, Cervantes A, Cohen J, Gardner G, Rowx S (2011) Role for ectoapyrases in gravitropic responses and polar auxin transport in Arabidopsis In Plant Biology 2011, Annual Meeting of the American Society of Plant Biologists, Minneapolis, Minnesota
139
Cohen JD (1984) Convenient apparatus for the generation of small amounts of diazomethane. Journal of Chromatography 303: 193-196
Cohen JD, Baldi BG, Slovin JP (1986) 13C6-[Benzene ring]-indole-3-acetic acid - a new internal standard for quantitative mass-spectral analysis of indole-3-acetic-acid in plants. Plant Physiology 80: 14-19
Cohen JD, Schulze A (1981) Double-standard isotope dilution assay. I. Quantitative assay of indole-3-acetic acid. Analytical Biochemistry 112: 249-257
Cooney TP, Nonhebel HM (1991) Biosynthesis of indole-3-acetic-acid in tomato shoots: Measurement, mass-spectral identification and incorporation of 2H from 2H2O into indole-3-acetic acid, D- and L-tryptophan, indole-3-pyruvate and tryptamine. Planta 184: 368-376
Cordonnier MM, Pratt LH (1982) Immunopurification and initial characterization of dicotyledonous phytochrome. Plant Physiology 69: 360-365
Dal Bosco C, Dovzhenko A, Woerner N, Liu X, Resch T, Hegermann J, Eismann M, Touraev A, Heberle-Bors E, Paponov I, Ruperti B, Cohen J, Palme K (2011) ER-localized PIN8 modulates cell and plant development by regulating intracellular auxin homeostasis. In 22nd International Conference on Arabidopsis Research, Madison, Wisconsin
Darwin CR, Darwin F (1881) The power of movement in plants. Appleton, New York
Davies NW, Smith JA, Molesworth PP, Ross JJ (2010) Hydrogen/deuterium exchange on aromatic rings during atmospheric pressure chemical ionization mass spectrometry. Rapid Communications in Mass Spectrometry 24: 1105-1110
DeMason DA, Chetty V, Barkawi LS, Liu X, Cohen J (2011) Unifoliata-Afila interactions in pea leaf morphogenesis. Manuscript in preparation
Ding ZJ, Galvan-Ampudia CS, Demarsy E, Langowski L, Kleine-Vehn J, Fan YW, Morita MT, Tasaka M, Fankhauser C, Offringa R, Friml J (2011) Light-mediated polarization of the PIN3 auxin transporter for the phototropic response in Arabidopsis. Nature Cell Biology 13: 447-U222
Epstein E, Ackerman A (1993) Transport and metabolism of indole-3-butyric acid in cuttings of Leucadendron discolor. Plant Growth Regulation 12: 17-22
Epstein E, Cohen JD, Bandurski RS (1980) Concentration and metabolic turnover of indoles in germinating kernels of Zea mays L. . Plant Physiology 65: 415-421
140
Epstein E, Cohen JD, Slovin JP (2002) The biosynthetic pathway for indole-3-acetic acid changes during tomato fruit development. Plant Growth Regulation 38: 16-21
Epstein E, Sagee O (1992) Effect of ethylene treatment on transport and metabolism of indole-3-butyric acid in citrus leaf midribs. Plant Growth Regulation 11: 357-362
Epstein E, Zilkah S, Faingersh G, Rotebaum A (1993) Transport and metabolism of indole-3-butyric acid in easy- and difficult-to-root cuttings of sweet cherry (Prunus avium L.). Acta Horticulturae 329: 292-295
Gardner G, Lin CT, Tobin EM, Loehrer H, Brinkman D (2009) Photobiological properties of the inhibition of etiolated Arabidopsis seedling growth by ultraviolet-B irradiation. Plant Cell and Environment 32: 1573-1583
Gardner G, Sanborn JR (1989) Aryl-substituted α-aminooxycarboxylic acids-A new class of auxin transport inhibitors. Plant Physiology 90: 291-295
Gibson RA, Schneider EA, Wightman F (1972) Biosynthesis and metabolism of Indol-3yl-acetic acid. Journal of Experimental Botany 23: 381-399
Goldsmith MHM (1982) A saturable site responsible for polar transport of indole-3-acetic acid in sections of maize coleoptiles. Planta 155: 68-75
Gottwald JR, Krysan PJ, Young JC, Evert RF, Sussman MR (2000) Genetic evidence for the in planta role of phloem-specific plasma membrane sucrose transporters. Proceedings of the National Academy of Sciences of the United States of America 97: 13979-13984
Gray WM, Ostin A, Sandberg G, Romano CP, Estelle M (1998) High temperature promotes auxin-mediated hypocotyl elongation in Arabidopsis. Proceedings of the National Academy of Sciences of the United States of America 95: 7197-7202
Grieneisen VA, Xu J, Maree AFM, Hogeweg P, Scheres B (2007) Auxin transport is sufficient to generate a maximum and gradient guiding root growth. Nature 449: 1008-1013
Hoecker U, Toledo-Ortiz G, Bender J, Quail PH (2004) The photomorphogenesis-related mutant red1 is defective in CYP83B1, a red light-induced gene encoding a cytochrome P450 required for normal auxin homeostasis. Planta 219: 195-200
Hoenicke K, Simat TJ, Steinhart H, Kohler HJ, Schwab A (2001) Determination of free and conjugated indole-3-acetic acid, tryptophan, and tryptophan metabolites in grape must and wine. Journal of Agricultural and Food Chemistry 49: 5494-5501
141
Howe GT, Gardner G, Hackett WP, Furnier GR (1996) Phytochrome control of short-day-induced bud set in black cottonwood. Physiologia Plantarum 97: 95-103
Iino M (1982) Action of red light on indole-3-acetic acid status and growth in coleoptiles of etiolated maize seedlings. Planta 156: 21-32
Iino M (1982) Inhibitory action of red light on the growth of the maize mesocotyl: evaluation of the auxin hypothesis. Planta 156: 388-395
Ikeda Y, Men SZ, Fischer U, Stepanova AN, Alonso JM, Ljung K, Grebe M (2009) Local auxin biosynthesis modulates gradient-directed planar polarity in Arabidopsis. Nature Cell Biology 11: 731-738
Ilić N, Normanly J, Cohen JD (1996) Quantification of free plus conjugated indoleacetic acid in arabidopsis requires correction for the nonenzymatic conversion of indolic nitriles. Plant Physiology 111: 781-788
Jensen PJ, Hangarter RP, Estelle M (1998) Auxin transport is required for hypocotyl elongation in light-grown but not dark-grown Arabidopsis. Plant Physiology 116: 455-462
Jones AM, Cochran DS, Lamerson PM, Evans ML, Cohen JD (1991) Red light-regulated growth: I. Changes in the abundance of indoleacetic acid and a 22-Kilodalton auxin-binding protein in the Maize mesocotyl. Plant Physiology 97: 352-358
Jones SE, DeMeo JS, Davies NW, Noonan SE, Ross JJ (2005) Stems of the Arabidopsis pin1-1 mutant are not deficient in free indole-3-acetic acid. Planta 222: 530-534
Kai K, Horita J, Wakasa K, Miyagawa H (2007) Three oxidative metabolites of indole-3-acetic acid from Arabidopsis thaliana. Phytochemistry 68: 1651-1663
Keuskamp DH, Pollmann S, Voesenek LACJ, Peeters AJM, Pierik R (2010) Auxin transport through PIN-FORMED 3 (PIN3) controls shade avoidance and fitness during competition. Proceedings of the National Academy of Sciences of the United States of America 107: 22740-22744
Koshiba T, Kamiya Y, Iino M (1995) Biosynthesis of indole-3-acetic acid from L-tryptophan in coleoptile tips of maize (Zea mays L). Plant and Cell Physiology 36: 1503-1510
Kowalczyk M, Sandberg G (2001) Quantitative analysis of indole-3-acetic acid metabolites in Arabidopsis. Plant Physiology 127: 1845-1853
142
Kraepiel Y, Miginiac E (1997) Photomorphogenesis and phytohormones. Plant Cell and Environment 20: 807-812
Laxmi A, Pan JW, Morsy M, Chen RJ (2008) Light plays an essential role in intracellular distribution of auxin efflux carrier PIN2 in Arabidopsis thaliana. Plos One 3
Lewis DR, Muday GK (2009) Measurement of auxin transport in Arabidopsis thaliana. Nat Protoc 4: 437-451
Li Y, Wu YH, Hagen G, Guilfoyle T (1999) Expression of the auxin-inducible GH3 Promoter GUS fusion gene as a useful molecular marker for auxin physiology. Plant and Cell Physiology 40: 675-682
Liu JH, Reid DM (1992) Adventitious rooting in hypocotyls of sunflower (Helianthus annuus) seedlings. IV. The role of changes in endogenous free and conjugated indole-3-acetic acid Physiologia Plantarum 86: 285-292
Liu X, Barkawi LS, Gardner G, Cohen JD (2012) Transport of indole-3-butyric acid and indole-3-acetic acid in Arabidopsis thaliana hypocotyls using stable isotope labeling. Plant Physiology
Liu X, Cohen JD, Gardner G (2011) Low-fluence red light increases the transport and biosynthesis of auxin. Plant Physiology 157: 891-904
Ljung K, Bhalerao RP, Sandberg G (2001) Sites and homeostatic control of auxin biosynthesis in Arabidopsis during vegetative growth. Plant Journal 28: 465-474
Ljung K, Hull AK, Celenza J, Yamada M, Estelle M, Nonmanly J, Sandberg G (2005) Sites and regulation of auxin biosynthesis in Arabidopsis roots. Plant Cell 17: 1090-1104
Ljung K, Ostin A, Lioussanne L, Sandberg G (2001) Developmental regulation of indole-3-acetic acid turnover in Scots pine seedlings. Plant Physiology 125: 464-475
Long C, Iino M (2001) Light-dependent osmoregulation in pea stem protoplasts. Photoreceptors, tissue specificity, ion relationships, and physiological implications. Plant Physiology 125: 1854-1869
Ludwig-Müller J (2000) Indole-3-butyric acid in plant growth and development. Plant Growth Regulation 32: 219-230
143
Ludwig-Müller J (2007) Indole-3-butyric acid synthesis in ecotypes and mutants of Arabidopsis thaliana under different growth conditions. Journal of Plant Physiology 164: 47-59
Ludwig-Müller J, Epstein E (1993) Indole-3-butyric acid in Arabidopsis thaliana. II. In vivo metabolism. Plant Growth Regulation 13: 189-195
Ludwig-Müller J, Hilgenberg W, Epstein E (1995) The in vitro biosynthesis of indole-3-butyric acid in maize. Phytochemistry 40: 61-68
Ludwig-Müller J, Raisig A, Hilgenberg W (1995) Uptake and transport of indole-3-butyric acid in Arabidopsis thaliana: comparison with other natural and synthetic auxins. Journal of Plant Physiology 147: 351-354
Ludwig-Müller J, Sass S, Sutter EG, Wodner M, Epstein E (1993) Indole-3-butyric acid in Arabidopsis thaliana. I. Identification and quantification. Plant Growth Regulation 13: 179-187
Magnus V, Bandurski RS, Schulze A (1980) Synthesis of 4,5,6,7 and 2,4,5,6,7 deuterium-labeled indole-3-acetic acid for use in mass spectrometric assays. Plant Physiology 66: 775-781
Marx M, Djerassi C (1968) Mass spectrometry in structural and stereochemical problems. CXLIX. The question of ring expansion in the fragmentation of 13C-labeled nitrogen heterocycles. journal of the American Chemical Society 90: 678-681
Mashiguchi K, Tanaka K, Sakai T, Sugawara S, Kawaide H, Natsume M, Hanada A, Yaeno T, Shirasu K, Yao H, McSteen P, Zhao Y, Hayashi K, Kamiya Y, Kasahara H (2011) The main auxin biosynthesis pathway in Arabidopsis. Proceedings of the National Academy of Sciences of the United States of America 108: 18512-18517
Mattsson J, Sung ZR, Berleth T (1999) Responses of plant vascular systems to auxin transport inhibition. Development 126: 2979-2991
Michalczuk L, Cooke TJ, Cohen JD (1992) Auxin levels at different stages of carrot somatic embryogenesis. Phytochemistry 31: 1097-1103
Miller AN, Walsh CS, Cohen JD (1987) Measurement of indole-3-acetic acid in peach fruits (Prunus Persica L. Batsch cv Redhaven) during development. Plant Physiology 84: 491-494
Mravec J, Skůpa P, Bailly A, Hoyerová K, Krecek P, Bielach A, Petrásek J, Zhang J, Gaykova V, Stierhof YD, Dobrev PI, Schwarzerová K, Rolcík J, Seifertová
144
D, Luschnig C, Benková E, Zazímalová E, Geisler M, Friml J (2009) Subcellular homeostasis of phytohormone auxin is mediated by the ER-localized PIN5 transporter. Nature 459: 1136-U1127
Nagashima A, Uehara Y, Sakai T (2008) The ABC subfamily B auxin transporter AtABCB19 is involved in the inhibitory effects of N-1-Naphthyphthalamic acid on the phototropic and gravitropic responses of Arabidopsis hypocotyls. Plant and Cell Physiology 49: 1250-1255
Neff MM, Fankhauser C, Chory J (2000) Light: an indicator of time and place. Genes & Development 14: 257-271
Negi S, Sukumar P, Liu X, Cohen JD, Muday GK (2010) Genetic dissection of the role of ethylene in regulating auxin-dependent lateral and adventitious root formation in tomato. Plant Journal 61: 3-15
Nishimura T, Mori Y, Furukawa T, Kadota A, Koshiba T (2006) Red light causes a reduction in IAA levels at the apical tip by inhibiting de novo biosynthesis from tryptophan in maize coleoptiles. Planta 224: 1427-1435
Normanly J, Cohen JD, Fink GR (1993) Arabidopsis thaliana auxotrophs reveal a tryptophan-independent biosynthetic pathway for indole-3-acetic acid. Proceedings of the National Academy of Sciences of the United States of America 90: 10355-10359
Normanly J, Slovin J, Cohen J (2005) Auxin biosynthesis and metabolism. In P Davies, ed, Plant Hormones: Biosynthesis, Signal Transduction, Action! Kluwer Academic Publishers, Dordrecht, The Netherlands, pp 36-62
Nowacki J, Bandurski RS (1980) Myo-inositol esters of indole-3-acetic acid as seed auxin precursors of Zea mays L. Plant Physiology 65: 422-427
Okada K, Ueda J, Komaki MK, Bell CJ, Shimura Y (1991) Requirement of the auxin polar transport system in early stages of Arabidopsis floral bud formation. Plant Cell 3: 677-684
Ostin A, Kowalyczk M, Bhalerao RP, Sandberg G (1998) Metabolism of indole-3-acetic acid in Arabidopsis. Plant Physiology 118: 285-296
Paciorek T, Zazímalová E, Ruthardt N, Petrásek J, Stierhof YD, Kleine-Vehn J, Morris DA, Emans N, Jürgens G, Geldner N, Friml J (2005) Auxin inhibits endocytosis and promotes its own efflux from cells. Nature 435: 1251-1256
Peer WA, Blakeslee JJ, Yang HB, Murphy AS (2011) Seven things we think we know about auxin transport. Molecular Plant 4: 487-504
145
Petrásek J, Friml J (2009) Auxin transport routes in plant development. Development 136: 2675-2688
Phillips KA, Skirpan AL, Liu X, Christensen A, Slewinski TL, Hudson C, Barazesh S, Cohen JD, Malcomber S, McSteen P (2011) vanishing tassel2 encodes a grass-specific tryptophan aminotransferase required for vegetative and reproductive development in maize. Plant Cell 23: 550-566
Pratt LH, Briggs WR (1966) Photochemical and nonphotochemical reactions of phytochrome in vivo. Plant Physiology 41: 467-474
Rapparini F, Tam YY, Cohen JD, Slovin JP (2002) Indole-3-acetic acid metabolism in Lemna gibba undergoes dynamic changes in response to growth temperature. Plant Physiology 128: 1410-1416
Rashotte AM, Poupart J, Waddell CS, Muday GK (2003) Transport of the two natural auxins, indole-3-butyric acid and indole-3-acetic acid, in Arabidopsis. Plant Physiology 133: 761-772
Reed RC, Brady SR, Muday GK (1998) Inhibition of auxin movement from the shoot into the root inhibits lateral root development in arabidopsis. Plant Physiology 118: 1369-1378
Ribnicky DM, Cooke TJ, Cohen JD (1998) A microtechnique for the analysis of free and conjugated indole-3-acetic acid in milligram amounts of plant tissue using a benchtop gas chromatograph mass spectrometer. Planta 204: 1-7
Ribnicky DM, Ilić N, Cohen JD, Cooke TJ (1996) The effects of exogenous auxins on endogenous indole-3-acetic acid metabolism (the implications for carrot somatic embryogenesis). Plant Physiology 112: 549-558
Ruzicka K, Strader LC, Bailly A, Yang HB, Blakeslee J, Langowski L, Nejedla E, Fujita H, Itoh H, Syono K, Hejatko J, Gray WM, Martinoia E, Geisler M, Bartel B, Murphy AS, Friml J (2010) Arabidopsis PIS1 encodes the ABCG37 transporter of auxinic compounds including the auxin precursor indole-3-butyric acid. Proceedings of the National Academy of Sciences of the United States of America 107: 10749-10753
Salisbury FJ, Hall A, Grierson CS, Halliday KJ (2007) Phytochrome coordinates Arabidopsis shoot and root development. Plant Journal 50: 429-438
Sanchezbravo J, Ortuno A, Acosta M, Sabater F (1988) In vivo metabolism of labeled indole-3-acetic acid during polar transport in etiolated hypocotyls of Lupinus albus: Relationship with growth. Plant Growth Regulation 7: 271-288
146
Seidel C, Walz A, Park S, Cohen JD, Ludwig-Muller J (2006) Indole-3-acetic acid protein conjugates: novel players in auxin homeostasis. Plant Biology 8: 340-345
Shen YP, Zhou ZZ, Feng SH, Li JG, Tan-Wilson A, Qu LJ, Wang HY, Deng XW (2009) Phytochrome A mediates rapid red light-induced phosphorylation of Arabidopsis FAR-RED ELONGATED HYPOCOTYL1 in a low fluence response. Plant Cell 21: 494-506
Shibasaki K, Uemura M, Tsurumi S, Rahman A (2009) Auxin response in Arabidopsis under cold stress: underlying molecular mechanisms. Plant Cell 21: 3823-3838
Shinkle JR, Kadakia R, Jones AM (1998) Dim-red-light-induced increase in polar auxin transport in cucumber seedlings. Plant Physiology 116: 1505-1513
Shinomura T, Nagatani A, Hanzawa H, Kubota M, Watanabe M, Furuya M (1996) Action spectra for phytochrome A- and B-specific photoinduction of seed germination in Arabidopsis thaliana. Proceedings of the National Academy of Sciences of the United States of America 93: 8129-8133
Sitbon F, Edlund A, Gardestrom P, Olsson O, Sandberg G (1993) Compartmentation of indole-3-acetic acid metabolism in protoplasts isolated from leaves of wild-type and IAA-overproducing transgenic tobacco plants. Planta 191: 274-279
Slovin JP, Bandurski RS, Cohen JD (1999) Auxin. In P Hooykaas, M Hall M, K Libbenga, eds, Biochemistry and Molecular Biology of Plant Hormones. Elsevier, Amsterdam, pp 115-140
Srivastava AC, Ganesan S, Ismail IO, Ayre BG (2008) Functional characterization of the Arabidopsis AtSUC2 sucrose/H+ symporter by tissue-specific complementation reveals an essential role in phloem loading but not in long-distance transport. Plant Physiology 148: 200-211
Staswick PE, Serban B, Rowe M, Tiryaki I, Maldonado MT, Maldonado MC, Suza W (2005) Characterization of an Arabidopsis enzyme family that conjugates amino acids to indole-3-acetic acid. Plant Cell 17: 616-627
Steindler C, Matteucci A, Sessa G, Weimar T, Ohgishi M, Aoyama T, Morelli G, Ruberti I (1999) Shade avoidance responses are mediated by the ATHB-2 HD-Zip protein, a negative regulator of gene expression. Development 126: 4235-4245
Stepanova AN, Yun J, Robles LM, Novak O, He W, Guo H, Ljung K, Alonso JM (2011) The Arabidopsis YUCCA1 flavin monooxygenase functions in the indole-3-pyruvic acid branch of auxin biosynthesis. Plant Cell 23: 3961-3973
147
Stowe-Evans EL, Luesse DR, Liscum E (2001) The enhancement of phototropin-induced phototropic curvature in Arabidopsis occurs via a photoreversible phytochrome A-dependent modulation of auxin responsiveness. Plant Physiology 126: 826-834
Strader LC, Bartel B (2011) Transport and metabolism of the endogenous auxin precursor indole-3-butyric acid. Molecular Plant 4: 477-486
Strader LC, Culler AH, Cohen JD, Bartel B (2010) Conversion of endogenous indole-3-butyric acid to indole-3-acetic acid drives cell expansion in Arabidopsis seedlings. Plant Physiology 153: 1577-1586
Strader LC, Wheeler DL, Christensen SE, Berens JC, Cohen JD, Rampey RA, Bartel B (2011) Multiple facets of Arabidopsis seedling development require indole-3-butyric acid-derived auxin. Plant Cell 23: 984-999
Sudi J (1966) Increases in the capacity of pea tissue to form acyl-aspartic acids specifically induced by auxins. New Phytologist 65: 9-21
Sugawara S, Hishiyama S, Jikumaru Y, Hanada A, Nishimura T, Koshiba T, Zhao Y, Kamiya Y, Kasahara H (2009) Biochemical analyses of indole-3-acetaldoxime-dependent auxin biosynthesis in Arabidopsis. Proceedings of the National Academy of Sciences of the United States of America 106: 5430-5435
Sutter EG, Cohen JD (1992) Measurement of indolebutyric acid in plant tissues by isotope dilution gas chromatography-mass spectrometry analysis. Plant Physiology 99: 1719-1722
Swarup K, Benková E, Swarup R, Casimiro I, Péret B, Yang Y, Parry G, Nielsen E, De Smet I, Vanneste S, Levesque MP, Carrier D, James N, Calvo V, Ljung K, Kramer E, Roberts R, Graham N, Marillonnet S, Patel K, Jones JDG, Taylor CG, Schachtman DP, May S, Sandberg G, Benfey P, Friml J, Kerr I, Beeckman T, Laplaze L, Bennett MJ (2008) The auxin influx carrier LAX3 promotes lateral root emergence. Nature Cell Biology 10: 946-954
Symons GM, Reid JB (2003) Hormone levels and response during de-etiolation in pea. Planta 216: 422-431
Sztein AE, Ilić N, Cohen JD, Cooke TJ (2002) Indole-3-acetic acid biosynthesis in isolated axes from germinating bean seeds: The effect of wounding on the biosynthetic pathway. Plant Growth Regulation 36: 201-207
Taiz L, Zeiger E (2006) Plant Physiology, Ed 4th. Sinauer Associates, Inc. , Sunderland, USA
148
Tam YY, Epstein E, Normanly J (2000) Characterization of auxin conjugates in arabidopsis. Low steady-state levels of indole-9-acetyl-aspartate indole-3-acetyl-glutamate, and indole-3-acetyl-glucose. Plant Physiology 123: 589-595
Tam YY, Normanly J (1998) Determination of indole-3-pyruvic acid levels in Arabidopsis thaliana by gas chromatography selected ion monitoring mass spectrometry. Journal of Chromatography A 800: 101-108
Tan X, Calderon-Villalobos LIA, Sharon M, Zheng CX, Robinson CV, Estelle M, Zheng N (2007) Mechanism of auxin perception by the TIR1 ubiquitin ligase. Nature 446: 640-645
Tao Y, Ferrer JL, Ljung K, Pojer F, Hong FX, Long JA, Li L, Moreno JE, Bowman ME, Ivans LJ, Cheng YF, Lim J, Zhao YD, Ballare CL, Sandberg G, Noel JP, Chory J (2008) Rapid synthesis of auxin via a new tryptophan-dependent pathway is required for shade avoidance in plants. Cell 133: 164-176
Thomson K-S, Hertel R, Müller S, Tavares JE (1973) 1-N-naphthylphthalamic acid and 2,3,5-triiodobenzoic acid. Planta 109: 337-352
Tian H, Baxter IR, Lahner B, Reinders A, Salt DE, Ward JM (2010) Arabidopsis NPCC6/NaKR1 is a phloem mobile metal binding protein necessary for phloem function and root meristem maintenance. Plant Cell 22: 3963-3979
Tognetti VB, Van Aken O, Morreel K, Vandenbroucke K, de Cotte BV, De Clercq I, Chiwocha S, Fenske R, Prinsen E, Boerjan W, Genty B, Stubbs KA, Inze D, Van Breusegem F (2010) Perturbation of indole-3-butyric acid homeostasis by the UDP-glucosyltransferase UGT74E2 modulates Arabidopsis architecture and water stress tolerance. Plant Cell 22: 2660-2679
Tuominen H, Ostin A, Sandberg G, Sundberg B (1994) A novel metabolic pathway for indole-3-acetic acid in apical shoots of Populus tremula (L.) x Populus tremuloides (Michx.). Plant Physiology 106: 1511-1520
Van Tuinen A, Kerckhoffs L, Nagatani A, Kendrick RE, Koornneef M (1995) A temporarily red light-insensitive mutant of tomato lacks a light-stable, B-like phytochrome. Plant Physiology 108: 939-947
van Tuinen A, Kerckhoffs LH, Nagatani A, Kendrick RE, Koornneef M (1995) Far-red light-insensitive, phytochrome A-deficient mutants of tomato. Mol Gen Genet 246: 133-141
Venis MA (1972) Auxin-induced conjugation systems in peas. Plant Physiology 49: 24-27
149
Vogel G (2006) Plant science - Auxin begins to give up its secrets. Science 313: 1230-1231
Weller JL, Perrotta G, Schreuder ME, van Tuinen A, Koornneef M, Giuliano G, Kendrick RE (2001) Genetic dissection of blue-light sensing in tomato using mutants deficient in cryptochrome 1 and phytochromes A, B1 and B2. Plant Journal 25: 427-440
Went F, White R (1938) Experiments of the transport of auxin. Botanical Gazette 100: 465-484
Went FW, Thimann KV (1937) Phytohormones. The Macmillan Company, New York
Wilkinson JQ, Lanahan MB, Yen HC, Giovannoni JJ, Klee HJ (1995) An ethylene-inducible component of signal-transduction encoded by never-ripe. Science 270: 1807-1809
Won C, Shen X, Mashiguchi K, Zheng Z, Dai X, Cheng Y, Kasahara H, Kamiya Y, Chory J, Zhao Y (2011) Conversion of tryptophan to indole-3-acetic acid by TRYPTOPHAN AMINOTRANSFERASES OF ARABIDOPSIS and YUCCAs in Arabidopsis. Proceedings of the National Academy of Sciences of the United States of America 108: 18518-18523
Woodward AW, Bartel B (2005) Auxin: regulation, action, and interaction. Ann Bot 95: 707-735
Wright AD, Sampson MB, Neuffer MG, Michalczuk L, Slovin JP, Cohen JD (1991) Indole-3-acetic acid biosynthesis in the mutant maize orange pericarp, a tryptophan auxotroph. Science 254: 998-1000
Wu J, Steinebrunner I, Sun Y, Butterfield T, Torres J, Arnold D, Gonzalez A, Jacob F, Reichler S, Roux SJ (2007) Apyrases (nucleoside triphosphate-diphosphohydrolases) play a key role in growth control in Arabidopsis. Plant Physiology 144: 961-975
Yang T, Davies PJ (1999) Promotion of stem elongation by indole-3-butyric acid in intact plants of Pisum sativum L. Plant Growth Regulation 27: 157-160
Yang YD, Hammes UZ, Taylor CG, Schachtman DP, Nielsen E (2006) High-affinity auxin transport by the AUX1 influx carrier protein. Current Biology 16: 1123-1127
Zelena E (2000) The effect of light on IAA metabolism in different parts of maize seedlings in correlation with their growth. Plant Growth Regulation 32: 239-243
150
Zelena E (2000) The effect of light on metabolism of IAA in maize seedlings. Plant Growth Regulation 30: 23-29
Zeng JX, Wang QM, Lin JZ, Deng KQ, Zhao XY, Tang DY, Liu X (2010) Arabidopsis cryptochrome-1 restrains lateral roots growth by inhibiting auxin transport. Journal of Plant Physiology 167: 670-673
Zhao YD (2010) Auxin biosynthesis and its role in plant development. Annual Review of Plant Biology 61: 49-64


