
Article
Role of the Cerebellum in
Adaptation to DelayedAction EffectsHighlights
d Adaptation of M100 attenuation for delayed action effects
was localized in cerebellum
d Cerebellar stimulation abolished the adaptation of M100
attenuation
d M200 attenuation reversed after cerebellar stimulation
d Cerebellar low-frequency activity may be important for
forward model updating
Cao et al., 2017, Current Biology 27, 1–10August 21, 2017 ª 2017 The Author(s). Published by Elsevier Ltdhttp://dx.doi.org/10.1016/j.cub.2017.06.074
Authors
Liyu Cao, Domenica Veniero,
Gregor Thut, Joachim Gross
In Brief
Cao et al. show that the adaptation to
delayed action effects disappears after
an inhibitory cerebellar stimulation with
TMS, highlighting the cerebellum’s role in
forward model updating. The stimulation
also changes cerebellar low-frequency
activity and evokes responses in the
frontal brain area, suggesting a
processing hierarchy for prediction
errors.
.
Please cite this article in press as: Cao et al., Role of the Cerebellum in Adaptation to Delayed Action Effects, Current Biology (2017), http://dx.doi.org/10.1016/j.cub.2017.06.074
Current Biology
Article
Role of the Cerebellumin Adaptation to Delayed Action EffectsLiyu Cao,1,2,3,5,* Domenica Veniero,1,2 Gregor Thut,1,2,4 and Joachim Gross1,2,41School of Psychology, University of Glasgow, Glasgow G12 8QB, UK2Institute of Neuroscience and Psychology, University of Glasgow, Glasgow G12 8QB, UK3Department of Psychology (III), University of Wurzburg, 97070 Wurzburg, Germany4These authors contributed equally5Lead Contact
*Correspondence: [email protected]
http://dx.doi.org/10.1016/j.cub.2017.06.074
SUMMARY
Actions are typically associated with sensory conse-quences. For example, knocking at a door resultsin predictable sounds. These self-initiated sensorystimuli are known to elicit smaller cortical responsescompared to passively presented stimuli, e.g., earlyauditory evoked magnetic fields known as M100and M200 components are attenuated. Currentmodels implicate the cerebellum in the predictionof the sensory consequences of our actions. How-ever, causal evidence is largelymissing. In this study,we introduced a constant delay (of 100 ms) betweenactions and action-associated sounds, and werecorded magnetoencephalography (MEG) data asparticipants adapted to the delay. We found anincrease in the attenuation of the M100 componentover time for self-generated sounds, which indi-cates cortical adaptation to the introduced delay. Incontrast, no change in M200 attenuation was found.Interestingly, disrupting cerebellar activity via trans-cranial magnetic stimulation (TMS) abolished theadaptation of M100 attenuation, while the M200attenuation reverses to an M200 enhancement. Ourresults provide causal evidence for the involvementof the cerebellum in adapting to delayed actioneffects, and thus in the prediction of the sensoryconsequences of our actions.
INTRODUCTION
Self-generated stimuli are ubiquitous in everyday life. As I am
typing these words, every stroke on the keyboard generates
predictable visual (i.e., the character), somatosensory (i.e., the
fingertip tap), and auditory (i.e., the keyboard click) conse-
quences. Such sensory events resulting from voluntary actions
elicit smaller brain responses as compared to the same events
when they are externally generated. This phenomenon is known
as sensory attenuation [1, 2]. For example, the amplitude of early
cortical responses to a tone peaking at around 100/200 ms after
sound onset (known as M100/M200 components in magnetoen-
cephalography [MEG] recordings) is smaller for self-generated
Current Biology 27, 1–10, AThis is an open access article und
tones than for external tones [1–4]. When a perturbation is intro-
duced between actions and the ensuing sound (e.g., by adding a
delay between an action and the onset of the tone), sensory
attenuation is reduced or even abolished in the case of a large
perturbation [5, 6]. Yet, the brain can adapt to small perturba-
tions so that the sensory attenuation effect re-emerges after
learning [5, 7]. Aliu and coworkers [5] showed that when a tone
was delivered with a 100-ms delay after a button press, the audi-
tory sensory attenuation in the M100 component was initially
absent but re-emerged during learning within 300 trials.
Learning-related changes of the M200 attenuation have not
been studied to the best of our knowledge.
Sensory attenuation can be explained as the consequence of
computations by an internal forward model [3, 8]. The forward
model theory posits that predictions for the sensory conse-
quences (including its timing) of an action are formed along
with the motor command that will elicit this action. When the
reafferent signal from self-generated stimuli reaches the brain,
it is compared to this prediction and sensory attenuation will
be observed if the real sensory input and the prediction match.
Anymismatch (prediction errors) will be relayed to a higher-order
brain area for further processing [9]. With this in mind, the
process of sensory attenuation re-emerging after perturbation
can be seen as a process of correcting previous predictions to
account for the perturbation or a process of updating outdated
forward models to minimize prediction errors. Interestingly,
recent studies suggest that the cerebellum may play a vital role
in the updating of forwardmodels. For example, cerebellar lesion
patients were found to show deficits in predicting the position of
self-controlled cursor on the screen when a discrepancy was
introduced between the real cursor position and the controlling
movement [10, 11]. There is also evidence suggesting the
involvement of the cerebellum in temporal adaptation [12–14].
However, temporal information about stimulus appearance
was provided by the stimulus context in these previous studies
(e.g., through rhythmic stimulus presentation). Whether the cer-
ebellumwill also be involved in the adaptation when the temporal
information is provided by self-action is an open question. Given
the role of the cerebellum in the forward model updating and
in representing temporal prediction errors for self-generated
stimuli (e.g., [15]), this is likely. Here, linking action and percep-
tion, we seek causal evidence for the involvement of the cere-
bellum in learning to predict sensory consequences of our
actions (when there is a delay between action and sensory input)
in the healthy population.
ugust 21, 2017 ª 2017 The Author(s). Published by Elsevier Ltd. 1er the CC BY license (http://creativecommons.org/licenses/by/4.0/).
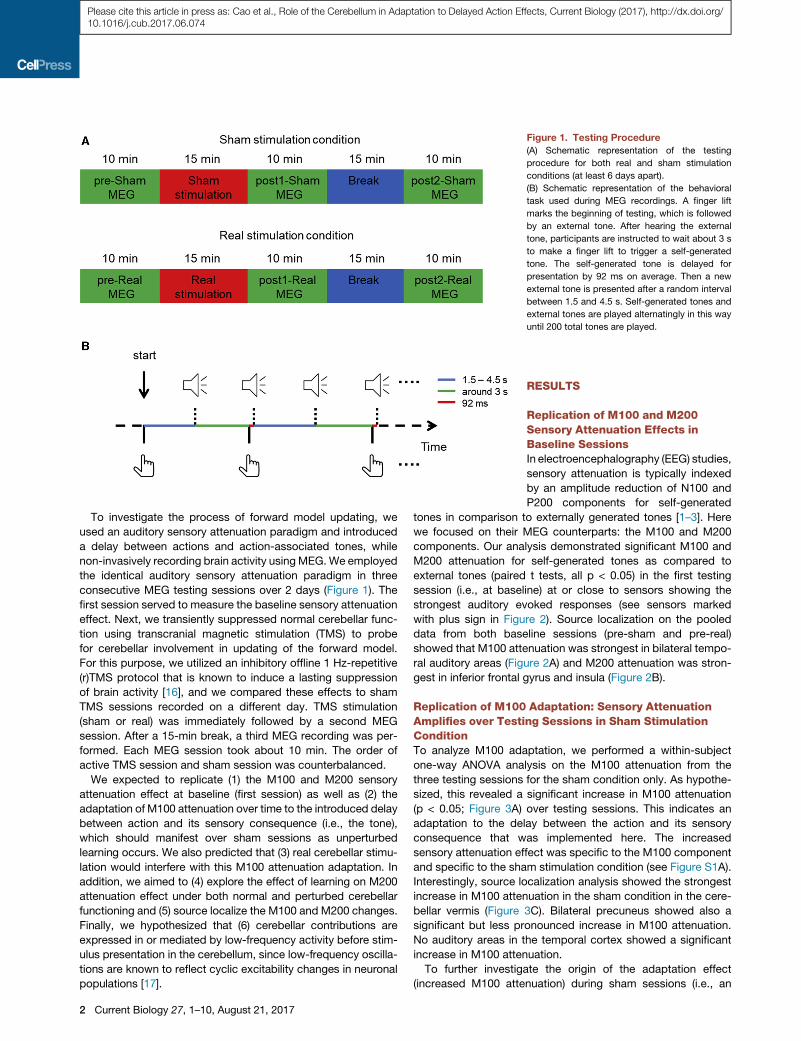
Figure 1. Testing Procedure
(A) Schematic representation of the testing
procedure for both real and sham stimulation
conditions (at least 6 days apart).
(B) Schematic representation of the behavioral
task used during MEG recordings. A finger lift
marks the beginning of testing, which is followed
by an external tone. After hearing the external
tone, participants are instructed to wait about 3 s
to make a finger lift to trigger a self-generated
tone. The self-generated tone is delayed for
presentation by 92 ms on average. Then a new
external tone is presented after a random interval
between 1.5 and 4.5 s. Self-generated tones and
external tones are played alternatingly in this way
until 200 total tones are played.
Please cite this article in press as: Cao et al., Role of the Cerebellum in Adaptation to Delayed Action Effects, Current Biology (2017), http://dx.doi.org/10.1016/j.cub.2017.06.074
To investigate the process of forward model updating, we
used an auditory sensory attenuation paradigm and introduced
a delay between actions and action-associated tones, while
non-invasively recording brain activity usingMEG.We employed
the identical auditory sensory attenuation paradigm in three
consecutive MEG testing sessions over 2 days (Figure 1). The
first session served to measure the baseline sensory attenuation
effect. Next, we transiently suppressed normal cerebellar func-
tion using transcranial magnetic stimulation (TMS) to probe
for cerebellar involvement in updating of the forward model.
For this purpose, we utilized an inhibitory offline 1 Hz-repetitive
(r)TMS protocol that is known to induce a lasting suppression
of brain activity [16], and we compared these effects to sham
TMS sessions recorded on a different day. TMS stimulation
(sham or real) was immediately followed by a second MEG
session. After a 15-min break, a third MEG recording was per-
formed. Each MEG session took about 10 min. The order of
active TMS session and sham session was counterbalanced.
We expected to replicate (1) the M100 and M200 sensory
attenuation effect at baseline (first session) as well as (2) the
adaptation of M100 attenuation over time to the introduced delay
between action and its sensory consequence (i.e., the tone),
which should manifest over sham sessions as unperturbed
learning occurs. We also predicted that (3) real cerebellar stimu-
lation would interfere with this M100 attenuation adaptation. In
addition, we aimed to (4) explore the effect of learning on M200
attenuation effect under both normal and perturbed cerebellar
functioning and (5) source localize the M100 and M200 changes.
Finally, we hypothesized that (6) cerebellar contributions are
expressed in or mediated by low-frequency activity before stim-
ulus presentation in the cerebellum, since low-frequency oscilla-
tions are known to reflect cyclic excitability changes in neuronal
populations [17].
2 Current Biology 27, 1–10, August 21, 2017
RESULTS
Replication of M100 and M200Sensory Attenuation Effects inBaseline SessionsIn electroencephalography (EEG) studies,
sensory attenuation is typically indexed
by an amplitude reduction of N100 and
P200 components for self-generated
tones in comparison to externally generated tones [1–3]. Here
we focused on their MEG counterparts: the M100 and M200
components. Our analysis demonstrated significant M100 and
M200 attenuation for self-generated tones as compared to
external tones (paired t tests, all p < 0.05) in the first testing
session (i.e., at baseline) at or close to sensors showing the
strongest auditory evoked responses (see sensors marked
with plus sign in Figure 2). Source localization on the pooled
data from both baseline sessions (pre-sham and pre-real)
showed that M100 attenuation was strongest in bilateral tempo-
ral auditory areas (Figure 2A) and M200 attenuation was stron-
gest in inferior frontal gyrus and insula (Figure 2B).
Replication of M100 Adaptation: Sensory AttenuationAmplifies over Testing Sessions in Sham StimulationConditionTo analyze M100 adaptation, we performed a within-subject
one-way ANOVA analysis on the M100 attenuation from the
three testing sessions for the sham condition only. As hypothe-
sized, this revealed a significant increase in M100 attenuation
(p < 0.05; Figure 3A) over testing sessions. This indicates an
adaptation to the delay between the action and its sensory
consequence that was implemented here. The increased
sensory attenuation effect was specific to the M100 component
and specific to the sham stimulation condition (see Figure S1A).
Interestingly, source localization analysis showed the strongest
increase in M100 attenuation in the sham condition in the cere-
bellar vermis (Figure 3C). Bilateral precuneus showed also a
significant but less pronounced increase in M100 attenuation.
No auditory areas in the temporal cortex showed a significant
increase in M100 attenuation.
To further investigate the origin of the adaptation effect
(increased M100 attenuation) during sham sessions (i.e., an

Figure 2. Replication of Sensory Attenuation in Baseline Sessions
(A) Average evoked responses (left panel) are plotted from all the right hemisphere sensors (middle panel) where significant M100 attenuation is found (sensors
marked with a plus sign; p < 0.05 with paired t tests; no correction for multiple comparisons). Background color in the middle panel shows the M100 topography
(70–100 ms; grand average of the external tone-evoked responses in the pre-real session). The results are illustrated with the data from the pre-sham session.
Source localization results with combined data from both baseline sessions (pre-sham and pre-real) show that M100 attenuation in the baseline session is
strongest in the bilateral auditory cortex (right panel). Z-coordinate score is referenced to the Montreal Neurological Institute (MNI) brain. L and R indicate left and
right, respectively.
(B) The results of M200 attenuation in pre-real session are shown (left and middle panels) similarly to M100 attenuation effect. Background color in the middle
panel shows the M200 topography (125–155 ms; grand average of the external tone-evoked responses in the pre-real session). Source localization results from
combined baseline session data (pre-sham and pre-real) show that the strongest M200 attenuation is in the inferior frontal cortex and insula (right panel).
Please cite this article in press as: Cao et al., Role of the Cerebellum in Adaptation to Delayed Action Effects, Current Biology (2017), http://dx.doi.org/10.1016/j.cub.2017.06.074
amplitude decrease for self-generated tones versus an ampli-
tude increase for external tones), a two (self-generated versus
external) by three (testing sessions: pre-sham, post1-sham,
and post2-sham) within-subject ANOVA was performed on
the amplitude of M100 components. This revealed a significant
interaction effect (F(2,18) = 5.35, p = 0.02). Post hoc analysis
showed a reduction in M100 amplitude for self-generated tones
in post2-sham session compared to external tones in post2-
sham session (t(9) = 2.57, p = 0.03) and self-generated tones
in post1-sham session (t(9) = 2.44, p = 0.04). The first simple
effect hence confirms the presence of a significant M100 atten-
uation effect in post2-sham. The latter simple effect reveals that
its adaptation over time is due to a decrease in M100 ampli-
tudes for self-generated tones. No other effects from the
ANOVA analysis reached statistical significance (main effect
of tones: F(1,9) = 3.77, p = 0.08; main effect of testing session:
F(2,18) = 0.26, p = 0.78). See Figure 3 for an illustration of M100-
evoked responses in all testing sessions. This analysis therefore
confirmed the predicted increase in M100 attenuation due to
adaptation to the delay between an action and its sensory
consequence. As expected, the change in M100 attenuation
is due to the reduced M100 response for self-initiated sensory
stimuli.
Interference of Cerebellar TMS with M100 AdaptationHaving shown the adaptation of M100 attenuation in the sham
stimulation condition, we next investigated whether cerebellar
TMS affected M100 attenuation across sessions, as compared
to the sham condition. Since no significant difference (paired
t test, t(9) = 0.13, p = 0.90) was found between pre-sham
and pre-real M100 attenuation (pre-sham mean = 3.53e�14,
SD = 5.42e�14; pre-real mean = 3.34e�14, SD = 5.81e�14)
(Figures 3A and 3B, left panel), each post-stimulation M100
attenuation effect was referenced to the corresponding
baseline (pre-stimulation) M100 attenuation effect (through
subtraction) before being subjected to a two (sham versus real
stimulation) by two (post1 versus post2) within-subject ANOVA
analysis (see Figure 4A for baseline-corrected data). This anal-
ysis showed a main effect of testing session with an increase in-
baseline-referenced M100 attenuation (F(1,9) = 7.21, p = 0.03)
from post1 (mean = �1.11e�14, SD = 2.81e�14) to post2
(mean = 2.36e�14, SD = 3.80e�14). Importantly, there was a
Current Biology 27, 1–10, August 21, 2017 3
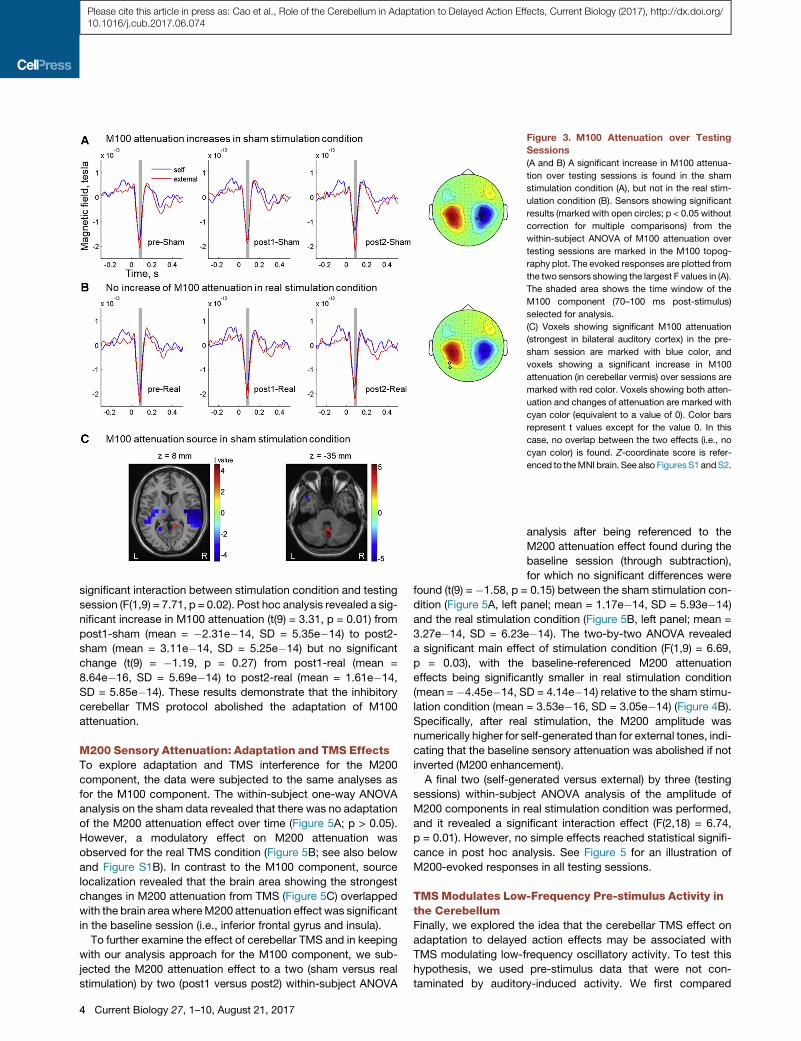
Figure 3. M100 Attenuation over Testing
Sessions
(A and B) A significant increase in M100 attenua-
tion over testing sessions is found in the sham
stimulation condition (A), but not in the real stim-
ulation condition (B). Sensors showing significant
results (marked with open circles; p < 0.05 without
correction for multiple comparisons) from the
within-subject ANOVA of M100 attenuation over
testing sessions are marked in the M100 topog-
raphy plot. The evoked responses are plotted from
the two sensors showing the largest F values in (A).
The shaded area shows the time window of the
M100 component (70–100 ms post-stimulus)
selected for analysis.
(C) Voxels showing significant M100 attenuation
(strongest in bilateral auditory cortex) in the pre-
sham session are marked with blue color, and
voxels showing a significant increase in M100
attenuation (in cerebellar vermis) over sessions are
marked with red color. Voxels showing both atten-
uation and changes of attenuation are marked with
cyan color (equivalent to a value of 0). Color bars
represent t values except for the value 0. In this
case, no overlap between the two effects (i.e., no
cyan color) is found. Z-coordinate score is refer-
enced to theMNI brain. See also FiguresS1andS2.
Please cite this article in press as: Cao et al., Role of the Cerebellum in Adaptation to Delayed Action Effects, Current Biology (2017), http://dx.doi.org/10.1016/j.cub.2017.06.074
significant interaction between stimulation condition and testing
session (F(1,9) = 7.71, p = 0.02). Post hoc analysis revealed a sig-
nificant increase in M100 attenuation (t(9) = 3.31, p = 0.01) from
post1-sham (mean = �2.31e�14, SD = 5.35e�14) to post2-
sham (mean = 3.11e�14, SD = 5.25e�14) but no significant
change (t(9) = �1.19, p = 0.27) from post1-real (mean =
8.64e�16, SD = 5.69e�14) to post2-real (mean = 1.61e�14,
SD = 5.85e�14). These results demonstrate that the inhibitory
cerebellar TMS protocol abolished the adaptation of M100
attenuation.
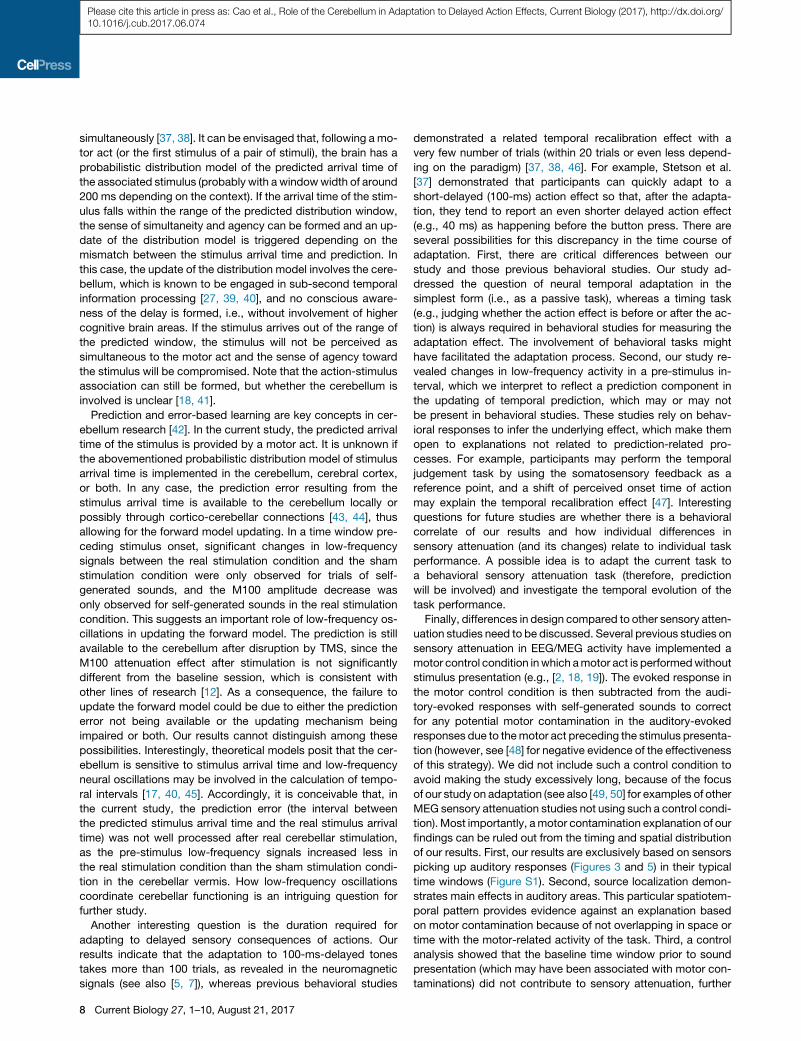
M200 Sensory Attenuation: Adaptation and TMS EffectsTo explore adaptation and TMS interference for the M200
component, the data were subjected to the same analyses as
for the M100 component. The within-subject one-way ANOVA
analysis on the sham data revealed that there was no adaptation
of the M200 attenuation effect over time (Figure 5A; p > 0.05).
However, a modulatory effect on M200 attenuation was
observed for the real TMS condition (Figure 5B; see also below
and Figure S1B). In contrast to the M100 component, source
localization revealed that the brain area showing the strongest
changes in M200 attenuation from TMS (Figure 5C) overlapped
with the brain areawhereM200 attenuation effect was significant
in the baseline session (i.e., inferior frontal gyrus and insula).
To further examine the effect of cerebellar TMS and in keeping
with our analysis approach for the M100 component, we sub-
jected the M200 attenuation effect to a two (sham versus real
stimulation) by two (post1 versus post2) within-subject ANOVA
4 Current Biology 27, 1–10, August 21, 2017
analysis after being referenced to the
M200 attenuation effect found during the
baseline session (through subtraction),
for which no significant differences were
found (t(9) = �1.58, p = 0.15) between the sham stimulation con-
dition (Figure 5A, left panel; mean = 1.17e�14, SD = 5.93e�14)
and the real stimulation condition (Figure 5B, left panel; mean =
3.27e�14, SD = 6.23e�14). The two-by-two ANOVA revealed
a significant main effect of stimulation condition (F(1,9) = 6.69,
p = 0.03), with the baseline-referenced M200 attenuation
effects being significantly smaller in real stimulation condition
(mean = �4.45e�14, SD = 4.14e�14) relative to the sham stimu-
lation condition (mean = 3.53e�16, SD = 3.05e�14) (Figure 4B).
Specifically, after real stimulation, the M200 amplitude was
numerically higher for self-generated than for external tones, indi-
cating that the baseline sensory attenuation was abolished if not
inverted (M200 enhancement).
A final two (self-generated versus external) by three (testing
sessions) within-subject ANOVA analysis of the amplitude of
M200 components in real stimulation condition was performed,
and it revealed a significant interaction effect (F(2,18) = 6.74,
p = 0.01). However, no simple effects reached statistical signifi-
cance in post hoc analysis. See Figure 5 for an illustration of
M200-evoked responses in all testing sessions.
TMS Modulates Low-Frequency Pre-stimulus Activity inthe CerebellumFinally, we explored the idea that the cerebellar TMS effect on
adaptation to delayed action effects may be associated with
TMS modulating low-frequency oscillatory activity. To test this
hypothesis, we used pre-stimulus data that were not con-
taminated by auditory-induced activity. We first compared

Figure 4. Results of Baseline-Referenced
M100 and M200 Attenuation Effects
(A) The two (sham versus real stimulation)
by two (post1 versus post2) ANOVA on the
baseline-referenced M100 attenuation effect
reveals a significant interaction effect (p =
0.02). There is a significant increase in M100
attenuation from post1-sham to post2-sham
(p = 0.01), but not from post1-real to post2-
real (p = 0.27). Individual results are over-
laid on the group means shown by the gray
column.
(B) The two (sham versus real stimulation) by
two (post1 versus post2) ANOVA on the base-
line-referenced M200 attenuation effect reveals
a significant main effect of stimulation condition (p = 0.03). The M200 attenuation effect is significantly smaller in real stimulation condition than in sham
stimulation condition. On the contrary, reaction time did not show similar modulation by the stimulation (see Table S1).
Please cite this article in press as: Cao et al., Role of the Cerebellum in Adaptation to Delayed Action Effects, Current Biology (2017), http://dx.doi.org/10.1016/j.cub.2017.06.074
the single-trial source-reconstructed pre-stimulus time series
(�500–0 ms; 10-Hz low pass) between the two post-TMS ses-
sions and the pre-TMS session to assess the development of
low-frequency activity over testing sessions, separately for real
and sham stimulation conditions. Then the real and sham stimu-
lation conditions were compared to identify changes induced by
TMS. An interesting difference emerged from this comparison
in trials for self-generated sounds between the real and the
sham stimulation conditions. The right hemisphere cerebellar
crus (close to the stimulation site) showed significantly stronger
activity, and the cerebellar vermis (close to the site of M100
attenuation increase in the sham stimulation condition) showed
significantly reduced low-frequency activity in real stimulation
as compared to sham stimulation condition (Figure 6). No such
difference was found in trials for externally generated sounds.
A close examination indicated that pre-stimulus low-frequency
activities increased more in the right hemisphere cerebellar crus
in post-real sessions than in post-sham sessions. In the cere-
bellar vermis, pre-stimulus low-frequency activities remained
unchanged in the real stimulation condition, but they increased
in the sham stimulation condition. These findings suggest that
the inhibitory TMS protocol induces changes in low-frequency
activity in the cerebellum.
Control AnalysisWe performed additional analysis to rule out that the motor
response, which is associated with self-generated tones, but
not with external tones, may contribute to our sensory attenua-
tion results (see also the Discussion). First, a time domain cluster
analysis in the baseline time window (�600 to �200 ms)
comparing self-generated tones and external tones in the
pre-TMS session did not yield any significant results on the sen-
sors showing the M100 and M200 attenuation effects (see Fig-
ure S2). This demonstrates that sensory attenuation in our data
was not caused by differences in the time window used for base-
line correction (�600 to�200ms). Second, we also analyzed the
timing of self-generated tones between button presses across
conditions (sham versus real) to rule out that differences in timing
of these manual responses (which would differentially affect
session durations) may be associated with the observed sensory
attenuation changes. No significant interaction between stimula-
tion condition (sham versus real) and testing session (pre, post1,
and post2) was found (Table S1). This provides evidence that
changes in auditory-evoked responses over testing sessions
are not caused by changes in response latency.
DISCUSSION
In this combined TMS-MEG study, we provide first-time evi-
dence of a causal role of the cerebellum in adapting to
delayed action effects in the auditory domain in healthy young
participants. Regarding the M100 component, we replicated
previous findings of sensory attenuation for self- versus exter-
nally generated tones at baseline and of an increase in M100
attenuation within 300 trials of learning to adapt to a 100-ms
delay between action and tone [5, 7]. Source localization showed
that the increase in M100 attenuation was strongest in the cere-
bellum. After we stimulated the cerebellum with an inhibitory
TMS protocol, the increase in M100 attenuation disappeared.
For the M200 component, in contrast, we did not observe an
adaptation of sensory attenuation over trials, but we demon-
strated an inversion of M200 attenuation to M200 enhancement
by cerebellar TMS. This change of M200 attenuation was stron-
gest in inferior frontal gyrus and insula. Further analysis provided
preliminary evidence that low-frequency activity (below 10 Hz) in
the cerebellum prior to stimulus presentation plays a key role in
adapting to delayed action effects. Overall, this extends the role
of the cerebellum in updating forward models from the visual to
the auditory domain [10, 11].
The forwardmodel associated with actions has been shown to
modulate sensory cortices through top-down mechanisms [4].
When a self-generated stimulus activates sensory areas, the
brain’s responses result from a complex interplay between
the bottom-up and top-down signals. Our findings show that
the M100 and M200 components represent functionally and
anatomically distinct neural information-processing stages in
this process (see below for details). Moreover, our design
combining two non-invasive tools in cognitive neuroscience
(TMS and MEG) allows gaining valuable insights into the role of
the cerebellum in updating the forward model when the pre-
dicted signal does not match the reafferent signal (discussed
below).
A decrease in the amplitudes of M100 and M200 components
(and their EEG counterparts N100 and P200 components)
for self-generated tones is a very robust effect, reliably demon-
strating the influences that actions can have on auditory
Current Biology 27, 1–10, August 21, 2017 5

Figure 5. M200 Attenuation over Testing Sessions(A and B) Significant changes of M200 attenuation over testing sessions are not found in the sham stimulation condition (A), but they are found in the real
stimulation condition (B). Sensors showing significant results (marked with open circles; p < 0.05 without correction for multiple comparisons) from the within-
subject ANOVA of M200 attenuation over testing sessions are marked in the M200 topography plot. The evoked responses are plotted from the two sensors
showing the largest F values in (B). The shaded area shows the time window of the M200 component (125–155 ms post-stimulus) selected for analysis.
(C) Voxels showing significantM200 attenuation in the pre-real session aremarkedwith blue color, and voxels showing significant changes ofM200 over sessions
are marked with red color, both of which have strongest signals in the right inferior frontal gyrus and insula (indicated by cyan color). Color bars represent t values
except for the value 0. Z-coordinate score is referenced to the MNI brain. See also Figures S1 and S2.
Please cite this article in press as: Cao et al., Role of the Cerebellum in Adaptation to Delayed Action Effects, Current Biology (2017), http://dx.doi.org/10.1016/j.cub.2017.06.074
processing [1, 2, 4, 18, 19]. In addition, many studies demon-
strated a functional disassociation between the two components
[19–23], which is also supported by our results showing different
characteristics of both components over testing sessions in
sham and real stimulation conditions. The M100 attenuation in
the baseline session (pre-sham and pre-real) was localized
in auditory cortex, which we interpret as a result of predictions
from the forward model. Our results also show that the forward
model is tolerant, to some degree, to a delay in the stimulus
onset [18]. Still, within 300 trials of learning, M100 attenuation
is further increased, reflecting updated predictions that take
6 Current Biology 27, 1–10, August 21, 2017
into account the temporal delay between action and tone. Two
main results from our analysis demonstrate a significant and
causal involvement of the cerebellum in this process. First, the
increase in M100 attenuation over sessions (reflecting the
learning of the action-tone delay) was only evident in the sham
condition but abolished after cerebellar TMS. The particular TMS
protocol used here (1 Hz-rTMS, 900 pulses) has been reported to
interfere with brain activity for up to 40 min following stimulation
offset [16]. Therefore, we can assume that learning-related pro-
cesses that rely on cerebellar functions were significantly
impaired for the two MEG sessions following real TMS. Our

Figure 6. Significant Changes of Pre-stimulus Low-Frequency Activities in the Cerebellum
In this exploratory analysis, pre-stimulus (�500–0 ms) cerebellar low-frequency (below 10 Hz) activities were compared for trials with self-generated tones
between post and pre sessions in the real (A) and sham stimulation conditions (B). In real stimulation condition, a significant increase in pre-stimulus low-
frequency activity is only found in the right cerebellar hemisphere (close to the stimulation site). But in sham stimulation condition, pre-stimulus low-frequency
activity increases in both the right cerebellar hemisphere and cerebellar vermis. Significant differences between real and sham stimulation conditions are found in
both the right cerebellar crus and cerebellar vermis (C). Z-coordinate score is referenced to the MNI brain.
Please cite this article in press as: Cao et al., Role of the Cerebellum in Adaptation to Delayed Action Effects, Current Biology (2017), http://dx.doi.org/10.1016/j.cub.2017.06.074
results are therefore consistent with a critical role of the cere-
bellum in the implementation or mediation of the learning-related
changes of sensory attenuation. Second, our source localization
results reveal the strongest changes of M100 attenuation over
sessions in the cerebellum. We acknowledge that MEG has a
greatly reduced sensitivity to activity originating from subcortical
compared to cortical brain areas. Still, under favorable condi-
tions, subcortical brain areas in general and cerebellar areas in
particular have been successfully studied with MEG [24–26].
Our results are also in line with findings suggesting that the cer-
ebellum is important for sub-second timing accuracy [27, 28].
Consequently, when normal cerebellar function was suppressed
by TMS, the increase in M100 attenuation over sessions reflect-
ing adaptation of the forward model disappeared (Figure 3).
M200 attenuation showed a different pattern. We suggest that
the M200 component represents processing at a higher level
in the auditory-processing hierarchy compared to the M100
component and that the M200 component aims to deal with
residual prediction errors not resolved in earlier processing
stages. Thus, in sham stimulation condition, M200 attenuation
may have remained unchanged as the prediction error resulting
from the delay was already resolved by the cerebellum. When
TMS interfered with cerebellar function in the real stimulation
condition, the prediction error was not resolved by the cere-
bellum; it still existed at later processing stages in inferior frontal
gyrus and insula, and it was reflected in a relative increase in
the amplitude of M200 component. This explanation of M200
component is supported by other studies showing that the
M200 amplitude (or P200 in EEG studies) increases when a stim-
ulus cannot be predicted [29] and when a predicted stimulus is
omitted [30] or violated [31]. This may also explain why, in EEG
studies, N100 attenuation, but not P200 attenuation, was
observed in the following two cases: (1) when a stimulus was
followed by actions of an atypical effector, like the eye [19] or
the foot [21], and (2) when a non-speech stimulus followed
speechmovement planning [22]. In summary, M100/N100 atten-
uation may be the result of predictions from forward models
that act on low-level features of the stimulus. Prediction errors
from a higher-level comparison will be further addressed in
inferior frontal gyrus and insula in the time window of the
M200/P200 component, which may be used for guiding future
predictions [32].
Numerous theoretical and empirical studies have implicated
the cerebellum in the neural circuit of the forward model [33].
These studies suggest that the cerebellum is involved in all steps
of the forward model from making predictions [20, 34] and
encoding prediction errors [15, 35, 36] to updating forward
models [10, 11]. But how the cerebellum performs these func-
tions is largely unknown. Here we show that the cerebellum is
involved in adapting to the delay between actions and action-
induced sounds, i.e., updating the forward model. It is well
known that the brain has a temporal integration window during
which a motor act and its associated stimulus (or between
two separate stimuli in multisensory research) are perceived
Current Biology 27, 1–10, August 21, 2017 7
Please cite this article in press as: Cao et al., Role of the Cerebellum in Adaptation to Delayed Action Effects, Current Biology (2017), http://dx.doi.org/10.1016/j.cub.2017.06.074
simultaneously [37, 38]. It can be envisaged that, following a mo-
tor act (or the first stimulus of a pair of stimuli), the brain has a
probabilistic distribution model of the predicted arrival time of
the associated stimulus (probably with a windowwidth of around
200 ms depending on the context). If the arrival time of the stim-
ulus falls within the range of the predicted distribution window,
the sense of simultaneity and agency can be formed and an up-
date of the distribution model is triggered depending on the
mismatch between the stimulus arrival time and prediction. In
this case, the update of the distribution model involves the cere-
bellum, which is known to be engaged in sub-second temporal
information processing [27, 39, 40], and no conscious aware-
ness of the delay is formed, i.e., without involvement of higher
cognitive brain areas. If the stimulus arrives out of the range of
the predicted window, the stimulus will not be perceived as
simultaneous to the motor act and the sense of agency toward
the stimulus will be compromised. Note that the action-stimulus
association can still be formed, but whether the cerebellum is
involved is unclear [18, 41].
Prediction and error-based learning are key concepts in cer-
ebellum research [42]. In the current study, the predicted arrival
time of the stimulus is provided by a motor act. It is unknown if
the abovementioned probabilistic distribution model of stimulus
arrival time is implemented in the cerebellum, cerebral cortex,
or both. In any case, the prediction error resulting from the
stimulus arrival time is available to the cerebellum locally or
possibly through cortico-cerebellar connections [43, 44], thus
allowing for the forward model updating. In a time window pre-
ceding stimulus onset, significant changes in low-frequency
signals between the real stimulation condition and the sham
stimulation condition were only observed for trials of self-
generated sounds, and the M100 amplitude decrease was
only observed for self-generated sounds in the real stimulation
condition. This suggests an important role of low-frequency os-
cillations in updating the forward model. The prediction is still
available to the cerebellum after disruption by TMS, since the
M100 attenuation effect after stimulation is not significantly
different from the baseline session, which is consistent with
other lines of research [12]. As a consequence, the failure to
update the forward model could be due to either the prediction
error not being available or the updating mechanism being
impaired or both. Our results cannot distinguish among these
possibilities. Interestingly, theoretical models posit that the cer-
ebellum is sensitive to stimulus arrival time and low-frequency
neural oscillations may be involved in the calculation of tempo-
ral intervals [17, 40, 45]. Accordingly, it is conceivable that, in
the current study, the prediction error (the interval between
the predicted stimulus arrival time and the real stimulus arrival
time) was not well processed after real cerebellar stimulation,
as the pre-stimulus low-frequency signals increased less in
the real stimulation condition than the sham stimulation condi-
tion in the cerebellar vermis. How low-frequency oscillations
coordinate cerebellar functioning is an intriguing question for
further study.
Another interesting question is the duration required for
adapting to delayed sensory consequences of actions. Our
results indicate that the adaptation to 100-ms-delayed tones
takes more than 100 trials, as revealed in the neuromagnetic
signals (see also [5, 7]), whereas previous behavioral studies
8 Current Biology 27, 1–10, August 21, 2017
demonstrated a related temporal recalibration effect with a
very few number of trials (within 20 trials or even less depend-
ing on the paradigm) [37, 38, 46]. For example, Stetson et al.
[37] demonstrated that participants can quickly adapt to a
short-delayed (100-ms) action effect so that, after the adapta-
tion, they tend to report an even shorter delayed action effect
(e.g., 40 ms) as happening before the button press. There are
several possibilities for this discrepancy in the time course of
adaptation. First, there are critical differences between our
study and those previous behavioral studies. Our study ad-
dressed the question of neural temporal adaptation in the
simplest form (i.e., as a passive task), whereas a timing task
(e.g., judging whether the action effect is before or after the ac-
tion) is always required in behavioral studies for measuring the
adaptation effect. The involvement of behavioral tasks might
have facilitated the adaptation process. Second, our study re-
vealed changes in low-frequency activity in a pre-stimulus in-
terval, which we interpret to reflect a prediction component in
the updating of temporal prediction, which may or may not
be present in behavioral studies. These studies rely on behav-
ioral responses to infer the underlying effect, which make them
open to explanations not related to prediction-related pro-
cesses. For example, participants may perform the temporal
judgement task by using the somatosensory feedback as a
reference point, and a shift of perceived onset time of action
may explain the temporal recalibration effect [47]. Interesting
questions for future studies are whether there is a behavioral
correlate of our results and how individual differences in
sensory attenuation (and its changes) relate to individual task
performance. A possible idea is to adapt the current task to
a behavioral sensory attenuation task (therefore, prediction
will be involved) and investigate the temporal evolution of the
task performance.
Finally, differences in design compared to other sensory atten-
uation studies need to be discussed. Several previous studies on
sensory attenuation in EEG/MEG activity have implemented a
motor control condition inwhich amotor act is performedwithout
stimulus presentation (e.g., [2, 18, 19]). The evoked response in
the motor control condition is then subtracted from the audi-
tory-evoked responses with self-generated sounds to correct
for any potential motor contamination in the auditory-evoked
responses due to themotor act preceding the stimulus presenta-
tion (however, see [48] for negative evidence of the effectiveness
of this strategy). We did not include such a control condition to
avoid making the study excessively long, because of the focus
of our study on adaptation (see also [49, 50] for examples of other
MEG sensory attenuation studies not using such a control condi-
tion). Most importantly, amotor contamination explanation of our
findings can be ruled out from the timing and spatial distribution
of our results. First, our results are exclusively based on sensors
picking up auditory responses (Figures 3 and 5) in their typical
time windows (Figure S1). Second, source localization demon-
strates main effects in auditory areas. This particular spatiotem-
poral pattern provides evidence against an explanation based
on motor contamination because of not overlapping in space or
time with the motor-related activity of the task. Third, a control
analysis showed that the baseline time window prior to sound
presentation (which may have been associated with motor con-
taminations) did not contribute to sensory attenuation, further

Please cite this article in press as: Cao et al., Role of the Cerebellum in Adaptation to Delayed Action Effects, Current Biology (2017), http://dx.doi.org/10.1016/j.cub.2017.06.074
ruling outmotor contamination as an explanation of our results. In
further contrast to some other sensory attenuation studies, we
also did not include a condition in which the sound is presented
with a 0-ms delay, which would have provided a useful condition
for estimating individual sensory attenuation in the absence of a
delay. However, we compared magnitudes of M100 attenuation
between the current study and our previous MEG study [4] in
which a similar paradigm was used but without delay between
the motor act and sound presentation. In sham stimulation con-
dition of the current study, the M100 attenuation effect in the
baseline session was around 50%, and in the last testing session
it was around 100% of the M100 attenuation effect measured
without a delay. Importantly, we showed a reduction in ampli-
tudes of evoked responses across sham sessions for self-gener-
ated tones, but not external tones, which indicates that the delay
between themotor action and sound presentationwas taken into
account over time. Together with other studies [5, 7], our results
therefore provide converging evidence that the adaptation to a
delay between a motor act and its associated sensory conse-
quence can be revealed in electromagnetic-evoked responses
at around 100 ms post-stimulus.
In summary, our study provides conclusive evidence for a
causal involvement of the cerebellum in the updating of internal
forward models related to the process of predicting (temporal)
sensory consequences of actions.
STAR+METHODS
Detailed methods are provided in the online version of this paper
and include the following:
d KEY RESOURCES TABLE
d CONTACT FOR REAGENT AND RESOURCE SHARING
d EXPERIMENTAL MODEL AND SUBJECT DETAILS
d METHOD DETAILS
B Equipment
B General Procedure
B Transcranial Magnetic Stimulation
B MEG Measurements
d QUANTIFICATION AND STATISTICAL ANALYSIS
B Preprocessing
B Sensor Space Evoked Responses
B ANOVA Analysis
B Source Space Analysis
d DATA AND SOFTWARE AVAILABILITY
SUPPLEMENTAL INFORMATION
Supplemental Information includes two figures and one table and can be found
with this article online at http://dx.doi.org/10.1016/j.cub.2017.06.074.
AUTHOR CONTRIBUTIONS
All authors designed the experiment. L.C. and D.V. performed the study. L.C.
and J.G. analyzed the data. All authors wrote the manuscript.
ACKNOWLEDGMENTS
L.C. was supported by a joint PhD studentship from the University of Glasgow
and the China Scholarship Council; D.V., G.T., and J.G. were supported by the
Wellcome Trust (098433 and 098434).
Received: March 3, 2017
Revised: June 8, 2017
Accepted: June 29, 2017
Published: August 3, 2017
REFERENCES
1. Schafer, E.W., and Marcus, M.M. (1973). Self-stimulation alters human
sensory brain responses. Science 181, 175–177.
2. Martikainen, M.H., Kaneko, K., and Hari, R. (2005). Suppressed responses
to self-triggered sounds in the human auditory cortex. Cereb. Cortex 15,
299–302.
3. Schroger, E., Marzecova, A., and SanMiguel, I. (2015). Attention and pre-
diction in human audition: a lesson from cognitive psychophysiology. Eur.
J. Neurosci. 41, 641–664.
4. Cao, L., Thut, G., and Gross, J. (2017). The role of brain oscillations in pre-
dicting self-generated sounds. Neuroimage 147, 895–903.
5. Aliu, S.O., Houde, J.F., and Nagarajan, S.S. (2009). Motor-induced sup-
pression of the auditory cortex. J. Cogn. Neurosci. 21, 791–802.
6. Blakemore, S.J., Frith, C.D., and Wolpert, D.M. (1999). Spatio-temporal
prediction modulates the perception of self-produced stimuli. J. Cogn.
Neurosci. 11, 551–559.
7. Elijah, R.B., Le Pelley, M.E., and Whitford, T.J. (2016). Modifying temporal
expectations: Changing cortical responsivity to delayed self-initiated sen-
sations with training. Biol. Psychol. 120, 88–95.
8. Wolpert, D.M., and Ghahramani, Z. (2000). Computational principles of
movement neuroscience. Nat. Neurosci. 3 (Suppl ), 1212–1217.
9. von Holst, E., and Mittelstaedt, H. (1950). Das reafferenzprinzip.
Naturwissenschaften 37, 464–476.
10. Synofzik, M., Lindner, A., and Thier, P. (2008). The cerebellum updates
predictions about the visual consequences of one’s behavior. Curr. Biol.
18, 814–818.
11. Izawa, J., Criscimagna-Hemminger, S.E., and Shadmehr, R. (2012).
Cerebellar contributions to reach adaptation and learning sensory conse-
quences of action. J. Neurosci. 32, 4230–4239.
12. Roth, M.J., Synofzik, M., and Lindner, A. (2013). The cerebellum optimizes
perceptual predictions about external sensory events. Curr. Biol. 23,
930–935.
13. Kotz, S.A., Stockert, A., and Schwartze, M. (2014). Cerebellum, temporal
predictability and the updating of a mental model. Philos. Trans. R. Soc.
Lond. B Biol. Sci. 369, 20130403.
14. Moberget, T., Karns, C.M., Deouell, L.Y., Lindgren, M., Knight, R.T., and
Ivry, R.B. (2008). Detecting violations of sensory expectancies following
cerebellar degeneration: a mismatch negativity study. Neuropsychologia
46, 2569–2579.
15. Watkins, K., Patel, N., Davis, S., and Howell, P. (2005). Brain activity during
altered auditory feedback: an FMRI study in healthy adolescents.
Neuroimage 26 (Supp 1), 304.
16. Thut, G., and Pascual-Leone, A. (2010). A review of combined TMS-EEG
studies to characterize lasting effects of repetitive TMS and assess their
usefulness in cognitive and clinical neuroscience. Brain Topogr. 22,
219–232.
17. Thut, G., Miniussi, C., and Gross, J. (2012). The functional importance of
rhythmic activity in the brain. Curr. Biol. 22, R658–R663.
18. B€ass, P., Jacobsen, T., and Schroger, E. (2008). Suppression of the audi-
tory N1 event-related potential component with unpredictable self-initi-
ated tones: evidence for internal forwardmodels with dynamic stimulation.
Int. J. Psychophysiol. 70, 137–143.
19. Mifsud, N.G., Beesley, T., Watson, T.L., and Whitford, T.J. (2016).
Attenuation of auditory evoked potentials for hand and eye-initiated
sounds. Biol. Psychol. 120, 61–68.
20. Knolle, F., Schroger, E., Baess, P., and Kotz, S.A. (2012). The cerebellum
generates motor-to-auditory predictions: ERP lesion evidence. J. Cogn.
Neurosci. 24, 698–706.
Current Biology 27, 1–10, August 21, 2017 9

Please cite this article in press as: Cao et al., Role of the Cerebellum in Adaptation to Delayed Action Effects, Current Biology (2017), http://dx.doi.org/10.1016/j.cub.2017.06.074
21. van Elk, M., Salomon, R., Kannape,O., andBlanke, O. (2014). Suppression
of the N1 auditory evoked potential for sounds generated by the upper and
lower limbs. Biol. Psychol. 102, 108–117.
22. Daliri, A., andMax, L. (2016). Modulation of Auditory Responses to Speech
vs. Nonspeech Stimuli during Speech Movement Planning. Front. Hum.
Neurosci. 10, 234.
23. Horvath, J., Maess, B., Baess, P., and Toth, A. (2012). Action-sound coin-
cidences suppress evoked responses of the human auditory cortex in EEG
and MEG. J. Cogn. Neurosci. 24, 1919–1931.
24. Schnitzler, A., Munks, C., Butz, M., Timmermann, L., and Gross, J. (2009).
Synchronized brain network associated with essential tremor as revealed
by magnetoencephalography. Mov. Disord. 24, 1629–1635.
25. Crespo-Garcıa, M., Zeiller, M., Leupold, C., Kreiselmeyer, G., Rampp, S.,
Hamer, H.M., and Dalal, S.S. (2016). Slow-theta power decreases during
item-place encoding predict spatial accuracy of subsequent context
recall. Neuroimage 142, 533–543.
26. Gross, J., Timmermann, L., Kujala, J., Dirks, M., Schmitz, F., Salmelin, R.,
and Schnitzler, A. (2002). The neural basis of intermittent motor control in
humans. Proc. Natl. Acad. Sci. USA 99, 2299–2302.
27. Lewis, P.A., and Miall, R.C. (2003). Brain activation patterns during
measurement of sub- and supra-second intervals. Neuropsychologia 41,
1583–1592.
28. Ivry, R.B., and Spencer, R.M. (2004). The neural representation of time.
Curr. Opin. Neurobiol. 14, 225–232.
29. Chen, Z., Chen, X., Liu, P., Huang, D., and Liu, H. (2012). Effect of temporal
predictability on the neural processing of self-triggered auditory stimula-
tion during vocalization. BMC Neurosci. 13, 55.
30. Joutsiniemi, S.L., and Hari, R. (1989). Omissions of Auditory Stimuli May
Activate Frontal Cortex. Eur. J. Neurosci. 1, 524–528.
31. Behroozmand, R., Liu, H., and Larson, C.R. (2011). Time-dependent
neural processing of auditory feedback during voice pitch error detection.
J. Cogn. Neurosci. 23, 1205–1217.
32. Wang, J., Mathalon, D.H., Roach, B.J., Reilly, J., Keedy, S.K., Sweeney,
J.A., and Ford, J.M. (2014). Action planning and predictive coding when
speaking. Neuroimage 91, 91–98.
33. Wolpert, D.M., Miall, R.C., and Kawato, M. (1998). Internal models in the
cerebellum. Trends Cogn. Sci. 2, 338–347.
34. Miall, R.C., Christensen, L.O., Cain, O., and Stanley, J. (2007). Disruption
of state estimation in the human lateral cerebellum. PLoS Biol. 5, e316.
35. Schlerf, J., Ivry, R.B., and Diedrichsen, J. (2012). Encoding of sensory
prediction errors in the human cerebellum. J. Neurosci. 32, 4913–4922.
36. Blakemore, S.J., Frith, C.D., and Wolpert, D.M. (2001). The cerebellum is
involved in predicting the sensory consequences of action. Neuroreport
12, 1879–1884.
37. Stetson, C., Cui, X., Montague, P.R., and Eagleman, D.M. (2006). Motor-
sensory recalibration leads to an illusory reversal of action and sensation.
Neuron 51, 651–659.
38. Timm, J., Schonwiesner, M., SanMiguel, I., and Schroger, E. (2014).
Sensation of agency and perception of temporal order. Conscious.
Cogn. 23, 42–52.
39. Ivry, R.B., and Keele, S.W. (1989). Timing functions of the cerebellum.
J. Cogn. Neurosci. 1, 136–152.
40. Petter, E.A., Lusk, N.A., Hesslow, G., and Meck, W.H. (2016). Interactive
roles of the cerebellum and striatum in sub-second and supra-second
timing: Support for an initiation, continuation, adjustment, and termination
(ICAT) model of temporal processing. Neurosci. Biobehav. Rev. 71,
739–755.
10 Current Biology 27, 1–10, August 21, 2017
41. Dignath, D., Pfister, R., Eder, A.B., Kiesel, A., and Kunde, W. (2014).
Representing the hyphen in action-effect associations: automatic acquisi-
tion and bidirectional retrieval of action-effect intervals. J. Exp. Psychol.
Learn. Mem. Cogn. 40, 1701–1712.
42. Sokolov, A.A., Miall, R.C., and Ivry, R.B. (2017). The Cerebellum: Adaptive
Prediction for Movement and Cognition. Trends Cogn. Sci. 21, 313–332.
43. Dobromyslin, V.I., Salat, D.H., Fortier, C.B., Leritz, E.C., Beckmann, C.F.,
Milberg, W.P., and McGlinchey, R.E. (2012). Distinct functional networks
within the cerebellum and their relation to cortical systems assessed
with independent component analysis. Neuroimage 60, 2073–2085.
44. Sokolov, A.A., Erb, M., Grodd, W., and Pavlova, M.A. (2014). Structural
loop between the cerebellum and the superior temporal sulcus: evidence
from diffusion tensor imaging. Cereb. Cortex 24, 626–632.
45. Schwartze, M., and Kotz, S.A. (2016). Contributions of cerebellar event-
based temporal processing and preparatory function to speech percep-
tion. Brain Lang. 161, 28–32.
46. Heron, J., Hanson, J.V.M., and Whitaker, D. (2009). Effect before cause:
supramodal recalibration of sensorimotor timing. PLoS ONE 4, e7681.
47. Sugano, Y., Keetels, M., and Vroomen, J. (2010). Adaptation to motor-
visual and motor-auditory temporal lags transfer across modalities. Exp.
Brain Res. 201, 393–399.
48. Neszm�elyi, B., andHorvath, J. (2017). Consequencesmatter: Self-induced
tones are used as feedback to optimize tone-eliciting actions.
Psychophysiology 54, 904–915.
49. Houde, J.F., Nagarajan, S.S., Sekihara, K., and Merzenich, M.M. (2002).
Modulation of the auditory cortex during speech: an MEG study.
J. Cogn. Neurosci. 14, 1125–1138.
50. Muller, N., Leske, S., Hartmann, T., Szeb�enyi, S., and Weisz, N. (2015).
Listen to yourself: the medial prefrontal cortex modulates auditory alpha
power during speech preparation. Cereb. Cortex 25, 4029–4037.
51. Oostenveld, R., Fries, P., Maris, E., and Schoffelen, J.M. (2011). FieldTrip:
Open source software for advanced analysis of MEG, EEG, and invasive
electrophysiological data. Comput. Intell. Neurosci. 2011, 156869.
52. Rossi, S., Hallett, M., Rossini, P.M., and Pascual-Leone, A.; Safety of TMS
Consensus Group (2009). Safety, ethical considerations, and application
guidelines for the use of transcranial magnetic stimulation in clinical prac-
tice and research. Clin. Neurophysiol. 120, 2008–2039.
53. Hardwick, R.M., Lesage, E., and Miall, R.C. (2014). Cerebellar transcranial
magnetic stimulation: the role of coil geometry and tissue depth. Brain
Stimulat. 7, 643–649.
54. Th�eoret, H., Haque, J., and Pascual-Leone, A. (2001). Increased variability
of paced finger tapping accuracy following repetitive magnetic stimulation
of the cerebellum in humans. Neurosci. Lett. 306, 29–32.
55. Baess, P., Horvath, J., Jacobsen, T., and Schroger, E. (2011). Selective
suppression of self-initiated sounds in an auditory stream: An ERP study.
Psychophysiology 48, 1276–1283.
56. Gross, J., Baillet, S., Barnes, G.R., Henson, R.N., Hillebrand, A., Jensen,
O., Jerbi, K., Litvak, V., Maess, B., Oostenveld, R., et al. (2013). Good prac-
tice for conducting and reporting MEG research. Neuroimage 65,
349–363.
57. Maris, E., and Oostenveld, R. (2007). Nonparametric statistical testing of
EEG- and MEG-data. J. Neurosci. Methods 164, 177–190.
58. Besl, P.J., and McKay, N.D. (1992). A method for registration of 3-D
shapes. IEEE Trans. Pattern Anal. Mach. Intell. 14, 239–256.
59. Nolte, G. (2003). The magnetic lead field theorem in the quasi-static
approximation and its use for magnetoencephalography forward calcula-
tion in realistic volume conductors. Phys. Med. Biol. 48, 3637–3652.

Please cite this article in press as: Cao et al., Role of the Cerebellum in Adaptation to Delayed Action Effects, Current Biology (2017), http://dx.doi.org/10.1016/j.cub.2017.06.074
STAR+METHODS
KEY RESOURCES TABLE
REAGENT or RESOURCE SOURCE IDENTIFIER
Software and Algorithms
MATLAB The MathWorks https://www.mathworks.com/products/matlab.html
FieldTrip toolbox [51] http://www.fieldtriptoolbox.org/
CONTACT FOR REAGENT AND RESOURCE SHARING
Further information and requests for resources and reagents should be directed to and will be fulfilled by the Lead Contact, Liyu Cao
EXPERIMENTAL MODEL AND SUBJECT DETAILS
Ten healthy, right-handed volunteers (including LC; 5males;mean age = 23.0, SD= 2.7) were recruited from a local participants’ pool.
Participants gave written informed consent prior to the experiment and received monetary compensation after the experiment. None
of the participants had any contraindication to TMS or any neurological, psychiatric, or other relevant medical condition [52]. The
study was approved by the local ethics committee (Ethics Committee of College of Science and Engineering, University of Glasgow)
and was conducted in accordance with the Declaration of Helsinki.
METHOD DETAILS
EquipmentA double-cone TMS coil connected to a MagStim Rapid2 magnetic stimulator (The Magstim Company, Whitland, UK) was used for
stimulating the right cerebellum. This type of coil was used because it has been demonstrated to be the most effective for cerebellar
stimulation when compared to other coils [53]. A 248-magnetometers whole-head MEG system (MAGNES 3600 WH, 4-D Neuroi-
maging) was used for MEG data recording with a sampling rate of 1,017Hz.
General ProcedureEach participant was tested in a real stimulation and a sham stimulation condition on different days (at least 6 days apart). In each
stimulation condition (Figure 1A), sensory attenuation effect was measured three times using the same procedure (see ‘MEG
measurements’ section below) and the stimulation was performed after the first sensory attenuation measurement. After baseline
sensory attenuation measurement (pre-Sham/pre-Real), participants were encouraged to take a break, after which the rTMS
stimulation was performed outside the magnetically shielded room. The second sensory attenuation measurement (post1-Sham/
post1-Real) started just after the stimulation. The delay between the end of rTMS and the start of second sensory attenuation
measurement was comparable (t(9) = �0.97, p = 0.36) between real (mean = 2.60; SD = 0.38; in minutes) and sham stimulation
condition (mean = 2.92; SD = 1.09; in minutes). The delay between the end of the second sensory attenuation measurement and
the start of the third sensory attenuation measurement (post2-Sham/post2-Real) was always about 15 min (about 25 min after
TMS stimulation) for each condition and each participant.
Transcranial Magnetic StimulationA 15min inhibitory 1 Hz repetitive stimulation protocol (1Hz-rTMS) was used. Initially, the cerebellar stimulation location was set using
the same scalp co-ordinates as in [54], 1cm below and 3cm to the right of the Inion. The scalp coordinates were then projected onto
individual’s structural MRI (obtained at least 6 days before any MEG recordings) via Brainsight (Rogue Research) to ensure effective
targeting of the cerebellum. In 5 participants, the stimulation location was then moved down by �0.5 cm from the initial point as its
projection was localized in between the occipital cortex and the cerebellum. The final stimulation point was determined prior to the
first sensory attenuation measurement. The stimulation intensity was set at 50% of maximum stimulator output; however, in 7 of the
10 tested participants the intensity was adjusted to reduce discomfort caused by muscular activation (mean stimulation intensity in
10 participants = 46.5%; post hoc check showed that the stimulation intensity was not correlated with main effects reported in the
study). In sham stimulation condition, the double-cone coil was placed at the same location as in the real stimulation condition but
was tilted by 90� to the left so that the effective magnetic field from the coil was directed away from the participant’s head. Three
participants received real stimulation first and the remaining received sham stimulation first.
Current Biology 27, 1–10.e1–e3, August 21, 2017 e1

Please cite this article in press as: Cao et al., Role of the Cerebellum in Adaptation to Delayed Action Effects, Current Biology (2017), http://dx.doi.org/10.1016/j.cub.2017.06.074
MEG MeasurementsTo measure sensory attenuation effect, 100 self-generated tones and 100 external tones (computer-controlled) were presented in
alternating order one by one in the same sensory attenuation testing block (120 trials for each tone in each block were used for
LC, who was the first participant) [55]. Both tones were 1000 Hz, 100ms in duration and were set to be at a comfortable volume level.
Tones were delivered through a plastic ear tube. The testing block started with an external tone, and then participants waited
about 3 s to initiate a self-generated tone by briskly lifting their right index finger (Figure 1B). The finger lift was detected by a laser
sensor which served the function of a response box. Using the laser sensor has the advantage to avoid the noise associated with the
keys of a normal response box so that the only auditory input was the tone. Critically, a delay (mean = 92.0 ms; SD = 4.3 ms) was
introduced between the finger lift and the tone output from the ear tube. After the self-generated tone, the next external tone was
presented after a random interval between 1500 ms and 4500 ms, followed by another self-generated tone and so on until 200 tones
were played. Participants received a few trials of practice before the first sensory attenuation measurement to get familiarized with
the paradigm. During the practice, a ‘too fast’ visual warning signal was given if participants responded within 1500 ms from the end
of the previous external tone. No warning signals were given if participants responded any time after 1500 ms. Participants were
asked to close their eyes during the sensory attenuation measurement. Each sensory attenuation measurement took about
10 min, which means that it took around 25min from the end of TMS to the end of the last sensory attenuation measurement session.
QUANTIFICATION AND STATISTICAL ANALYSIS
PreprocessingData analysis was performed with MATLAB using FieldTrip toolbox [51] (http://www.fieldtriptoolbox.org/) conforming to recent MEG
data analysis guidelines [56]. MEG signals in all testing sessions were high-pass filtered at 0.75 Hz and trials with very short inter-trial
intervals (less than 1500ms for self-generated tones) were discarded. Then very noisy trials and channels from visual inspection were
rejected with ft_rejectvisual, followed by denoising using the fieldtrip function ft_denoise_pca. Rejected bad channels were repaired
with interpolationmethods using ft_channelrepair with default parameters. MEG signals were visually inspected again and noisy trials
were discarded. Eye movement and heart artifacts were rejected using ICA (between 1 and 5 components per participant per
session). After this step, 98.2 (SD = 6.8) trials and 98.7 (SD = 6.7) trials were left for self-generated tones and external tones,
respectively.
Sensor Space Evoked ResponsesMEG signals were low-pass filtered with 40 Hz cut-off frequency. Event related fields aligned to the tone onset were computed for
each testing session with baseline (�600 to�200ms) correction. In the baseline time window, time domain averaged response were
compared between self-generated tones and external tones using a cluster correction to ensure that there were no significant
differences in any sub-epochs [57]. The M100 component was defined in a post-stimulus time window between 70 and 100 ms
and M200 component was between 125 and 155 ms. To test the existence of the M100/M200 attenuation effect for self-generated
tones, paired t tests were performed on the amplitudes of evoked responses (averaging across the defined time windows) between
self-generated tones and external tones. The p value of 0.05 was taken as the statistical significance cut-off throughout the paper.
Topographies of M100 and M200 components were illustrated with the evoked responses of external tones in the pre-Real session.
ANOVA AnalysisFor each component (M100, M200), changes of attenuation effect over testing sessions were first tested with within-subject ANOVA
(implemented in Fieldtrip with ft_statfun_depsamplesFunivariate), separately for sham and real stimulation condition (Figures 3
and 5). TheM100 attenuation effect was calculated by subtracting the evoked amplitude of external tones from the evoked amplitude
of self-generated tones and the M200 attenuation effect was calculated the other way around by subtracting self-generated tones
from external tones. This is to ensure that both M100 attenuation and M200 attenuation effects have positive values in the baseline
session (due to the opposite polarity of the two evoked components). Two significant auditory sensors with the largest F values were
selected for illustrating the evoked responses. To test effects associated with stimulation condition, a 2 (sham versus real stimulation)
by 2 (post1 versus post2) within-subject ANOVA was performed with baseline referenced attenuation, which was obtained by sub-
tracting the M100/M200 attenuation effect recorded during each pre-stimulation session (pre-Sham, pre-Real) from the correspond-
ing post-stimulation sessions.
Lastly, M100 amplitude for self-generated and external tones in sham stimulation condition, where significant M100 attenuation
changes were found, was subjected to a 2 (self-generated versus external) by 3 (testing sessions) within-subject ANOVA. The differ-
ence between M200 amplitude for self-generated and external tones was tested for the real stimulation condition, where significant
M200 attenuation changes were found, by means of a 2 (self-generated versus external) by 3 (testing sessions) within-subject
ANOVA. See results section for details.
Source Space AnalysisThe same source localization method was used as in a previous study [4]. A semi-automatic procedure was used to co-register each
participant’s T1-weighted structural magnetic resonance images to the MEG coordinate system. The initial alignment of the two
e2 Current Biology 27, 1–10.e1–e3, August 21, 2017
Please cite this article in press as: Cao et al., Role of the Cerebellum in Adaptation to Delayed Action Effects, Current Biology (2017), http://dx.doi.org/10.1016/j.cub.2017.06.074
coordinate systems were based on nasion and left and right pre-auricular points, which were manually identified in the individual’s
structural image. Then the ICP algorithm [58] was used to achieve the numerical optimization of alignment.
The segmentation routines in FieldTrip/SPM5 were followed to create individual head models. A single shell volume conductor
model [59] was used for the leadfield computation with a 10 mm grid defined on the template (MNI) brain. The template grid was
then transformed into individual head space through linear spatial transformation. We used eLoreta algorithm as implemented in
Fieldtrip for source space signal calculation, which was taken as the sum of the first two rank data. The covariance was calculated
in the timewindow from�800ms to�300ms (relative to stimulus onset) with lambda setting at 0.07. A normalization of 0.6 was used.
For localizing evoked responses, sensor space data were processed in the same way as in the sensor space data analysis. For
exploring low-frequency activities in the cerebellum, sensor space data were low-pass filtered at 10 Hz and single trial data were
extracted by a matrix multiplication between sensor space data and spatial filters.
Within-subject t tests with Monte Carlo randomization (1000 permutations) were used for all source space brain-wide statistical
comparisons unless otherwise specified. Multiple comparisons were corrected with false discovery ratemethod and only statistically
significant results were reported.
M100 attenuation in the pre-Sham session was localized by comparing between the M100 component for self-generated tones
and the M100 component for externally generated tones in the source space. Localization of baseline session M100 attenuation
was performed similarly but with data from both pre-Sham and pre-Real sessions averaged. To find the source of the increase of
M100 attenuation in the sham stimulation condition,M100 attenuation in each testing sessionwas first calculated as theM100 source
intensity difference between self-generated tones and externally generated tones through subtraction. Then the M100 attenuation in
post2-Sham was compared to the average of pre-Sham and post1-Sham, as M100 attenuation only increased in the post2-Sham
session.
M200 attenuation in the pre-Real session was localized by comparing between the M200 component for self-generated tones and
the M200 component for externally generated tones in the source space. For baseline session M200 attenuation effect, it is
compared similarly but with data from both pre-Sham and pre-Real sessions averaged. To find the source of the change of M200
attenuation in the real stimulation condition, M200 attenuation in each testing session was first calculated as the M200 source inten-
sity difference between self-generated tones and externally generated tones through subtraction. Then the average of M200 atten-
uations in post1-Real and post2-Real was compared to M200 in pre-Real, as M200 attenuation started to change right after
cerebellar stimulation.
To find possible pre-stimulus low-frequency changes in the cerebellum following TMS, the average amplitude of 10 Hz low-pass
filtered pre-stimulus (�500ms to 0ms) activity was calculated for each trial in each condition. Between-subject t tests were made for
the pre-stimulus activity between post1 session and pre- session, between post2 session and pre- session, which were added up to
form a t-value index of pre-stimulus activity change after TMS. This t-value index was calculated separately for self-generated tones
and external tones, for real and sham stimulation condition. TMS induced effect on pre-stimulus activity was investigated by
comparing the t-value index between real and sham stimulation condition. Pre-stimulus activity changes over testing sessions
were tested by comparing the t-value index against 0.
DATA AND SOFTWARE AVAILABILITY
Interested readers are encouraged to contact the Lead Contact for the availability of data.
Current Biology 27, 1–10.e1–e3, August 21, 2017 e3

Current Biology, Volume 27
Supplemental Information
Role of the Cerebellum
in Adaptation to Delayed Action Effects
Liyu Cao, Domenica Veniero, Gregor Thut, and Joachim Gross
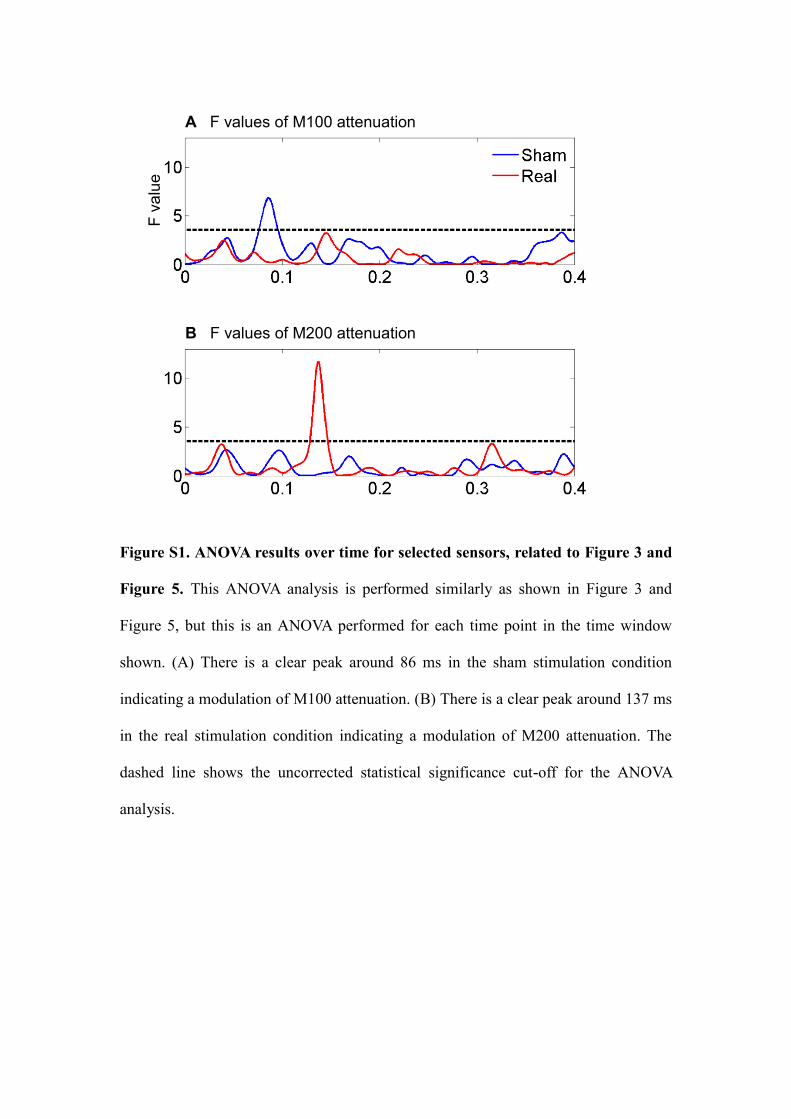
Figure S1. ANOVA results over time for selected sensors, related to Figure 3 and
Figure 5. This ANOVA analysis is performed similarly as shown in Figure 3 and
Figure 5, but this is an ANOVA performed for each time point in the time window
shown. (A) There is a clear peak around 86 ms in the sham stimulation condition
indicating a modulation of M100 attenuation. (B) There is a clear peak around 137 ms
in the real stimulation condition indicating a modulation of M200 attenuation. The
dashed line shows the uncorrected statistical significance cut-off for the ANOVA
analysis.
B F values of M200 attenuation
A F values of M100 attenuation
F v
alu
e
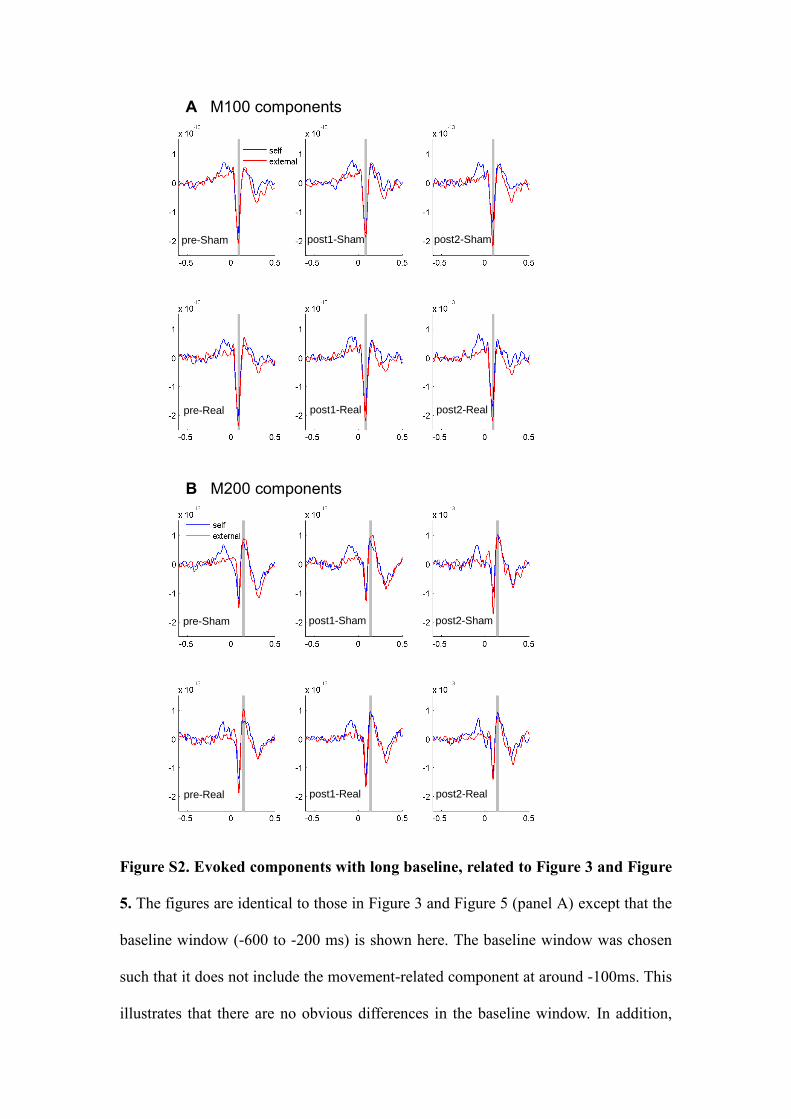
Figure S2. Evoked components with long baseline, related to Figure 3 and Figure
5. The figures are identical to those in Figure 3 and Figure 5 (panel A) except that the
baseline window (-600 to -200 ms) is shown here. The baseline window was chosen
such that it does not include the movement-related component at around -100ms. This
illustrates that there are no obvious differences in the baseline window. In addition,
B M200 components
pre-Real post1-Real post2-Real
pre-Real post1-Real
A M100 components
post2-Real
pre-Sham post1-Sham post2-Sham
pre-Sham post1-Sham post2-Sham

we statistically tested for any significant differences in the baseline time window. We
performed standard cluster statistics using monte-carlo randomization. This analysis
would identify time windows in the baseline that show significant differences
between conditions (self-generated tones versus externally generated tones) in pre-
TMS sessions for time domain averaged responses. No significant results were found.

Testing session
Stimulation condition
pre post 1 post 2
Sham
3.26 (0.84) 3.39 (0.75) 3.38 (0.47)
Real
3.01 (0.61) 3.35 (0.56) 3.46 (0.66)
Table S1. Mean reaction time across different conditions, related to Figure 4. The
reaction time is calculated as the interval between the end of the external tone and the
onset of the next self-generated tone. Group means are show in the table (in seconds;
with standard deviation in brackets). No significant interaction was found following a
2 (sham vs. real) by 3 (testing sessions: pre, post1, post2) ANOVA with the reaction
time data (F(2,18) = 0.76, p = 0.48). Main effects of stimulation condition: F(1,9) =
0.08, p = 0.78; testing session: F(2,18) = 6.43, p = 0.01.


