
RMBI or RMBR?
Is the Renminbi Destined to Become a Global or Regional Currency?
Barry Eichengreen (University of California, Berkeley, and CIGI)
and Domenico Lombardi (CIGI)
Abstract
Previous studies have focused on when the renminbi will play a significant role as an
international currency, but less attention has been paid to where. We fill this gap by contrasting
two answers to the question. One is that the renminbi will assume the role of a global currency
similar to the U.S. dollar. Supporters point to China’s widely diversified trade and financial
flows and to its institutional initiatives, not just in Asia but around the world. The other is that
the renminbi will play a regional role in Asia equivalent to that of the euro in greater Europe.
Proponents of this view argue that China has a natural advantage in leveraging regional supply
chains and deepening its links with other Asian countries as well as in developing regional
institutions. Asia, they argue on these grounds, will become the natural habitat for the renminbi.
JEL Codes: E42, E50, E6, F31, F4.
Keywords: Financial integration, foreign exchange, network externalities, regional currency,
renminbi internationalization.
Acknowledgements: The authors acknowledge CIGI for supporting this project and Coby Hu
for excellent research assistance.
- 2 -
1. Introduction
Although much has been written about when China’s currency, the renminbi, will assume
an international role, less attention has been paid to the question of where. One view is that the
renminbi will eventually challenge the dollar as the leading global currency. Supporting theories
posit that network effects are strong, meaning that if it pays for banks, firms and governments in
some countries to do business in renminbi then it will pay for banks, firms and governments in
other countries to do so as well, regardless of where they are located. Supporting evidence
includes the fact that China engages in merchandise and commodity trade with economies in
every part of the world, as befits its position as the largest national exporter. China similarly
makes direct foreign investments in every region. From these observations flows the conclusion
that the renminbi will ultimately come to rival the U.S. dollar as a global currency.
The alternative is that is that the renminbi is destined to be a leading regional currency, in
Asia in particular. Its future international role, in this case, will more closely resemble that of the
euro than the dollar. The euro is used as an international unit of account, means of payment and
store of value primarily in Europe’s neighborhood – in European countries that are not members
of the euro area, in other words, and in countries to Europe’s immediate east and south.
Empirical studies confirm that the influence of geographical distance on international trade
remains significant, reflecting transportation costs, broadly defined.1
More strikingly,
geographical distance also matters for financial transactions, reflecting the cost and difficulty of
acquiring and disseminating information across space. Given how use of a currency in cross-
border transactions flows from the geography of those transactions, this implies a bias toward
use of a given currency unit in the economic neighborhood of its national issuer. Similar to the
role of the euro in Greater Europe, it follows that Asia is the natural region in which the renminbi
will come to act as an international currency.
Consistent with this observation, the first seven countries to establish mechanisms for
direct trading of their currencies against the renminbi – rather than buying and selling dollars as
an intermediate step toward acquiring and disposing of the Chinese currency – were Asian
countries. Efforts to foster renminbi internationalization have also relied heavily on developing
transactions with an offshore financial center, Hong Kong, whose prominence reflects precisely
its location in Asia. These reflections suggest that the renminbi will come to play an important
role mainly in the region.
Political scientists (e.g. Helleiner and Korschner 2014) argue that the decision to use a
currency in cross-border transactions reflects not just economic links with the issuer but also the
latter’s ability to project political leverage and power. The dollar has an important role, these
analysts observe, in regions where the U.S. has political influence. China is best able to project
leverage and power in the South China Sea and elsewhere in in the Asia-Pacific region, lacking
as it does the aircraft carriers and allies needed to project them over longer distances, at least to
an equivalent extent. Again the conclusion follows that the renminbi’s future is as a regional
currency for Asia more than as a global currency in the manner of the dollar.
1 “The death of distance has been exaggerated,” as Anderson and van Wincoop (2004) put it in their survey of the
literature on trade costs.

- 3 -
The rebuttal is that the tyranny of distance is declining with improvements in
transportation and information technologies. It may be true that the first seven countries to
establish direct trading in renminbi were in Asia, but a growing number of countries in other
parts of the world have followed suit. Hong Kong’s special status as an offshore renminbi center
is now being challenged by newly established centers from Singapore and Frankfurt to London
and Toronto. This trend is likely to continue as China relaxes restrictions on use of the renminbi
and opens its capital account.
Our goal in this paper is to evaluate these two views of the renminbi’s prospective role as
an international unit of account, means of payment and store of value for private and official
transactions. We begin in Section 2 with a review of the theory and history of international
currencies. In Sections 3 and 4 we then develop the cases for a global and regional role for the
renminbi, respectively. Our conclusions, in Section 5, are mixed, reflecting the fact that this
paper has not only two views but also two authors.
2. Theory and History
Eichengreen (2014) distinguishes two classes of models of international currency status.
One class (examples of which include Krugman 1980, 1984 and Matsuyama, Kiyotaki and
Matsui 1993) emphasizes the power of network effects in the international monetary domain.
Because of the importance of network increasing returns, once a currency is adopted for
international transactions it comes to be used widely. In these models, it pays to do international
business in the same currency that one’s counterparties use in their own international
transactions, including in transactions with third parties.
These network increasing returns can neutralize other disadvantages of using a potential
international currency, for example, that the central bank issuing it and therefore acting as
liquidity provider of last resort in that unit is in a different region and time zone. From this it
follows that once a currency is used in international transactions in some countries, it will come
to be used globally. Other implications include the fact that first-mover advantage is powerful,
that persistence is strong, and that international currency status may be a natural monopoly.
Many of these theoretical analyses are motivated by the desire to understand the international
role of the U.S. dollar, which is used as an international unit of account, means of payment and
store of value globally and not merely, say, in the Western Hemisphere.
The alternative (“new”) view of international currency status does not deny the existence
of network increasing returns but builds on theoretical work on open systems (see e.g. Farrell
and Klemperer 2007). In this view, increasing returns may exist but are not large, and
interchangeability costs in high-tech 21st century financial markets are no longer so high. By
implication, it is possible to have low transaction costs and stable and predictable prices in cross-
border transactions in several national currencies. It follows that other modest advantages (that
the liquidity provider of last resort of a currency is in the same time zone or that there are other
benefits of proximity, for example) may be determining factors in the decision by a bank, firm or
government regarding which currencies to use for international transactions. In this class of
models, multiple currencies can play a role in the international domain, with different units being
used by different counterparties, including in different locations, as a function of local or
regional characteristics.
- 4 -
Proponents of both views draw support from history. Those who subscribe to the old
view, point to the dominance of specific currencies in international transactions at different
points in time: the pound sterling before 1914 and the U.S. dollar after 1945. Their analyses
highlight how these currencies were widely used in cross-border transactions around the world.
They emphasize evidence of persistence or lock-in, with the currencies in question continuing to
play global roles even after the share of the issuing country in international transactions had
peaked, consistent with a setting in which network increasing returns are strong.
Advocates of the alternative (“new”) view argue that a closer look reveals that there has
always been more than one consequential international currency at a given point in time, and that
the use of different currencies has typically had a regional dimension. Lindert’s (1969) study
showed that the foreign exchange reserves of central banks and governments in 1900 and 1913
were divided between the British sterling, the French franc and the German mark. Building on
Lindert’s work, Eichengreen and Flandreau (1996) describe how the mark was held and used
mainly in Eastern and Southeastern Europe as well as in parts of Scandinavia, while the franc
was used in Western European countries like Spain, Belgium and Switzerland, and the sterling
dominated in Latin America and in the British Commonwealth and Empire.
Eichengreen and Flandreau (2009) provide a parallel analysis of the 1920s and 1930s.
They find that sterling and the U.S. dollar both featured prominently in the reserve portfolios of
central banks and governments, with the sterling playing an important role in Scandinavia
(having by this time displaced the German mark), in Portugal and other European members of
the so-called sterling area and, as before, in the British Commonwealth and Empire, while the
dollar took on a growing role in other parts of the world, including Latin America. That there
were shifts relative to the pre-World War I position, with Scandinavia moving into sterling’s
camp and the dollar being utilized more widely in Latin America, poses a challenge to the
traditional view emphasizing lock-in and persistence. Extrapolated to the future, this suggests
that there may be greater scope for relatively rapid adoption of the renminbi for cross-border
transactions in Asia than globally.
Another literature examines the use of international currencies during and after the
Bretton Woods period. Some authors such as Bergsten (1975) suggest that the Bretton Woods
system is properly viewed as a tripartite structure consisting of three blocs based on sterling, the
dollar and gold. The interwar and wartime sterling area persisted, while the rest of the world
coalesced into gold and dollar blocs. Members of the dollar area (Brazil, Canada, Israel, Japan,
Mexico, Norway, Saudi Arabia, Sweden, Thailand, Turkey, Venezuela, Germany from 1967 and
Spain from 1970) took the bulk of their exchange earnings in dollars. Members of the gold bloc,
in contrast, took fully 75 per cent of their increased reserves in the form of gold in the 1960s.
The core members of this post-World War II gold bloc – Belgium, France, Italy, the Netherlands
and Switzerland – were not only geographically contiguous but had also been core members of
the gold bloc of the 1930s and, indeed, key members of the 19th
century Latin Monetary Union.
Others like McKinnon (1979) argue that the dollar was the dominant international vehicle
and reserve currency in transactions among banks and the primary currency of invoice in
international commodity trade throughout this period. They refer not to the Bretton Woods and
post-Bretton Woods systems but to the “gold-dollar system” through the early 1970s and the
“dollar” or “limping-dollar standard” thereafter. Members of this school (e.g. Prasad 2014)

- 5 -
emphasize the extent to which the international monetary and financial system is still heavily
dollar based even today. Goldberg and Tille (2005) show that the dollar’s use in invoicing
international merchandise transactions remains far in excess of the U.S. share of global
merchandise trade. The dollar is used in 85 per cent of global foreign exchange transactions, far
in excess of the U.S. share of global cross-border financial transactions. And the dollar continues
to comprise more than 60 per cent of global identified foreign exchange reserves despite the fact
that the U.S.’ share of global GDP is no more than 25 per cent.
These observations are consistent with strong network increasing returns, in the manner
of traditional models in which a single national currency dominates international transactions. In
the extreme, the implication of this view emphasizing dollar dominance is that in order for the
renminbi to become a true international currency it will not only have to supplant the dollar, but
that it also will have to do so globally. The rebuttal is that the Bretton Woods and post-Bretton
Woods periods were special by virtue of the absence of viable alternatives to the dollar, which
was the dominant international currency by default, as no other national unit possessed the scale,
stability and liquidity needed to render it attractive for widespread cross-border use. This is
something that will now change, it is hypothesized, as the renminbi acquires the stability and
liquidity required to assume a consequential international role.
If this hypothesis is correct, then the dollar and the renminbi may eventually coexist in
the international domain. The question is whether they will both be used globally, in cross-border
transactions with counterparties around the world, or mainly in different regions: the renminbi in
Asia and the dollar in other parts of the world.
3. The Case for a Global Currency
There is no one-to-one mapping between trade and financial transactions with a country
on the one hand and the likelihood of using its currency as an international unit of account,
means of payment and store of value on the other. But studies establishing this fact also establish
a positive association between the two tendencies: that more extensive economic relations with a
country increase the likelihood of using its currency in cross-border transactions. This is not
surprising given that firms, banks and others in a country will have a natural preference for using
their domestic currency in cross-border transactions, in turn conferring on their foreign
counterparties an incentive to accommodate that preference. Goldberg and Tille (2005)
document this for the choice of currency for invoicing merchandise transactions. The earlier
literature has similarly shown that trade and financial transactions with a country, the use of its
national unit to settle those transactions, and the need to hold these currencies in foreign reserves
go together.
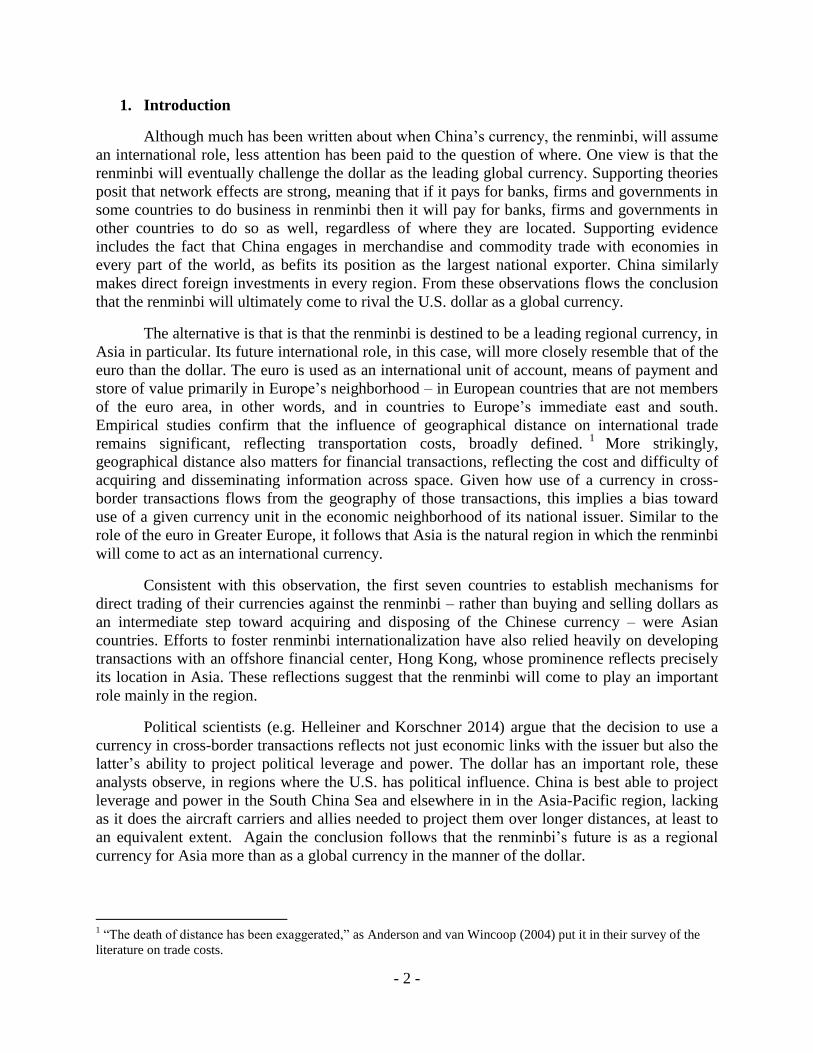
It is therefore relevant to observe that China’s foreign trade and financial transactions are
widely distributed across regions. Figures 1 and 2 show the geographical distribution of China’s
imports and exports. Only one quarter of China’s exports go to other Asian countries, excluding
Hong Kong, Macao and Taiwan, while an additional 24 per cent go to Europe, and 23 per cent to
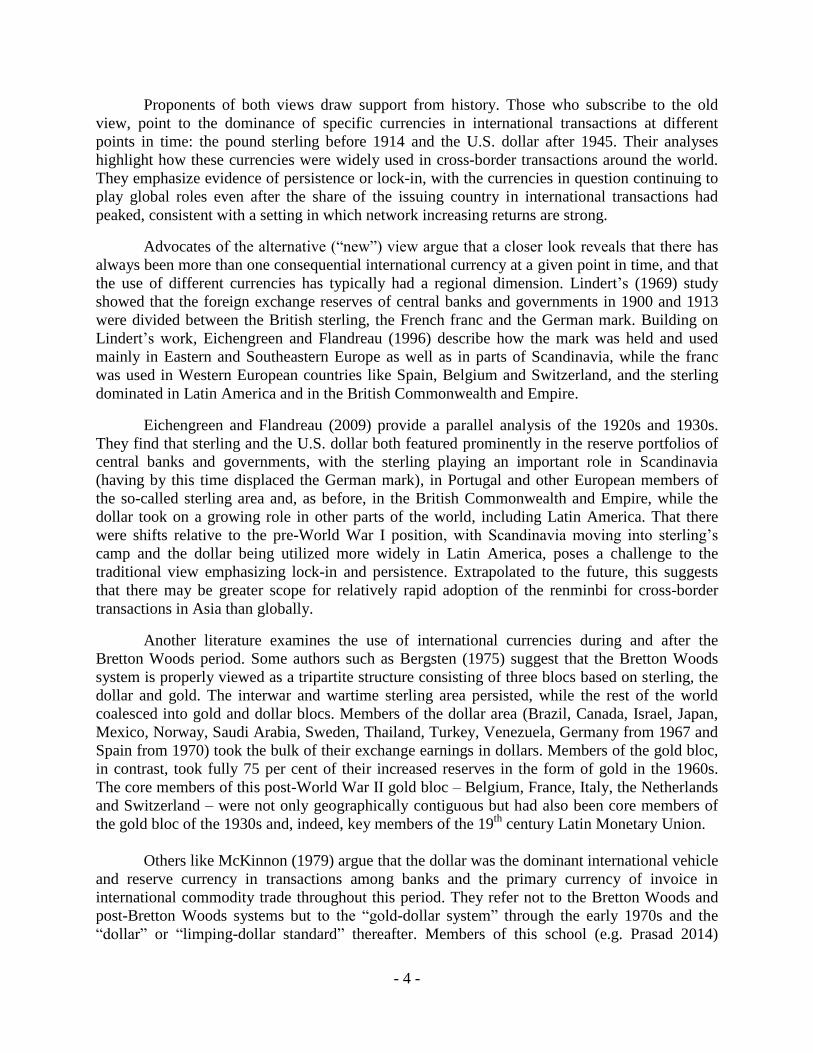
North America. The regional composition of China’s imports is more concentrated, but only
slightly, with one third of the total drawn from other Asian countries. This difference on the
import side reflects China’s role in global supply chains, where large volumes of intermediate

- 6 -
goods from Asia (industrial materials, parts and components, and semi-finished goods, for
example) are imported to be processed for subsequent export (Choi 2015).
Figure 1. Regional Composition of China’s Exports, 2013
Source: UN Comtrade Database.
*Taiwan is included in Comtrade data under “Other Asia, not elsewhere specified”. A small portion may include
Other Asia, not elsewhere specified. See http://unstats.un.org/unsd/tradekb/Knowledgebase/Taiwan-Province-of-
China-Trade-data.
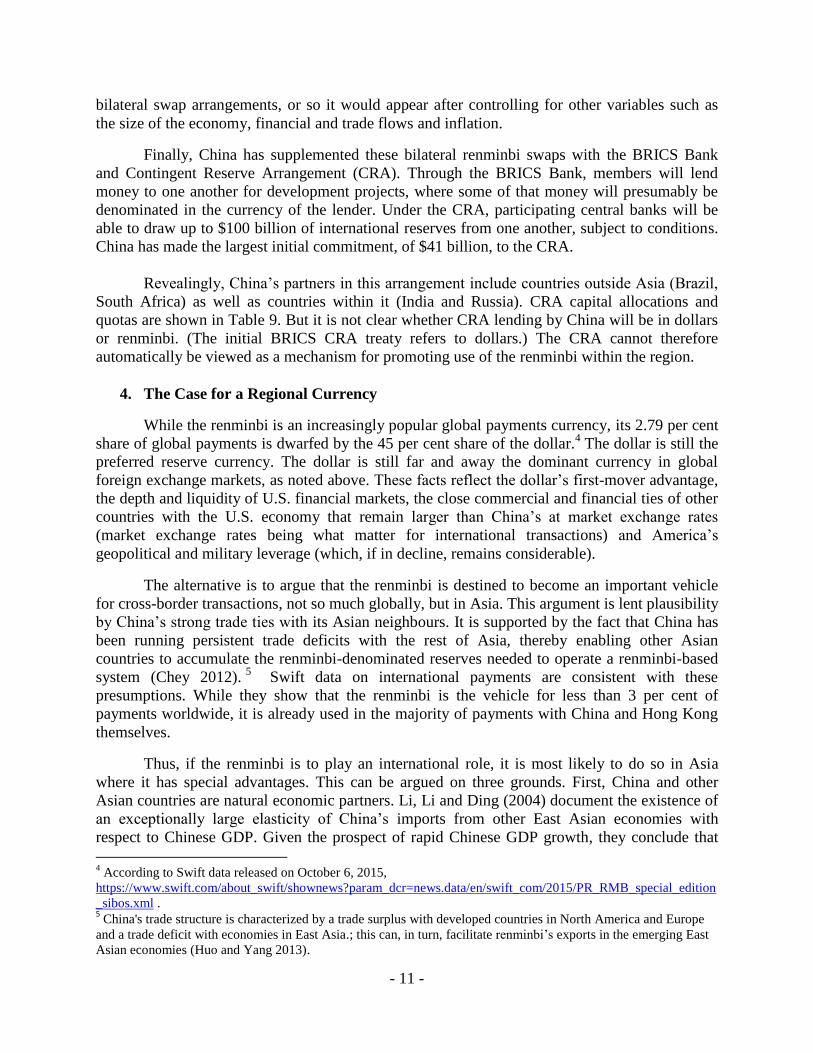
At first glance, the direction of China’s foreign direct investment, depicted in Figure 3, is
more concentrated, with the majority destined for Hong Kong, Macao and Taiwan. But these
offshore centers are serving mainly as intermediaries for Chinese foreign investment ultimately
destined for other countries. Excluding offshore centers, Chinese foreign investment is widely
distributed. This reflects investments by Chinese enterprises in commodity- and energy-related
sectors as well as manufacturing.
Likewise, China’s free trade agreements (FTAs) reflect its geographically diversified
trade and investment flows. Although the country’s early FTAs were with countries in Asia
(ASEAN in 2004, Pakistan in 2006, Singapore in 2008), China has since negotiated agreements
with countries in other parts of the world (including, to date, Chile, Peru, Costa Rica, Iceland and
Switzerland; see Table 1). FTAs under discussion or likely to be under discussion in the future
suggest that this geographically diversified approach to negotiations will persist.
With the growth of China’s trade and financial links comes an incentive to conduct
transactions in renminbi. In turn, this creates an incentive to stabilize a trade partner’s local
currency against the renminbi, which encourages the central banks of these countries to hold
renminbi-denominated foreign exchange reserves and establish contingent renminbi liquidity
lines with the People’s Bank of China (PBOC). But is this last tendency limited mainly to Asia
or observed more widely? To address this issue, Subramanian and Kessler (2013) estimated
“Frankel and Wei regressions,” where the value of the local currency against a numeraire, in this
Africa, 2%
Asia, 24%
Europe, 24%
Latin America & Caribbean, 8%
Middle East and North Africa, 3%
North America, 23%
Oceania , 2%
Hong Kong, Macao, Taiwan , 14%
Africa
Asia
Europe
Latin America & Caribbean
Middle East and North Africa
North America
Oceania
Hong Kong, Macao, Taiwan andOther Asia*

- 7 -
case the Swiss franc, is taken as a function of the renminbi/franc, dollar/franc, yen/franc and
euro/franc rates. We update their results for a sample of 41 countries, as shown in Table 2 for the
period January 2013 to January 2016 (as well as for the July 2012-July 2015 period).
Specifically, we estimate:
𝑑𝑙𝑛 (𝑋𝑡
𝐶𝐻𝐹𝑡)
= 𝑝1 ∗ 𝑑𝑙𝑛 (𝑈𝑆$𝑡
𝐶𝐻𝐹𝑡) + 𝑝2 ∗ 𝑑𝑙𝑛 (
𝑅𝑀𝐵𝑡
𝐶𝐻𝐹𝑡) + 𝑝3 ∗ 𝑑𝑙𝑛 (
𝐸𝑈𝑅𝑡
𝐶𝐻𝐹𝑡) + 𝑝4 ∗ 𝑑𝑙𝑛 (
𝐽𝑃𝑌𝑡
𝐶𝐻𝐹𝑡)
+ 𝛼 + 𝑒𝑡 (1)
where dln ( ) denotes the change in the log of currency X, the U.S. dollar, the yuan, the euro, and
the Japanese yen, all against the Swiss franc.. The dominant reference currency in Table 2 is then
taken as the currency with the largest effect on the exchange rate of the countries considered.
Figure 2. Regional Composition of China’s Imports, 2013
Source: UN Comtrade Database.
As one would expect, we find the dollar to be the dominant reference currency for many
countries throughout the Americas, Asia, Europe and the Middle East. The euro tends to be the
dominant reference currency mainly for European countries. Interestingly, the renminbi is the
second dominant reference currency in Asia, and in particular for the ASEAN economies.2
In addition to having the strongest effect in a number of Asian countries, the renminbi
also has a significant effect in several South American countries, and a statistically significant
2 It is possible to think that the observed correlation of other Asian currencies with the renminbi reflects the fact that
they have a common correlation with the dollar. But we are controlling separately – and directly – in these
regressions for their correlation with the dollar.
Africa, 6%
Asia, 33%
Europe, 19% Latin America & Caribbean, 7%
Middle East and North Africa, 9%
North America, 10%
Oceania, 6%
Hong Kong, Macao, Taiwan, 10% Africa
Asia
Europe
Latin America & Caribbean
Middle East and North Africa
North America
Oceania
Hong Kong, Macao, Taiwan andOther Asia*

- 8 -
effect in a number of European countries as well.3 The renminbi tends to be important for Russia,
India, South Africa and Brazil, as well as for countries elsewhere such as Israel, Mexico and
Peru.
Table 3 shows that the weight on the renminbi is plausibly a function of commercial and
financial links between a given country and China – links that are as much global as regional.
Following Subramanian and Kessler, we relate the coefficient on the renminbi/Swiss franc
exchange rate in the preceding equation to bilateral trade with China, the similarity of inflation
rates, and common financial shocks:
𝑝𝐶𝑜𝑢𝑛𝑡𝑟𝑦 𝑖𝑅𝑀𝐵 =
𝛼 ∗ 𝑆ℎ𝑇𝑟𝑎𝑑𝑒𝐶𝑜𝑢𝑛𝑡𝑟𝑦 𝑖𝐶ℎ𝑖𝑛𝑎 + 𝛽 ∗ 𝐶𝑜𝑚𝑚𝑜𝑛𝐼𝑛𝑓𝑙𝑎𝑡𝑖𝑜𝑛𝐶𝑜𝑢𝑛𝑡𝑟𝑦 𝑖
𝐶ℎ𝑖𝑛𝑎 + 𝛾 ∗ 𝐶𝑜𝑚𝑚𝑜𝑛𝐹𝑖𝑛𝑎𝑛𝑐𝑖𝑎𝑙𝑆ℎ𝑜𝑐𝑘𝑠𝐶𝑜𝑢𝑛𝑡𝑟𝑦 𝑖𝐶ℎ𝑖𝑛𝑎 + 𝑒𝑖
Common inflation shocks are measured as the correlation between a country’s monthly inflation
rate and that of China during the period January 2012-December 2014, while common financial
shocks are then taken as the correlation between a country’s reference stock market index daily
returns and the Shanghai Stock Exchange A Share Index daily returns over the July 2012-
October 2014 period. The data correspond to the sample in Subramanian and Kessler (2013). See
below for a detailed list of the stock market indices. Both the inflation figures and the stock
index return figures are logged. The share of trade is measured as the proportion of a country’s
imports from China relative to the imports from the rest of the world. This figure is taken as the
average import ratios for the 2012-2013 period.
Figure 3. Regional Composition of China’s Overseas Direct Investment, 2013
Source: CEIC Database.
3 This is in contrast to the euro, whose effect is limited to other European countries, and the dollar, which according
to this methodology, is the most important exchange rate for countries in a variety of different regions, as befits a
global currency.
Africa 3%
Asia 9%
Europe 6%
Latin America & Caribbean
13%
Middle East and North Africa
2%
North America 5% Oceania
3%
Hong Kong, Macao, Taiwan
59%
Africa
Asia
Europe
Latin America & Caribbean
Middle East and North Africa
North America
Oceania
Hong Kong, Macao, Taiwan

- 9 -
In Table 3 the coefficient of a country’s financial shock is positive and statistically
significant at the 10 per cent confidence level. Thus, we observe a larger renminbi co-movement
from a higher correlation for a country’s financial market with China, controlling for inflation
and trade. Evidently, the coefficients for inflation shocks and trade shares, although negative, do
not seem to affect the renminbi co-movement for the sample countries’ exchange rates.
The question of whether the renminbi’s future is mainly as a regional or global currency
should be addressed from an institutional perspective as well. Beijing has used the China
Development Bank and Export-Import Bank of China, for example, to promote renminbi-
denominated lending and settlement. Countries to which these institutions lend receive funds in
renminbi, which they then use to finance imports from China and to purchase the services of
Chinese construction companies. While a significant share of the lending by these state banks is
to other Asian countries, a non-negligible share is to countries and companies outside the region
(to the government of Venezuela in 2010, for example, and to small and medium-size enterprises
in a variety of African countries).
China has recently sponsored the creation of the Asian Infrastructure Investment Bank
(AIIB) to promote infrastructure investment in the Asia-Pacific region and, not incidentally, to
create business for Chinese construction companies. Although the AIIB’s current objective is to
contribute to Asian infrastructure development and regional integration, membership is global,
not regional, with 57 prospective founding members at the time of writing. These include 24
countries in Asia, 20 in Europe and 9 in the Middle East (see Table 4). These countries will all
be contributing capital to the bank, and their construction companies and consultants will
similarly be competing for business. It therefore will not be surprising to see the AIIB expand its
operations to developing countries outside of Asia.
Other institutional bases for wider international use of the renminbi include swap lines
with the PBOC, the designation of a Chinese financial institution as official clearing bank for
settling renminbi-denominated transactions, and a quota for investing in China’s local-currency
equity market (an RQFII quota). Weir (2015) refers to these initiatives as the “three gifts,” since
they require negotiation and agreement with the Chinese authorities and since they tend to go
together. They represent implicit endorsement by the Chinese authorities of a center’s offshore
RMB status.
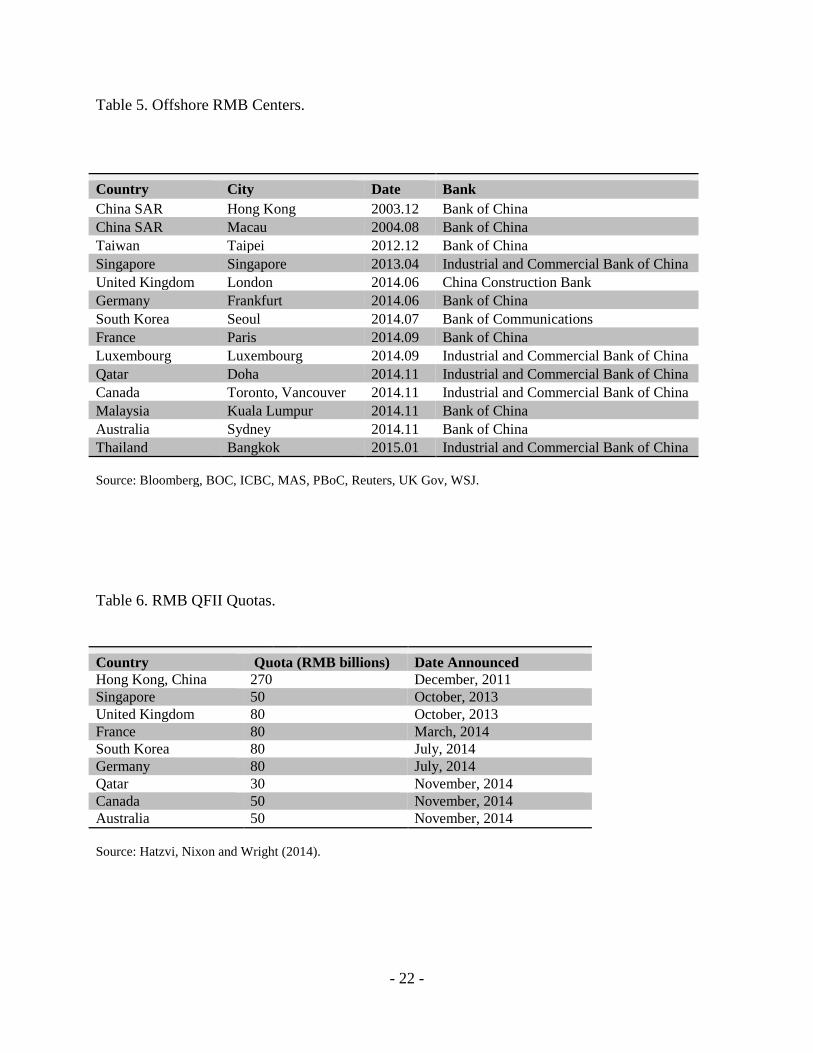
In practice, these arrangements extend beyond Asia. Table 5 lists offshore clearing banks
in foreign financial centers by date of establishment. These centers now include many cities
outside of Asia and across the globe, including Frankfurt, London, Paris, Sydney and Toronto.
Indeed, virtually every important financial hub is now a designated renminbi offshore center with
the exception of New York. If we exclude Hong Kong, Macau and Taipei, which played strategic
roles in the early development of the offshore renminbi market, only four Asian cities are
designated offshore renminbi centers, compared to four in Europe and three in the rest of the
world. In terms of geographic distribution, there is no obvious bias favoring Asia.
Having an official clearing bank matters because access to the renminbi is limited, since
access to Chinese financial markets is limited. This designation creates a presumption that the
bank in question will clear transactions in renminbi for offshore counterparties. One can argue
that the presence of an official clearing bank will matter only for a transitional period, since all
foreign banks will have access to the onshore renminbi market once China’s capital account is

- 10 -
fully open and official clearing banks will then have no advantage. If, on the other hand, there is
a path-dependent aspect to financial development, then official clearing bank status can have
persistent effects on the geography of international finance. Hong Kong was the first offshore
RMB center, and for ten years until October 2013 had the only official offshore RMB clearing
bank. Since then, six additional clearing banks have been designated for Asian countries, and
seven have been designated for non-Asian countries (for these purposes we classify Qatar as a
non-Asian country).
The renminbi-qualified institutional investor (RQFII) program allows designated
institutional investors to invest in renminbi-denominated assets in China. Virtually all countries
with official clearing banks have RQFII quotas (see Table 6). Possession of an RQFII quota
encourages local fund managers to source renminbi credit for use in investing in Chinese
markets. However, some fund management companies have been able to access RQFII quotas in
more than one jurisdiction, and aside from the case of Hong Kong, few if any of these quotas
have been fully taken up. Both observations raise questions about whether these quotas will
significantly affect the location of renminbi-denominated business. To the extent that they do,
further allocation of such quotas weakens their original Asia- and specifically Hong Kong-
centric bias.
Central banks in a large set of countries in Asia and other regions – 30 at the time of
writing – now have swap lines with the PBOC (see Table 7). Thirteen of these bilateral swap
arrangements are with Asian central banks, while eleven are with European central banks and
others are with central banks in additional parts of the world. China’s second largest swap line
(after that with Hong Kong SAR) is with the European Central Bank, reflecting the fact that
China is the European Union’s second largest export market. These lines are useful for providing
renminbi liquidity where official clearing banks have not been designated and for supplementing
official clearing bank liquidity where they have. Access to renminbi funds can be essential in a
crisis. In the absence of such access, the local authorities will be reluctant to permit resident
banks and firms to acquire renminbi exposure. In a handful of locations, notably Hong Kong, the
PBOC swap line is also regularly resorted to by the local monetary authority as a mechanism for
enhancing the liquidity of local renminbi markets and encouraging commercial and financial
business in the currency.
Garcia-Herrero and Xia (2013) and Liao and McDowell (2014) have analyzed who is on
the receiving end of these arrangements and why. We follow them in analyzing the determinants
of their incidence, using an updated list of swap agreements for 166 countries. The dependent
variable is possession of a bilateral swap arrangement with the PBOC, while explanatory
variables include economic size, trade and financial integration with China, distance from China,
and a variety of other macroeconomic indicators. To capture regionalization, we add a dummy
variable for Asian countries. This allows us to test whether Asian countries are ceteris paribus
more likely than countries in other parts of the world to receive swap lines from the PBOC.
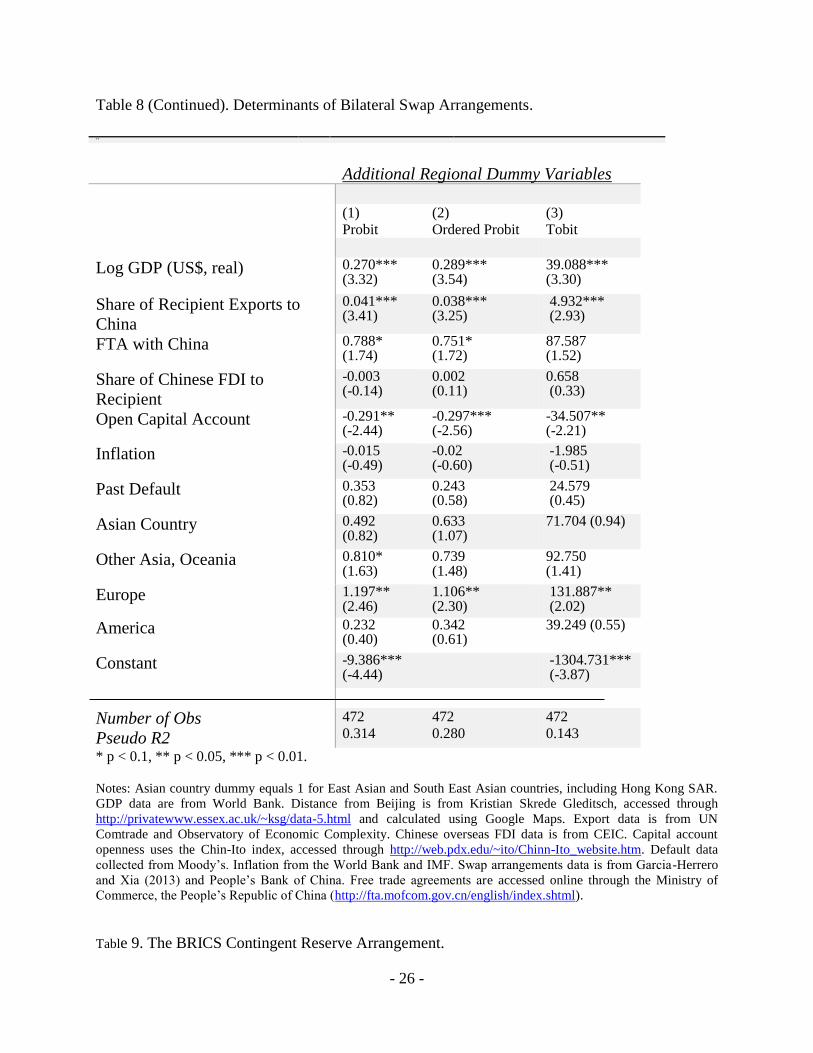
As shown in Table 8, the dummy variable for Asian countries is uniformly
indistinguishable from zero whether the relationship is estimated by probit (with a zero/one
dummy as the dependent variable), ordered probit (distinguishing small and large swap
arrangements) or tobit (where the amount of the swap line, which may be zero, is included as the
dependent variable). The PBOC does not appear to prefer Asian countries when extending
- 11 -
bilateral swap arrangements, or so it would appear after controlling for other variables such as
the size of the economy, financial and trade flows and inflation.
Finally, China has supplemented these bilateral renminbi swaps with the BRICS Bank
and Contingent Reserve Arrangement (CRA). Through the BRICS Bank, members will lend
money to one another for development projects, where some of that money will presumably be
denominated in the currency of the lender. Under the CRA, participating central banks will be
able to draw up to $100 billion of international reserves from one another, subject to conditions.
China has made the largest initial commitment, of $41 billion, to the CRA.
Revealingly, China’s partners in this arrangement include countries outside Asia (Brazil,
South Africa) as well as countries within it (India and Russia). CRA capital allocations and
quotas are shown in Table 9. But it is not clear whether CRA lending by China will be in dollars
or renminbi. (The initial BRICS CRA treaty refers to dollars.) The CRA cannot therefore
automatically be viewed as a mechanism for promoting use of the renminbi within the region.
4. The Case for a Regional Currency
While the renminbi is an increasingly popular global payments currency, its 2.79 per cent
share of global payments is dwarfed by the 45 per cent share of the dollar.4 The dollar is still the
preferred reserve currency. The dollar is still far and away the dominant currency in global
foreign exchange markets, as noted above. These facts reflect the dollar’s first-mover advantage,
the depth and liquidity of U.S. financial markets, the close commercial and financial ties of other
countries with the U.S. economy that remain larger than China’s at market exchange rates
(market exchange rates being what matter for international transactions) and America’s
geopolitical and military leverage (which, if in decline, remains considerable).
The alternative is to argue that the renminbi is destined to become an important vehicle
for cross-border transactions, not so much globally, but in Asia. This argument is lent plausibility
by China’s strong trade ties with its Asian neighbours. It is supported by the fact that China has
been running persistent trade deficits with the rest of Asia, thereby enabling other Asian
countries to accumulate the renminbi-denominated reserves needed to operate a renminbi-based
system (Chey 2012).5
Swift data on international payments are consistent with these
presumptions. While they show that the renminbi is the vehicle for less than 3 per cent of
payments worldwide, it is already used in the majority of payments with China and Hong Kong
themselves.
Thus, if the renminbi is to play an international role, it is most likely to do so in Asia
where it has special advantages. This can be argued on three grounds. First, China and other
Asian countries are natural economic partners. Li, Li and Ding (2004) document the existence of
an exceptionally large elasticity of China’s imports from other East Asian economies with
respect to Chinese GDP. Given the prospect of rapid Chinese GDP growth, they conclude that
4 According to Swift data released on October 6, 2015,
https://www.swift.com/about_swift/shownews?param_dcr=news.data/en/swift_com/2015/PR_RMB_special_edition
_sibos.xml . 5 China's trade structure is characterized by a trade surplus with developed countries in North America and Europe
and a trade deficit with economies in East Asia.; this can, in turn, facilitate renminbi’s exports in the emerging East
Asian economies (Huo and Yang 2013).

- 12 -
China will become the largest trading economy in East Asia in the next twenty years, with about
half of its imports coming from the region. According to data from the General Administration of
Customs of China, China's imports from major East Asian economies (Hong Kong, Japan, South
Korea, India and ASEAN) already account for 38 per cent of its total imports, while imports
from Asia as a whole (including the West and Central Asian countries) represent 55 per cent of
its total imports (estimates for 2014).
Underlying these patterns is the fact that trade costs still matter importantly for cross-
border commercial transactions, and distance is still relevant to trade costs (see e.g. Anderson
and van Wincoop 2004). Transport costs are a significant portion of total trade costs (where the
latter include also costs of insurance, time in transit, and local distribution). Abe and Wilson
(2009), for their part, confirm that transport costs increase with distance. More generally, these
costs can be inferred from differences in the prices of the same products in different countries
Feenstra [1998] famously contrasts the cost in different markets of Mattel’s Barbie Doll), from
the difference between the inclusive cost of insurance and freight (cif) and free on board (fob)
prices, and from the predominant mode of transportation (and from the posted costs of utilizing
that mode). To be sure, the association of transport costs with distance varies with the presence
or absence of natural ports, long coastlines and mountain ranges. But none of this changes the
fact that Asian countries, and in particular, those that border the South China Sea, are natural
trade partners.
Another way of gauging whether economies are natural trade partners is on the basis of
relative resource endowments. There is no question that resource endowments vary widely
within Asia. For example, China is poorly endowed in certain natural resources compared to
some of its Asian neighbours: it possesses little in the way of clean fossil fuels compared to, say,
Malaysia, and is the world’s largest petroleum importer. Further, its labour force peaked in 2010,
and as a result, unskilled labour is becoming increasingly scarce relative to say, Indonesia, India
and Bangladesh. It follows that China will export goods embodying skilled and semi-skilled
labour and capital and import goods that make more intensive use of raw materials, energy and
unskilled labour – again making Asian countries like Indonesia, India and Bangladesh natural
trading partners. Consistent with this presumption, trade amongst the economies in question has
been growing more rapidly than global trade, and more rapidly than China’s trade overall.
Another dimension is intra-industry trade. Due to the development of international supply
chains, different countries specialize in different (vertical) stages of a production process and
produce different components of a final product or set of products. This has been a large
component of Asian trade flows throughout the rapid economic development of Asia since the
mid-1980s. China has long been involved in these regional supply chains, most prominently in
the case of consumer electronics, importing semiconductors from Japan, South Korea and
Taiwan, and combining them with other components before exporting a final product. On the
demand side, it is likely that Asia will become an increasingly important destination for these
Chinese products, as these countries increase income and wealth per capita and develop their
middle classes. Accordingly, intra-industry trade between China and other Asian countries is
likely to increase further, which will provide consistent momentum for intra-industry trade and
for renminbi use for cross-border transactions in the region.
It can be objected that many of the supply chains in which China is involved are global,
not regional; the country imports iPhone design from Sunnyvale, California before exporting the
- 13 -
assembled product back to the United States. But with the articulation of supply chains,
production has grown increasingly susceptible to disruption by climatic and political shocks. As
these risks come to be better appreciated, producers have relocated supply chain-related
production to sites closer to the point of final sale, which are less susceptible to natural and
economic disruptions and where political conditions, by virtue of their proximity, are better
understood. A case in point is how U.S. firms in a variety of industries have relocated the
production of components from China and other Asian countries to Mexico. These observations
point to the likelihood that we will continue to observe the disproportionate growth of intra-
Asian trade.
An abundance of evidence suggests that distance also continues to play a role in
international financial transactions. Portes, Rey and Oh (2001) study cross-border financial
transactions in U.S. equities and bonds and show that distance still matters after controlling for
other determinants of the volume of these transactions. Analyzing foreign direct investment
flows, Brainard (1997), Gao (2009) and Paniagua (2011) show that such flows vary inversely
and significantly with distance. Di Giovanni (2002) shows that distance matters for cross-border
mergers-and-acquisitions-related capital flows. The association between cross-border financial
flows and proximity presumably reflects costs of information acquisition and corporate control
which historically have tended to increase with distance. To the extent that this remains the case
today, the observation points to the disproportionate growth of cross-border financial
transactions within Asia and a role for the dominant regional currency in those transactions.
A second basis for arguing that the renminbi is likely to be an important vehicle for cross-
border transactions mainly in Asia points to Beijing’s Asia-specific institutional and policy
initiatives. China’s Silk Road Initiative was designed to promote trade and economic integration
in Central Asia. Also known as the “Belt and Road Initiative,” this was laid out by President Xi
Jinping in visits to Central and Southeast Asia in 2013 and has been backed by the country’s
National Development and Reform Commission. The plan envisages enhanced connectivity
within and among Asia, Europe and Africa via land and adjacent sea routes, although it appears
to be centered on Central and Southeast Asia. The Silk Road Economic Belt will run along the
historic Silk Road trade route, which stretches from coastal China through Central Asia, while
the Maritime Silk Road will connect China’s south with Southeast Asia. Although focused on
transport and other forms of physical infrastructure, the Silk Road Initiative is also intended to
encompass trade facilitation, financial cooperation and cultural exchange. Insofar as it achieves
its goal of reducing transport costs, cultural barriers and other obstacles, it has the potential to
deepen on one hand, trade and financial interaction with China, and on the other hand, Southeast
and Central Asian countries, thereby enhancing the attractiveness of use of the renminbi in this
region.
China also participates in a number of regional initiatives together with the ASEAN
countries. As noted above, it signed a free trade agreement with ASEAN in 2002, which came
into operation in 2010. An FTA agreement with South Korea was also recently signed. These
agreements will encourage additional trade flows between China and its Asian partners. These
FTAs have been responsible for some movement in the direction of freer trade in the region, and
they signal more of the same in the future.
Moving from trade to financial integration, China was a founding member in the Asian
Bond Market Initiative (AMBI) established by the ASEAN+3 countries following the 1997-1998
- 14 -
Asian financial crisis. The ABMI is intended to promote the growth and integration of regional
debt security markets, and markets in local currency debt securities in particular, by sharing
information on best practices and applying pressure for adoption. It was then followed by the
creation by the same countries of an Asian Bond Market Forum (ABMF) of regular meetings
between private-sector experts and officials with the goal of harmonizing regulation and
standardizing market practices across the region, in this case with the explicit goal of promoting
cross-border transactions in local-currency-denominated debt securities. Insofar as
standardization includes standardization on a specific local currency, the currency in question
will plausibly be that of the largest issuer, namely China.
Further, China is the largest contributor, along with Japan, to the Chiang Mai Initiative
Multilateralization (CMIM) through which the ASEAN+3 countries have agreed to extend swap
lines and credits to one another. This is a regional supplement to the global network of central
bank swap lines, including the PBOC swap lines described above. It was established in 2000 as
the Chiang Mai Initiative (CMI), a network of bilateral swaps, and reorganized in 2010,
nominally as a single reserve pool, now amounting to $240 billion. China (including Hong
Kong) and Japan each contribute 32 per cent of the collective reserve pool (for national
contributions see Table 10). Most of these arrangements are specified as swaps of local
currencies for U.S. dollars, but four – China-Japan, China-Philippines, China-Korea and Japan-
Korea – involve the partners’ local currencies. In addition to the practical uses of swap
arrangements, the CMIM and the other China-ASEAN initiatives signal that China and ASEAN
are willing to cooperate in developing a larger regional network.
Like other swaps, the availability of local-currency lines of credit through the CMIM will
encourage regulators to permit banks and firms under their jurisdiction to incur exposures in
foreign currencies, since local central banks gain the power to engage in at least limited last-
resort lending in those currencies. It is worth noting that the renminbi is the currency that appears
most frequently in this connection (in three out of four cases). The CMIM thus provides a natural
institutional platform for the renminbi in the ASEAN+3 region.
Use of the renminbi by commercial banks and enterprises in the region should in turn
encourage Asian central banks to hold more renminbi in their reserve portfolios, enabling them
to stabilize the renminbi-local currency exchange rate and act as lender of last resort in renminbi
to the banks and firms in question. In fact, the majority of ASEAN+3 central banks already have
indicated that they have added the renminbi to their reserve portfolios. Early adopters include
Malaysia, Cambodia, Philippines, Singapore and Thailand (for the complete list see Table 11).
A further basis for arguing that the renminbi’s future is as an international currency in
Asia builds on the same observations as in Section 3 but applies a different spin. The vast
majority of exchange rates in whose determination the renminbi now has the greatest weight are
Asian currencies. The countries with the largest RQFII quotas (Hong Kong, Singapore and
Taiwan) are Asian countries. The Shanghai-Hong Kong Stock Connect, which removes barriers
between equity markets in Shanghai and offshore, specifically removes those barriers between
Shanghai and a principal Asian market. Moreover, the first seven countries with direct trading of
their local currencies against the renminbi – Laos, Kazakhstan, Vietnam, Korea, Thailand, Japan
and Australia – were all Asian countries, as were the first countries to add the renminbi to their
reserve portfolios – Hong Kong and Malaysia.
- 15 -
Finally, insofar as political power and leverage matter for international currency use, it is
worth noting that China is best able to project such power and influence in the South China Sea
and elsewhere in Asia. In terms of economic influence, there is no doubt that China plays a large
role for Asian countries like Thailand, Malaysia and Vietnam, as China is one of their most
important trade and financial partners. Consistent with this, Asian countries’ willingness to
participate in institutional arrangements with China reflects the fact that the same countries
benefit from these relationships with China. All these are reasons for believing that the
renminbi’s future is as a leading regional, not global, currency.
5. Conclusion
Forecasting is difficult, especially when it involves the future. Any forecast about
whether the renminbi’s future is as a global or regional currency should therefore be taken with a
grain of salt. So instead of forecasting, we have done our best in this paper to make the cases for
both scenarios. Neither theory nor history points unambiguously in one or the other direction,
and modern evidence can be marshaled in support of both views. On the one hand, China has
increasingly important economic, financial and political links with countries not only in Asia, but
throughout the world, just as China invests globally, and not just in Asia. Many of China’s policy
initiatives, such as its bilateral free trade agreements, designating Chinese banks as official
renminbi clearing banks for foreign financial centers, and concluding renminbi swap
arrangements with foreign central banks, extend also to countries in Europe and the Western
Hemisphere. These observations suggest that as Chinese financial markets gain depth and
liquidity, the renminbi will assume a role not merely as a currency used in settling trade-related
transactions, where it already functions, but also as an investment and reserve currency, not just
in Asia but globally.
At the same time, however, some of China’s most natural economic, financial and
political links are with neighboring Asian countries. Transport costs are still important for
international trade, and they are lowest over short distances. Distance also matters for
international financial transactions, whether because local knowledge dissipates with distance or
because certain financial transactions are more costly across multiple time zones. These facts
make China and other Asian countries logical commercial and financial partners. Asian countries
that see themselves as sharing common characteristics, and specifically common economic and
financial vulnerabilities, have responded with regional initiatives like the Asian Bond Market
Initiative, Asian Bond Forum, Asian Bond Fund, Chiang Mai Initiative Multilateralization and
ASEAN-China Free Trade Agreement, all of which work to further deepen economic and
financial integration in the region. This suggests that the renminbi, as the currency of the largest
Asian economy and leading trader, has a natural habitat in the region, and that its future is as the
leading Asian currency.
As for which scenario is more likely, one can only echo Zhoa Enlai (speaking not of the
French Revolution but of the French student demonstrations of 1968, in actual fact), that it is too
early to tell. This paper at least identifies some of the principal factors on which the answer will
hinge.

- 16 -

- 17 -
Table 1. Existing and Prospective FTAs.
Country Date
Bi-lateral FTAs
Developing Countries
Pakistan
Chile
Peru
Costa Rica
November 2006
November 2005
April 2009
April 2010
Developed Countries
New Zealand
Singapore
Iceland
Switzerland
South Korea
Australia
April 2008
October 2008
April 2013
July 2013
June 2015
June 2015
Multi-lateral FTAs
ASEAN November 2004
FTA under Negotiation
Gulf Cooperation Council
Regional Comprehensive Partnership
ASEAN FTA Upgrade
Norway
Japan and Korea
Sri Lanka
July 2004
May 2013
September 2014
September 2008
January 2013
September 2014
FTA under Consideration
India
Colombia
Maldives
Georgia
Moldova
2003
N/A
February 2015
April 2015
N/A
Source: Whalley and Li (2014), Ministry of Commerce, China (2015)

- 18 -
Table 2. Dominant Reference Currency by Region (2013-2016).
RMB USD EURO
Asia 5 6 1
Europe 1 2 9
Middle East and Africa 1 3 2
North America 1 1 0
South America 3 5 0
Total 11 17 12
Table 3. Determinants of Renminbi Weight (2013-2016)
Table 4. Prospective Founding Members of the AIIB.
_cons .1651439 .0924021 1.79 0.084 -.0233115 .3535993 importshare -1.310916 .8483331 -1.55 0.132 -3.041103 .4192707 inflation -.2414102 .1520255 -1.59 0.122 -.5514683 .0686479financial_~y 1.694931 .5871824 2.89 0.007 .4973646 2.892497 rmb Coef. Std. Err. t P>|t| [95% Conf. Interval] Robust
Root MSE = .2553 R-squared = 0.2678 Prob > F = 0.0275 F( 3, 31) = 3.48Linear regression Number of obs = 35

- 19 -
Source: AIIB.org (2015).
East Asia and Pacific (12)
Brunei, Cambodia, China, Indonesia, Laos, Malaysia, Mongolia,
Philippines, Republic of Korea, Singapore, Thailand, Vietnam.
Other Asia (12)
Azerbaijan, Bangladesh, India, Kazakhstan, Kyrgyz Republic,
Maldives, Myanmar, Nepal, Pakistan, Sri Lanka, Tajikistan,
Uzbekistan.
Oceania (2)
Australia, New Zealand.
Middle East (9)
Egypt, Iran, Israel, Jordan, Kuwait, Oman, Qatar, Saudi Arabia,
United Arab Emirates.
Western Europe (15)
Austria, Denmark, Finland, France, Germany, Iceland, Italy,
Luxembourg, Netherlands, Norway, Portugal, Spain, Sweden,
Switzerland, United Kingdom.
Other Europe (5)
Georgia, Malta, Poland, Russia, Turkey
South America (1)
Brazil
Africa (1)
South Africa

- 20 -

- 21 -
- 22 -
Table 5. Offshore RMB Centers.
Table 6. RMB QFII Quotas.
Country City Date Bank
China SAR Hong Kong 2003.12 Bank of China
China SAR Macau 2004.08 Bank of China
Taiwan Taipei 2012.12 Bank of China
Singapore Singapore 2013.04 Industrial and Commercial Bank of China
United Kingdom London 2014.06 China Construction Bank
Germany Frankfurt 2014.06 Bank of China
South Korea Seoul 2014.07 Bank of Communications
France Paris 2014.09 Bank of China
Luxembourg Luxembourg 2014.09 Industrial and Commercial Bank of China
Qatar Doha 2014.11 Industrial and Commercial Bank of China
Canada Toronto, Vancouver 2014.11 Industrial and Commercial Bank of China
Malaysia Kuala Lumpur 2014.11 Bank of China
Australia Sydney 2014.11 Bank of China
Thailand Bangkok 2015.01 Industrial and Commercial Bank of China
Source: Bloomberg, BOC, ICBC, MAS, PBoC, Reuters, UK Gov, WSJ.
Country Quota (RMB billions) Date Announced
Hong Kong, China 270 December, 2011
Singapore 50 October, 2013
United Kingdom 80 October, 2013
France 80 March, 2014
South Korea 80 July, 2014
Germany 80 July, 2014
Qatar 30 November, 2014
Canada 50 November, 2014
Australia 50 November, 2014
Source: Hatzvi, Nixon and Wright (2014).

- 23 -
Table 7. Swap Arrangements with the PBoC.
Country Date Amount in Yuan
Albania 2013.09 2 billion
Argentina 2009.03 70 billion
Argentina 2014.07 70 billion
Armenia 2015.03 1 billion
Australia 2012.03 200 billion
Australia 2015.04 200 billion
Belarus 2009.03 20 billion
Brazil 2013.03 190 billion
Canada 2014.11 200 billion
European Union 2013.10 350 billion
Hong Kong 2009.01 200 billion
Hong Kong 2011.11 400 billion
Hong Kong 2014.11 400 billion
Hungary 2013.09 10 billion
Iceland 2010.06 3.5 billion
Iceland 2013.09 3.5 billion
Indonesia 2009.03 100 billion
Indonesia 2013.10 100 billion
Kazakhstan 2011.06 7 billion
Kazakhstan 2014.12 7 billion
Malaysia 2009.02 80 billion
Malaysia 2012.02 180 billion
Mongolia 2011.05 5 billion
Mongolia 2012.03 10 billion
Mongolia 2014.08 15 billion
New Zealand 2011.04 25 billion
New Zealand 2014.05 25 billion
Pakistan 2011.12 10 billion
Qatar 2014.11 35 billion
Russia 2014.10 150 billion
Singapore 2010.07 150 billion
Singapore 2013.03 300 billion
South Korea 2008.12 180 billion
South Korea 2011.10 360 billion
South Korea 2014.10 360 billion
Sri Lanka 2014.09 10 billion
Suriname 2015.03 1 billion
Switzerland 2014.07 150 billion
Thailand 2011.12 70 billion
Thailand 2014.12 70 billion
Turkey 2012.02 10 billion
Ukraine 2012.06 15 billion
United Arab Emirates 2012.01 35 billion
United Kingdom 2013.06 200 billion
Uzbekistan 2011.04 0.7 billion
Source: Garcia-Herrero and Xia (2013), PBoC, Xinhua, Reuters,
Bloomberg, RBA, RBNZ.

- 24 -
Table 8. Determinants of Bilateral Swap Arrangements.
*** p < 0.01, ** p <0.05, * p < 0.1.
[1]
Probit Regressions
(1) (2)
Log GDP (US$, real) 0.271*** (3.74)
.270*** (3.88)
Share of Recipient Exports to
China
0.035*** (3.36)
0.033*** (3.27)
FTA with China 0.764* (1.88)
0.647* (1.69)
Share of Chinese FDI to
Recipient
-0.004 (-0.21)
-0.0003 (-0.02)
Open Capital Account -0.201** (-2.10)
-0.209** (-2.24)
Inflation -0.015 (-0.54)
-0.009 (-0.35)
Past Default 0.519 (1.35)
0.412 (1.15)
Distance from Beijing -0.062* (-1.69)
Asian Country[1] -0.453 (-0.87)
0.017 (0.05)
Constant -8.165*** (-4.32)
-8.698*** (-4.84)
Number of Obs 472 472
Pseudo R2 0.271 0.255

- 25 -
- 26 -
Table 8 (Continued). Determinants of Bilateral Swap Arrangements.
Additional Regional Dummy Variables
(1)
Probit
(2)
Ordered Probit
(3)
Tobit
Log GDP (US$, real) 0.270*** (3.32)
0.289*** (3.54)
39.088*** (3.30)
Share of Recipient Exports to
China
0.041*** (3.41)
0.038*** (3.25)
4.932*** (2.93)
FTA with China 0.788* (1.74)
0.751* (1.72)
87.587 (1.52)
Share of Chinese FDI to
Recipient
-0.003 (-0.14)
0.002 (0.11)
0.658 (0.33)
Open Capital Account -0.291** (-2.44)
-0.297*** (-2.56)
-34.507** (-2.21)
Inflation -0.015 (-0.49)
-0.02 (-0.60)
-1.985 (-0.51)
Past Default 0.353 (0.82)
0.243 (0.58)
24.579 (0.45)
Asian Country 0.492 (0.82)
0.633 (1.07)
71.704 (0.94)
Other Asia, Oceania 0.810* (1.63)
0.739 (1.48)
92.750 (1.41)
Europe 1.197** (2.46)
1.106** (2.30)
131.887** (2.02)
America 0.232 (0.40)
0.342 (0.61)
39.249 (0.55)
Constant -9.386*** (-4.44)
-1304.731*** (-3.87)
Number of Obs
Pseudo R2
472
0.314
472
0.280
472
0.143
* p < 0.1, ** p < 0.05, *** p < 0.01.
Notes: Asian country dummy equals 1 for East Asian and South East Asian countries, including Hong Kong SAR.
GDP data are from World Bank. Distance from Beijing is from Kristian Skrede Gleditsch, accessed through
http://privatewww.essex.ac.uk/~ksg/data-5.html and calculated using Google Maps. Export data is from UN
Comtrade and Observatory of Economic Complexity. Chinese overseas FDI data is from CEIC. Capital account
openness uses the Chin-Ito index, accessed through http://web.pdx.edu/~ito/Chinn-Ito_website.htm. Default data
collected from Moody’s. Inflation from the World Bank and IMF. Swap arrangements data is from Garcia-Herrero
and Xia (2013) and People’s Bank of China. Free trade agreements are accessed online through the Ministry of
Commerce, the People’s Republic of China (http://fta.mofcom.gov.cn/english/index.shtml).
Table 9. The BRICS Contingent Reserve Arrangement.
TT

- 27 -
Table
9.
BRIC
S
Conti
ngent
Reser
ve
Facili
ty
Table 10. CMI Multilateralization Contributions, Purchasing, and Voting.
Financial Contribution Purchasing
Multiple
Total Voting
Power
USD (billion) Percent (%) Percent (%)
China (Mainland)* 68.40 28.5 0.5 25.43
Hong Kong, China 8.40 3.5 2.5 2.98
Japan 76.80 32 0.5 28.41
Korea 38.40 16 1 14.77
Plus 3 192 80 71.59
Indonesia 9.104 3.793 2.5 4.369
Thailand 9.104 3.793 2.5 4.369
Malaysia 9.104 3.793 2.5 4.369
Singapore 9.104 3.793 2.5 4.369
Philippines 9.104 3.793 2.5 4.369
Vietnam 2.00 0.833 5 1.847
Cambodia 0.24 0.1 5 1.222
Myanmar 0.12 0.05 5 1.179
Brunei 0.06 0.025 5 1.158
Lao PDR 0.06 0.025 5 1.158
ASEAN 48 20 28.41
Total 240 100 100
Country Committed Resources* Access to CRA Resources**
China $41 Billion USD 50 percent
Brazil $18 Billion USD 100 percent
Russia $18 Billion USD 100 percent
India $18 Billion USD 100 percent
South Africa $5 Billion USD 200 percent Total $100 Billion USD
* As of July 15, 2014.
** Parties can access resources subject to the maximum access limits equal to the specified percentage of
each Party’s individual commitment.
Source: BRICS Information Centre, University of Toronto (2014). See www.brics.utoronto.ca.

- 28 -
* China, including Hong Kong, contributes $76.80 billion and has 28.41% of the voting shares.
Source: ASEAN+3 Macroeconomic Research Office (2015). See: www.amro-asia.org.
Table 11. RMB as Official Reserve by Country.
Country Date* Amount Type
Norway October, 2006 up to $1.5 bn onshore
Malaysia September, 2010 undisclosed sovereign
Hong Kong October, 2010 5-10% ($16-$31 bn) sovereign
Belarus November, 2010 undisclosed onshore
Venezuela August, 2011 undisclosed undisclosed
Kenya August, 2011 undisclosed undisclosed
Chile September, 2011 2.3% ($945 mn) undisclosed
Nigeria September, 2011 2-7% ($2.3-$4.6 bn) offshore
Cambodia October, 2011 undisclosed undisclosed
Philippines October, 2011 undisclosed undisclosed
Russia October, 2011 undisclosed undisclosed
Singapore October, 2011 up to $1 bn onshore
Thailand November, 2011 0.5% ($836 mn) off & onshore
Austria November, 2011 undisclosed onshore
Japan December, 2011 $10.3 bn sovereign
Uruguay 2012* $0.21 bn offshore
Macao March, 2012 15.5% ($2.5 bn) off &onshore
Bolivia May, 2012 0.4% ($58 mn) offshore
Indonesia July, 2012 undisclosed onshore
Korea July, 2012 $3.3 bn onshore
Saudi Arabia July, 2012 undisclosed undisclosed
Tanzania August, 2012 undisclosed offshore
Pakistan October, 2012 undisclosed onshore
Angola April, 2013 undisclosed offshore
Australia April, 2013 $1.6 bn sovereign
Nepal June, 2013 undisclosed onshore
South Africa June, 2013 $1.5 bn off & onshore
Taiwan October, 2013 undisclosed undisclosed
Lithuania November, 2013 up to $100 mn onshore
Namibia December, 2013 undisclosed offshore
Ghana April, 2014 undisclosed undisclosed
France April, 2014 undisclosed sovereign
Switzerland July, 2014 up to $2.5 bn onshore
Sri Lanka September, 2014 undisclosed onshore

- 29 -
Argentina September, 2014 $1.3 bn undisclosed
United Kingdom October, 2014 $490 mn offshore
Zimbabwe October, 2014 undisclosed undisclosed
Hungary May, 2015 undisclosed undisclosed
*Missing month for Uruguay.
Source: Lia and McDowell (2015). Xinhua News.
Abe, Kazutomo and John Wilson (2009), “Weathering the Storm: Investing in Port Infrastructure
to Lower Transport Costs in East Asia,” World Bank Policy Research Working Paper no.4911,
Washington, D.C.: World Bank.
Asian Infrastructure Investment Bank(2015), “Prospective Founding Members.” Retrieved 30
October 2015, from http://www.aiib.org/html/pagemembers/
Anderson, James and Eric van Wincoop (2004), “Trade Costs,” Journal of Economic Literature
42, pp.691-751.
ASEAN+3 Macroeconomic Research Office (2015), “Contributions, Purchasing Multiple,
Maximum Swap Amount.”Retrieved July 22 2015, from http://www.amro-asia.org/about-
amro/history/country-representation/
Bergsten, Fred (1975), The Dilemmas of the Dollar, New York: New York University Press.
Brainard, S.L. (1997), “An Empirical Assessment of the Proximity-Concentration Trade-off
Between Multinational Sales and Trade,” American Economic Review 87, pp.520-544.
BRICS Information Centre, University of Toronto (2014), “Treaty for the Establishment of a
BRICS Contingent Reserve Arrangement.” Retrieved October 30 2015, from
http://www.brics.utoronto.ca/docs/140715-treaty.html.
Chey Hyoung-kyu (2012), “Can the Renminbi Rise as a Global Currency? The Political
Economy of Currency Internationalization.” GRIPS Discussion Paper 11-20.
China, Ministry of Commerce (2015), “China FTA Network.” Retrieved July 22 2015, from
http://fta.mofcom.gov.cn/english/index.shtml.
Choi, Nakgyoon (2015), “Global Value Chains and East Asian Trade in Value-Added,” Asian
Economic Papers 13, pp.**-**.
Di Giovanni, Julian (2002), “What Drives Capital Flows? The Case of Cross-Border M&A
Activity and Financial Deepening,” CIDER Working Paper no.C02-122, Berkelely: Center for
International and Development Economic Research, University of California, Berkeley.
Eichengreen, Barry (2014), “International Currencies Past, Present and Future: Two Views from
Economic History,” Working Paper no.2014-31, Seoul: Bank of Korea.
- 30 -
Eichengreen, Barry and Marc Flandreau (1996), “Blocs, Zones and Bands: International
Monetary History in Light of Recent Theoretical Developments,” Scottish Journal of Economics
43, pp.398-418.
Eichengreen, Barry and Marc Flandreau (2009), “The Rise and Fall of the Dollar (or When Did
the Dollar Replace Sterling as the Leading International Currency?), European Review of
Economic History 13, pp.377-411.
Farrell, Joseph and Paul Klemperer (2007), “Coordination and Lock-In: Competition with
Switching Costs and Network Effects,” in Mark Armstrong and Robert Porter (eds), Handbook
of Industrial Organization, Volume 3, Amsterdam: North-Holland, pp.1967-2072.
Feenstra, Robert (1998), “Integration of Trade and Disintegration of Production in the Global
Economy,” Journal of Economic Perspectives 12, pp.31-50.
Gao, Shen (2009), “The Predictive Capacity of the Gravity Model of Trade on Foreign Direct
Investment,” unpublished manuscript, Uppsala University.
Garcia-Herrero, Alicia and Le Xia (2013), “China’s RMB Bilateral Swap Agreements: What
Explains the Choice of Countries?” Institute for Economies in Transition Discussion Paper
no.12/2013, Helsinki: Bank of Finland.
Goldberg, Linda and Cedric Tille (2005), “Vehicle Currency Use in International Trade,” Staff
Report no.200, New York: Federal Reserve Bank of New York.
Hatzvi, Eden, Will Nixon and Michelle Wright (2014), “Offshore Renminbi Market and
Australia.” RBA Bulletin December Quarter 2014.
Helleiner, Eric and Jonathan Kirshner eds. (2014), The Great Wall of Money: Power and Politics
in China’s International Monetary Relations, Ithaca: Cornell University Press.
Krugman, Paul (1980), “Vehicle Currencies and the Structure of International Exchange,”
Journal of Money, Credit and Banking 12, pp.513-526.
Krugman, Paul (1984), “The International Role of the Dollar: Theory and Prospect,” in John
Bilson and Richard Marston (eds), Exchange Rate Theory and Practice, Chicago: University of
Chicago Press, pp.261-278.
Li Xiao, Li Junjiu and Ding Yibing(2004), "On the 'Asianization' of Renminbi[论人民币的
亚洲化],"The Journal of World Economy [世界经济],issue 2.
Liao, Steven and Daniel McDowell (2015), “Redback Rising: China’s Bilateral Swap
Agreements and Renminbi Internationalization,” unpublished manuscript, University of Virginia
and Syracuse University.
Lindert, Peter (1969), “Key Currencies and Gold, 1900-1913,” Princeton Studies in International
Finance no.24, International Finance Section, Princeton University, Department of Economics.
Matsuyama, Kiminori, Nobuhiro Kiyotaki and Akihiko Matsui (1993), “Toward a Theory of
International Currency,” Review of Economic Studies 60, pp.283-307.

- 31 -
McKinnon, Ronald (1979), Money in International Exchange: The Convertible Currency System,
New York: Oxford University Press.
Paniagua, Jordi (2011), “FDI Gravity Equation: Models, Estimations and Zeros,” unpublished
manuscript, Catholic University of Valencia.
Park, Yung Chul and Chi-Young Song (2011), “Renminbi Internationalization: Prospects and
Implications for Economic Integration in East Asia,” Asian Economic Papers 10, pp.**-**.
Portes, Richard, Helene Rey and Yonghyup Oh (2001), “Information and Capital Flows: The
Determinants of Transactions in Financial Assets,” European Economic Review 45, pp.783-796.
Prasad, Eswar (2014), The Dollar Trap: How the US Dollar Tightened its Grip on Global
Finance, Princeton: Princeton University Press.
Standard Chartered (2014), “Global Trade Unbundled,” Standard Chartered Global Research,
Hong Kong: Standard Chartered.
Subramanian, Arvind and Martin Kessler (2013), “The Renminbi Bloc is Here: Asia Down and
the Rest of the World to Go,” Working Paper no. WP 12-19, Washington, D.C.: Peterson
Institute of International Economics (August).
Weir, Geoffrey (2015), “Offshore RMB Centres: Some Observations of Relevance to Sydney,”
unpublished manuscript.
Whalley, John and Chunding Li (2014), “China’s Regional and Bilateral Trade Agreements,”
VoxEU (5 March).


