Download - Rm Presentation to Umr2

18/04/23
1

2
Table of Content
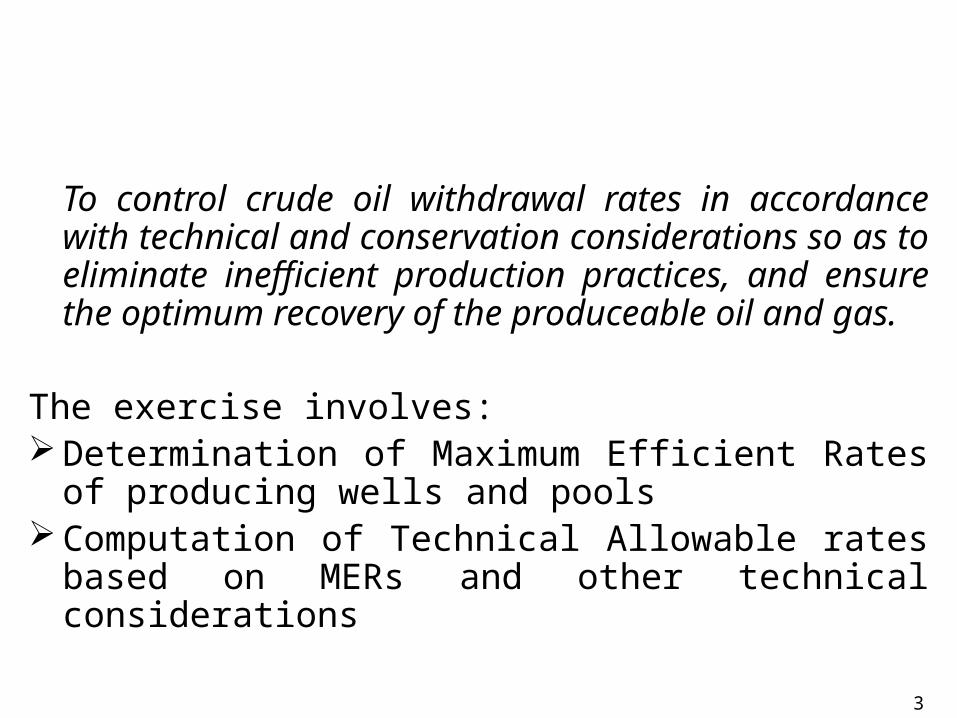
To control crude oil withdrawal rates in accordance with technical and conservation considerations so as to eliminate inefficient production practices, and ensure the optimum recovery of the produceable oil and gas.
The exercise involves: Determination of Maximum Efficient Rates of
producing wells and pools Computation of Technical Allowable rates based on
MERs and other technical considerations
3
The objective of Allowable Exercise
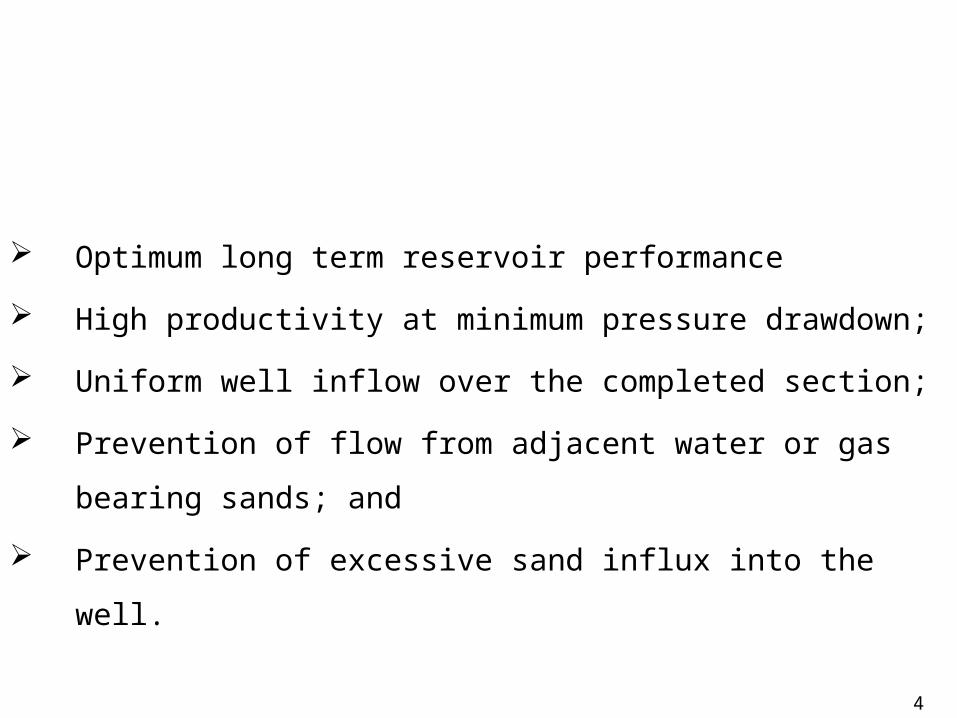
Optimum long term reservoir performance
High productivity at minimum pressure drawdown;
Uniform well inflow over the completed section;
Prevention of flow from adjacent water or gas bearing
sands; and
Prevention of excessive sand influx into the well.
4
Benefits of Production Allowable
ENABLING LAW
5
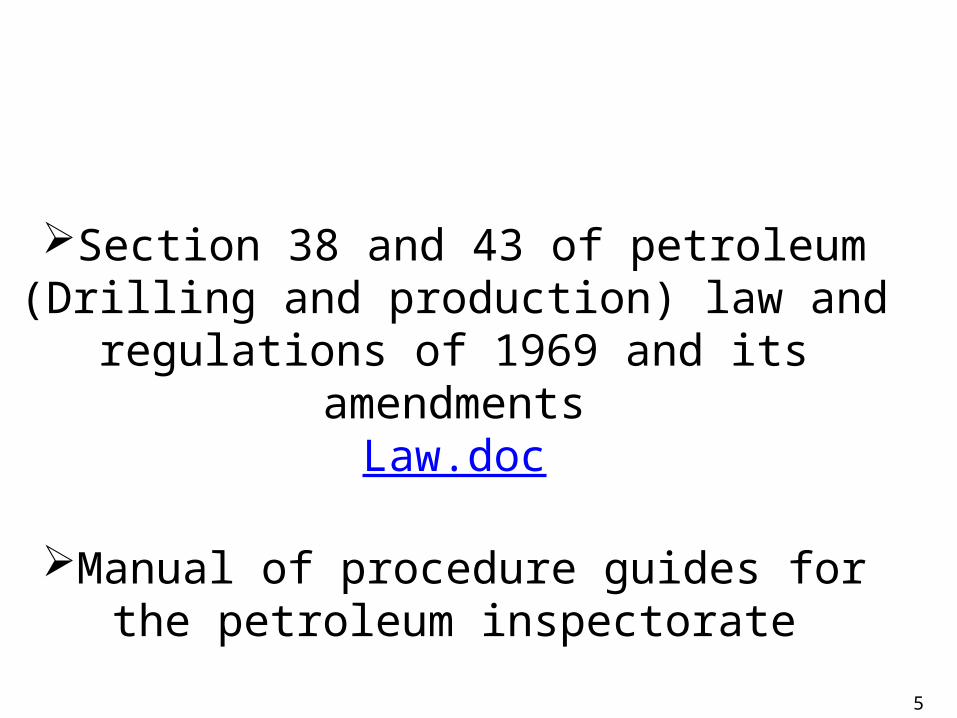
Section 38 and 43 of petroleum (Drilling and production) law and regulations of 1969
and its amendmentsLaw.doc
Manual of procedure guides for the petroleum inspectorate
Statutory Requirements
6
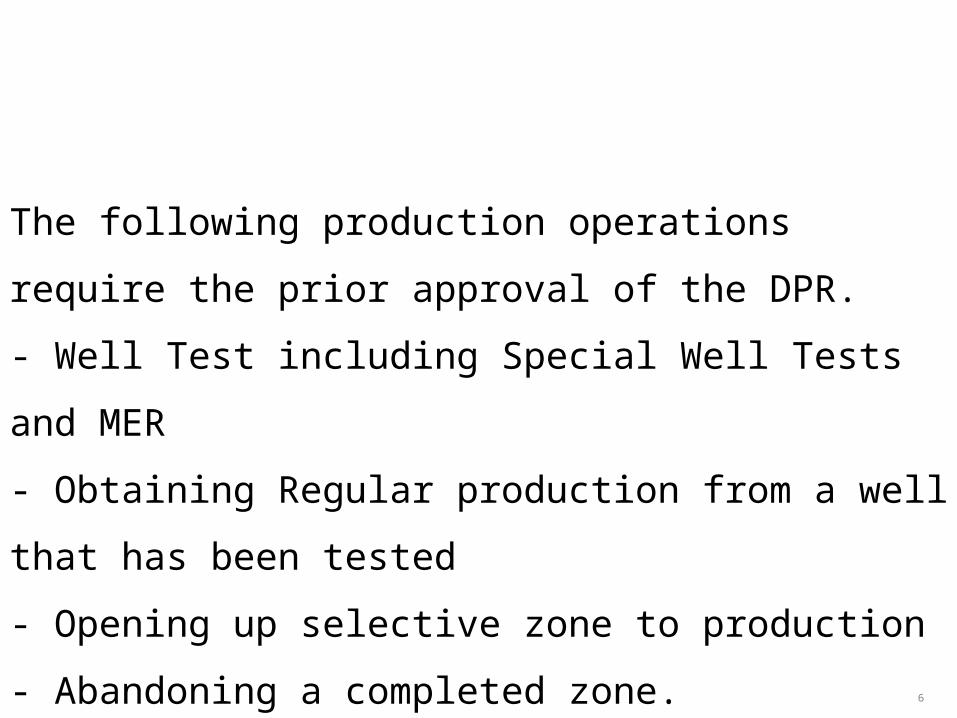
The following production operations require the prior approval
of the DPR.
- Well Test including Special Well Tests and MER
- Obtaining Regular production from a well that has been
tested
- Opening up selective zone to production
- Abandoning a completed zone.
Statutory Requirements…Contd
7
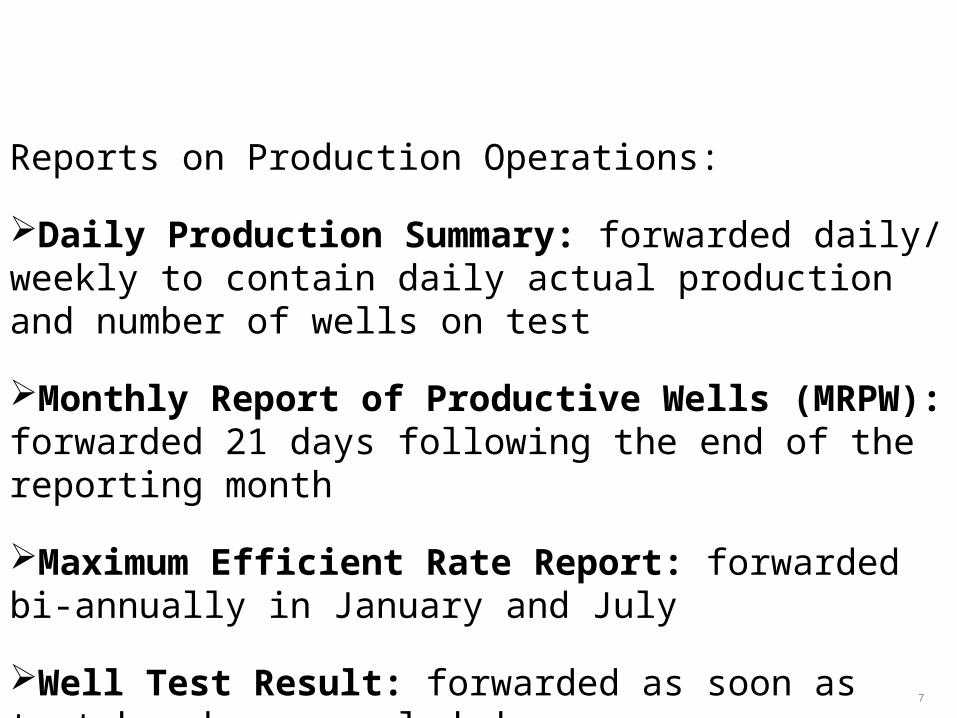
Reports on Production Operations:
Daily Production Summary: forwarded daily/ weekly to contain daily actual production and number of wells on test
Monthly Report of Productive Wells (MRPW): forwarded 21 days following the end of the reporting month
Maximum Efficient Rate Report: forwarded bi-annually in January and July
Well Test Result: forwarded as soon as test has been concluded

8

MER Test Procedure
9
Companies design and define their MER test program (in line with the procedure outlined below) and forward same to DPR , and also seek for DPR participation in the test campaign.
Procedure to be adopted depends on the type of well 2 categories are defined as follows:
→New Well Procedure: applied to well that have never been MER Tested. Same procedure applies to worked-over wells →Routine MER Procedure: applied to wells on regular production
Newly completed/worked-over wells: Production test period of six weeks on at least 5 incremental steps of choke opening
For wells already on regular production: test on at least 3 incremental steps of choke opening

MER Test Procedure….Contd
10
MER Test Sequence:1st Step: 3 hours Stabilization for each choke size provided stabilization criteria are met2nd Step: 6 hours Flow measurement
End of MER test
Cho
ke o
peni
ng
12
54
3
Flow Rate
1st Step
2nd Step
WELL 1
time

MER Test Procedure….Contd
11
Stabilization Criteria:Based on Flowing Tubing Head Pressure (FTHP) and test separator flow measurements stability over the stabilization period
→Flowing Tubing Head Pressure:(FTHPmax - FTHPaverage) / FTHPaverage ≤ 0.5%(FTHPmin - FTHPaverage) / FTHPaverage ≤ -0.5%
Or, FTHPmax - FTHPmin ≤ 1%
FTHPaverage
→Test Separator Flow Rates, Q
(Qmax - Qaverage) / Qaverage ≤ 5% (Qmin - Qaverage) / Qaverage ≤ -5%
Or,
Qmax - Qmin ≤ 10% Qaverage

MER Test Procedure…..Contd
12
Carrier Wells:Although test by difference could be allowed for wells with potential too low to be produced individually, individual well test is the recommended practice
SAMPLING:Usually 3 Flowline samples are collected (at strategic periods during the 6 hours Flow Measurement) for BSW & API analysis. Sand detection and measurement is also done
For Accurate Flow Data:Test separator should be at the right static pressure No leakage at the header valvesProper measurement of gas lift volumeTake measurements at sufficiently stable flow

Intelligent Wells
13
Yes
Start
No
Allocation By Zonal Production Testing
Model Calibration by zonal production testing
Daily Allocation
Monthly/ Quarterly production testing
No
Yes
Determine Error Between Model and Measurements
Is the Error Within Desired Allocation Accuracy?
Perform Commingled Production Test (Qtot, FBHPs)
Use Model and Measured FBHPs to estimate Qtot
Measure Build-Up Pressures on Other Zones (SBHP)
All Zones Tested?
Close All Zones
Open one zone
Reconcile Model to Honour Production Test
Yes
Is an Obligatory Production Test Sheduled?
Use Reconciled Model, FBHPs to allocate Production to the Individual Zones (Qtot, Q1, Q2)
Are the Results as Expected or has no Significant Change in
the Well Pressures been
Set up Inflow Model (Pipesim, Prosper)
Perform MER Test (FBHP, Q) on The Open Zone
0
00
0
Submission
14
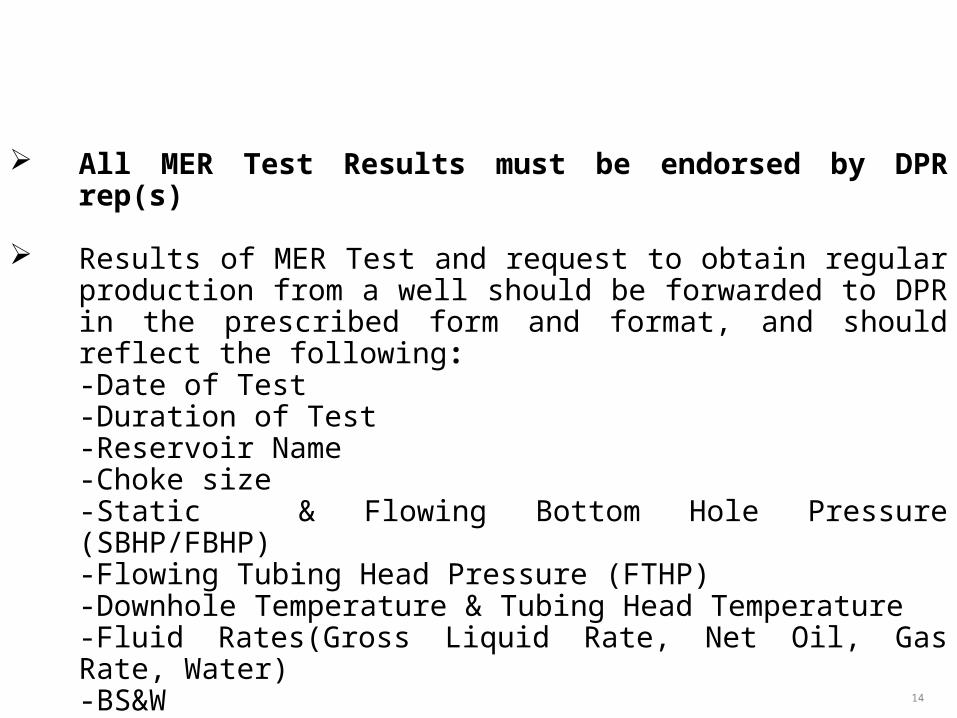
All MER Test Results must be endorsed by DPR rep(s)
Results of MER Test and request to obtain regular production from a well should be forwarded to DPR in the prescribed form and format, and should reflect the following:-Date of Test-Duration of Test-Reservoir Name-Choke size-Static & Flowing Bottom Hole Pressure (SBHP/FBHP)-Flowing Tubing Head Pressure (FTHP)-Downhole Temperature & Tubing Head Temperature-Fluid Rates(Gross Liquid Rate, Net Oil, Gas Rate, Water)-BS&W-RSI & GOR-Sand Cut-SG or API
MER DETERMINATION
15
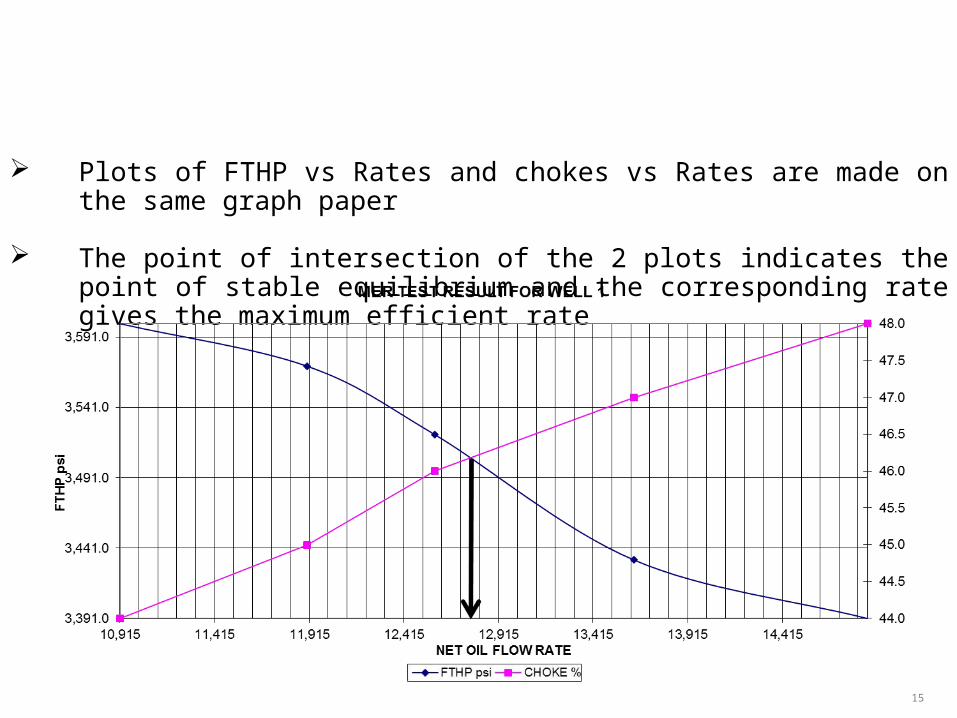
Plots of FTHP vs Rates and chokes vs Rates are made on the same graph paper
The point of intersection of the 2 plots indicates the point of stable equilibrium and the corresponding rate gives the maximum efficient rate

Generally the maximum efficient rate ≥ allowable rateAllowable rate is defined by scaling down the MER considering factors such
as: Wells Producing History The reserves carried by the pools from which the wells are producing The well’s productivity index (PI) Draw-downs Producing GORs RSI Water cut Sand Production Flowing Tubing Head Pressure The general performance of the individual reservoirs Pressure Decline of the pool of interest Injection volumes into project pools
16
Allowable Computation
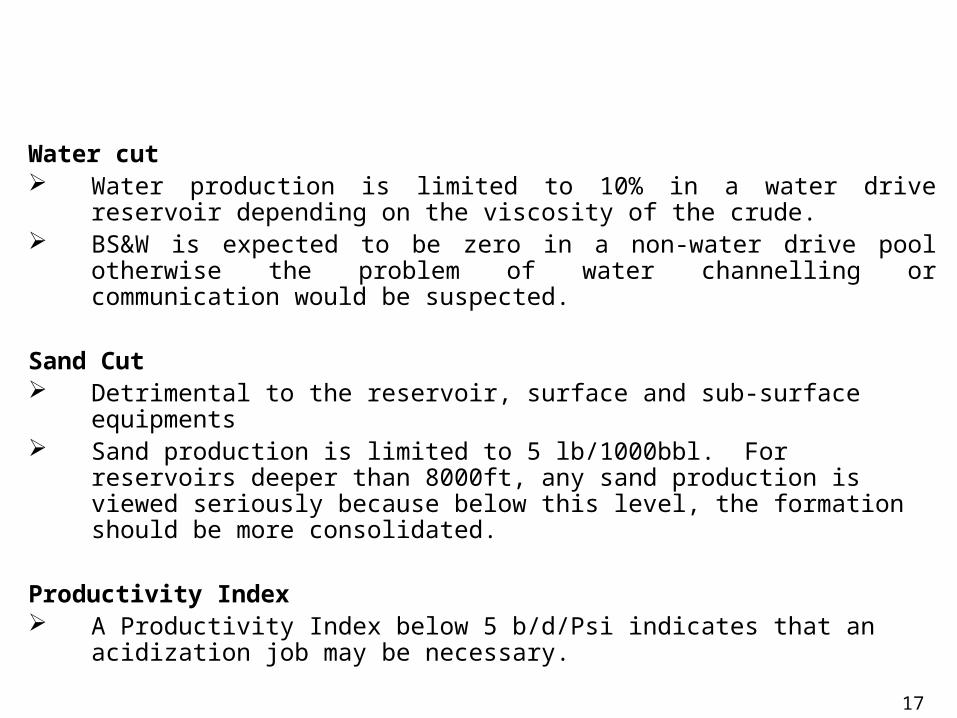
Water cut Water production is limited to 10% in a water drive reservoir depending
on the viscosity of the crude. BS&W is expected to be zero in a non-water drive pool otherwise the
problem of water channelling or communication would be suspected.
Sand Cut Detrimental to the reservoir, surface and sub-surface equipments Sand production is limited to 5 lb/1000bbl. For reservoirs deeper than
8000ft, any sand production is viewed seriously because below this level, the formation should be more consolidated.
Productivity Index A Productivity Index below 5 b/d/Psi indicates that an acidization job
may be necessary.
17
Allowable Computation….Contd
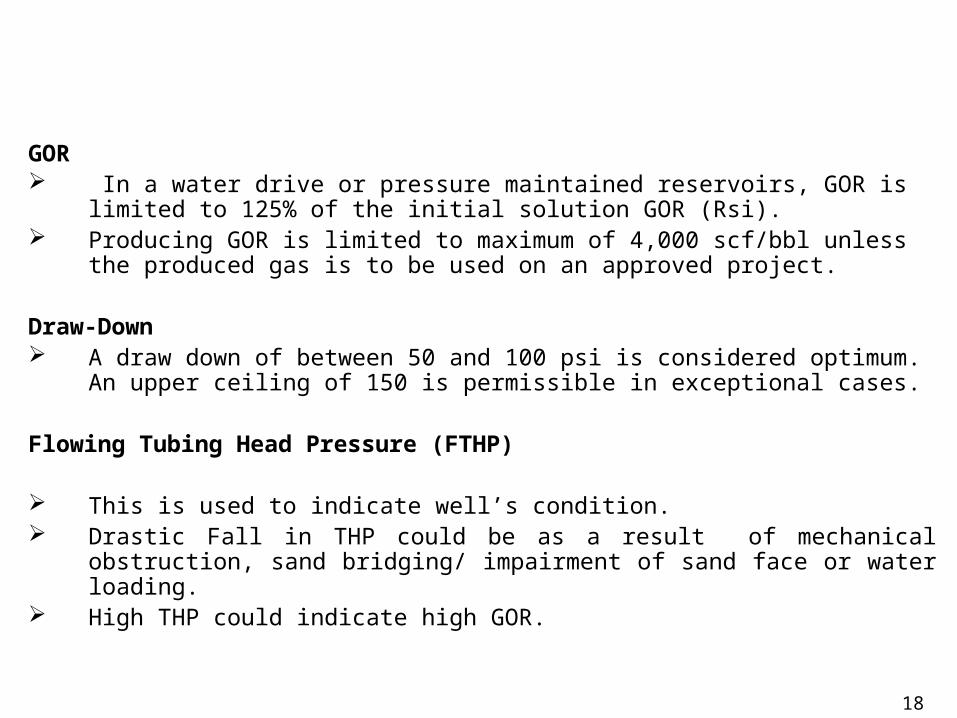
GOR In a water drive or pressure maintained reservoirs, GOR is limited to
125% of the initial solution GOR (Rsi). Producing GOR is limited to maximum of 4,000 scf/bbl unless the
produced gas is to be used on an approved project.
Draw-Down A draw down of between 50 and 100 psi is considered optimum. An
upper ceiling of 150 is permissible in exceptional cases.
Flowing Tubing Head Pressure (FTHP)
This is used to indicate well’s condition. Drastic Fall in THP could be as a result of mechanical obstruction,
sand bridging/ impairment of sand face or water loading. High THP could indicate high GOR.
18
Allowable Computation…Contd

Beyond The Tolerance Limits
PENALTY FACTORS FOR PROBLEM WELLS.doc
19
Problem Wells

Reservoirs where oil production is maintained with the aid of a Pressure Maintenance (PM) Scheme such as water injection, gas injection, water alternate gas injection (WAG), gas recycling, steam projects.
10 E & P Companies are operating various Pressure Maintenance Projects in the country. The Companies are Chevron, Star Deep, Esso, Mobil, Total Upstream, Total E & P, SNEPCo, Oriental, NAE and NAOC.
There are currently 120 active project reservoirs in the country operating acreages.
PROJECT POOLS
20

i.Oil rates based on Zero-Net Voidage computed at prevailing injection volumes
ii.Instantaneous and Cumulative Injection-Withdrawal Ratios (IWR)
iii.Pressure Decline Analysis
iv.GOR, water cut trends
v.Recovery Fractions and Remaining Reserves
vi.Sum of MER test rates for each pool
vii.Current production rates for each of the pools
Key Performance Indicators (KPI) for Pressure Maintenance (PM) Projects
21

•Daily, Monthly and cumulative oil, gas and water production data
•Daily, Monthly and cumulative gas and water injection data
•Reservoirs Pressures and PVT properties
•Remaining Reserves as of 01/01/2015
•1st Half 2015 MER tests results for active producing wells.
INPUT DATA FOR 2H 2014 ALLOWABLE COMPUTATION
22

Sample Allowable WorksheetSPDC 2H 2014 ALLOWABLE.xls
Project Pools2H 2014 PROJECT POOLS.xls
Allowable Distribution/
Crude Stream/ CRUDE STREAM 2ND HALF OF 2014.xls
Summary Table
SAMPLE RESULTS
23

24
Flowing Not FlowingADDAX 83 72 59 15AENR 12 9 8 1ALLIED ENERGY 2 0 2 1AMNI 20 6 14 2ATLAS 3 0 2 1BRITTANIA-U 1 0 1 1CHEVRON 306 234 302 33CONSOLIDATED 9 2 5 2CONTINENTAL 18 28 11 3DUBRI 2 2 4 1ENERGIA 8 0 4 1ESSO 29 2 3EXPRESS 1 4 2 1MIDWESTERN 11 8 10 1MOBIL 125 205 147 25MONIPULO 12 0 2NAE 5 4 1NAOC 205 145 105 35NDPR 4 2 4 1NPDC 86 19ORIENTAL 20 1 4 1PAN OCEAN 33 18 40 8PILLAR 2 0 2 1PLATFORM 8 2 4 1SEEPCo 14 1 2 1SEPLAT 66 2 34 5SNEPCO 13 5 1SPDC 452 224 298 53STARDEEP(Agbami) 16 2 1TOTAL E & P 93 38 64 11TOTAL UPSTREAM 20 9 1WALTERSMITH 6 2 5 1
GRAND TOTAL 1685 1005 1155 234
COMPANYNo of Producers
Reservoirs Fields

25
NO OF ACTIVE PRODUC ERS
MER (bopd)1H2014
AVERAGE PROD RATE
(bopd)
1H14 2H14 % Difference
1CHEVRON 50 153 110,640 99,251 93,340 95,930 3%
2 MOBIL 17 105 255,331 171,961 235,950 181,000 -23%
3 TOTAL E & P 14 70 96,690 85,585 76,750 60,280 -21%
4 NAOC 9 31 9,167 3,764 7,975 3,155 -60%
6 SNEPCo 5 13 259,918 150,516 171,000 183,500 7%
7 ESSO 10 29 276,247 192,317 220,000 189,500 -14%
5 NAE 4 5 27,100 23,732 31,300 22,000 -30%
8 STARDEEP 2 16 244,030 241,555 260,000 235,000 -10%
9 TUPNI 6 20 179,500 179,500 0%
117 442 1,279,124 968,682 1,275,815 1,149,865 -10%SUM
TABLE 1 - SECOND HALF 2014 ALLOWABLE FOR PROJECT POOLS
S/No COMPANYNo of
Project Pools
PRODUCTION INDICES ALLOWABLE (BOPD)
26
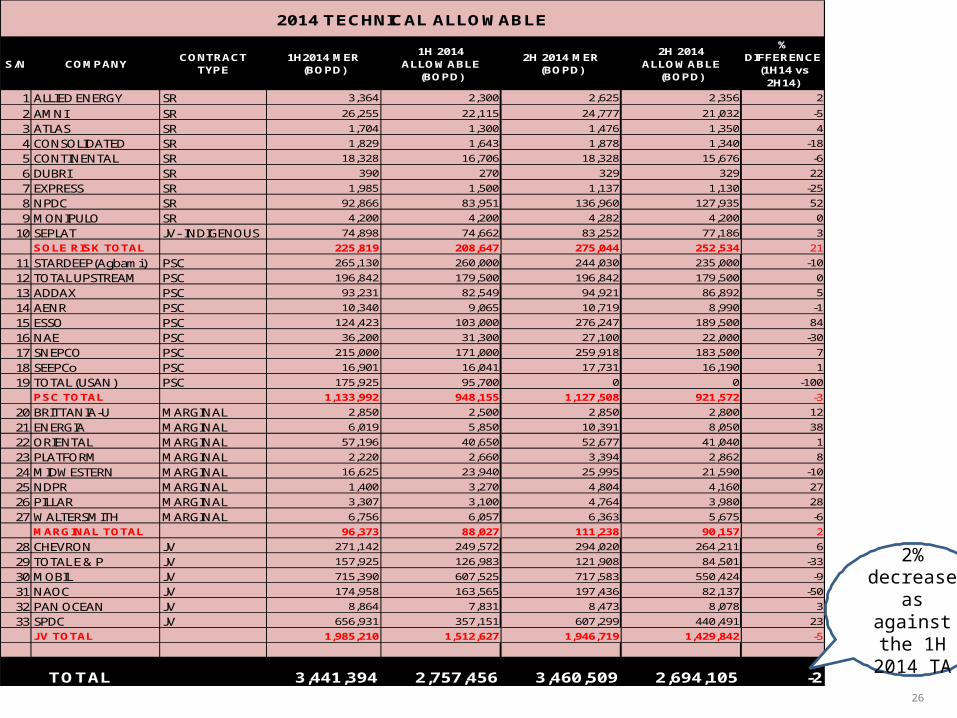
1 ALLIED ENERGY SR 3,364 2,300 2,625 2,356 2
2 AMNI SR 26,255 22,115 24,777 21,032 -5
3 ATLAS SR 1,704 1,300 1,476 1,350 4
4 CONSOLIDATED SR 1,829 1,643 1,878 1,340 -18
5 CONTINENTAL SR 18,328 16,706 18,328 15,676 -6
6 DUBRI SR 390 270 329 329 22
7 EXPRESS SR 1,985 1,500 1,137 1,130 -25
8 NPDC SR 92,866 83,951 136,960 127,935 52
9 MONIPULO SR 4,200 4,200 4,282 4,200 0
10 SEPLAT JV- INDIGENOUS 74,898 74,662 83,252 77,186 3
SOLE RISK TOTAL 225,819 208,647 275,044 252,534 21
11 STARDEEP(Agbami) PSC 265,130 260,000 244,030 235,000 -10
12 TOTAL UPSTREAM PSC 196,842 179,500 196,842 179,500 0
13 ADDAX PSC 93,231 82,549 94,921 86,892 5
14 AENR PSC 10,340 9,065 10,719 8,990 -1
15 ESSO PSC 124,423 103,000 276,247 189,500 84
16 NAE PSC 36,200 31,300 27,100 22,000 -30
17 SNEPCO PSC 215,000 171,000 259,918 183,500 7
18 SEEPCo PSC 16,901 16,041 17,731 16,190 1
19 TOTAL (USAN) PSC 175,925 95,700 0 0 -100
PSC TOTAL 1,133,992 948,155 1,127,508 921,572 -3
20 BRITTANIA-U MARGINAL 2,850 2,500 2,850 2,800 12
21 ENERGIA MARGINAL 6,019 5,850 10,391 8,050 38
22 ORIENTAL MARGINAL 57,196 40,650 52,677 41,040 1
23 PLATFORM MARGINAL 2,220 2,660 3,394 2,862 8
24 MIDWESTERN MARGINAL 16,625 23,940 25,995 21,590 -10
25 NDPR MARGINAL 1,400 3,270 4,804 4,160 27
26 PILLAR MARGINAL 3,307 3,100 4,764 3,980 28
27 WALTERSMITH MARGINAL 6,756 6,057 6,363 5,675 -6
MARGINAL TOTAL 96,373 88,027 111,238 90,157 2
28 CHEVRON JV 271,142 249,572 294,020 264,211 6
29 TOTAL E & P JV 157,925 126,983 121,908 84,501 -33
30 MOBIL JV 715,390 607,525 717,583 550,424 -9
31 NAOC JV 174,958 163,565 197,436 82,137 -50
32 PAN OCEAN JV 8,864 7,831 8,473 8,078 3
33 SPDC JV 656,931 357,151 607,299 440,491 23
JV TOTAL 1,985,210 1,512,627 1,946,719 1,429,842 -5
3,441,394 2,757,456 3,460,509 2,694,105 -2
2014 TECHNICAL ALLOWABLE
S/N COMPANY1H 2014
ALLOWABLE (BOPD)
2H 2014 ALLOWABLE
(BOPD)
2H 2014 MER (BOPD)
TOTAL
% DIFFERENCE
(1H14 vs 2H14)
CONTRACT TYPE
1H2014 MER (BOPD)
2% decrease as against
the 1H 2014 TA

27
944,874 620,917 863,884 269,964 252,534 921,572 90,157 1,429,842
2011/224331
SECOND HALF 2014 TECHNICAL ALLOWABLE DISTRIBUTION BY ASSET
AREA
SECOND HALF 2014 TECHNICAL ALLOWABLE DISTRIBUTION BY CONTACT
TYPEPSC MARGINAL JVMFIO SREAST AREA WEST AREA
DEEP OFFSHORE
35%
23%
32%
10%
TECHNICAL ALLOWABLE DISTRIBUTION BY ASSET AREA
EAST AREA WEST AREA DEEP OFFSHORE MFIO
10%
34%
3%
53%
Technical Allowable Distribution According to Contract Type
SR PSC MARGINAL JV
28
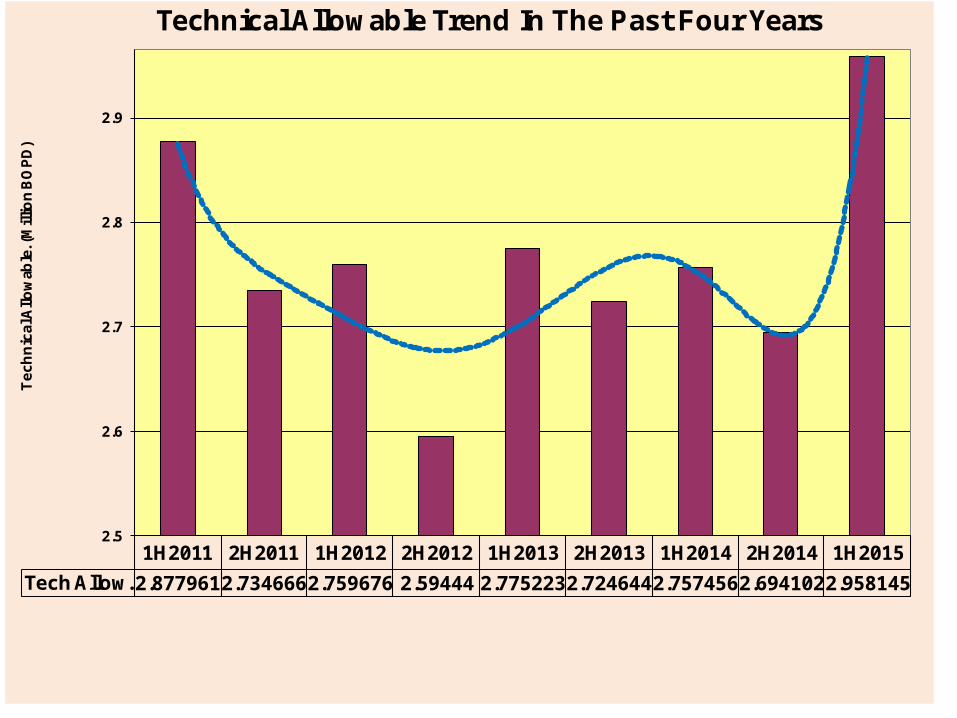
1H2011 2H2011 1H2012 2H2012 1H2013 2H2013 1H2014 2H2014 1H2015
Tech Allow. 2.8779612.7346662.759676 2.59444 2.7752232.7246442.7574562.6941022.958145
2.5
2.6
2.7
2.8
2.9
Te
ch
nic
al A
llo
wab
le. (
Mil
lion
BO
PD
)Technical Allowable Trend In The Past Four Years

:Technical Allowables are granted on well basis They are not transferable An allowable rate represents the ceiling of production
permitted from a well Under-production from well cannot be made up from a
more prolific well in the pool, nor shall it be allowed to grossly overproduce a well to compensate a lost production in a previous period or anticipate loss in future production
At any time, the permissible production shall consists only of allowables of producing wells and production from test wells yet to be granted allowables
Production in excess of allowable from wells shall constitute an infringement and attracts sanction
29
Operating Guidelines For Allowables

Infringement of Rules On MER and/or Allowable - The Penalties
Scenario Action / Penalty 1. *No MER Submission
…..Deliberate ( Example: Companies failing to conduct MER because of the perceived loss of production associated with MER test and the consequences in meeting set business targets)
(i) Assign Zero Allowable Rate to Well(s). (ii) Advice Company to shut-in the wells
….Technical ( Examples: due to problem wells, ageing facility etc.)
(i) Engage companies to evaluate proposals, review well performances and make recommendations. (ii) Engage companies to ascertain its production optimization techniques.
….Logitics/ accessibility of well test locations
(i) Engage companies to ascertain its production optimization techniques. (ii) May consider MER test conducted on annual basis instead of bi-annual as required
30
Infringement of Rules On MER
Allowable review and Supplementary Allowable Surveillance
– Q vs Allow., Rsi vs GOR, Sand, BSW, production profile, etc
Production Audit Engagement/ Meetings
31
Post Allowable Engagements

Infringement of Rules On MER and/or Allowable - The Penalties
Scenario Action / Penalty
2. Production above the authorised Technical Allowable
(i) Over-produced wells are flagged down and recommended for beaning down (ii) Restitution of the over-produced crude depending on the magnitude of the over-production. Penalty of money equivalent may be considered
3. *Wells not on approved production/ No Technical Allowable
Proposal: Assign penalty of monetary equivalent of the 20% of produced crude
*DPR communicates approved allowable rates to Crude Oil Marketing Division (COMD). *Crude Lifting from Fields on no approved Production is not allowed by COMD(i.e fields for which no MER was conducted and no allowable rates granted)
32
Infringement of Rules On MER ….Contd
Intermittent Producers Old Wells Test Vs Choke Sensitivity and BS & W Reliability of Well Performance Simulation Model Gas-Lifted Wells (optimization of lift gas) ESP-Assisted Wells Flow Assurance
33
Special Cases
THANK YOU
34


