
Risk Analysis
Some Useful Tools1 10/16/2002 Eastman Kodak Company, 2002
Risk Analysis for Strategic Decisions
Some Useful Tools
Jerry E. Boger
Eastman Kodak Company
October 16, 2002
PMI – Rochester Chapter
Risk Analysis
Some Useful Tools2 10/16/2002 Eastman Kodak Company, 2002
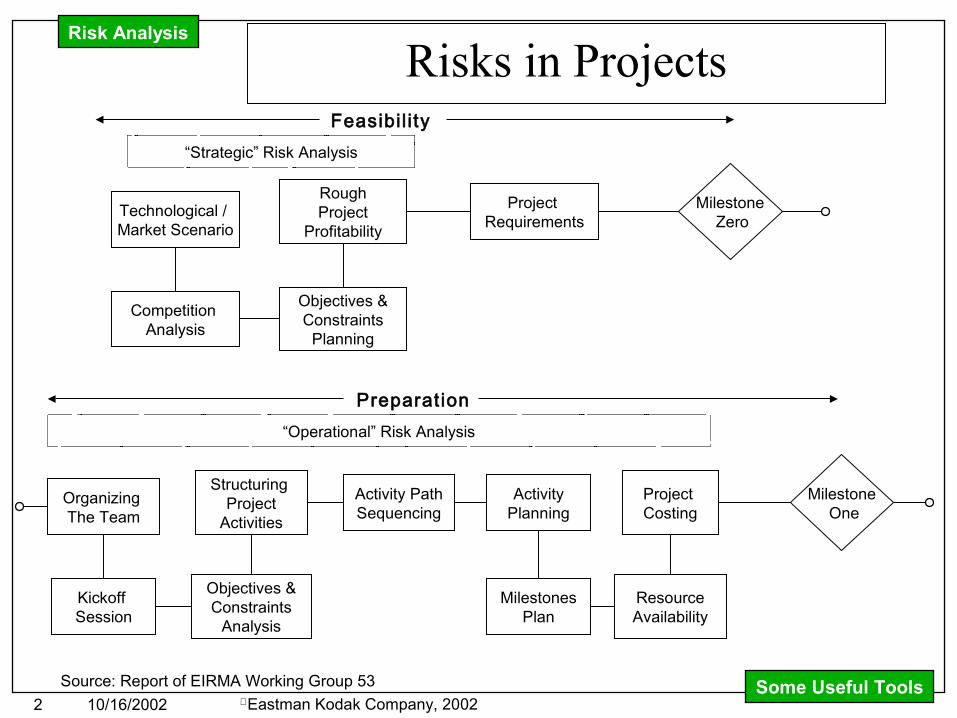
Risks in Projects
Technological / Market Scenario
Competition Analysis
RoughProject
Profitability
Objectives &Constraints
Planning
Project Requirements
Milestone Zero
Organizing The Team
Kickoff Session
Structuring Project
Activities
Objectives &Constraints
Analysis
Activity PathSequencing
ActivityPlanning
MilestonesPlan
Project Costing
ResourceAvailability
Milestone One
Feasibil i ty
Preparat ion
“Strategic” Risk Analysis
“Operational” Risk Analysis
Source: Report of EIRMA Working Group 53

Risk Analysis
Some Useful Tools3 10/16/2002 Eastman Kodak Company, 2002
What is an Influence Diagram?
• A decomposition of a “big uncertainty,” like, “How much money will this project make the company,” into its fundamental uncertainty components
• The outcome of the “influencing” element “Revenue” changes the probability distribution of the “influenced” uncertainty “Earnings” in some significant way
Revenue
Earnings
Costs
Unit Sales
Price

Risk Analysis
Some Useful Tools4 10/16/2002 Eastman Kodak Company, 2002
Example of a Media TechnologyDecision Influence Diagram
NPV
Earnings
Capital
R&D Expenses
PaperUMC
Industry Volume
Paper & Chem Margin
% Kodak Owned
Kodak P/F Earnings
P/FUMC
MarketPotential
MarketShare
Price to Consumer
Performance
Indep. P/F Accept.
Competitive Offerings
P/F Capital Req.
Price to P/F
Manuf'gCapital
P/F Capital
Media Earnings
Advertising
Time toMarket
P/F LaborProcessControl
New Steps
CoatingSpeed
# of Passes
License / Royalty

Risk Analysis
Some Useful Tools5 10/16/2002 Eastman Kodak Company, 2002
Process Steps for Building an Influence Diagram
• Start with the “big uncertainty” on the right side of the page• Work on one uncertainty element at a time; find all the
direct influences for that uncertainty before moving on• Do not show influences that are not uncertainties (knowns)• Define each uncertainty as a question that can be answered
by a number (specify the units), yes or no, or a well-defined multiple choice
• Like peeling an onion, complete one “shell” or level of influencing elements before moving deeper
• Stop when you have enough detail to directly assess the uncertainty elements

Risk Analysis
Some Useful Tools6 10/16/2002 Eastman Kodak Company, 2002
Process Questions
Use the “clairvoyant questions”• To discover the first influence into a target uncertainty,
ask, “What element (uncertainty or decision) would you most want to know to reduce (or eliminate) the uncertainty in the target in question?”
• To discover subsequent influences on that target uncertainty, ask, “If I told you the answer to all the influences identified so far, what other element (if any) would you most want to know to reduce the uncertainty in the target uncertainty?”

Risk Analysis
Some Useful Tools7 10/16/2002 Eastman Kodak Company, 2002
Example from a Technology Decision
• The full tree has a branch for every decision-outcome combination
• Each branch has a probability and an outcome value
This Skeleton Tree
Option Technique Degree of Success
Results in This Full Tree(continued for two more pages)
.
.
.

Risk Analysis
Some Useful Tools8 10/16/2002 Eastman Kodak Company, 2002
Influence Diagram for “Don’t Delay”
Revenue
Cost
Price/Unit
Unit Volume
Feature Setat Launch
Key ComponentPrice Escalation
UMC
CU
U
NPV
Market Share
Market SizeU
COGS

Risk Analysis
Some Useful Tools9 10/16/2002 Eastman Kodak Company, 2002
Example Conceptual Tree for “Commercialization Example”
Payoff is 6 year NPV
Features at launch
Price and share
On Time
Component price
escalationSG&A
Market size
Don’t Delay
Add technical resources
Delay launch 1 year
Abandon program
De-featured
Full
Price and share
1 Year Late
Component price
escalationSG&A
Market size

Risk Analysis
Some Useful Tools10 10/16/2002 Eastman Kodak Company, 2002
F10 F50 F90
• We can characterize uncertainty by estimating three points on the probability distribution: f10, f90, and f50
• The range from f10 to f90 captures 80% of the probability
• By using these points in a sensitivity analysis, the analysis is calibrated for an equal range of probability for each uncertainty
• This is in contrast to a traditional “what-if” analysis using arbitrary ranges of variation
• We can see which uncertainties have the most impact on the uncertainty of the “big uncertainty”

Risk Analysis
Some Useful Tools11 10/16/2002 Eastman Kodak Company, 2002
<== Type Name of 1st Alternative Here
Variable Name
F10 Variable
Value
F50 Variable
Value
F90 Variable
Value F10 Payoff F50 Payoff F90 Payoff Range
1 Features Defeat. Full -6.560951075 1.637795057 1.6378 8.1987510752 Price/Share Poor Anticip Favor -8.264185535 1.637795057 9.895658888 18.159844423 Market Size 80% 100% 130% -0.501100967 1.637795057 4.846139094 5.3472400624 UMC Escal 100% 120% 150% 6.02725387 1.637795057 -4.946393162 10.973647035 SADA 80% 100% 130% 2.165471629 1.637795057 0.846280199 1.319191436
Don't Delay
<== Type Name of 2nd Alternative Here
Variable Name
F10 Variable
Value
F50 Variable
Value
F90 Variable
Value F10 Payoff F50 Payoff F90 Payoff Range
1 Price/Share Poor Anticip Favor -9.082205772 -2.374529692 3.614403533 12.696609312 Market Size 80% 100% 130% -3.704241368 -2.374529692 -0.379962177 3.3242791913 UMC Escal 100% 120% 150% 1.069878092 -2.374529692 -7.541141367 8.6110194594 SADA 80% 100% 130% -1.736758359 -2.374529692 -3.331186691 1.59442833256
Delay 1 Year
Example of data input to a sensitivity analysis spreadsheet• A generic sensitivity analysis workbook can be used• Use a custom model to calculate payoffs then insert the data into this spreadsheet
Risk Analysis
Some Useful Tools12 10/16/2002 Eastman Kodak Company, 2002
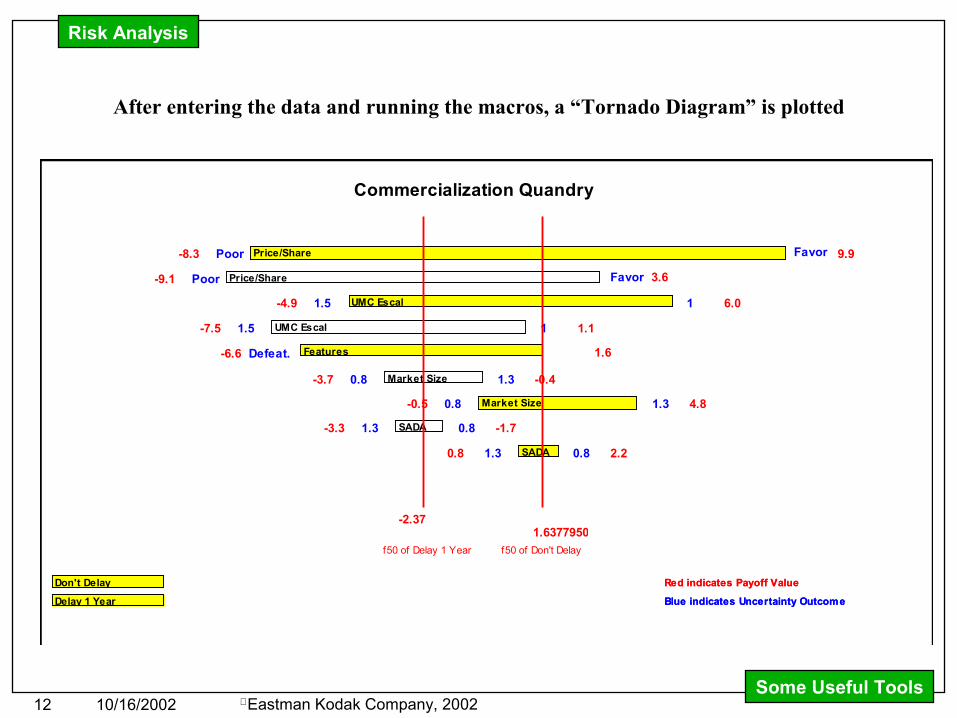
Poor FavorPrice/Share-8.3 9.9
1.5 1UMC Escal-4.9 6.0
Defeat. Features -6.6 1.6
0.8 1.3Market Size-0.5 4.8
1.3 0.8SADA0.8 2.2
Poor FavorPrice/Share-9.1 3.6
1.5 1UMC Escal-7.5 1.1
0.8 1.3Market Size-3.7 -0.4
1.3 0.8SADA-3.3 -1.7
Commercialization Quandry
1.63779505733088f50 of Don't Delay
Red indicates Payoff Value
Blue indicates Uncertainty Outcome
-2.37
f50 of Delay 1 Year
Red indicates Payoff Value
Blue indicates Uncertainty Outcome
Don't Delay
Delay 1 Year
After entering the data and running the macros, a “Tornado Diagram” is plotted

Risk Analysis
Some Useful Tools13 10/16/2002 Eastman Kodak Company, 2002
For problems with up to five uncertainties, Gary Brauer at Kodak has written Microsoft Excelsoftware macros for analysis• Each decision alternative must be treated as a separate tree• You choose the appropriate tree structure, input your data, and link a payoff calculation• For problems that don’t fit the structure choices, special software such as DPL may be used, but a large number of cases do fit

Risk Analysis
Some Useful Tools14 10/16/2002 Eastman Kodak Company, 2002
Don't Delay
ScenarioIndexUMC Escalation (% of base) Market Size (% of base) Features At Launch Price / Share Branch Branch
# Outcome Prob Outcome Prob Outcome Prob Outcome Prob Prob Payoff
1 1 0.3 0.8 0.3 Full 0.7 FF-Poor 0.30 0.0189 -7.0180586212 1 0.3 0.8 0.3 Full 0.7 FF-Anticipated 0.40 0.0252 3.0104660833 1 0.3 0.8 0.3 Full 0.7 FF-Favorable 0.30 0.0189 9.9679138524 1 0.3 0.8 0.3 1.00 #N/A5 1 0.3 0.8 0.3 #N/A6 1 0.3 0.8 0.3 #N/A7 1 0.3 0.8 0.3 Defeatured 0.3 De-Poor 0.30 0.0081 -8.5733029888 1 0.3 0.8 0.3 Defeatured 0.3 De-Anticipated 0.40 0.0108 -4.9531576439 1 0.3 0.8 0.3 Defeatured 0.3 De-Favorable 0.30 0.0081 1.148078203
10 1 0.3 1 0.4 Full 0.7 FF-Poor 0.3 0.0252 -6.5084020111 1 0.3 1 0.4 Full 0.7 FF-Anticipated 0.4 0.0336 6.0272538712 1 0.3 1 0.4 Full 0.7 FF-Favorable 0.3 0.0252 14.7240635813 1 0.3 1 0.4 1 #N/A14 1 0.3 1 0.4 #N/A15 1 0.3 1 0.4 #N/A16 1 0.3 1 0.4 Defeatured 0.3 De-Poor 0.3 0.0108 -8.45245746817 1 0.3 1 0.4 Defeatured 0.3 De-Anticipated 0.4 0.0144 -3.92727578718 1 0.3 1 0.4 Defeatured 0.3 De-Favorable 0.3 0.0108 3.69926902119 1 0.3 1.3 0.3 Full 0.7 FF-Poor 0.3 0.0189 -5.74391709320 1 0.3 1.3 0.3 Full 0.7 FF-Anticipated 0.4 0.0252 10.5524355521 1 0.3 1.3 0.3 Full 0.7 FF-Favorable 0.3 0.0189 21.8582881822 1 0.3 1.3 0.3 1 #N/A23 1 0.3 1.3 0.3 #N/A24 1 0.3 1.3 0.3 #N/A25 1 0.3 1.3 0.3 Defeatured 0.3 De-Poor 0.3 0.0081 -8.27118918826 1 0.3 1.3 0.3 Defeatured 0.3 De-Anticipated 0.4 0.0108 -2.38845300327 1 0.3 1.3 0.3 Defeatured 0.3 De-Favorable 0.3 0.0081 7.52605524728 1.2 0.4 0.8 0.3 Full 0.7 FF-Poor 0.3 0.0252 -8.42268544129 1.2 0.4 0.8 0.3 Full 0.7 FF-Anticipated 0.4 0.0336 -0.50110096730 1.2 0.4 0.8 0.3 Full 0.7 FF-Favorable 0.3 0.0252 6.105190097
The Excel software macro creates the full tree behind the problem distribution

Risk Analysis
Some Useful Tools15 10/16/2002 Eastman Kodak Company, 2002
Scenario Inputs and PayoffInput Area
Scenario Scenario Payoff = -6.809UMC Escalation (% of base) Outcome 1.5 1 1.2 1.5
Market Size (% of base) Outcome 1.3 0.8 1 1.3
Features At Launch Outcome Defeatured Full 0 DefeaturedPrice / Share Outcome De-Favorable
Candidate Values
You have to develop a model that can be linked to this spreadsheet and provide a payoff value for each scenario, i.e., for each branch of the tree
Cumulative Probability Plot
0
0.1
0.2
0.3
0.4
0.5
0.6
0.7
0.8
0.9
1
-15 -10 -5 0 5 10 15 20 25
Payoff Axis
Cu
mu
lati
ve P
rob
abili
ty
Next, a macro runs the model, fills out the tree, and graphs the payoff


