
RIG CONTRACTORS -A Changing Risk
David R. Cooper, VP, Gard AS

Agenda – Rig contractors - a changing risk
An overheated rig market – setting the scene
A changing risk - insurance implications
Factors increasing loss cost
Factors increasing loss frequency
Summary

Rig market - Oil prices driving the industry
0102030405060708090
12/1
/200
3
1/16
/200
4
3/2/
2004
4/14
/200
4
5/26
/200
4
7/12
/200
4
8/23
/200
4
10/5
/200
4
11/1
6/20
04
1/3/
2005
2/15
/200
5
3/31
/200
5
5/12
/200
5
6/24
/200
5
8/8/
2005
9/20
/200
5
11/1
/200
5
15/1
2/20
05
31/0
1/20
06
15/0
3/20
06
27/0
4/20
06
09/0
6/20
06
25/0
7/20
06
2003
2006
USD per barrel
YearDec 2003 Dec 2004 Dec 2005

Rig market - Day rate and utilization - J/U USGoM
Source: ODS Petrodata

Rig Market - Day rate and utilization - Deep water rigs+ 5000 feet water depth
Source: ODS Petrodata

Rig market - Day rate and utilization - Semi submersible
Source: ODS Petrodata

Rig market – Aker H-3 – Semi-sub
Source: ODS Petrodata
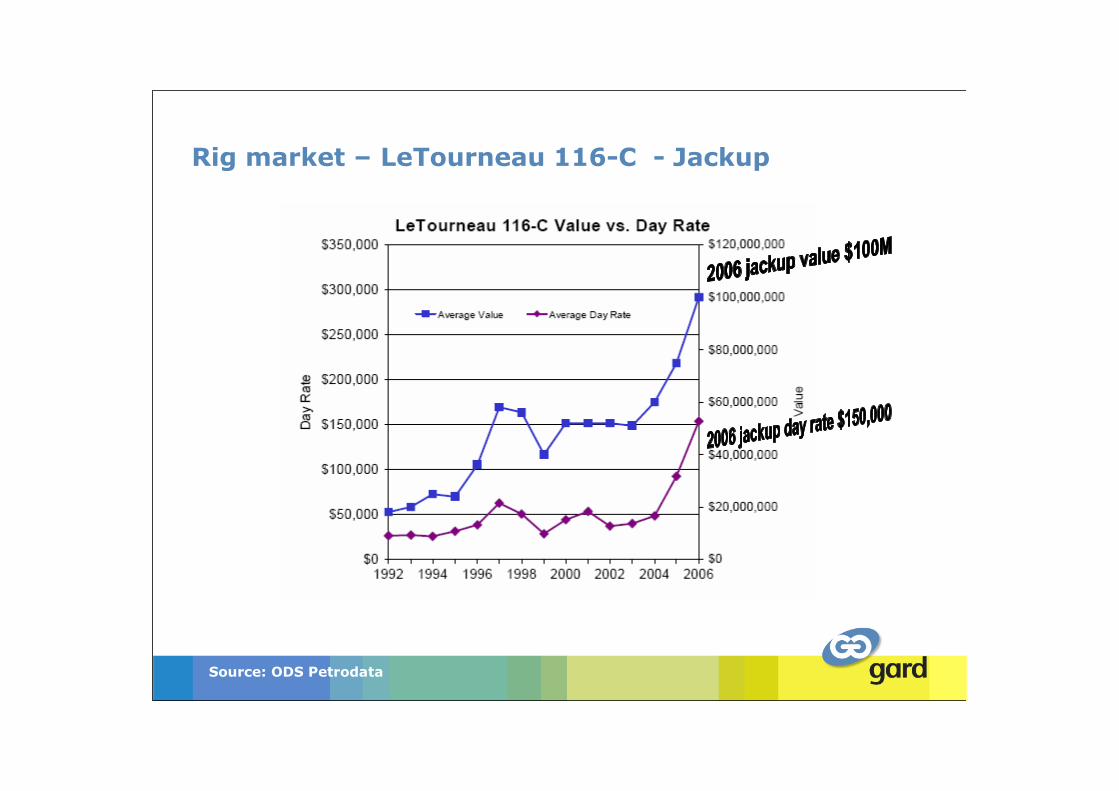
Rig market – LeTourneau 116-C - Jackup
Source: ODS Petrodata

Rig market – Status of rigs
World wide utilization rates is close to 100%
Many old rigs have come out of “cold stacked”
2004 Cold Stacked vs today
Source: ODS Petrodata
2004 2006 Now activeDrillship 9 9Jackup 18 13 3Semisubmersible 20 5 15

0
5
10
15
20
2519
72
1973
1974
1975
1976
1977
1978
1980
1981
1982
1983
1984
1985
1986
1987
1988
1989
1990
1994
1997
1999
2000
2001
2002
2003
2004
2005
Rig market – Age profile Semi Submersibles
Year of build
No
.o
fu
nits

0
10
20
30
40
50
60
70
80
90
1958
1961
1965
1967
1968
1969
1970
1971
1972
1973
1974
1975
1976
1977
1978
1979
1980
1981
1982
1983
1984
1985
1986
1987
1988
1989
1990
1991
1992
1993
1995
1998
1999
2000
2002
2003
2004
2005
Rig market – Age profile Jack Ups
No
.o
fu
nits
Year of build
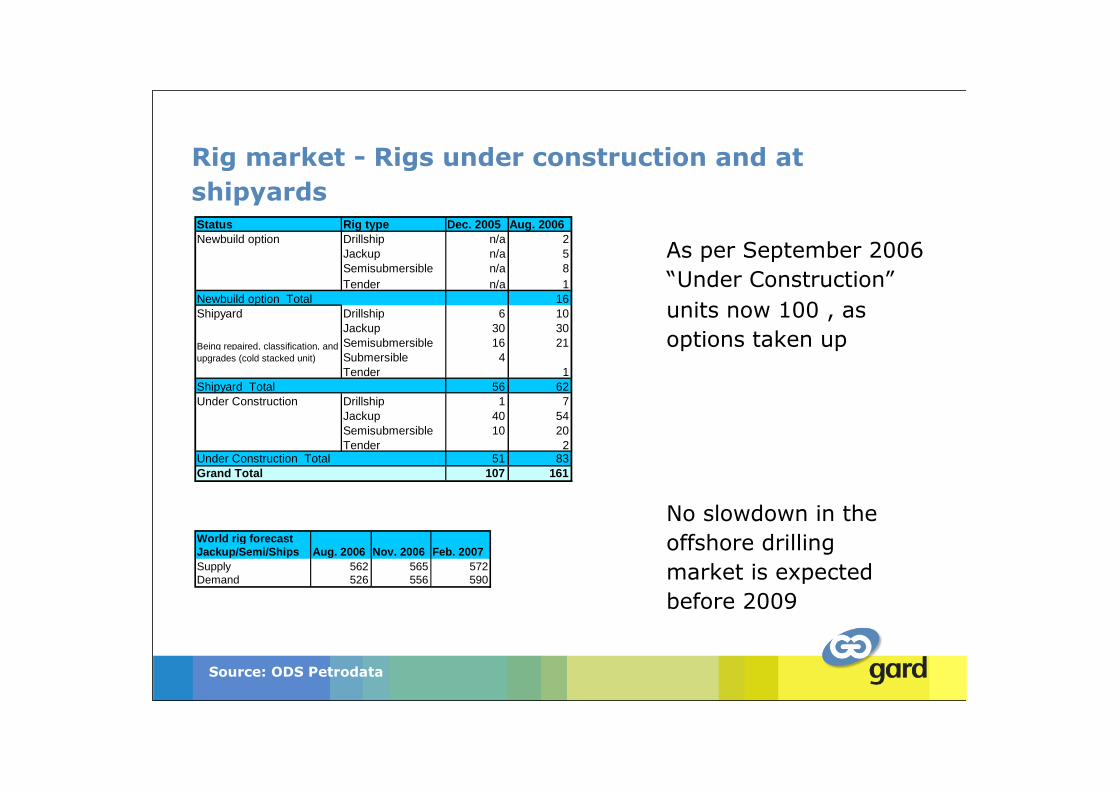
Rig market - Rigs under construction and atshipyards
Source: ODS Petrodata
n No slowdown in theoffshore drillingmarket is expectedbefore 2009
World rig forecastJackup/Semi/Ships Aug. 2006 Nov. 2006 Feb. 2007Supply 562 565 572Demand 526 556 590
n As per September 2006“Under Construction”units now 100 , asoptions taken up
Status Rig type Dec. 2005 Aug. 2006Newbuild option Drillship n/a 2
Jackup n/a 5Semisubmersible n/a 8Tender n/a 1
Newbuild option Total 16Shipyard Drillship 6 10
Jackup 30 30Semisubmersible 16 21Submersible 4Tender 1
Shipyard Total 56 62Under Construction Drillship 1 7
Jackup 40 54Semisubmersible 10 20Tender 2
Under Construction Total 51 83Grand Total 107 161
Being repaired, classification, andupgrades (cold stacked unit)
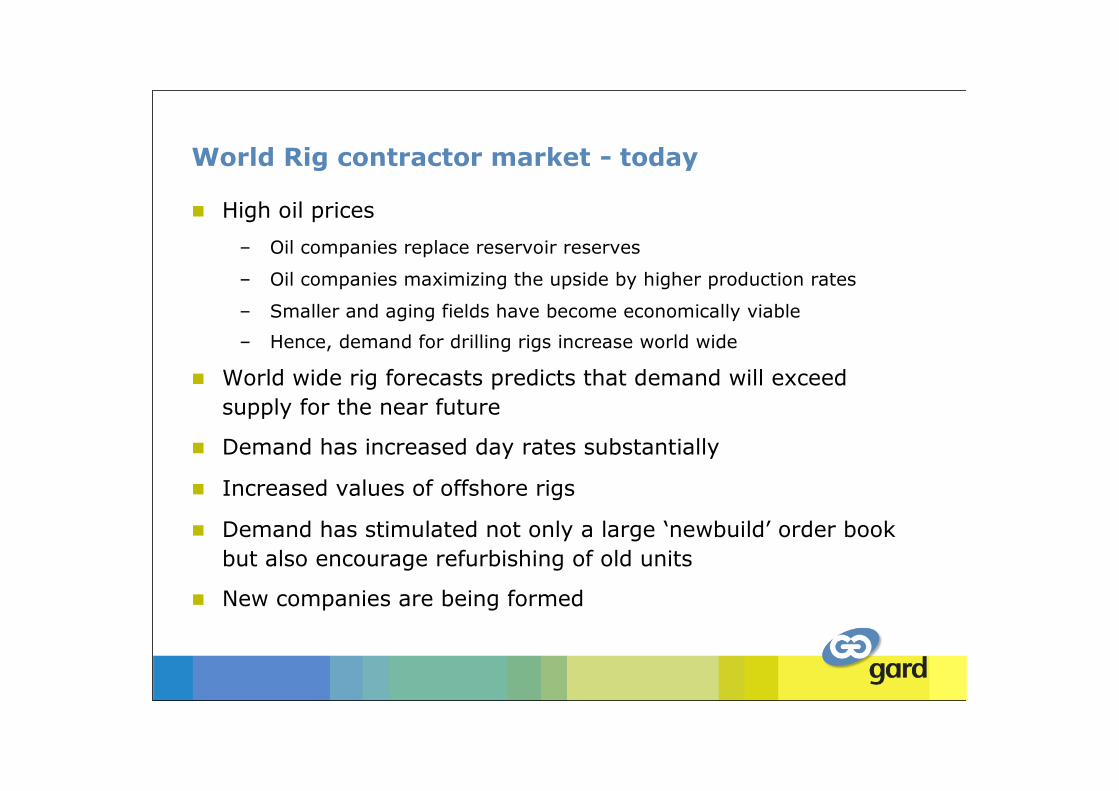
World Rig contractor market - today
High oil prices
– Oil companies replace reservoir reserves
– Oil companies maximizing the upside by higher production rates
– Smaller and aging fields have become economically viable
– Hence, demand for drilling rigs increase world wide
World wide rig forecasts predicts that demand will exceedsupply for the near future
Demand has increased day rates substantially
Increased values of offshore rigs
Demand has stimulated not only a large ‘newbuild’ order bookbut also encourage refurbishing of old units
New companies are being formed

A changing risk – insurance implications
Rig demand creates a large newbuild
order, yard prices go up
Increased day rates and focus on
potential loss of revenue create larger
values for Loss of Hire insurance
Rig companies revalue their fleets values
upwards creating higher risk severity.
However, not increased at same rate as
market values ??
High rig activity means higher rig- move
frequency (insurance claims will increase)
Shortage of experienced crew on drilling
units an area of concern
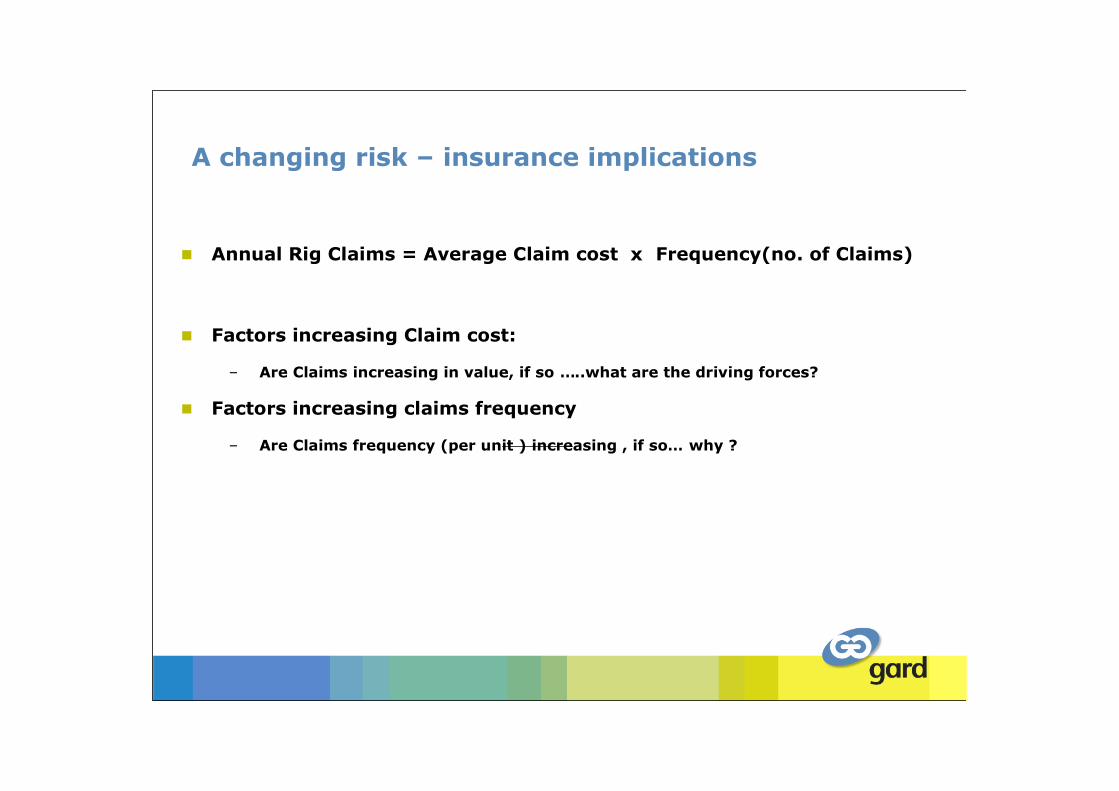
Annual Rig Claims = Average Claim cost x Frequency(no. of Claims)
Factors increasing Claim cost:
– Are Claims increasing in value, if so …..what are the driving forces?
Factors increasing claims frequency
– Are Claims frequency (per unit ) increasing , if so… why ?
A changing risk – insurance implications

Factors increasing loss cost - lead times
BOP stack 2+ years
Riser 2+ years
Jacking systems 1+ year
Mud pumps 14-16 months
Drawworks 16 months
Top drives 12-18 months
Derrick 8-12+ months
Diesel engines 2+ years
Deck cranes (Seatrax) 14 months
High Tensile steel 6 months
Such equipment +20% cost increase last 12 months

Factors increasing loss cost – other increases
Steel prices increased about 50% since 2003
Rig Yards fully committed with New builds until 2009
AHTS and Ocean-going tugs have increased day-rates up toUSD 100,000 per day , +200 % from 2004. Not alwaysavailable.
Dry transport vessels “fully” booked for next 12months,
a dry transport from Singapore to Africa can cost USD 5 million
Crane barge rates +200 to 300% past 2 years

Summary – increased costs and increased repair time
Jackup Rig claim – Leg damage, punch through
Policy deductible USD 1 million , LOH 45 days
2004 2006
Demobilisation/tow/mobilisation USD 560,000 (14days) 1,440.000 (18days)
Waiting for Tug/AHTS 3 days 10 days
Yard costs USD 4,000,000 USD 6,000,000
Yard time 60 days 180 days
Net PD claim USD 3,360,000 USD 6,440,000
Days off hire 74 days 208 days
LOH daily amount USD 30,000 USD 60,000
Net days 29 days 163 days
Net LOH claim USD 870,000 USD 9,780,000

Factors increasing loss frequency
More frequent rig moves (jackups), more Ocean transits
Local rig moves ( punch through )
Quality Warranty Surveys are essential
Willis database,1994-2004 excluding
named windstorm:
Jackup indexed claims = $1,138 million
Leg punch through =$252 million

Factors increasing loss frequency
More frequent rig moves (particularly jackups)
Ocean/Regional relocation, even dry transport has its problems
Willis database,1994-2004 excluding
named windstorm:
Jackup indexed claims = $1,138 million
Transit/Heavy weather =$184 million

Factors increasing loss frequency
High drilling activity - correlation with increased blow-out frequency
Willis database,1994-2004 excluding
named windstorm:
Jackup indexed claims = $1,138 million
Blow-out damage = $ 349 million
Factors increasing loss frequency – human error
The rig industry has identified a shortage in drill crewsincluding specialist crews such as Jack Forman, sub-seaengineers, rig movers & barge masters.

Rig market – rigs under construction + options
Source: various
Numberof Units
KeyPersonsPer Unit
Est. ValueUSDMillions
Demandfor Key RigPersonnel
Jackup 59 62 9,440 3,658Semisubmersible 28 76 14,000 2,128Drillships 9 80 6,300 720Total 96 218 29,740 6,506

Rig utilization
Source: Various
August2004 Nrof Units(Utilized)
August2006 Nrof Units(Utilized)
RigIncrease(Utilized)
DemandIncrease forKey RigPersonnel
Jackup 288 314 26 1,618Semisubmersible 120 150 30 2,297Drillships 24 34 10 775Total 432 498 66 4,690

0
10
20
30
40
50
60
70
80
90
1958
1961
1965
1967
1968
1969
1970
1971
1972
1973
1974
1975
1976
1977
1978
1979
1980
1981
1982
1983
1984
1985
1986
1987
1988
1989
1990
1991
1992
1993
1995
1998
1999
2000
2002
2003
2004
2005
Rig market – Age profile of the drill crew onJack Ups – The “good old boys” are going
A generation shift will take placeduring the next few years, as manyof the recruits of the 1970’s taketheir retirement
A generation shift
No. of units

Factors increasing claims frequency – human errorrig crew shortage
+10,000 new drill/rig crew need in a 5 year period
+Generation shift when drill crews of the late 1970’s retire
US rig contractor “ We are re-hiring some of our pensionedrighands on a 2 year deal”
European contractor “ Stealing from other companies is not theway to solve this issue. It only makes it worse”
European contractor “ We have a multi-year strategy fordealing with crew requirements based on an integratedrecruitment plan

Claims development last 5 years
Source: Willis Claims DB
Estimated total premium between 100-150 million in 2000
Estimated total premium between 250-300 million in 2005
2000-2004 period of low utilisation, hence less frequency
Year Incidents Average actual Total Indexed Average Indexed2000 23 7,444,314 205,888,843 8,951,6892001 20 12,400,968 298,088,698 14,904,4352002 30 9,557,330 343,469,575 11,448,9862003 13 7,770,940 119,090,628 9,160,8182004 24 26,915,792 718,108,022 29,921,1682005 69 19,213,275 1,325,716,000 19,213,275

Agenda – Rig contractors - a changing risk
An overheated rig market – setting the scene
A changing risk - insurance implications
Factors increasing loss cost
Factors increasing loss frequency
Summary

Summary
Rig values will remain high – loss severity increases
Important rig parts such as Blowout Preventers will have a longlead time
Tug / rig move costs will remain high.
Quality warranty surveys
Underwriters will have to pay higher repair costs, if deductiblesdo not increase
Average periods under repair will increase significantly
Underwriters will have much larger LOH claims if the waitingperiod/deductible does not increase
THE BIG QUESTION IS …………………………….
WILL CLAIMS FREQUENCY INCREASE ?
Are the Rig Contractors able to handle the crewing shortage,recruit and train staff to keep their rigs in safe & experiencedhands and to the same standard ?
or
Crew shortages = less experienced crews =Human error=higher claims frequency per unit = ?
if so . . .
What will be the annual claims in 2008?


