SUST Journal of Engineering and Computer Science (JECS), Vol. 15, No. 1, January 2014
34
Rheologyical Properties Evaluation of Sudanese Bentonite with Different Additives
Rashid.A.M.Hussein1, Sumya.A.Mohamed2, Abusabah.E.Elemam3, Adil.A. Alhassan4
1, 2 College of Petroleum Engineering and Technology,
3 College of Water and Environmental Engineering,
4 College of Engineering,
Sudan University of Science and Technology (SUST)
Received:28.06.2013
Accepted:23.07.2013
ABSTRACT: This study was carried out to assess the rheological properties and filtration loss for a drilling
fluid prepared from local bentonite. Required data and sampleswere carfelluy gathered from the study
area(Al-fao area) in accord of approved sampling procesdures. Mineralogical, physical, chemical tests were
carried out to assess quality of local bentonite. Sodium carboxymethyl cellulose(CMC), polyanionic cellulose
polymer(PAC-LV), and sodium carbonate(Na2CO3)wereused to increase viscosity and to decrease filtration
losses. The results have shown that the local bentonite can satisfy the American Petroluem Institute (API)
specifications for different concentrations of CMC and PAC-LV. Adition of 10% CMC concentration for the
selected local bentonite, inhances rheological properties, filter loss and yield point as related to plastic
viscosity ratio became within the range of API specifications. Keywords: Drilling Engineering, Rheological Properties, Sudanese Bentonite.
��"%78 6&4 +.45 +, 3*!12%0/ +.�- +, +*()' ا�&%و:#"! ��ا 9:4��!)<<A ا� 2اص ا?1"<%3<'و=%>; ا 'Bرا;�إ04G/ إK!L%رات . أ04G/ ھEه ا
/0%12!*K��!)<<2G Aدة ا '>8%>#>P�و1234U%ت PAC-LVو 7W+CMC أVS3 /+; !B ا�#2اد. ا�!T>U4 ا�#S;1- واK!LR%رات ا�&<0Q%8<' وا9:4��0Q%دة ا��QوG' وX)�<7 =2ا>; ا Y�T"*3 +.;دة =d(.0 _1% +2اc&%ت PAC-LVو CMCأظ4aت ا�*!%8` أ1_ ^*; إ[%=' . ا�\2د20م وذ
/0%12!*K��)<%س 2Gدة ا -P04+f4ول ا!K�204�G2<' و=%>; ا�9:4 و+S;ل % CMC 'K"*310^*; إ[%=' . +aS; ا�ا�#(%و^' إ�- =lن ا� 2اص ا-P04+f4ول ا!K� .ا��QوG' ا�2PX '>P>!BmKن [#, 6;ود +2اaS+ '&c; ا
INTRODUCTION
Drilling fluids are considered as the single most
important earth excavation exercise, especially
when drilling oil and gas wells and are often
used for much simpler boreholes such as water
wells using conventional rotrary method.[1]
. The
importance of drilling fluids to drilling
operations is almost the same as the importance
of blood to human body[1]
. The main objective
of drilling fluids isthe successful completion of
oil and gas wells [2].
The drilling fluids must be
selected and/or designed to fulfill the following
functions [3]
• Remove cuttings from wellbore.
• Prevent formation fluids flowing into the
wellbore.
• Maintain wellbore stability.
• Cool and lubricate the bit.
• Transmit hydraulic horsepower to bit.
These functions are controlled by rheological
and filtration properties of the mud [4]
.Rheological parameters are used to
determinethe following characteristics of the
mud [2]
.
• Ability to suspend and carry cuttings to the
surface.
• To analyze the effect of drilled solids
contaminant, chemical and temperature.
• To calculate swage and swab pressure.
Drilling fluids are commonly classified,
according to their base fluid, into three main
groups: (1) water- base drilling fluids, (2) oil –
base drilling fluids, and (3) gaseous drilling
fluids. (4)
The main component of water-base drilling
fluids is clay (mostly bentonite) [5].
Bentonite is a
major additive, which gives the proper
rheological (Non newtonion shear thinning) and

SUST Journal of Engineering and Computer Science (JECS), Vol. 15, No. 1, January 2014
35
filtration control (low fluid loss under
differential pressure) properties[6].
Commercial
bentonite rarely contains less than 60% smectite
and usually more than 70%, associated minerals
typically being quartz, cristobalite, feldspars,
zeolite, calcite, volcanic glass and other clay
minerals such as koalinite.
Depending on the dominant exchangeable
cations present, the clay may be referred to as
either calcium or sodium bentonite, the two
varieties exhibiting markedly different
properties and thus uses[7]
. In the local oil and
gas industry, bentonite is used as a drilling mud
material and asan oil well cement additive. In
Sudan, bentonite is mainly imported from
abroad, from India, KSA, Egypt and Libya. In
order to reduce the dependency of imported
bentonite, the development and production of
the local bentonite are sought to be initiated due
to long way of transportation and storage.The
objective of this study is to enhance Al-fao
bentonite properties to meet American
petroleum institute (API) and oil companies’
material association (OCMA) specifications [8].
MATERIAL AND METHODS
Sampling collection
The samples used in this study were obtained
from Al -Fao (Lat: 14.150 – Long: 34.33 – Alt :
700 km) in Eastern part of the Sudan. Samples
were obtained from the active zone of shrinkage
and swelling (between 0.5 to 3.0 m).These
clayey soils are estimated to have high to very
high Smectite. The samples were collected
during the dry season of the year.
Raw Samples Preparation Raw samples were dried in an oven and then
crushed using crusher type RS200in accord with
standard methods. The powder was sieved by
using a 75 micron opening mesh.
Methodology of Tests The laboratory testing program was divided into
four types of testing: mineralogical test, physical
tests, chemical tests and drilling fluid properties
tests
Mineralogical Tests The X-ray diffraction and scanning electronic
microscope SEM were used to obtain
mineralogical composition of the raw bentonite.
The result of X-ray and SEM methods are
shown in Figures 1, 2, 3 and Table1.
Physical Tests The physical tests carried out on the samples
are: Atterberg limits, liquid and plastic limits,
particle size distribution.
Figure 1: X-ray diffraction analysis.

SUST Journal of Engineering and Computer Science (JECS), Vol. 1
Figure 3: SEM photograph of Alfaocentonite.
The determination of the Atterberg Limit values
was carried out according to the cone
penetration method in BS 1377: Part 2:1990 CL
4.3.Particle size distribution by sieve analysis
was carried out for quantitative determination
SUST Journal of Engineering and Computer Science (JECS), Vol. 15, No. 1
36
Figure 2: X-ray diffraction analysis.
Figure 3: SEM photograph of Alfaocentonite.
determination of the Atterberg Limit values
was carried out according to the cone
penetration method in BS 1377: Part 2:1990 CL
Particle size distribution by sieve analysis
was carried out for quantitative determination
for particle size greater than 0
gravel), and by hydrometer analysis method, for
particle size smaller than 0.063 mm (clay and
silt). The results of Atterberg Limit values and
particle size distribution are shown in Table
Chemical Test The Sodium Absorption Ratio (SAR
carried out to determine the amounts of main
metallic cations (calcium, magnesium and
sodium). All the results of chemical testing
werereported in Table 3.
Drilling fluids Tests These tests were carried out to determine
rheology and filtration loss properties for treated
bentonite. All tests depend on API specification
13A and 13B-1. The results of Drilling fluids
Tests are shown in Figure 5 to 18.
RESULTS AND DISCUSSIONSFrom Table 1 it can be seen that the amount of
fines is 89% and L.L value
low for non treated bentoniteas compared with
Na and Ca bentonites.
Table 2 lists chemical composition of non
treated bentonite and the CEC value was found
to be 83 meq/100g. This indicates a positive
impact on hydration and swelling.
3 and Table 3 show that the clay mineral
composition is smectite group with few amounts
of impurities such as kaolinite and illite.
The increase of PAC
decreases the filtration loss values as shown in
Figure 4. This is associated with the increase of
5, No. 1, January 2014
for particle size greater than 0.063mm (sand and
gravel), and by hydrometer analysis method, for
particle size smaller than 0.063 mm (clay and
The results of Atterberg Limit values and
particle size distribution are shown in Table 2.
The Sodium Absorption Ratio (SAR) test was
carried out to determine the amounts of main
metallic cations (calcium, magnesium and
sodium). All the results of chemical testing
.
These tests were carried out to determine
loss properties for treated
bentonite. All tests depend on API specification
1. The results of Drilling fluids
Tests are shown in Figure 5 to 18.
RESULTS AND DISCUSSIONS 1 it can be seen that the amount of
fines is 89% and L.L value is 66 which is very
low for non treated bentoniteas compared with
2 lists chemical composition of non
treated bentonite and the CEC value was found
to be 83 meq/100g. This indicates a positive
impact on hydration and swelling.Figure 1,2 and
3 show that the clay mineral
composition is smectite group with few amounts
of impurities such as kaolinite and illite.
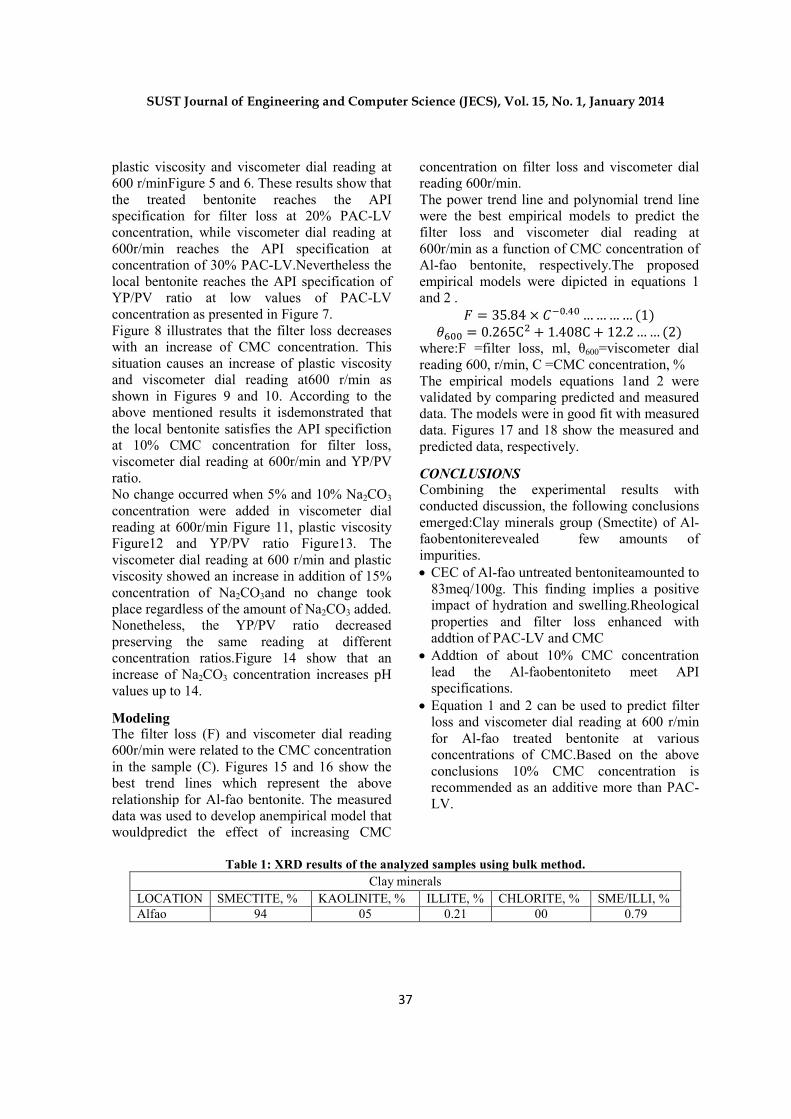
The increase of PAC-LV concentration
decreases the filtration loss values as shown in
ated with the increase of
SUST Journal of Engineering and Computer Science (JECS), Vol. 15, No. 1, January 2014
37
plastic viscosity and viscometer dial reading at
600 r/minFigure 5 and 6. These results show that
the treated bentonite reaches the API
specification for filter loss at 20% PAC-LV
concentration, while viscometer dial reading at
600r/min reaches the API specification at
concentration of 30% PAC-LV.Nevertheless the
local bentonite reaches the API specification of
YP/PV ratio at low values of PAC-LV
concentration as presented in Figure 7.
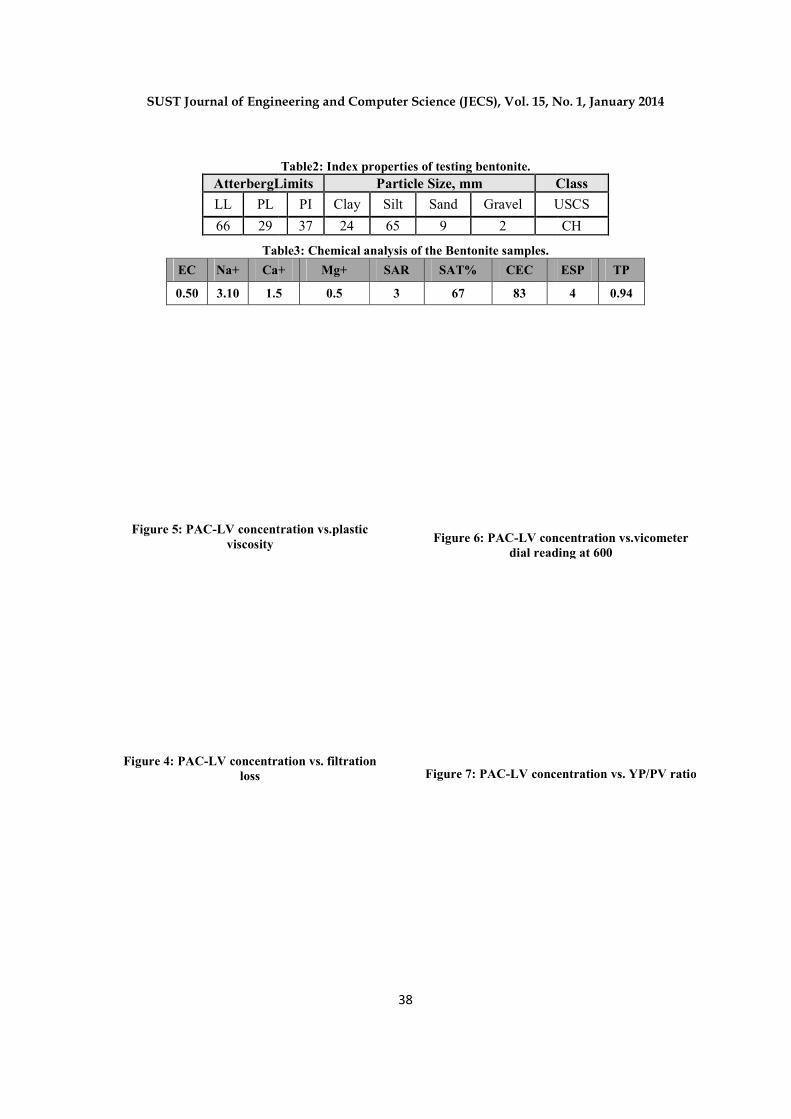
Figure 8 illustrates that the filter loss decreases
with an increase of CMC concentration. This
situation causes an increase of plastic viscosity
and viscometer dial reading at600 r/min as
shown in Figures 9 and 10. According to the
above mentioned results it isdemonstrated that
the local bentonite satisfies the API specifiction
at 10% CMC concentration for filter loss,
viscometer dial reading at 600r/min and YP/PV
ratio.
No change occurred when 5% and 10% Na2CO3
concentration were added in viscometer dial
reading at 600r/min Figure 11, plastic viscosity
Figure12 and YP/PV ratio Figure13. The
viscometer dial reading at 600 r/min and plastic
viscosity showed an increase in addition of 15%
concentration of Na2CO3and no change took
place regardless of the amount of Na2CO3 added.
Nonetheless, the YP/PV ratio decreased
preserving the same reading at different
concentration ratios.Figure 14 show that an
increase of Na2CO3 concentration increases pH
values up to 14.
Modeling The filter loss (F) and viscometer dial reading
600r/min were related to the CMC concentration
in the sample (C). Figures 15 and 16 show the
best trend lines which represent the above
relationship for Al-fao bentonite. The measured
data was used to develop anempirical model that
wouldpredict the effect of increasing CMC
concentration on filter loss and viscometer dial
reading 600r/min.
The power trend line and polynomial trend line
were the best empirical models to predict the
filter loss and viscometer dial reading at
600r/min as a function of CMC concentration of
Al-fao bentonite, respectively.The proposed
empirical models were dipicted in equations 1
and 2 .
� = 35.84 × �.��…………(1)
���� = 0.265C� + 1.408C + 12.2……(2) where:F =filter loss, ml, θ600=viscometer dial
reading 600, r/min, C =CMC concentration, %
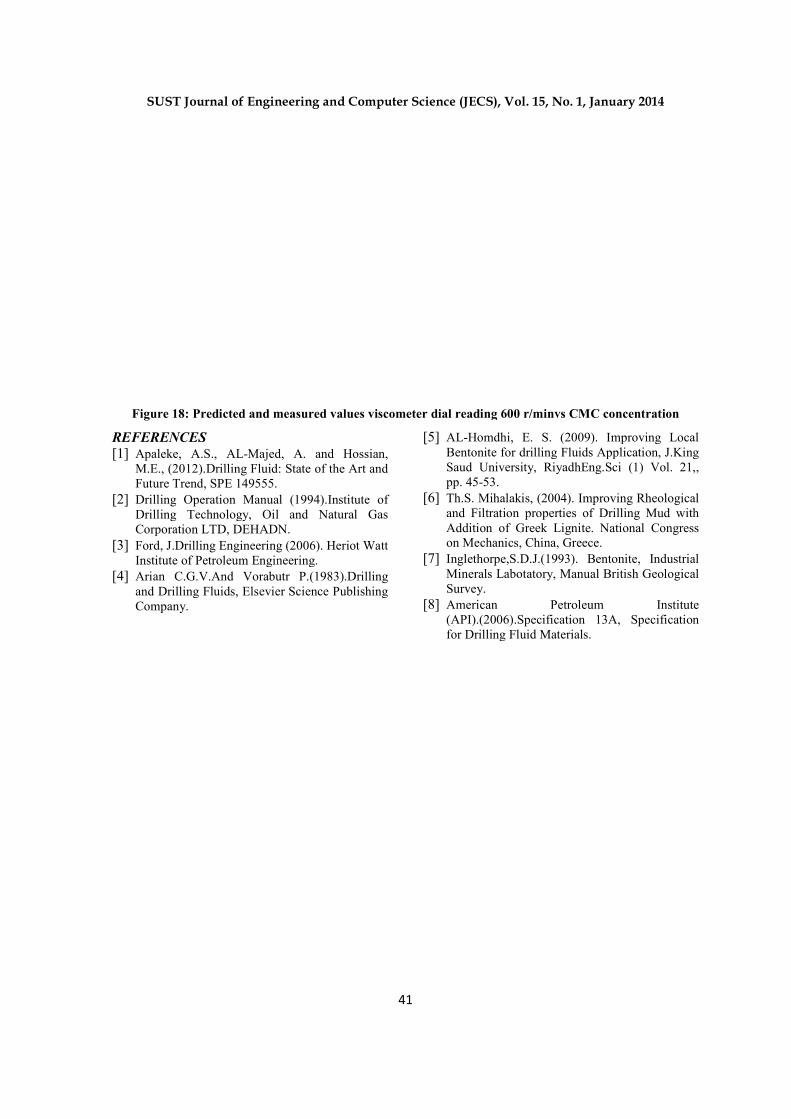
The empirical models equations 1and 2 were
validated by comparing predicted and measured
data. The models were in good fit with measured
data. Figures 17 and 18 show the measured and
predicted data, respectively.
CONCLUSIONS Combining the experimental results with
conducted discussion, the following conclusions
emerged:Clay minerals group (Smectite) of Al-
faobentoniterevealed few amounts of
impurities.
• CEC of Al-fao untreated bentoniteamounted to
83meq/100g. This finding implies a positive
impact of hydration and swelling.Rheological
properties and filter loss enhanced with
addtion of PAC-LV and CMC
• Addtion of about 10% CMC concentration
lead the Al-faobentoniteto meet API
specifications.
• Equation 1 and 2 can be used to predict filter
loss and viscometer dial reading at 600 r/min
for Al-fao treated bentonite at various
concentrations of CMC.Based on the above
conclusions 10% CMC concentration is
recommended as an additive more than PAC-
LV.
Table 1: XRD results of the analyzed samples using bulk method.
Clay minerals
LOCATION SMECTITE, % KAOLINITE, % ILLITE, % CHLORITE, % SME/ILLI, %
Alfao 94 05 0.21 00 0.79
SUST Journal of Engineering and Computer Science (JECS), Vol. 1
AtterbergLim
LL PL
66 29
Table
EC Na+ Ca+
0.50 3.10 1.5
Figure 5: PAC-LV concentration vs.plastic viscosity
Figure 4: PAC-LV concentration vsloss
SUST Journal of Engineering and Computer Science (JECS), Vol. 15, No. 1
38
Table2: Index properties of testing bentonite. AtterbergLimits Particle Size, mm Class
PI Clay Silt Sand Gravel USCS
37 24 65 9 2
Table3: Chemical analysis of the Bentonite samples.
Ca+ Mg+ SAR SAT% CEC
1.5 0.5 3 67 83
LV concentration vs.plastic
concentration vs. filtration
Figure 6: PAC-LV concentration vs.vicometer dial reading at 600
Figure 7: PAC-LV concentration vs. YP/PV ratio
5, No. 1, January 2014
Class
USCS
CH
ESP TP
4 0.94
LV concentration vs.vicometer
dial reading at 600
LV concentration vs. YP/PV ratio
SUST Journal of Engineering and Computer Science (JECS), Vol. 1
Figure 8: CMC concentration vs.filtration loss
Figure 10: CMC Concentration vs.Vicometer dial reading at 600
Figure 9: CMC Concentration vs Plastic Viscosity
SUST Journal of Engineering and Computer Science (JECS), Vol. 15, No. 1
39
Figure 8: CMC concentration vs.filtration loss
Figure 10: CMC Concentration vs.Vicometer dial
reading at 600
Figure 9: CMC Concentration vs Plastic Viscosity
Figure 11:Na2COvs.Vicometerdial
Figure 13: Na2CO3Concentration vs. YP/PV Ratio
Figure 12: Na2CO3 Concentration vs. Plastic Viscosity
5, No. 1, January 2014
CO3 Concentration
Vicometerdial reading at 600
Concentration vs. YP/PV Ratio
Concentration vs. Plastic
Viscosity
SUST Journal of Engineering and Computer Science (JECS), Vol. 1
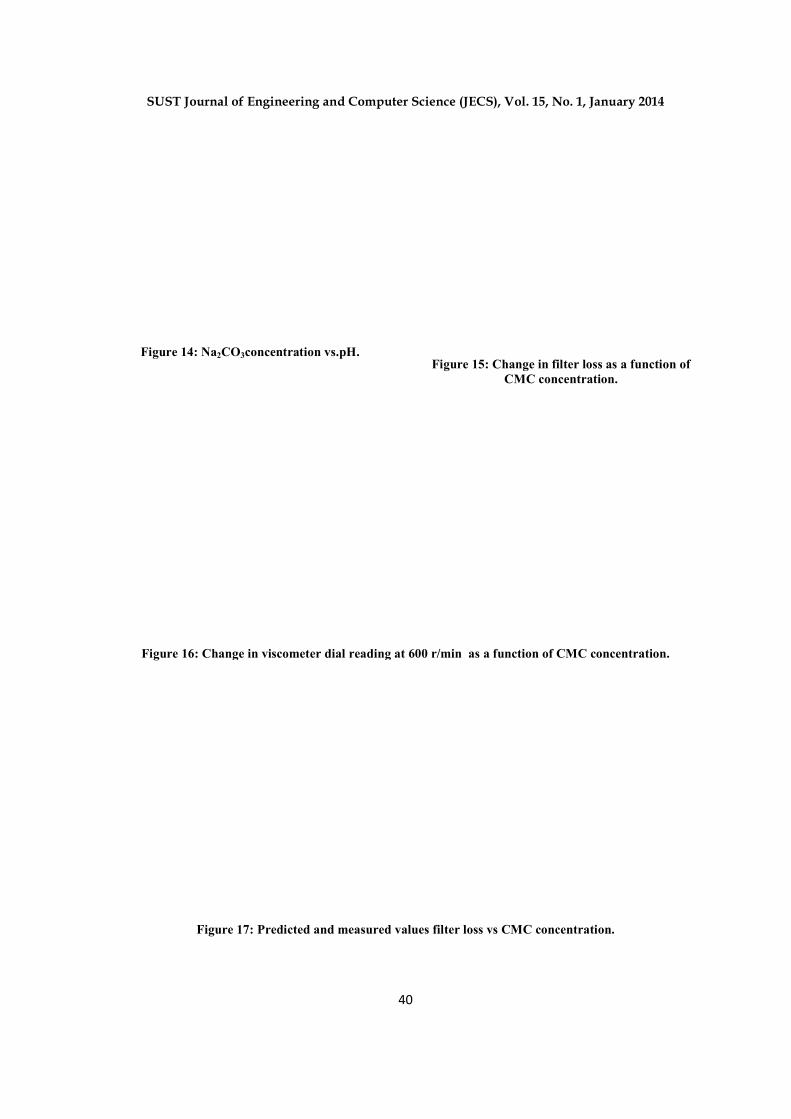
Figure 14: Na2CO3concentration vs.pH.
Figure 16: Change in viscometer dial reading at 600 r/min as a function of CMC concentration.
Figure 17: Predicted and measured values filter loss vs CMC concentration.
SUST Journal of Engineering and Computer Science (JECS), Vol. 15, No. 1
40
concentration vs.pH.
Figure 15: Change in filter loss as a function of CMC concentration.
hange in viscometer dial reading at 600 r/min as a function of CMC concentration.
17: Predicted and measured values filter loss vs CMC concentration.
5, No. 1, January 2014
15: Change in filter loss as a function of
CMC concentration.
hange in viscometer dial reading at 600 r/min as a function of CMC concentration.
17: Predicted and measured values filter loss vs CMC concentration.
SUST Journal of Engineering and Computer Science (JECS), Vol. 1
Figure 18: Predicted and measured values viscometer dial reading 600 r/minvs CMC concentration
REFERENCES
[1] Apaleke, A.S., AL-Majed, A. and Hossian,
M.E., (2012).Drilling Fluid: State of the Art and
Future Trend, SPE 149555.
[2] Drilling Operation Manual (1994).Institute of
Drilling Technology, Oil and Natural Gas
Corporation LTD, DEHADN.
[3] Ford, J.Drilling Engineering (2006). Heriot Watt
Institute of Petroleum Engineering.
[4] Arian C.G.V.And Vorabutr
and Drilling Fluids, Elsevier Science Publishing
Company.
SUST Journal of Engineering and Computer Science (JECS), Vol. 15, No. 1
41
18: Predicted and measured values viscometer dial reading 600 r/minvs CMC concentration
Majed, A. and Hossian,
(2012).Drilling Fluid: State of the Art and
Drilling Operation Manual (1994).Institute of
Drilling Technology, Oil and Natural Gas
Corporation LTD, DEHADN.
Ford, J.Drilling Engineering (2006). Heriot Watt
ngineering.
Arian C.G.V.And Vorabutr P.(1983).Drilling
and Drilling Fluids, Elsevier Science Publishing
[5] AL-Homdhi, E. S. (2009). Improving Local
Bentonite for drilling Fluids Application, J.King
Saud University, RiyadhEng.Sci (1) Vol. 21,,
pp. 45-53.
[6] Th.S. Mihalakis, (2004). Improving Rheological
and Filtration properties of Drilling Mud with
Addition of Greek L
on Mechanics, China,
[7] Inglethorpe,S.D.J.(1993). Bentonite, Industrial
Minerals Labotatory, Manual British
Survey.
[8] American Petroleum Institute
(API).(2006).Specification 13A, Specification
for Drilling Fluid Materials.
5, No. 1, January 2014
18: Predicted and measured values viscometer dial reading 600 r/minvs CMC concentration
Homdhi, E. S. (2009). Improving Local
Bentonite for drilling Fluids Application, J.King
Saud University, RiyadhEng.Sci (1) Vol. 21,,
Th.S. Mihalakis, (2004). Improving Rheological
and Filtration properties of Drilling Mud with
Lignite. National Congress
, Greece.
(1993). Bentonite, Industrial
Minerals Labotatory, Manual British Geological
American Petroleum Institute
(API).(2006).Specification 13A, Specification
for Drilling Fluid Materials.


