
RESULTS OF THE CO2 CAPTURE
DEMONSTRATION FACILITY AT EDF’S LE HAVRE POWER
PLANT Dr. François GIGER, Fabrice CHOPIN EDF SA France 10th CO2 GeoNet Open Forum Capture Workshop Venice, 13th May 2015
Fossil Fired Generation & Engineering Division, R&D

1. Strategic approach
2. Le Havre CCS Pilot
3. Main Results and Lessons Learned
4. Conclusions
2
OUTLINE OF THE PRESENTATION

1. Strategic Approach
• Reducing Carbon Use Step by Step
• Specific Needs by Country
• CCS Energy Penalty Reduction

STRATEGIC APPROACH
! Promote Demand Side Management on the customers’ side and
! Reduce carbon use intensity in generation:
" 1st step: reduce share of carbon based generation in energy mix
" 2nd step: maximize energy output per quantity of carbon used
" 3rd step: enhance energy efficiency.
! Then next steps; towards CCS:
" Prove, develop and apply post-combustion technologies
" Develop oxycombustion
" Watch on other technologies in order to prepare the future
! In parallel contribute to develop CO2 transport and storage
REDUCING CARBON USE STEP BY STEP
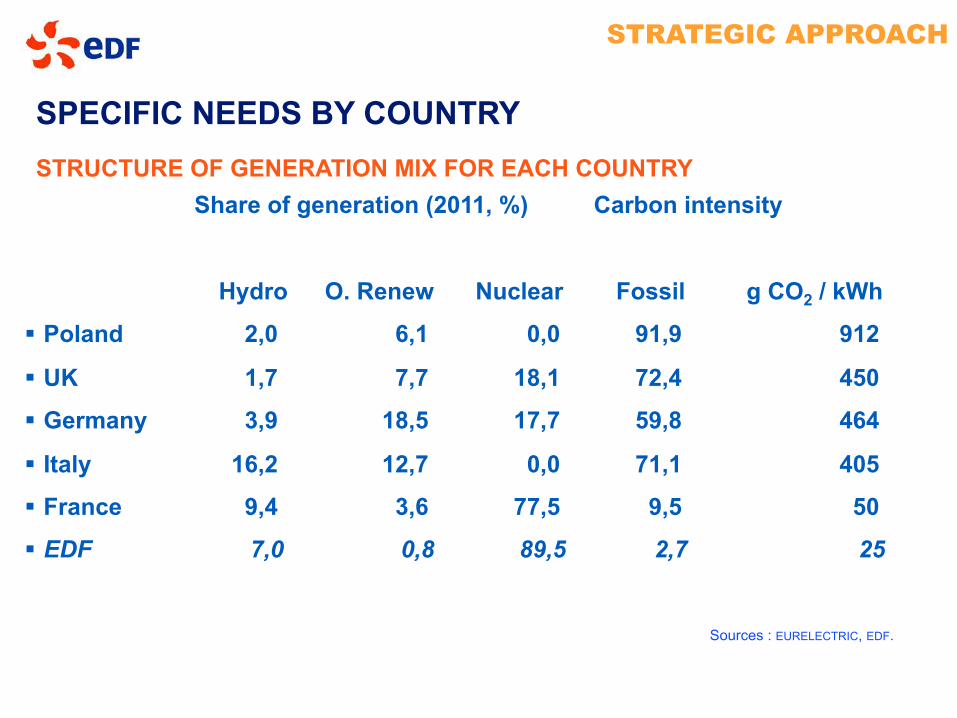
Share of generation (2011, %) Carbon intensity
Hydro O. Renew Nuclear Fossil g CO2 / kWh
# Poland 2,0 6,1 0,0 91,9 912
# UK 1,7 7,7 18,1 72,4 450
# Germany 3,9 18,5 17,7 59,8 464
# Italy 16,2 12,7 0,0 71,1 405
# France 9,4 3,6 77,5 9,5 50
# EDF 7,0 0,8 89,5 2,7 25
Sources : EURELECTRIC, EDF.
STRUCTURE OF GENERATION MIX FOR EACH COUNTRY
SPECIFIC NEEDS BY COUNTRY
STRATEGIC APPROACH
STRATEGIC APPROACH
! 10 to 15 efficiency points loss for CO2 capture not sustainable:
" would lead to a 20 to 30 % increase in coal consumption
! Doubling the investment cost per MW not economically sustainable:
" would jeopardize competitivity
! Therefore:
Energy Penalty Reduction and
Investment Overcosts Reduction
are our main priorities for post-combustion CO2 capture
… after proving the faisability of the technical routes …
… in order to keep some competitivity …
CCS ENERGY PENALTY REDUCTION

2. Le Havre CCS Pilot
• The Capture Pilot Plant Project at EDF’S Le Havre
• Le Havre Power Plant
• Features of Le Havre Capture Pilot Plant (1/2)
• Features of Le Havre Capture Pilot Plant (2/2)
• AAP @ Le Havre: Main Objectives
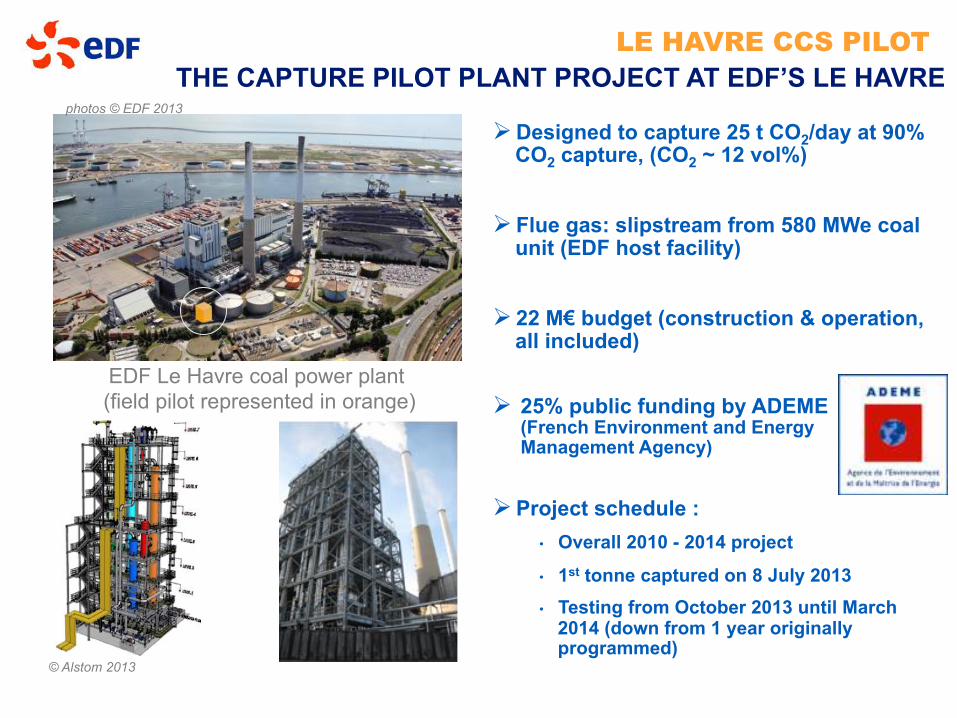
! Designed to capture 25 t CO2/day at 90% CO2 capture, (CO2 ~ 12 vol%)
! Flue gas: slipstream from 580 MWe coal unit (EDF host facility)
! 22 M€ budget (construction & operation, all included)
! 25% public funding by ADEME (French Environment and Energy Management Agency)
! Project schedule : • Overall 2010 - 2014 project
• 1st tonne captured on 8 July 2013 • Testing from October 2013 until March
2014 (down from 1 year originally programmed)
EDF Le Havre coal power plant (field pilot represented in orange)
THE CAPTURE PILOT PLANT PROJECT AT EDF’S LE HAVRE
© Alstom 2013
photos © EDF 2013
LE HAVRE CCS PILOT
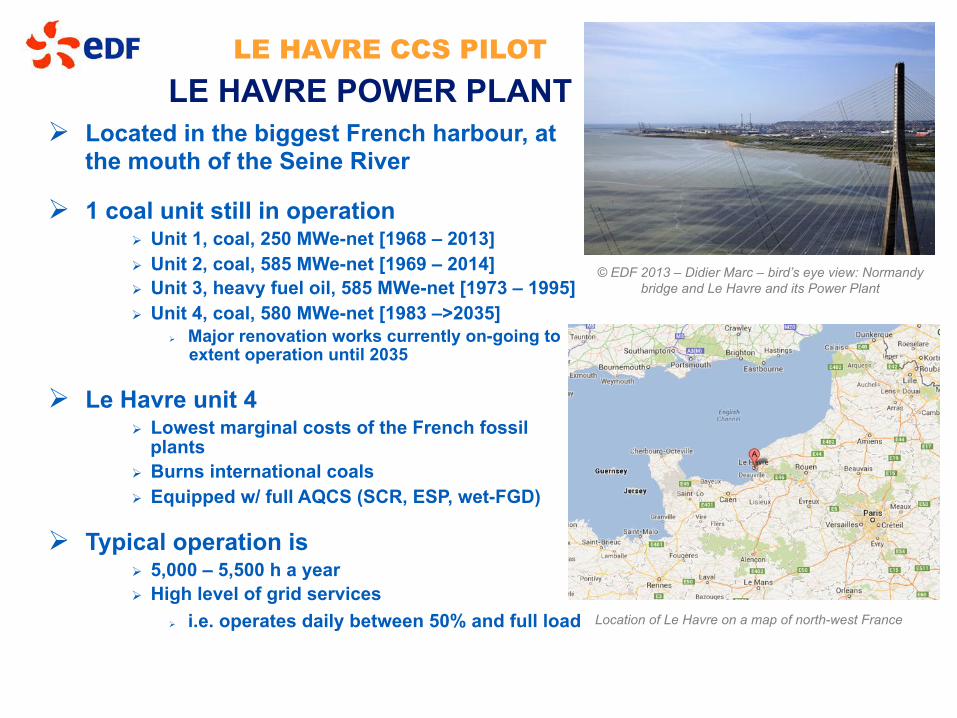
! Located in the biggest French harbour, at the mouth of the Seine River
! 1 coal unit still in operation ! Unit 1, coal, 250 MWe-net [1968 – 2013] ! Unit 2, coal, 585 MWe-net [1969 – 2014] ! Unit 3, heavy fuel oil, 585 MWe-net [1973 – 1995] ! Unit 4, coal, 580 MWe-net [1983 –>2035]
! Major renovation works currently on-going to extent operation until 2035
! Le Havre unit 4 ! Lowest marginal costs of the French fossil
plants ! Burns international coals ! Equipped w/ full AQCS (SCR, ESP, wet-FGD)
! Typical operation is ! 5,000 – 5,500 h a year ! High level of grid services
! i.e. operates daily between 50% and full load
LE HAVRE POWER PLANT
Location of Le Havre on a map of north-west France
© EDF 2013 – Didier Marc – bird’s eye view: Normandy bridge and Le Havre and its Power Plant
LE HAVRE CCS PILOT

FEATURES OF LE HAVRE CAPTURE PILOT PLANT (1/2)
! Advanced Flow Scheme (= latest generation of AAP scheme) is implemented at Le Havre
• Improved absorber design
• Advanced regeneration concept • High efficiency heat exchanger network • Additionally: O2 stripper
© Alstom 2014
Maximize CO 2 loading High efficiency
heat exchanger network
Advanced regeneration concept to minimize energy
consumption
LE HAVRE CCS PILOT
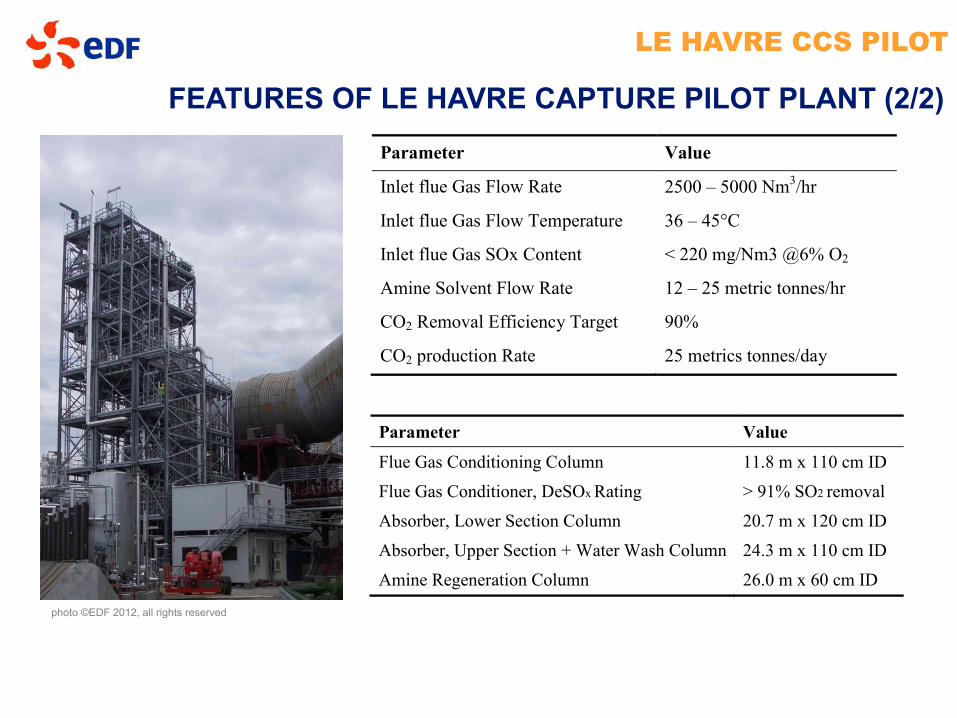
FEATURES OF LE HAVRE CAPTURE PILOT PLANT (2/2)
photo ©EDF 2012, all rights reserved
Parameter Value
Flue Gas Conditioning Column 11.8 m x 110 cm ID
Flue Gas Conditioner, DeSOx Rating > 91% SO2 removal
Absorber, Lower Section Column 20.7 m x 120 cm ID
Absorber, Upper Section + Water Wash Column 24.3 m x 110 cm ID
Amine Regeneration Column 26.0 m x 60 cm ID
Parameter Value
Inlet flue Gas Flow Rate 2500 – 5000 Nm3/hr
Inlet flue Gas Flow Temperature 36 – 45°C
Inlet flue Gas SOx Content < 220 mg/Nm3 @6% O2
Amine Solvent Flow Rate 12 – 25 metric tonnes/hr
CO2 Removal Efficiency Target 90%
CO2 production Rate 25 metrics tonnes/day
LE HAVRE CCS PILOT

AAP @ LE HAVRE: MAIN OBJECTIVES
! Evaluate key process issues: • CO2 capture efficiency & thermal performance • Solvent management
! Environmental study • Emissions to atmosphere • Liquid waste
! Oxygen stripping impact on solvent degradation & performance
! Corrosion resistance of steel and non-metallic materials
! Reliable operation during transient modes, i.e. load variations, start-ups & shut-downs
Test Programme Aim
More Interests of the Power Producer ! Aware buyer of the technology ! Develop O&M skills and knowledge ! Arise awareness on capture part of CCS
photo ©EDF 2012, all rights reserved
LE HAVRE CCS PILOT

3. Main Results and Lessons Learned
• 1,900 Tonnes of CO2 Captured
• Energy Performance
• Solvent Management
• Emissions
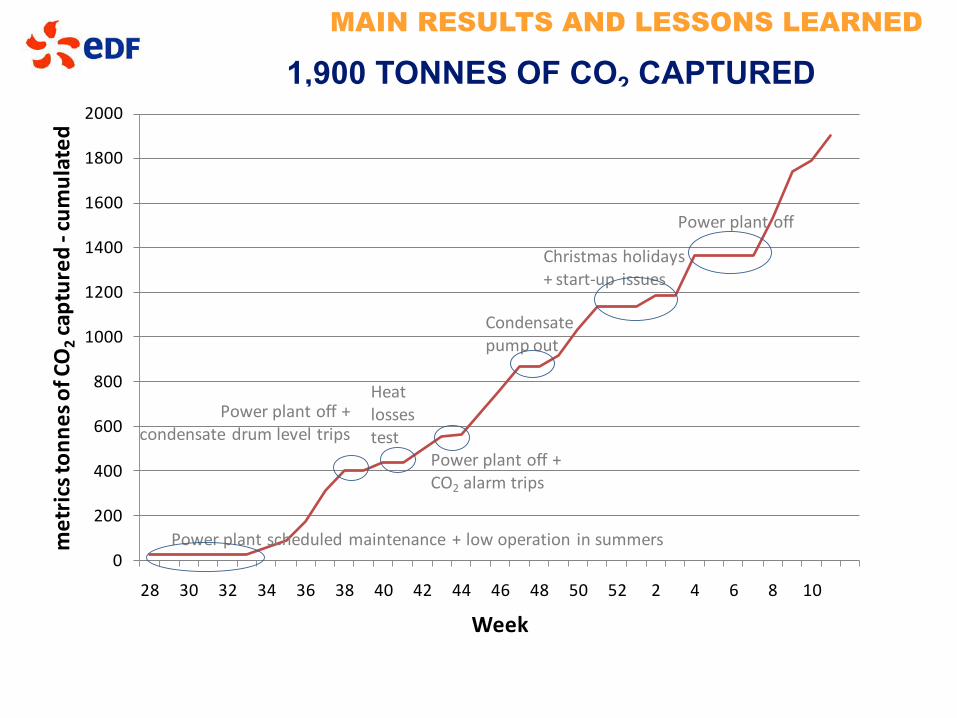
1,900 TONNES OF CO2 CAPTURED
0
200
400
600
800
1000
1200
1400
1600
1800
2000
28 30 32 34 36 38 40 42 44 46 48 50 52 2 4 6 8 10
metric
s(ton
nes(o
f(CO
2captured
(3cum
ulated
Week
Power.plant.off
Christmas holidays+.start=up. issues
Condensatepump.out
Power.plant.off.+CO2 alarm trips
Heatlossestest
Power.plant.off.+condensate.drum.level.trips
Power.plant.scheduled.maintenance.+.low.operation. in.summers
MAIN RESULTS AND LESSONS LEARNED

! A thermal performance of 2.3 – 2.4 GJ/t CO2 at 90% capture rate was demonstrated consistently
• These values were obtained in slightly different process conditions than the design case (namely Liquid/Gas ratio)
• Results indicate that there is a potential for further slight energy improvement with minor modifications to the existing equipment
Conventional*Baseline*
(Charleston*PP)Improved*Scheme*(Charleston*PP)Advanced*Flow*
Scheme*(Le*Havre*Pilot*Plant)
MEA*? Conv.*Process
MEA*? Improved*Process
1
2
3
4
Rebo
iler(d
uty((GJ/tCO
2(
13%*reduction
21%*reduction
Energy penalty (retrofit of supercritical PC PP
w/ simple integration)
~12 pts-%
<9 pts-% expected
Adapted from Alstom
ALSTOM Advanced Flow Scheme has significantly lower
energy demand than Conventional Flow
Scheme
ENERGY PERFORMANCE
MAIN RESULTS AND LESSONS LEARNED

! No additives were added (save a small quantity of anti-foam UCARSOLTM GT10)
! Max. reboiler outlet solvent T° kept slightly below 130°C for most of the campaign
! Within these conditions, UCARSOLTM FCG 3000 shows good stability behaviour
• An amine loss around 0.23 – 0.3 kg/tonne of CO2 was reported (emission
+ degradation): the degradation rate and rate of by-product build-up is comparable to published pilot plant degradation studies on MEA.
SOLVENT MANAGEMENT
MAIN RESULTS AND LESSONS LEARNED

EMISSIONS ! Amines emissions were low (a few ppmv).
• Consistent w/ Charleston Pilot Plant results (below 2 ppmv) • In line w/ what is expected given the volatility of the solvent
! However, somewhat higher amines emissions were randomly, but regularly, observed with peaks infrequently higher than 50 ppmv
• Could be linked to aerosol emission ! Amines and ammonia emissions sampled and reported throughout the test
period
Note : ALSTOM has now updated the design of the emissions control system to mitigate unexpected peaks in emissions
0
10
20
30
40
50
60
70
Emission
s'(p
pmv Total.amine
NH3
! Ammonia emissions were even lower (< 2 ppmv)
! The semi-quantitative FTIR measurement were in good agreement with Dow measurements (gas impingers samples + laboratory analysis) both for amines and ammonia.
MAIN RESULTS AND LESSONS LEARNED

! Relationship with the authorities: • Transparency and responsiveness are crucial;
Meetings were organized regularly and monthly reports were issued. • We were able to answer satisfactorily to the administration concerns.
! Capture process operation: • Operators’ learning curve needs to be considered in test planing • The plant was designed for a multitude of operating conditions, posing challenges to
operators and equipment
! Data quality and instrumentation verification: • Processes this size are build as any ‘industrial plant’ (but more instrumented). Plant
instrumentation measurement chains must undergo a specific qualification to ensure the desired level of accuracy for R&D purposes. It is time- and manpower-consuming
• Specific effort was dedicated to detailed liquid solvent and emission analysis due to (i) the stakes and (ii) the necessary skills and procedures to reach proper results:
- Emissions sampling were thoroughly prepared - Solvent/emission sampling & analysing requires know-how (ensured by DOW, EPRI,
SINTEF and other labs) - FTIR continuous measurement is an added value
MAIN RESULTS AND LESSONS LEARNED
LESSONS LEARNED SO FAR

4. Conclusions
• Wrap-up
• EDF’s Vision

CONCLUSIONS
! ALSTOM’s AAP Advanced Flow Scheme, was implemented and successfully demonstrated at EDF’s Le Havre, also thanks to ADEME’s funding.
! 1,900 metric tonnes of CO2 were captured between July 2013 and March 2014 at EDF’s demonstration facility (designed to capture 25 tonnes/day).
! Many tests data is still to be reviewed, but preliminary results are:
• Thermal performance of 2.3-2.4 GJ/t CO2 at 90% capture rate consistently demonstrated.
• Good thermal and chemical stability of the solvent, • Consistently low ammonia emissions (< 2 ppmv) • Low gaseous amine emissions (a few ppmv), but a few emissions peaks.
! In terms of operation: • On-site workforce sized to operate 24/7 (to maximize the amount of tests
during time available) • Measurements and data quality was a continuous improvement process. • We were able to answer satisfactorily to the French administration questions
and concerns.
WRAP-UP

CONCLUSIONS
! Climate change identified within EDF as a major issue since 1990, with significant results achieved so far;
! EDF’s Energy mix significantly de-carbonized (25 g CO2 / kWh in France,120 g CO2 / kWh worldwide in 2011),
! CCS acknowledged as one of the potential technologies to curb further CO2 emissions,
! Capture side: • valuable experience gained at Le Havre, but developments still needed, • need for proving the technologies at industrial scale, • reducing costs & energy penalty, while • keeping enough manoeuvrability.
! Transport & storage side: • present technical bottlenecks in Europe? • urgent need for gaining public support and acceptance.
EDF’S VISION
Thank you


