
1
Results – DQ ’09
29th Jan 2010
Investor Presentation
DQ'09 Results - 29th Jan‘10
Safe Harbour Statement
This�Release�/�Communication,�except�for�the�historical� information,�may�contain�statements,�
including�the�words�or�phrases�such�as�‘expects,�anticipates,� intends,�will,�would,�undertakes,�
aims,� estimates,� contemplates,� seeks� to,� objective,� goal,� projects,� should’ and� similar�
expressions� or� variations� of� these� expressions� or� negatives� of� these� terms� indicating� future�
performance�or� results,� financial�or�otherwise,�which�are� forward� looking�statements.� �These�
forward� looking� statements� are� based� on� certain� expectations,� assumptions,� anticipated�
developments� and� other� factors� which� are� not� limited� to,� risk� and� uncertainties� regarding�
fluctuations� in�earnings,�market�growth,� intense� competition�and the�pricing�environment� in�
the�market,�consumption�level,�ability�to�maintain�and�manage�key�customer�relationship�and�
supply� chain� sources� and� � those� factors� which� may� affect� our� ability� to� implement� business�
strategies�successfully,�namely�changes�in�regulatory�environments,�political�instability,�change�
in� international� oil� prices�and� input� costs� and� new� or� changed� priorities� of� the� trade.� � � The�
Company,�therefore,�cannot�guarantee�that�the�forward�looking�statements�made�herein�shall�
be� realized.� The�Company,�based�on�changes�as� stated�above,�may�alter,�amend,�modify�or�
make� necessary� corrective� changes� in� any� manner� to� any� such� forward� looking� statement�
contained�herein�or�make�written�or�oral�forward�looking�statements�as�may�be�required�from�
time�to�time�on�the�basis�of�subsequent�developments�and�events. The�Company�does�not�
undertake�any�obligation�to�update�forward�looking�statements�that�may�be�made�from�time�
to�time�by�or�on�behalf�of�the�Company�to�reflect�the�events�or�circumstances�after�the�date�
hereof.

2
DQ'09 Results - 29th Jan‘10
Agenda
• Market Context
• DQ’09 Highlights
• Category Overview
• Financial Results
• Looking Ahead
DQ'09 Results - 29th Jan‘10
Market Context : DQ'09
• FMCG market continues to grow, albeit at a slower pace
• Lower pricing component due to Laundry price reductions
• Downtrading in Laundry and Tea
• High food inflation
• Commodity costs firming up
• Intensifying competitive environment
• Step up in media spends across categories
• Several new brand and category entries

3
DQ'09 Results - 29th Jan‘10
Performance highlights
• Volume growth accelerates through the year to 5%
• Sales growth 5%;
• Soaps shares stabilise – 10 bps increase
• Volumes shares grow in Laundry – 100 bps in powders and 60 bps
in Bars
• Personal Products growth momentum sustained through the year
• Underlying operating margins* up 10 bps despite high brand
investments
*Excluding MTM impact
DQ'09 Results - 29th Jan‘10
Results Summary : DQ'09
• Domestic consumer* business grows 5.2%; Net sales grow 4.6%
• FMCG growth 4.6%
- Driven entirely by accelerating volume growth of 4.6%
• Soaps & Detergents returns to volume growth
- price reduction impacts turnover growth
• Strong growth momentum continues in Personal Products
• Foods continues to grow well
• Underlying PBIT** margins up 10 bps; grows by 5.4%
• Brand investments stepped up by 530 bps to 14.1% of sales
• PAT (bei) lower; excluding MTM charge PAT (bei) flat
• Net Profit grows 5.4%
* Domestic Consumer includes FMCG and Water ** Excluding MTM impact
4
DQ'09 Results - 29th Jan‘10
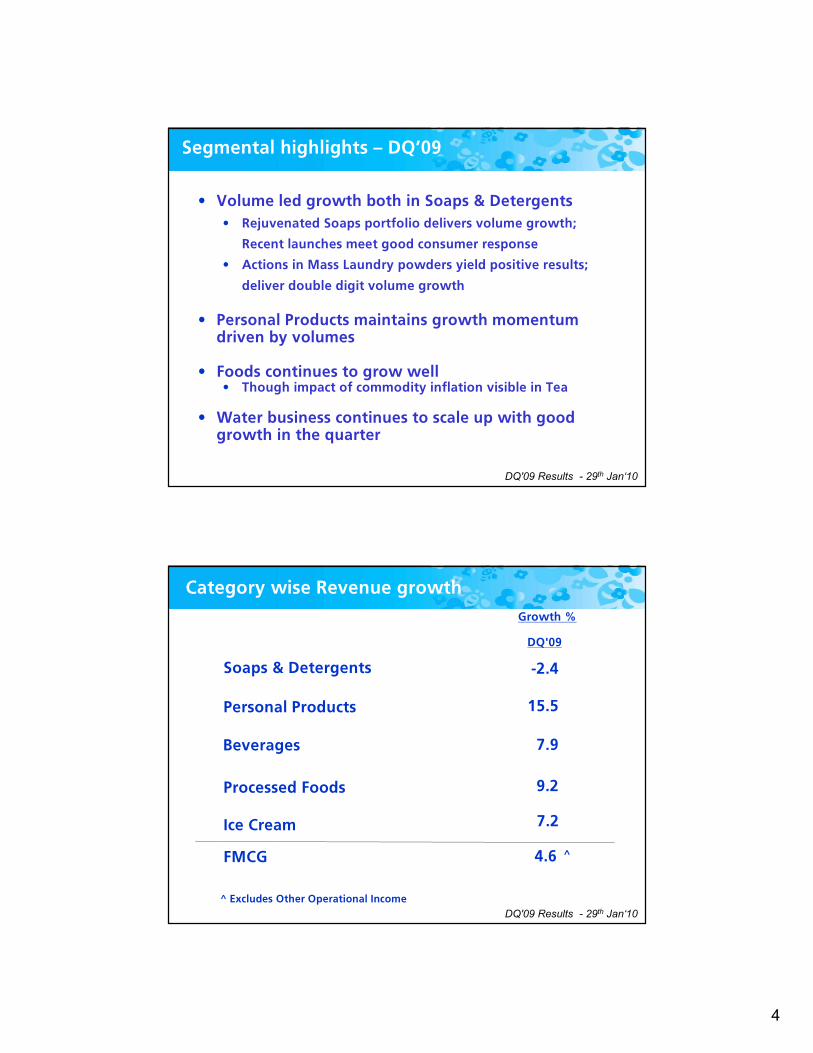
Segmental highlights – DQ’09
• Volume led growth both in Soaps & Detergents
• Rejuvenated Soaps portfolio delivers volume growth;
Recent launches meet good consumer response
• Actions in Mass Laundry powders yield positive results;
deliver double digit volume growth
• Personal Products maintains growth momentum driven by volumes
• Foods continues to grow well • Though impact of commodity inflation visible in Tea
• Water business continues to scale up with good growth in the quarter
DQ'09 Results - 29th Jan‘10
Growth %
Soaps & Detergents
Personal Products
Ice Cream
Processed Foods
Beverages
-2.4
15.5
7.9
7.2
9.2
FMCG 4.6
Category wise Revenue growth
DQ'09
^
^ Excludes Other Operational Income
5
DQ'09 Results - 29th Jan‘10
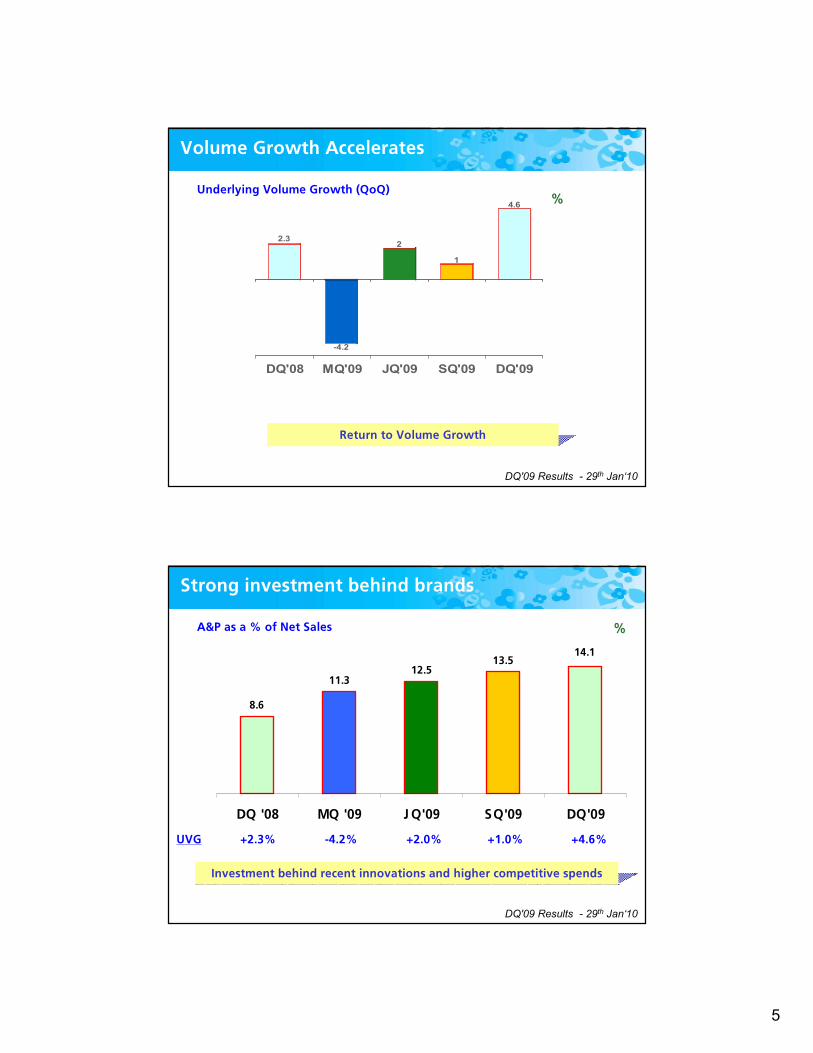
Volume Growth Accelerates
Return to Volume Growth
2.3
-4.2
2
1
4.6
DQ'08 MQ'09 JQ'09 SQ'09 DQ'09
%%Underlying Volume Growth (QoQ)
DQ'09 Results - 29th Jan‘10
8.6
11.312.5
13.514.1
DQ '08 MQ '09 JQ'09 SQ'09 DQ'09
Strong investment behind brands
%%A&P as a % of Net Sales
Investment behind recent innovations and higher competitive spends
UVG +2.3% -4.2% +2.0% +1.0% +4.6%
6
DQ'09 Results - 29th Jan‘10
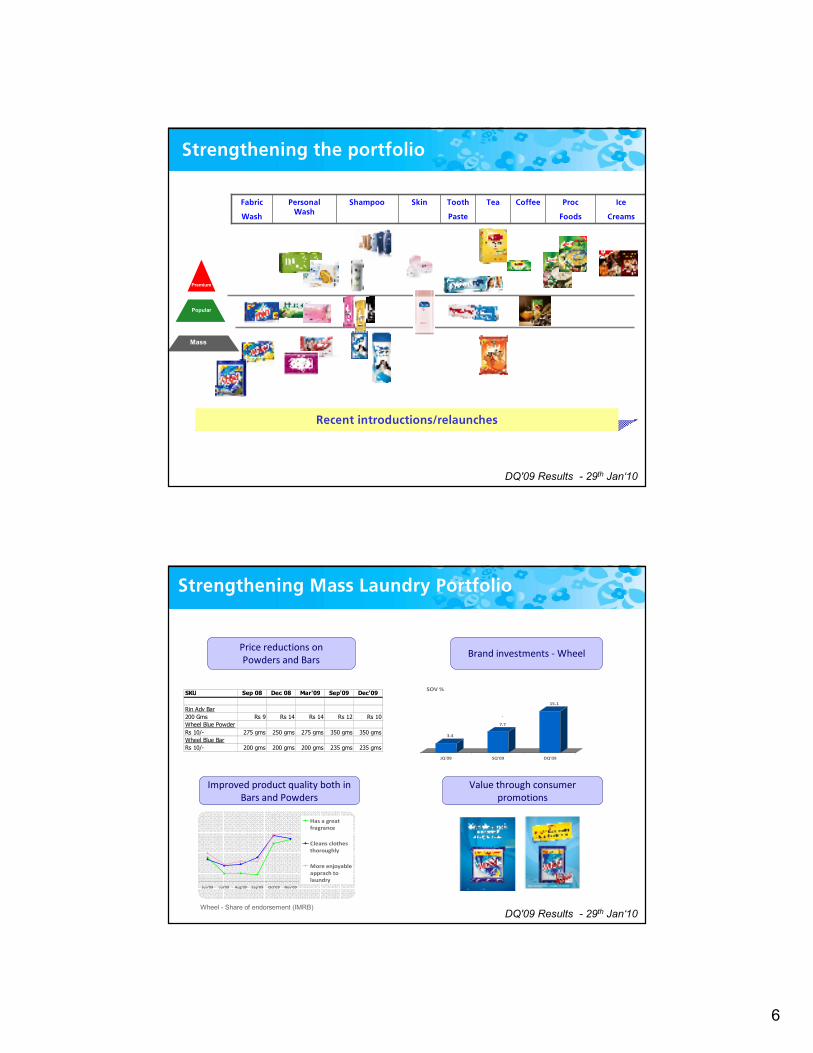
Strengthening the portfolio
Premium
Popular
Mass
Proc
Foods
Coffee Ice
Creams
TeaTooth
Paste
SkinShampooPersonal Wash
Fabric
Wash
Recent introductions/relaunches
DQ'09 Results - 29th Jan‘10
Strengthening Mass Laundry Portfolio
3.4
7.7
15.1
JQ'09 SQ'09 DQ'09
SOV %
`
Price reductions on
Powders and BarsBrand investments - Wheel
Improved product quality both in
Bars and Powders
Jun'09 Jul'09 Aug'09 Sep'09 Oct'09 Nov'09
Has a great
fragrance
Cleans clothes
thoroughly
More enjoyable
apprach to
laundry
SKU Sep 08 Dec 08 Mar'09 Sep'09 Dec'09
Rin Adv Bar
200 Gms Rs 9 Rs 14 Rs 14 Rs 12 Rs 10
Wheel Blue Powder
Rs 10/- 275 gms 250 gms 275 gms 350 gms 350 gms
Wheel Blue Bar
Rs 10/- 200 gms 200 gms 200 gms 235 gms 235 gms
Value through consumer
promotions
Wheel - Share of endorsement (IMRB)

7
DQ'09 Results - 29th Jan‘10
• Sequential volume share improves
+100 bps Powder; +60 bps Bars
• Strong volume growth in powder; Bar portfolio strengthened
• Interventions in Wheel Powders meet good response
• Results visible in Wheel market share gains
• Household Care growth led by Vim Bars
• Vim Dish Wash Liquid maintains rapid growth
• Cif launch progressing well
• Good sequential performance
Home Care category highlights
DQ'08 Value Share SQ'09 DQ'09
38.7 Laundry 35.0 34.6
Market Shares Source: AC Nielsen. Panel change in April’09
DQ'09 Results - 29th Jan‘10
• Successful portfolio rejuvenation in Soaps; returns to
volume growth
• Premium portfolio continues strong growth momentum
• Successful Lux re-launch leads category volume growth
• Further actions to strengthen Lifebuoy continue
• Market shares stable
Soaps category highlights
DQ'08 Value Share SQ'09 DQ'09
49.6 Soaps 44.5 44.6
Market Shares Source: AC Nielsen. Panel change in April’09

8
DQ'09 Results - 29th Jan‘10
• Strong volume led growth in Face Care driven by FAL and Pond’s
• Pond’s White Beauty leads strong growth in premium skin lightening segment
• FAL grows well with successful launch of Winter Fairness Cream
• In Hand and Body care; both Vaseline and Pond’s Talc grow well
• Vaseline winter range grows in strong double digits
• Talc returns to strong volume and value growth
Skin Care category highlights
Market Shares Source: AC Nielsen. Panel change in Nov’09
DQ'08 Value Share SQ'09 DQ'09
51.1 Face Care (MAT) 50.1 46.7
57.5 H&B Care (MAT) 56.9 56.5
DQ'09 Results - 29th Jan‘10
• Hair continues to grow well driven by strong
volumes
–Dove and Clinic Plus grow strongly with
innovations; Dove is No 1 brand in Modern Trade
–Sunsilk re-launched in Nov’09; maintains growth momentum
– Further actions to strengthen Clinic All Clear underway
–Consistent progress in building hair
conditioners market
• Oral Care portfolio being strengthened
– Positive consumer response on Pepsodent ‘Germicheck’ credentials
– Launch of Close Up Peppermint Splash
Hair and Oral category highlights
DQ'08 Value Share SQ'09 DQ'09
45.0 Shampoo + Cond. 45.2 44.8
DQ'08 Value Share SQ'09 DQ'09
28.7 Toothpaste 27.1 26.1
Market Shares Source: AC Nielsen. Panel change in April’09
9
DQ'09 Results - 29th Jan‘10
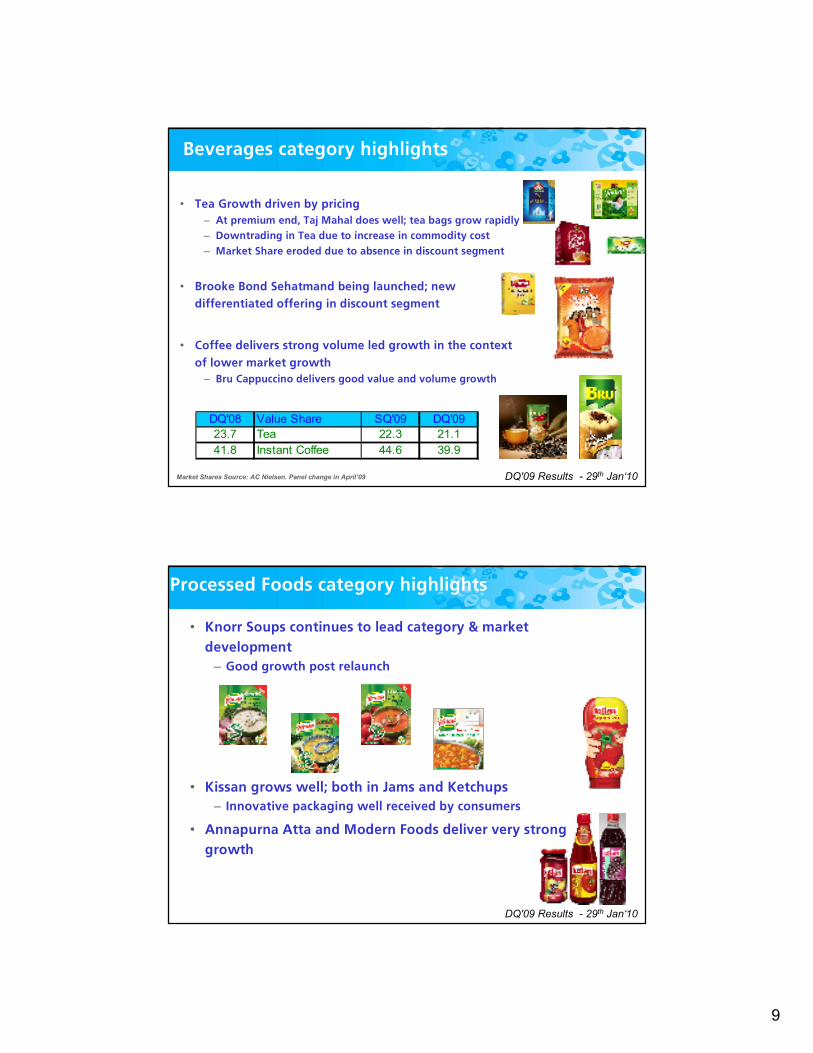
Beverages category highlights
• Tea Growth driven by pricing
– At premium end, Taj Mahal does well; tea bags grow rapidly
– Downtrading in Tea due to increase in commodity cost
– Market Share eroded due to absence in discount segment
• Brooke Bond Sehatmand being launched; new
differentiated offering in discount segment
• Coffee delivers strong volume led growth in the context
of lower market growth
– Bru Cappuccino delivers good value and volume growth
DQ'08 Value Share SQ'09 DQ'09
23.7 Tea 22.3 21.1
41.8 Instant Coffee 44.6 39.9
Market Shares Source: AC Nielsen. Panel change in April’09
DQ'09 Results - 29th Jan‘10
Processed Foods category highlights
• Knorr Soups continues to lead category & market
development
– Good growth post relaunch
• Kissan grows well; both in Jams and Ketchups
– Innovative packaging well received by consumers
• Annapurna Atta and Modern Foods deliver very strong
growth

10
DQ'09 Results - 29th Jan‘10
Ice Cream category highlights
• Category gains momentum
– Impulse and Take Home lead growth
– Launch of Litchi Zap
• 85 Swirl’s parlours now in
operation; positive consumer
response
DQ'09 Results - 29th Jan‘10
Water Purifier – Business Update
• Pure-it continues to grow strongly through new
channels & innovations
– Extension of reach through retail channel – 14500 outlets
– New innovations broaden portfolio
· Pure-it Autofill launched
• Increased representation in mass segment
– Pure-it Compact launched at Rs 1,000/- price point
• Product superiority unchallenged
– ‘Rs 1 Crore’ campaign remains unclaimed

11
DQ'09 Results - 29th Jan‘10
Superior cost management through buying efficiencies
COGS down -480 bps
Indexed�Chart�– market�prices�(Source:�Bloomberg,�Tea�auction�house).�HUL�buying�cost�may�be�different
CPO
Jan-07 Jul-07 Jan-08 Jul-08 Jan-09 Jul-09 Jan-10
Benzene
Jan-07 Jul-07 Jan-08 Jul-08 Jan-09 Jul-09 Jan-10
Tea
MQ'08
JQ'08
SQ'08
DQ'08
MQ'09
JQ'09
SQ'09
DQ'09
Levers
-Buying Efficiency
-CEPs
-Operating leverage
DQ'09 Results - 29th Jan‘10
December Quarter‘09 financial highlights
• Underlying PBIT** margins up 10 bps
• Operating profit growth @ 5.4%
• Reported PBIT margins lower by 30 bps due to MTM impact
• Benefit of improved portfolio mix and cost efficiencies
• COGS down 480 bps
• Increased brand investment
• PAT bei lower -2.1%; excluding MTM charge PAT bei flat
• Net Profit grows 5.4%
** Excluding MTM impact

12
DQ'09 Results - 29th Jan‘10
Results: DQ’09
Rs Crores DQ'09 DQ'08 Growth%
Net Sales 4504 4308 4.6
EBITDA 788 764 3.1
PBIT 742 723 2.6
PBIT margin (%age) 16.5 16.8 -
Underlying PBIT 757 718 5.4
Underlying PBIT margin(%age) 16.8 16.7
Exceptional Items 44.5 (38.5) -
PBT bei 781 753 3.8
PBT 826 714 15.6
PAT bei 599 612 (2.1)
Net Profit 649 616 5.4
DQ'09 Results - 29th Jan‘10
Results: Exceptional Items
Particulars DQ'09 DQ'08
Assets Sale 52 9
Restructuring Costs (7) (47)
Total 44 (38)
Rs Cr

13
DQ'09 Results - 29th Jan‘10
Analysis of Net Profit –DQ’09
Rs Crores DQ'09 DQ'08 Growth%
Net Profit 649 616 5.4
Less: Exceptional/Extraordinary Items (Net of Tax) 50 3
Profit After Tax bei 599 612 (2.1)
Less: Foreign Exchange (MTM) Impact (Net of Tax)* (10) 3
Profit after Tax before Excep./ Extraordinary items
and MTM609 609 0.1
* Losses in negative, Gains in positive
Forex MTM relates to accounting impact arising from restatement of forexexposures at closing exchange rates; all forex exposures continue to be fully hedged
DQ'09 Results - 29th Jan‘10
In Summary
• FMCG market continues to grow, albeit at slower pace
• Key interventions and actions to improve portfolio competitiveness
showing results
• Acceleration in volume growth delivery through the year to 5% in DQ
• Soap value shares stable; sequentially 10 bps up
• Laundry volume shares improve; value shares impacted by downtrading
• Step up in brand investments to strengthen market leadership
• Personal Products and Water maintain growth momentum; Foods
grow well
• Underlying Operating margins up 10bps despite 530 bps increase in
brand investment
• Improved gross margin delivery re-invested behind brands
14
DQ'09 Results - 29th Jan‘10
Looking Ahead
• FMCG market growth to sustain
• Short term impact of food inflation
• Overall growth opportunity remains strong
• Competitive environment intensifies significantly
• Especially in Laundry, Hair & Skin
• Reflected in increased media spends
• Several new entries in emerging segments
• Our focus is to
• Deploy our full portfolio to strengthen market leadership
• Invest behind our brands competitively to gain share
• Improve execution and speed to market
• Competitive growth is the No 1 priority across our business
DQ'09 Results - 29th Jan‘10
Thank you
For more information, please visit For more information, please visit http://http://www.hul.co.inwww.hul.co.in

15
Results – DQ ’09
29th Jan 2010
Investor Presentation


