
1
Restaurant Quarterly UpdateW i n t e r 2 0 2 0
2
Duff & Phelps
Restaurant Quarterly Update | Winter 2020
Market Update K E Y
I N F O R M A T I O N
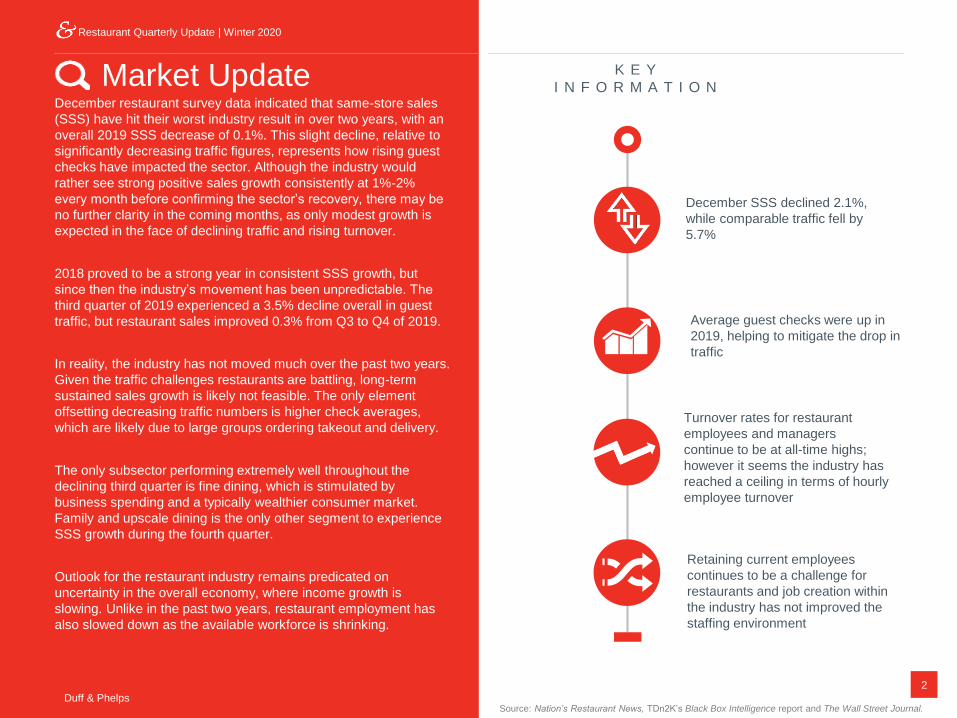
Turnover rates for restaurant
employees and managers
continue to be at all-time highs;
however it seems the industry has
reached a ceiling in terms of hourly
employee turnover
December SSS declined 2.1%,
while comparable traffic fell by
5.7%
Average guest checks were up in
2019, helping to mitigate the drop in
traffic
Retaining current employees
continues to be a challenge for
restaurants and job creation within
the industry has not improved the
staffing environment
December restaurant survey data indicated that same-store sales
(SSS) have hit their worst industry result in over two years, with an
overall 2019 SSS decrease of 0.1%. This slight decline, relative to
significantly decreasing traffic figures, represents how rising guest
checks have impacted the sector. Although the industry would
rather see strong positive sales growth consistently at 1%-2%
every month before confirming the sector’s recovery, there may be
no further clarity in the coming months, as only modest growth is
expected in the face of declining traffic and rising turnover.
2018 proved to be a strong year in consistent SSS growth, but
since then the industry’s movement has been unpredictable. The
third quarter of 2019 experienced a 3.5% decline overall in guest
traffic, but restaurant sales improved 0.3% from Q3 to Q4 of 2019.
In reality, the industry has not moved much over the past two years.
Given the traffic challenges restaurants are battling, long-term
sustained sales growth is likely not feasible. The only element
offsetting decreasing traffic numbers is higher check averages,
which are likely due to large groups ordering takeout and delivery.
The only subsector performing extremely well throughout the
declining third quarter is fine dining, which is stimulated by
business spending and a typically wealthier consumer market.
Family and upscale dining is the only other segment to experience
SSS growth during the fourth quarter.
Outlook for the restaurant industry remains predicated on
uncertainty in the overall economy, where income growth is
slowing. Unlike in the past two years, restaurant employment has
also slowed down as the available workforce is shrinking.
Restaurant Quarterly Update | Winter 2020
Duff & PhelpsSource: Nation’s Restaurant News, TDn2K’s Black Box Intelligence report and The Wall Street Journal.

Duff & Phelps
3
Restaurant Quarterly Update | Winter 2020
Restaurant Sector Monthly SSS and Traffic Growth
Source: Nation’s Restaurant News and TDn2K’s Black Box Intelligence report.
0.3%
(0.3%)
(0.8%)
0.8%
1.5%
0.0%
1.1%
0.5%
1.8%
1.2% 0.8%
1.1%
2.0% 2.0%
(0.6%)
1.2%
(0.4%)
1.1%
(0.0%)
(1.0%)(0.7%)
0.1% 0.1%
1.6%
(2.1%)
(1.8%)
(3.0%) (3.1%)
(2.1%)
(1.4%)
(2.9%)
(1.7%) (1.8%)
(0.8%)
(1.4%)
(2.2%)(1.8%)
(0.9%) (0.7%)
(3.7%)
(1.8%)
(3.5%)
(2.1%)
(3.1%)
(4.0%) (3.9%)
(3.0%) (3.1%)
(0.9%)
(5.7%)
(7.0%)
(6.0%)
(5.0%)
(4.0%)
(3.0%)
(2.0%)
(1.0%)
0.0%
1.0%
2.0%
3.0%
Dec.2017
Jan.2018
Feb.2018
Mar.2018
Apr.2018
May.2018
Jun.2018
Jul.2018
Aug.2018
Sep.2018
Oct.2018
Nov.2018
Dec.2018
Jan.2019
Feb.2019
Mar.2019
Apr.2019
May.2019
Jun.2019
Jul.2019
Aug.2019
Sep.2019
Oct.2019
Nov.2019
Dec.2019
Same-Store Sales Traffic

Duff & Phelps
4
Restaurant Quarterly Update | Winter 2020
Quarterly SSS Performance–Last Three Years1
1. SSS represents the change in year-over-year sales for restaurants that have been open for at least 18 months.
Represents most actively traded public restaurant companies.
2. Source: SEC filings, S&P Global Market Intelligence, Mergermarket, company press releases
and various news sources (e.g., The New York Times DealBook, The Deal, The Wall Street Journal).
2017 2018 2019
Q4 Q1 Q2 Q3 Q4 Q1 Q2 Q3
Mass Casual
Cracker Barrel Old Country Store Inc. 0.2% 1.1% 1.5% (0.4%) 3.8% 1.3% 3.8% 2.1%
Brinker International Inc.
Chili’s Grill & Bar (2.2%) (0.4%) 0.6% 1.9% 2.9% 2.1% 2.2% 2.9%
Maggiano’s Little Italy 0.5% 0.5% 0.3% 0.0% 1.8% 0.4% 0.6% (1.8%)
Bloomin’ Brands Inc.
Bonefish Grill (4.3%) (0.1%) 1.5% 1.8% (1.1%) 1.9% 0.1% (2.2%)
Carrabba’s Italian Grill (2.8%) 0.9% (0.6%) (0.6%) 0.8% 0.3% (1.6%) 0.1%
Fleming’s Prime Steakhouse & Wine Bar (1.0%) 2.9% 0.3% 0.5% (0.4%) 0.6% 1.6% 0.4%
Outback Steakhouse 0.6% 4.3% 4.0% 4.6% 2.9% 3.5% 1.3% 0.2%
DineEquity Inc.
Applebee’s 1.3% 3.3% 5.7% 7.7% 3.5% 1.8% (0.5%) (1.6%)
IHOP (0.4%) 1.0% 0.7% 1.2% 3.0% 1.2% 2.0% 0.0%
Denny’s Corporation 2.5% 1.5% (0.7%) 1.0% 1.4% 1.3% 3.8% 1.1%
Red Robin Gourmet Burgers Inc. (0.1%) (0.9%) (2.6%) (3.4%) (4.5%) (3.3%) (1.5%) 1.6%
Biglari Holdings Inc. (2.2%) (1.7%) (3.4%) (6.9%) (5.1%) (7.9%) (5.9%) (6.5%)
Luby’s Inc. (5.1%) 0.8% (0.9%) (0.5%) (5.5%) (3.3%) (4.0%) (3.7%)
Famous Dave’s of America Inc. 1.8% (0.9%) (1.6%) (1.4%) 2.1% (1.1%) (0.7%) 0.4%
Median (0.3%) 0.9% 0.3% 0.3% 1.6% 0.9% 0.4% 0.2%
Mean (0.8%) 0.9% 0.3% 0.4% 0.4% (0.1%) 0.1% (0.5%)

Duff & Phelps
5
Restaurant Quarterly Update | Winter 2020
2017 2018 2019
Q4 Q1 Q2 Q3 Q4 Q1 Q2 Q3
Specialty Casual
Darden Restaurants Inc.
Bahama Breeze 2.5% 0.2% 0.6% 1.1% (1.1%) (3.7%) (4.2%) NA
The Capital Grille 3.8% 2.8% 2.6% 3.9% 3.7% 4.3% 1.5% NA
Cheddar’s Scratch Kitchen1 (3.0%) (4.7%) (2.0%) (4.0%) (4.0%) (2.7%) (5.4%) NA
Eddie V’s 6.8% 2.7% 3.6% 3.0% 0.9% 3.7% 1.2% NA
LongHorn Steakhouse 3.8% 2.0% 2.4% 3.1% 2.9% 3.8% 2.6% NA
Olive Garden 3.0% 2.2% 2.4% 5.3% 3.5% 4.3% 2.2% NA
Seasons 52 (0.5%) (0.2%) 0.4% (1.9%) (0.8%) (1.3%) (4.2%) NA
Yard House 2.0% 1.9% 1.4% 0.6% (1.1%) (2.1%) (1.9%) NA
Texas Roadhouse Inc. 5.4% 4.4% 5.7% 5.0% 5.6% 5.2% 4.7% 4.4%
Dave & Buster’s Entertainment Inc. (1.3%) (5.9%) (4.9%) (2.4%) (1.3%) 2.9% (1.8%) 4.1%
BJ’s Restaurants Inc. 1.6% 4.2% 5.6% 6.9% 4.2% 2.0% 2.0% (0.3%)
Chuy’s Holdings Inc. 1.3% (6.0%) 1.0% 0.5% (0.9%) 3.2% 1.9% 2.6%
Median 2.3% 2.0% 1.9% 2.1% 0.1% 3.1% 1.4% 3.4%
Mean 2.1% 0.3% 1.6% 1.8% 1.0% 1.6% (0.1%) 2.7%
1. SSS represents the change in year-over-year sales for restaurants that have been open for at least 18 months.
Represents most actively traded public restaurant companies.
2. Source: SEC filings, S&P Global Market Intelligence, Mergermarket, company press releases
and various news sources (e.g., The New York Times DealBook, The Deal, The Wall Street Journal).
Quarterly SSS Performance–Last Three Years1
Duff & Phelps
6
Restaurant Quarterly Update | Winter 2020
2017 2018 2019
Q4 Q1 Q2 Q3 Q4 Q1 Q2 Q3
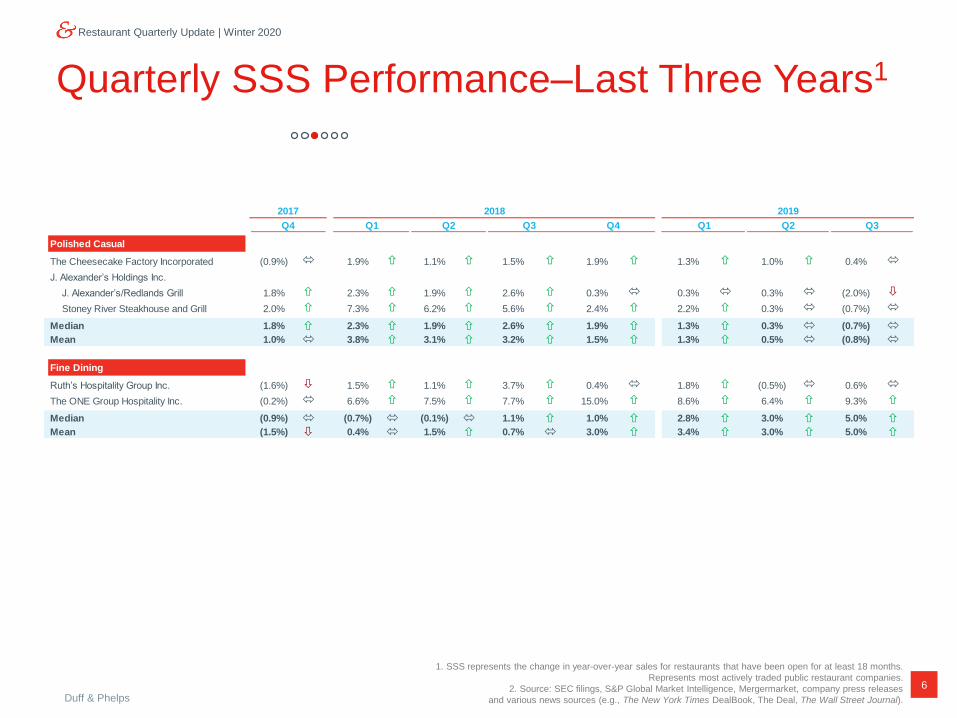
Polished Casual
The Cheesecake Factory Incorporated (0.9%) 1.9% 1.1% 1.5% 1.9% 1.3% 1.0% 0.4%
J. Alexander’s Holdings Inc.
J. Alexander’s/Redlands Grill 1.8% 2.3% 1.9% 2.6% 0.3% 0.3% 0.3% (2.0%)
Stoney River Steakhouse and Grill 2.0% 7.3% 6.2% 5.6% 2.4% 2.2% 0.3% (0.7%)
Median 1.8% 2.3% 1.9% 2.6% 1.9% 1.3% 0.3% (0.7%)
Mean 1.0% 3.8% 3.1% 3.2% 1.5% 1.3% 0.5% (0.8%)
Fine Dining
Ruth’s Hospitality Group Inc. (1.6%) 1.5% 1.1% 3.7% 0.4% 1.8% (0.5%) 0.6%
The ONE Group Hospitality Inc. (0.2%) 6.6% 7.5% 7.7% 15.0% 8.6% 6.4% 9.3%
Median (0.9%) (0.7%) (0.1%) 1.1% 1.0% 2.8% 3.0% 5.0%
Mean (1.5%) 0.4% 1.5% 0.7% 3.0% 3.4% 3.0% 5.0%
1. SSS represents the change in year-over-year sales for restaurants that have been open for at least 18 months.
Represents most actively traded public restaurant companies.
2. Source: SEC filings, S&P Global Market Intelligence, Mergermarket, company press releases
and various news sources (e.g., The New York Times DealBook, The Deal, The Wall Street Journal).
Quarterly SSS Performance–Last Three Years1

Duff & Phelps
7
Restaurant Quarterly Update | Winter 2020
2017 2018 2019
Q4 Q1 Q2 Q3 Q4 Q1 Q2 Q3
Fast Casual
Chipotle Mexican Grill Inc. 0.9% 2.2% 3.3% 4.4% 4.0% 9.9% 10.0% 11.0%
Wingstop Inc. 4.1% 9.5% 4.3% 6.3% 6.0% 7.1% 12.8% 12.3%
Shake Shack Inc. 0.8% 1.7% 1.1% (0.7%) 2.3% 3.6% 3.6% 2.0%
El Pollo Loco Holdings Inc. 1.7% 1.4% 1.1% 2.6% 4.4% 2.4% 0.7% 1.1%
Fiesta Restaurant Group Inc.
Pollo Tropical (0.1%) 1.1% 3.4% 6.5% (0.9%) (2.6%) (1.3%) (3.8%)
Taco Cabana (7.4%) (1.7%) 3.1% 12.2% 5.1% (0.5%) (3.0%) (4.8%)
Potbelly Corporation (2.4%) (3.6%) (0.2%) (0.2%) (1.7%) (4.7%) (4.0%) (3.0%)
The Habit Restaurants Inc. (1.0%) (1.4%) 1.2% 3.6% 2.4% 3.2% 3.9% 3.1%
Noodles & Company (0.9%) (0.2%) 5.4% 5.5% 3.7% 3.0% 4.6% 2.1%
Median (0.1%) 1.1% 3.1% 4.4% 3.7% 3.0% 3.6% 2.0%
Mean (0.5%) 1.0% 2.5% 4.5% 2.8% 2.4% 3.0% 2.2%
1. SSS represents the change in year-over-year sales for restaurants that have been open for at least 18 months.
Represents most actively traded public restaurant companies.
2. Source: SEC filings, S&P Global Market Intelligence, Mergermarket, company press releases
and various news sources (e.g., The New York Times DealBook, The Deal, The Wall Street Journal).
Quarterly SSS Performance–Last Three Years1

Duff & Phelps
8
Restaurant Quarterly Update | Winter 2020
2017 2018 2019
Q4 Q1 Q2 Q3 Q4 Q1 Q2 Q3
Quick Service
McDonald’s Corporation 5.5% 5.5% 4.0% 2.4% 4.4% 4.5% 6.5% 5.9%
Yum! Brands Inc.
KFC 3.0% 2.0% 2.0% 3.0% 3.0% 5.0% 6.0% 3.0%
Pizza Hut 1.0% 1.0% (1.0%) (1.0%) 0.0% 0.0% 2.0% 0.0%
Taco Bell 2.0% 1.0% 2.0% 5.0% 6.0% 4.0% 7.1% 4.0%
Restaurant Brands International Inc.
Burger King 2.7% 3.8% 1.8% 1.0% 1.9% 2.2% 0.5% 4.8%
Tim Hortons 0.0% (0.3%) 0.0% 0.6% 6.1% (0.3%) 3.6% (1.4%)
Popeyes Louisiana Kitchen Inc. (2.5%) 3.2% 2.9% 0.5% 7.3% 0.6% 3.0% 9.7%
Domino’s Pizza Inc. 4.2% 8.3% 6.9% 6.3% 5.6% 3.9% 3.0% 7.1%
The Wendy’s Company 1.3% 1.6% 1.9% (0.2%) 0.2% 1.3% 1.4% 4.4%
Jack in the Box Inc. (1.2%) (0.2%) 0.9% 0.5% 0.5% (0.1%) 2.7% 3.0%
Papa John’s International Inc. (3.9%) (5.3%) (6.1%) (9.8%) (8.1%) (6.9%) (5.7%) 1.0%
Del Taco Restaurants Inc. 3.0% 3.7% 3.3% 1.4% 1.9% (0.1%) 2.2% 1.0%
Nathan’s Famous Inc. 11.5% 10.9% (4.1%) (6.3%) 2.8% 4.1% 14.0% 6.7%
Median 2.0% 2.0% 1.9% 0.6% 2.8% 1.3% 3.0% 4.0%
Mean 2.0% 2.7% 1.1% 0.3% 2.4% 1.4% 3.6% 3.8%
1. SSS represents the change in year-over-year sales for restaurants that have been open for at least 18 months.
Represents most actively traded public restaurant companies.
2. Source: SEC filings, S&P Global Market Intelligence, Mergermarket, company press releases
and various news sources (e.g., The New York Times DealBook, The Deal, The Wall Street Journal).
Quarterly SSS Performance–Last Three Years1
Duff & Phelps
9
Restaurant Quarterly Update | Winter 2020
2017 2018 2019
Q4 Q1 Q2 Q3 Q4 Q1 Q2 Q3
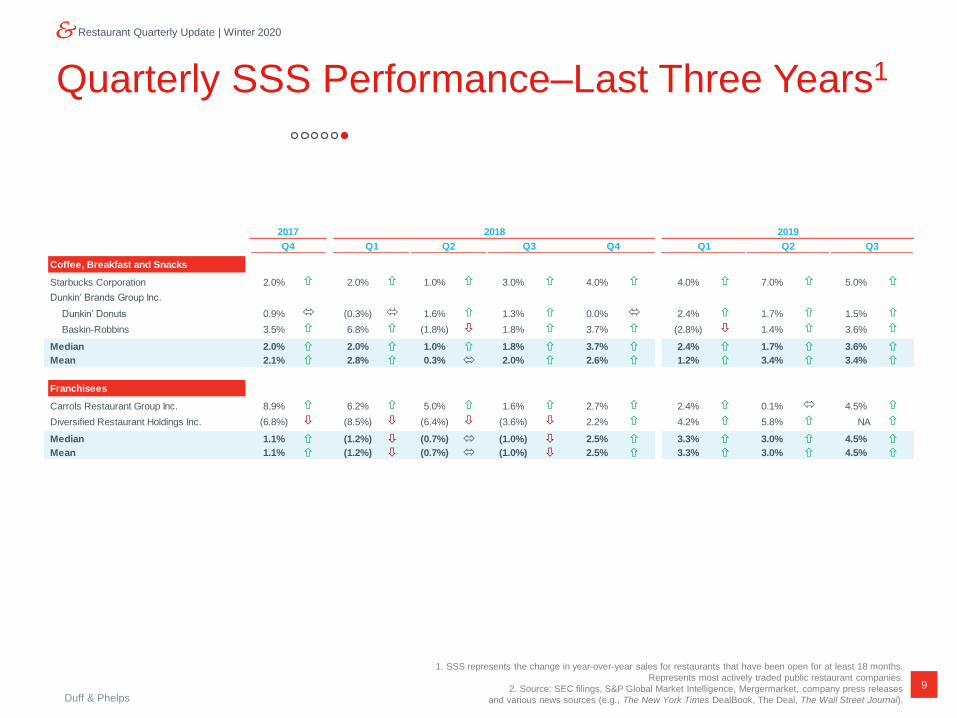
Coffee, Breakfast and Snacks
Starbucks Corporation 2.0% 2.0% 1.0% 3.0% 4.0% 4.0% 7.0% 5.0%
Dunkin’ Brands Group Inc.
Dunkin’ Donuts 0.9% (0.3%) 1.6% 1.3% 0.0% 2.4% 1.7% 1.5%
Baskin-Robbins 3.5% 6.8% (1.8%) 1.8% 3.7% (2.8%) 1.4% 3.6%
Median 2.0% 2.0% 1.0% 1.8% 3.7% 2.4% 1.7% 3.6%
Mean 2.1% 2.8% 0.3% 2.0% 2.6% 1.2% 3.4% 3.4%
Franchisees
Carrols Restaurant Group Inc. 8.9% 6.2% 5.0% 1.6% 2.7% 2.4% 0.1% 4.5%
Diversified Restaurant Holdings Inc. (6.8%) (8.5%) (6.4%) (3.6%) 2.2% 4.2% 5.8% NA
Median 1.1% (1.2%) (0.7%) (1.0%) 2.5% 3.3% 3.0% 4.5%
Mean 1.1% (1.2%) (0.7%) (1.0%) 2.5% 3.3% 3.0% 4.5%
1. SSS represents the change in year-over-year sales for restaurants that have been open for at least 18 months.
Represents most actively traded public restaurant companies.
2. Source: SEC filings, S&P Global Market Intelligence, Mergermarket, company press releases
and various news sources (e.g., The New York Times DealBook, The Deal, The Wall Street Journal).
Quarterly SSS Performance–Last Three Years1

Duff & Phelps
10
Restaurant Quarterly Update | Winter 2020
-60.0%
-50.0%
-40.0%
-30.0%
-20.0%
-10.0%
0.0%
10.0%
20.0%
30.0%
40.0%
50.0%
60.0%
70.0%
80.0%
1/3
1/2
019
2/2
8/2
019
3/3
1/2
019
4/3
0/2
019
5/3
1/2
019
6/3
0/2
019
7/3
1/2
019
8/3
1/2
019
9/3
0/2
019
10/3
1/2
019
11/3
0/2
019
12/3
1/2
019
1/3
1/2
020
Mass Casual Special ty Casual Polished Casual Fine Dining Fast Casual Quick Service Coffee, Breakfast and Snacks Franchisees
15.2%
(4.7%)
Indexed Stock Price Performance–Last 12 Months
Sector index weight based upon company market capitalization at valuation date.
Source: S&P Global Market Intelligence; data as of January 31, 2020. Mass casual index includes Brinker International Inc., Cracker Barrel Old Country Store, Bloomin’ Brands, DineEquity, Biglari
Holdings, Denny’s Corporation, Red Robin Gourmet Burgers and Luby’s. Specialty casual index includes Darden Restaurants, Texas Roadhouse, Dave & Buster’s Entertainment, BJ’s Restaurants and
Chuy’s Holdings. Polished casual index includes The Cheesecake Factory, J. Alexander’s Holdings. Fine dining index includes Ruth’s Hospitality Group and The ONE Group Hospitality. Fast casual index
includes Chipotle Mexican Grill, Shake Shack Inc., Wingstop Inc., Fiesta Restaurant Group, El Pollo Loco Holdings, The Habit Restaurants, Potbelly Corporation and Noodles & Company. Quick service
index includes McDonald's Corporation, Yum! Brands, Restaurant Brands International Inc., Domino’s Pizza, The Wendy’s Company, Jack in the Box Inc., Papa John’s International Inc., Del Taco
Restaurants, Nathan’s Famous Inc. and Papa Murphy’s Holdings. Coffee, breakfast and snacks index includes Starbucks Corporation and Dunkin’ Brands Group. Franchisees index includes Carrols
Restaurant Group Inc. and Diversified Restaurant Holdings Inc.
Represents most actively traded public restaurant companies.
57.2%
23.9%
5.4%
(12.7%)
(23.2%)
(39.8%)

Duff & Phelps
11
Restaurant Quarterly Update | Winter 2020
($ in millions, except per share data) Avg. Equity Avg. % Change Avg. EV/
Number of Market Value in Market Value EBITDA Multiple
Companies 31-Jan-20 1 Month 3 Months 12 Months LTM 2019A
Market Sector
M ass Casual 9 $1,190 (6.4%) 6.9% (23.2%) 58.1x 11.7x
Specialty Casual 5 4,201 7.5% 6.0% 5.4% 14.3x 13.2x
Polished Casual 2 929 (0.9%) (7.0%) (12.7%) 8.7x 8.2x
Fine Dining 2 357 (1.3%) 6.9% (4.7%) 15.0x 9.8x
Fast Casual 8 3,820 6.3% 12.6% 75.3% 26.3x 20.8x
Quick Service 9 25,816 5.9% 6.4% 8.5% 17.8x 16.4x
Coffee, Breakfast and Snacks 2 53,017 (3.8%) 0.3% 23.9% 20.6x 18.6x
Franchisees 2 274 (29.2%) (19.6%) (39.8%) 10.0x 5.9x
Market Indices
S&P 500 Index $3,226 (0.2%) 6.2% 19.3%
Dow Jones Industrial 28,256 (1.0%) 4.5% 13.0%
Russell 2000 Index 1,614 (3.3%) 3.3% 7.6%
S&P Restaurant Index 1,967 3.7% 5.5% 22.1%
Sector Stock Price Performance
Sector index weight based upon company market capitalization at valuation date.
Source: S&P Global Market Intelligence; data as of January 31, 2019. Mass casual index includes Brinker International Inc., Cracker Barrel Old Country Store, Bloomin’ Brands, DineEquity, Biglari
Holdings, Denny’s Corporation, Red Robin Gourmet Burgers and Luby’s, Famous Dave’s of America. Specialty casual index includes Darden Restaurants, Texas Roadhouse, Dave & Buster’s
Entertainment, BJ’s Restaurants and Chuy’s Holdings. Polished casual index includes The Cheesecake Factory, J. Alexander’s Holdings, Kona Grill. Fine dining index includes Ruth’s Hospitality Group,
Del Frisco’s Restaurant Group and The ONE Group Hospitality. Fast casual index includes Chipotle Mexican Grill, Shake Shack Inc., Wingstop Inc., Fiesta Restaurant Group, El Pollo Loco Holdings, The
Habit Restaurants, Potbelly Corporation and Noodles & Company. Quick service index includes McDonald's Corporation, Yum! Brands, Restaurant Brands International Inc., Domino’s Pizza, The
Wendy’s Company, Jack in the Box Inc., Papa John’s International Inc., Del Taco Restaurants, Nathan’s Famous Inc. and Papa Murphy’s Holdings. Coffee, breakfast and snacks index includes
Starbucks Corporation and Dunkin’ Brands Group. Franchisees index includes Carrols Restaurant Group Inc. and Diversified Restaurant Holdings Inc.
Represents most actively traded public restaurant companies.
-

Duff & Phelps
12
Restaurant Quarterly Update | Winter 2020
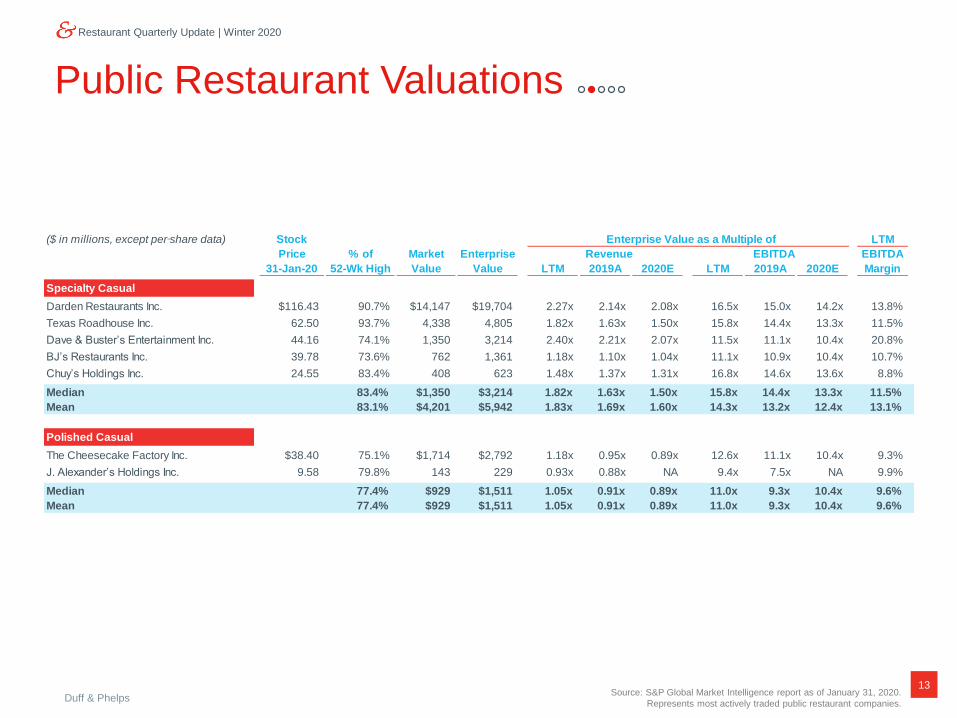
Public Restaurant Valuations
Source: S&P Global Market Intelligence report as of January 31, 2020.
Represents most actively traded public restaurant companies.
-($ in millions, except per share data) Stock Enterprise Value as a Multiple of LTM
Price % of Market Enterprise Revenue EBITDA EBITDA
31-Jan-20 52-Wk High Value Value LTM 2019A 2020E LTM 2019A 2020E Margin REV
Mass Casual
Cracker Barrel Old Country Store Inc. $152.93 84.5% $3,680 $4,650 1.51x 1.44x 1.39x 11.7x 11.5x 11.4x 12.9%
Brinker International Inc. 42.69 89.7% 1,597 2,800 0.84x 0.77x 0.75x 7.4x 7.0x 6.8x 11.3%
Bloomin’ Brands Inc. 20.77 85.5% 1,780 4,329 1.05x 1.02x 0.99x 11.1x 10.5x 10.3x 9.4%
Dine Brands Global 85.25 82.0% 1,432 3,188 3.55x 3.51x 3.44x 12.9x 11.7x 11.5x 27.6%
Denny’s Corporation 20.47 85.7% 1,209 1,644 2.80x 3.88x 3.80x 17.3x 16.0x 15.4x 16.2%
Biglari Holdings Inc. 142.50 32.1% 474 638 0.90x 0.74x 0.73x NM NM NM 3.0%
Red Robin Gourmet Burgers Inc. 32.87 89.2% 425 1,119 0.85x 0.87x 0.86x 11.2x 11.2x 10.6x 7.6%
Luby’s Inc. 2.42 96.8% 73 115 0.35x NA NA 380.64x NM NA 0.1%
BBQ Holdings, Inc. 4.11 65.0% 38 66 0.91x 0.69x 0.62x 12.9x 14.2x 8.1x 7.0%
Median 85.5% $1,209 $1,644 0.91x 0.95x 0.93x 12.3x 11.5x 10.6x 9.4%
Mean 78.9% $1,190 $2,061 1.42x 1.62x 1.57x 58.1x 11.7x 10.6x 10.6%
Duff & Phelps
13
Restaurant Quarterly Update | Winter 2020
Public Restaurant Valuations
Source: S&P Global Market Intelligence report as of January 31, 2020.
Represents most actively traded public restaurant companies.
-($ in millions, except per share data) Stock Enterprise Value as a Multiple of LTM
Price % of Market Enterprise Revenue EBITDA EBITDA
31-Jan-20 52-Wk High Value Value LTM 2019A 2020E LTM 2019A 2020E Margin REV
Specialty Casual
Darden Restaurants Inc. $116.43 90.7% $14,147 $19,704 2.27x 2.14x 2.08x 16.5x 15.0x 14.2x 13.8%
Texas Roadhouse Inc. 62.50 93.7% 4,338 4,805 1.82x 1.63x 1.50x 15.8x 14.4x 13.3x 11.5%
Dave & Buster’s Entertainment Inc. 44.16 74.1% 1,350 3,214 2.40x 2.21x 2.07x 11.5x 11.1x 10.4x 20.8%
BJ’s Restaurants Inc. 39.78 73.6% 762 1,361 1.18x 1.10x 1.04x 11.1x 10.9x 10.4x 10.7%
Chuy’s Holdings Inc. 24.55 83.4% 408 623 1.48x 1.37x 1.31x 16.8x 14.6x 13.6x 8.8%
Median 83.4% $1,350 $3,214 1.82x 1.63x 1.50x 15.8x 14.4x 13.3x 11.5%
Mean 83.1% $4,201 $5,942 1.83x 1.69x 1.60x 14.3x 13.2x 12.4x 13.1%
Polished Casual
The Cheesecake Factory Inc. $38.40 75.1% $1,714 $2,792 1.18x 0.95x 0.89x 12.6x 11.1x 10.4x 9.3%
J. Alexander’s Holdings Inc. 9.58 79.8% 143 229 0.93x 0.88x NA 9.4x 7.5x NA 9.9%
Median 77.4% $929 $1,511 1.05x 0.91x 0.89x 11.0x 9.3x 10.4x 9.6%
Mean 77.4% $929 $1,511 1.05x 0.91x 0.89x 11.0x 9.3x 10.4x 9.6%
Duff & Phelps
14
Restaurant Quarterly Update | Winter 2020
Public Restaurant Valuations
Source: S&P Global Market Intelligence report as of January 31, 2020.
Represents most actively traded public restaurant companies.
-($ in millions, except per share data) Stock Enterprise Value as a Multiple of LTM
Price % of Market Enterprise Revenue EBITDA EBITDA
31-Jan-20 52-Wk High Value Value LTM 2019A 2020E LTM 2019A 2020E Margin REV
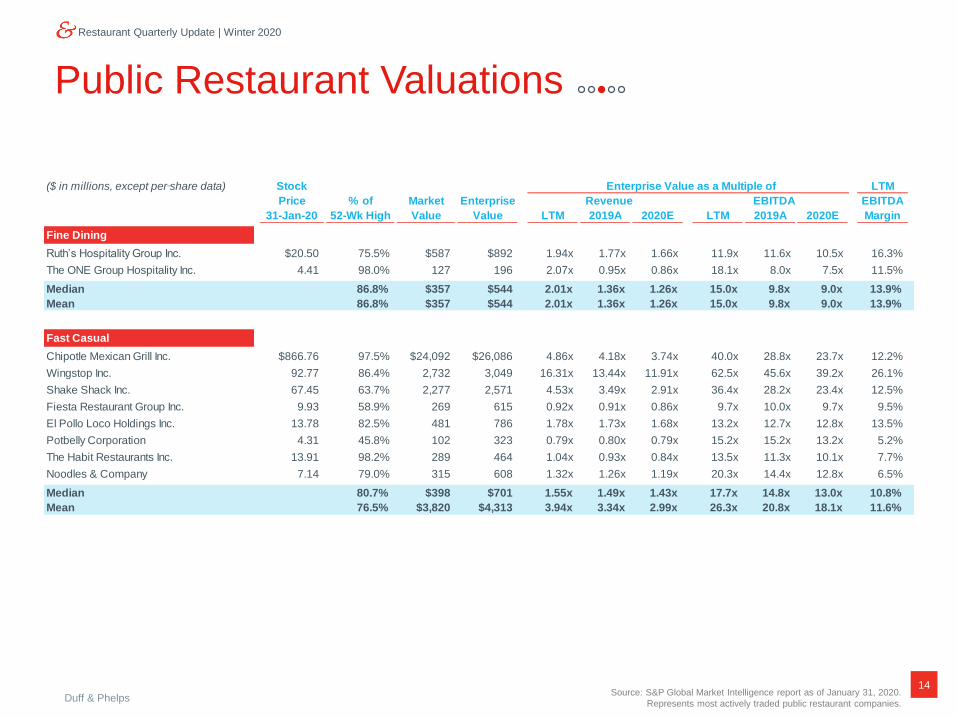
Fine Dining
Ruth’s Hospitality Group Inc. $20.50 75.5% $587 $892 1.94x 1.77x 1.66x 11.9x 11.6x 10.5x 16.3%
The ONE Group Hospitality Inc. 4.41 98.0% 127 196 2.07x 0.95x 0.86x 18.1x 8.0x 7.5x 11.5%
Median 86.8% $357 $544 2.01x 1.36x 1.26x 15.0x 9.8x 9.0x 13.9%
Mean 86.8% $357 $544 2.01x 1.36x 1.26x 15.0x 9.8x 9.0x 13.9%
Fast Casual
Chipotle Mexican Grill Inc. $866.76 97.5% $24,092 $26,086 4.86x 4.18x 3.74x 40.0x 28.8x 23.7x 12.2%
Wingstop Inc. 92.77 86.4% 2,732 3,049 16.31x 13.44x 11.91x 62.5x 45.6x 39.2x 26.1%
Shake Shack Inc. 67.45 63.7% 2,277 2,571 4.53x 3.49x 2.91x 36.4x 28.2x 23.4x 12.5%
Fiesta Restaurant Group Inc. 9.93 58.9% 269 615 0.92x 0.91x 0.86x 9.7x 10.0x 9.7x 9.5%
El Pollo Loco Holdings Inc. 13.78 82.5% 481 786 1.78x 1.73x 1.68x 13.2x 12.7x 12.8x 13.5%
Potbelly Corporation 4.31 45.8% 102 323 0.79x 0.80x 0.79x 15.2x 15.2x 13.2x 5.2%
The Habit Restaurants Inc. 13.91 98.2% 289 464 1.04x 0.93x 0.84x 13.5x 11.3x 10.1x 7.7%
Noodles & Company 7.14 79.0% 315 608 1.32x 1.26x 1.19x 20.3x 14.4x 12.8x 6.5%
Median 80.7% $398 $701 1.55x 1.49x 1.43x 17.7x 14.8x 13.0x 10.8%
Mean 76.5% $3,820 $4,313 3.94x 3.34x 2.99x 26.3x 20.8x 18.1x 11.6%

Duff & Phelps
15
Restaurant Quarterly Update | Winter 2020
Public Restaurant Valuations
Source: S&P Global Market Intelligence report as of January 31, 2020.
Represents most actively traded public restaurant companies.
-($ in millions, except per share data) Stock Enterprise Value as a Multiple of LTM
Price % of Market Enterprise Revenue EBITDA EBITDA
31-Jan-20 52-Wk High Value Value LTM 2019A 2020E LTM 2019A 2020E Margin
Quick Service
McDonald’s Corporation $213.97 96.4% $161,139 $207,117 9.83x 9.43x 9.07x 19.7x 18.4x 17.5x 49.8%
Yum! Brands Inc. 105.77 88.3% 31,991 42,676 7.81x 7.36x 6.95x 21.4x 19.5x 18.3x 36.5%
Restaurant Brands International Inc. 61.01 76.8% 18,188 32,184 5.84x 5.48x 5.23x 14.8x 13.1x 12.3x 39.5%
Domino’s Pizza Inc. 281.75 93.3% 11,524 15,134 4.26x 3.91x 3.67x 23.4x 20.1x 18.7x 18.2%
The Wendy’s Company 21.67 94.9% 4,985 8,276 6.15x 4.54x 4.43x 20.6x 19.0x 17.5x 29.9%
Jack in the Box Inc. 81.75 87.8% 1,887 3,037 3.20x 3.10x 3.01x 11.5x 11.1x 10.8x 27.8%
Papa John’s International Inc. 64.78 96.5% 2,069 2,843 1.88x 1.73x 1.65x 24.3x 19.5x 17.7x 7.7%
Del Taco Restaurants Inc. 7.54 55.9% 279 672 1.31x 1.34x 1.31x 11.7x 10.5x 10.2x 11.2%
Nathan’s Famous Inc. 66.00 80.3% 279 354 3.45x NA NA 12.5x NA NA 27.7%
Median 88.3% $4,985 $8,276 4.26x 4.22x 4.05x 19.7x 18.7x 17.5x 27.8%
Mean 85.6% $25,816 $34,699 4.86x 4.61x 4.42x 17.8x 16.4x 15.4x 27.6%
Duff & Phelps
16
Restaurant Quarterly Update | Winter 2020
Public Restaurant Valuations
Note: 1 Financial information is pro-forma for the February acquisition of Cambridge Holdings.
Source: S&P Global Market Intelligence report as of January 31, 2020.
Represents most actively traded public restaurant companies.
1
-($ in millions, except per share data) Stock Enterprise Value as a Multiple of LTM
Price % of Market Enterprise Revenue EBITDA EBITDA
31-Jan-20 52-Wk High Value Value LTM 2019A 2020E LTM 2019A 2020E Margin REV
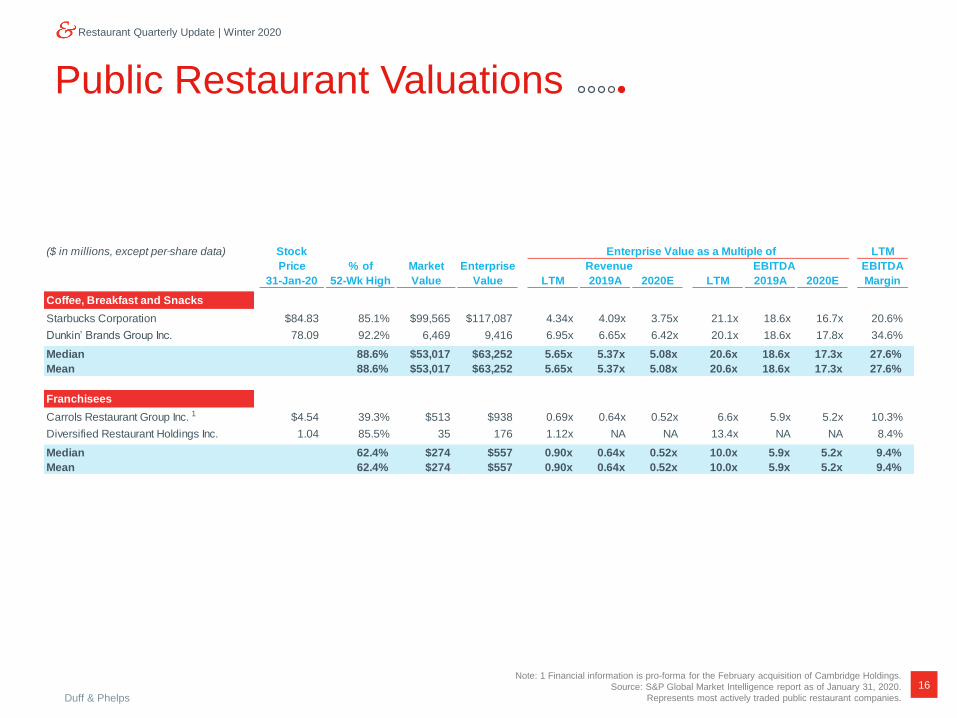
Coffee, Breakfast and Snacks
Starbucks Corporation $84.83 85.1% $99,565 $117,087 4.34x 4.09x 3.75x 21.1x 18.6x 16.7x 20.6%
Dunkin’ Brands Group Inc. 78.09 92.2% 6,469 9,416 6.95x 6.65x 6.42x 20.1x 18.6x 17.8x 34.6%
Median 88.6% $53,017 $63,252 5.65x 5.37x 5.08x 20.6x 18.6x 17.3x 27.6%
Mean 88.6% $53,017 $63,252 5.65x 5.37x 5.08x 20.6x 18.6x 17.3x 27.6%
REV
Franchisees
Carrols Restaurant Group Inc. $4.54 39.3% $513 $938 0.69x 0.64x 0.52x 6.6x 5.9x 5.2x 10.3%
Diversified Restaurant Holdings Inc. 1.04 85.5% 35 176 1.12x NA NA 13.4x NA NA 8.4%
Median 62.4% $274 $557 0.90x 0.64x 0.52x 10.0x 5.9x 5.2x 9.4%
Mean 62.4% $274 $557 0.90x 0.64x 0.52x 10.0x 5.9x 5.2x 9.4%

Duff & Phelps
17
Restaurant Quarterly Update | Winter 2020
8.7x
10.5x 10.3x
16.9x
8.9x
10.4x 10.4x
9.2x8.7x
11.9x
8.7x
9.7x
8.8x
11.2x
8.8x
12.0x
8.5x
10.9x
7.8x
9.5x
5.0x
7.0x
9.0x
11.0x
13.0x
15.0x
17.0x
19.0x
Mass Casual Specialty Casual Polished Casual Fine Dining
2015 2016 2017 2018 2019
Mean: 11.0x
Mean: 9.2x
Mean: 11.5x
Mean: 8.7x
Historical Public Restaurant Trends
Enterprise Value as a Multiple of EBITDA1
1 Index calculation excludes any companies with nonmeaningful trading multiples.
Source: S&P Global Market Intelligence; Last Twelve Months (LTM) values as of January 31, 2020.
Segments weighted based on market cap values at period end.
Represents most actively traded public restaurant companies.

Duff & Phelps
18
Restaurant Quarterly Update | Winter 2020
14.9x
13.9x
20.5x
11.6x
13.5x 13.2x
16.8x
9.9x
14.0x
16.6x
16.7x
8.3x
15.6x16.5x 15.7x
6.6x
18.9x
17.5x
20.7x
11.4x
6.0x
9.0x
12.0x
15.0x
18.0x
21.0x
24.0x
Fast Casual Quick Service Coffee, Breakfast and Snacks Franchisees
2015 2016 2017 2018 2019
Historical Public Restaurant Trends
Mean: 15.5x
Mean: 18.1x
Mean: 9.6x
Mean: 15.4x
Enterprise Value as a Multiple of EBITDA1
1 Index calculation excludes any companies with nonmeaningful trading multiples.
Source: S&P Global Market Intelligence; Last Twelve Months (LTM) values as of January 31, 2020.
Segments weighted based on market cap values at period end.
Represents most actively traded public restaurant companies.

Duff & Phelps
19
Restaurant Quarterly Update | Winter 2020
Recent Restaurant M&A Transaction Activity Bar Louie Files for Chapter 11 Bankruptcy
On January 27, private-equity-backed Bar Louie filed for Chapter 11
bankruptcy protection. BL Restaurant Holding LLC, and three affiliates,
files for Chapter 11 Bankruptcy as a result of increased competition and
declining sales. This action was taken after closing down 38 restaurants
and arranging to sell all 72 remaining restaurants to its lenders who are
serving as the stalking horse in the bankruptcy sale. The lenders’ credit
bid was for $82.5 million.
Zuul Kitchens Acquires Ontray
On January 27, Zuul Kitchens announced it has acquired the online
ordering system Ontray. Zuul Kitchens is a New York-based ghost
kitchen operator now seeking to leverage Ontray’s technology to better
support its restaurant members. With Ontray, Zuul believes they have
the ability to innovate a full product delivery solution that includes
affordable ordering for its members.
Chopt Creative Salad Co. to Acquire Dos Tors Taqueria
On January 23, Chopt Creative Salad Co. announced it will be acquiring
Dos Toros Taqueria and will be forming a new holding company
financed by L Catterton to house both concepts. The new company,
Founders Table Restaurant, may act as a new vehicle to go out and
acquire several other “innovative, founder-led, line-out-of-the-door”
restaurant concepts in the near future.
Yum! Brands to Acquire Habit Burger Grill
On January 6, Yum! Brands agreed to buy The Habit Restaurants,
parent to Habit Burger Grill. for approximately $375 million. Yum! Brands
will acquire in cash all of the issues and outstanding common shares for
$14 a share. The brand has grown to nearly 270 restaurants in 13 states
and has experienced six consecutive quarters of SSS growth. Yum!
Brands will also benefit from the restaurant’s strong off-premise sales
channel.
Source: Mergermarket Group Intelligence.
Cracker Barrel Acquires Maple Street
On October 11, Cracker Barrel Old Country Store Inc. acquired emerging
fast-casual brand Maple Street Biscuit Company in an all-cash deal for
$36 million. Cracker Barrel plans to convert Holler & Dash units to the
Maple Street banner. Per CEO Sandra B. Cochran, the breakfast and
lunch fast-casual category is an attractive segment to invest in, given
future growth potential.
ONE Group Hospitality Acquires Kona Grill
On October 7, STK parent ONE Group Hospitality acquired Kona Grill for
$25 million in cash and $11 million in debt (senior secured credit facility)
in a bankruptcy court deal. The deal includes 24 Kona Grill domestic units
and one international location in Dubai. One Group believes the
acquisition will add approximately $100 million in annual revenue and a
nearly $25 million contribution to adjusted earnings before interest, taxes,
depreciation and amortization (EBITDA).
MAD Greens and Snappy Salads Merge
On October 1, fast-casual chain MAD Greens and Snappy Salads
announced their merger, with plans to remain separate under the Salad
Collective umbrella. Per MAD Greens CEO Darden Coors, the company
is looking to grow its restaurant system and, given that the merger would
eliminate competition and expand the bottom line, the transaction was a
strong play. Both chains offer salads, wraps, soups and sides while using
high-quality and fresh ingredients. All units are company owned outside of
one licensed MAD Greens location in Austin.
Landry’s Acquires Del Frisco’s Grille and Double Eagle Steakhouse
On September 25, Landry’s acquired two Del Frisco's Restaurant Group
brands that had been recently purchased by L Catterton—Del Frisco’s
Grille and Double Eagle Steakhouse—for an undisclosed amount. The
remaining brands, Bartaco and Barcelona Wine Bar, will operate as
independent entities under overarching leadership from L Catterton. Per L
Catterton managing partner Andrew Taub, divesting the steak concepts to
Landry’s will help to unlock significantly more value in the remaining
brands.
Duff & Phelps
20
Restaurant Quarterly Update | Winter 2020
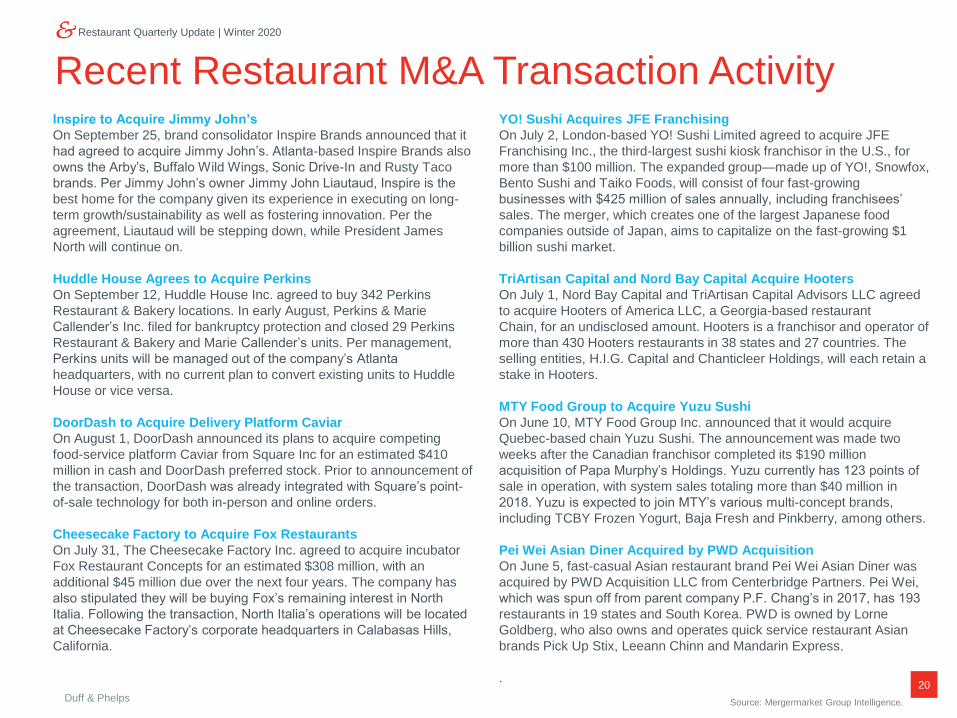
Recent Restaurant M&A Transaction Activity Inspire to Acquire Jimmy John’s
On September 25, brand consolidator Inspire Brands announced that it
had agreed to acquire Jimmy John’s. Atlanta-based Inspire Brands also
owns the Arby’s, Buffalo Wild Wings, Sonic Drive-In and Rusty Taco
brands. Per Jimmy John’s owner Jimmy John Liautaud, Inspire is the
best home for the company given its experience in executing on long-
term growth/sustainability as well as fostering innovation. Per the
agreement, Liautaud will be stepping down, while President James
North will continue on.
Huddle House Agrees to Acquire Perkins
On September 12, Huddle House Inc. agreed to buy 342 Perkins
Restaurant & Bakery locations. In early August, Perkins & Marie
Callender’s Inc. filed for bankruptcy protection and closed 29 Perkins
Restaurant & Bakery and Marie Callender’s units. Per management,
Perkins units will be managed out of the company’s Atlanta
headquarters, with no current plan to convert existing units to Huddle
House or vice versa.
DoorDash to Acquire Delivery Platform Caviar
On August 1, DoorDash announced its plans to acquire competing
food-service platform Caviar from Square Inc for an estimated $410
million in cash and DoorDash preferred stock. Prior to announcement of
the transaction, DoorDash was already integrated with Square’s point-
of-sale technology for both in-person and online orders.
Cheesecake Factory to Acquire Fox Restaurants
On July 31, The Cheesecake Factory Inc. agreed to acquire incubator
Fox Restaurant Concepts for an estimated $308 million, with an
additional $45 million due over the next four years. The company has
also stipulated they will be buying Fox’s remaining interest in North
Italia. Following the transaction, North Italia’s operations will be located
at Cheesecake Factory’s corporate headquarters in Calabasas Hills,
California.
Source: Mergermarket Group Intelligence.
YO! Sushi Acquires JFE Franchising
On July 2, London-based YO! Sushi Limited agreed to acquire JFE
Franchising Inc., the third-largest sushi kiosk franchisor in the U.S., for
more than $100 million. The expanded group—made up of YO!, Snowfox,
Bento Sushi and Taiko Foods, will consist of four fast-growing
businesses with $425 million of sales annually, including franchisees’
sales. The merger, which creates one of the largest Japanese food
companies outside of Japan, aims to capitalize on the fast-growing $1
billion sushi market.
TriArtisan Capital and Nord Bay Capital Acquire Hooters
On July 1, Nord Bay Capital and TriArtisan Capital Advisors LLC agreed
to acquire Hooters of America LLC, a Georgia-based restaurant
Chain, for an undisclosed amount. Hooters is a franchisor and operator of
more than 430 Hooters restaurants in 38 states and 27 countries. The
selling entities, H.I.G. Capital and Chanticleer Holdings, will each retain a
stake in Hooters.
MTY Food Group to Acquire Yuzu Sushi
On June 10, MTY Food Group Inc. announced that it would acquire
Quebec-based chain Yuzu Sushi. The announcement was made two
weeks after the Canadian franchisor completed its $190 million
acquisition of Papa Murphy’s Holdings. Yuzu currently has 123 points of
sale in operation, with system sales totaling more than $40 million in
2018. Yuzu is expected to join MTY’s various multi-concept brands,
including TCBY Frozen Yogurt, Baja Fresh and Pinkberry, among others.
Pei Wei Asian Diner Acquired by PWD Acquisition
On June 5, fast-casual Asian restaurant brand Pei Wei Asian Diner was
acquired by PWD Acquisition LLC from Centerbridge Partners. Pei Wei,
which was spun off from parent company P.F. Chang’s in 2017, has 193
restaurants in 19 states and South Korea. PWD is owned by Lorne
Goldberg, who also owns and operates quick service restaurant Asian
brands Pick Up Stix, Leeann Chinn and Mandarin Express.
.

Duff & Phelps
21
Restaurant Quarterly Update | Winter 2020
Sell-Side Advisor
has been acquired by
Board Advisor
has been acquired by
Sell-Side Advisor
has been acquired by
Selected Recent Duff & Phelps Restaurant Transactions
Sell-Side Advisor
has been acquired by
Buy-Side Advisor
has acquired
Raised $130 million credit
facility
Sell-Side Advisor
has received a growth equity
investment from
has been acquired by
a portfolio company of
Sell-Side Advisor Sell-Side Advisor
a portfolio company of
Elysium Management
has been acquired by
Sell-Side Advisor
has been acquired by
Barrand, Inc. (dba
“Whataburger”)
Sell-Side Advisor
a portfolio company of
has been acquired by
Sell-Side Advisor
has been acquired by has completed a spinoff
transaction of its real estate
holdings
Board Advisor
has received a significant
investment from
a portfolio company of
Sell-Side Advisor Sell-Side Advisor
has been acquired by
Signed Purchase Agreement
Sell-Side Advisor
has received a significant
growth equity investment
from

Restaurant Quarterly Update | Winter 2020
Contact Us
For more information, please visit:
www.duffandphelps.com
Duff & Phelps is the global advisor that protects, restores
and maximizes value for clients in the areas of valuation,
corporate finance, investigations, disputes, cyber security,
compliance and regulatory matters, and other
governance-related issues. We work with clients across
diverse sectors, mitigating risk to assets, operations and
people. With Kroll, a division of Duff & Phelps since 2018,
our firm has nearly 3,500 professionals in 28 countries
around the world.
M&A advisory, capital raising and secondary market advisory services in the
United States are provided by Duff & Phelps Securities, LLC. Member
FINRA/SIPC. Pagemill Partners is a Division of Duff & Phelps Securities, LLC.
M&A advisory and capital raising services in Canada are provided by Duff &
Phelps Securities Canada Ltd., a registered Exempt Market Dealer. M&A
advisory and capital raising services in the United Kingdom and across Europe
are provided by Duff & Phelps Securities Ltd. (DPSL), which is authorized and
regulated by the Financial Conduct Authority. In Germany, M&A advisory and
capital raising services are also provided by Duff & Phelps GmbH, which is a
Tied Agent of DPSL. Valuation Advisory Services in India are provided by Duff
& Phelps India Private Limited under a category 1 merchant banker license
issued by the Securities and Exchange Board of India.
AboutDuff & Phelps
Copyright © 2020 Duff & Phelps LLC. All rights reserved.
Vijay SampathDirector
Consumer, Food & Restaurant
Corporate Finance
New York
+1 212 871 0316
Joshua BennGlobal Head
Consumer, Food & Restaurant
Corporate Finance
New York
+1 212 450 2840
Darren GangeManaging Director
Consumer, Food & Restaurant
Corporate Finance
New York
+1 212 871 9429
Farzad MukhiDirector
Consumer, Food & Restaurant
Corporate Finance
Los Angeles
+1 424 249 1661
Duff & Phelps


