Lisa LucasJan Thompson
Photo: Francis Parchaso
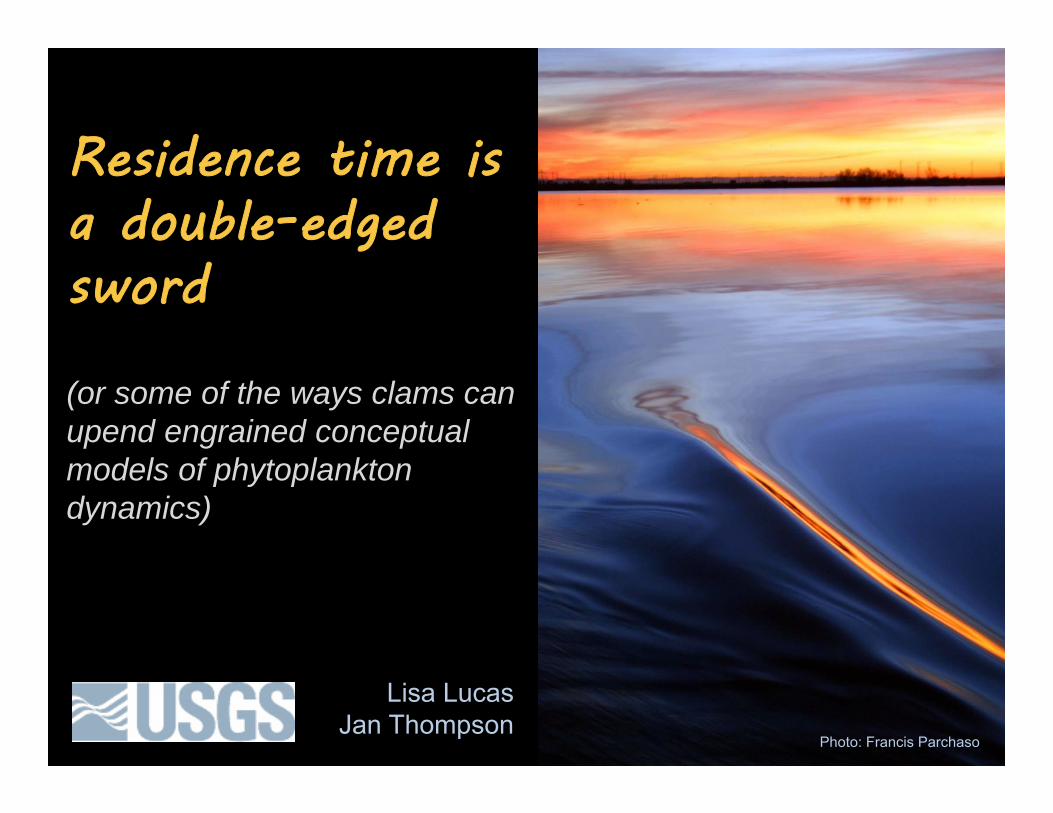
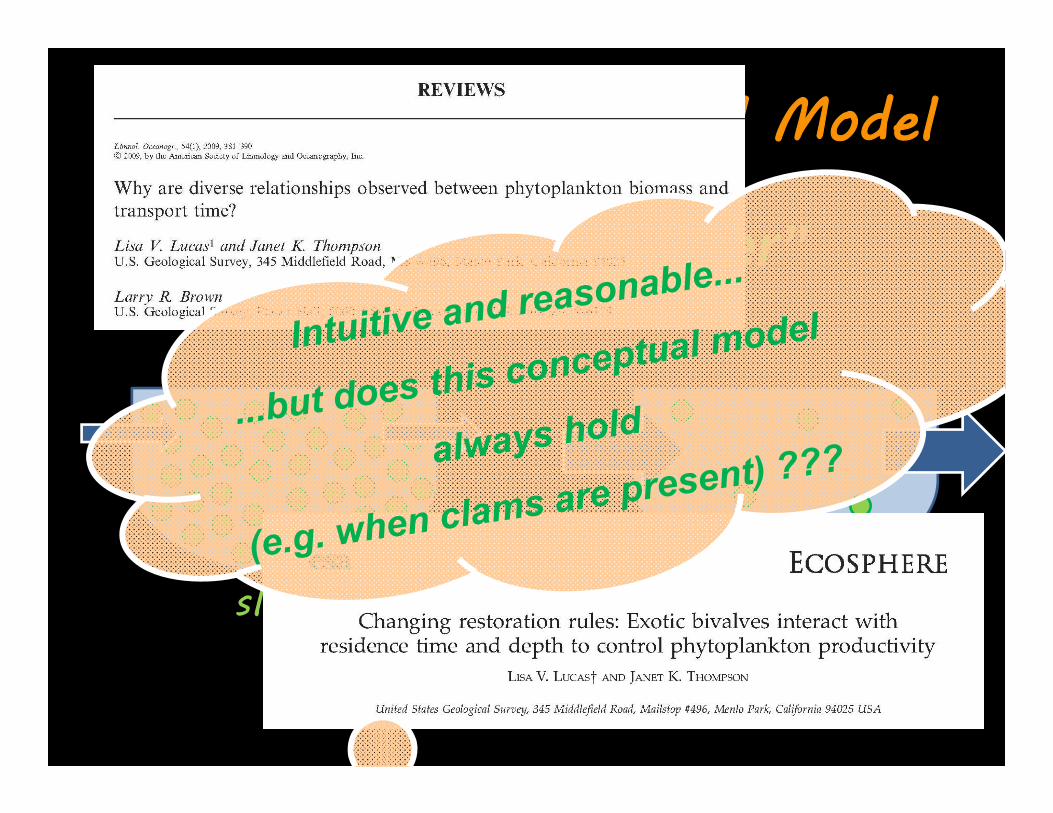
Residence time is a double-edged sword
(or some of the ways clams can upend engrained conceptual models of phytoplankton dynamics)
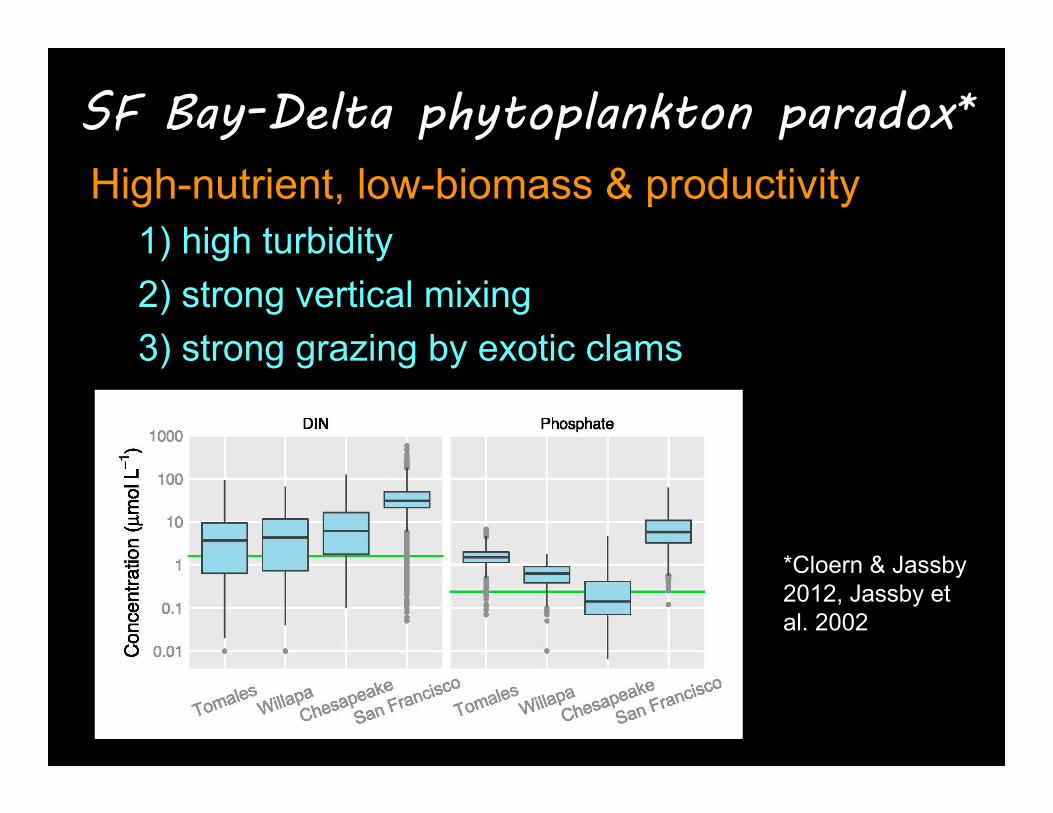
SF Bay-Delta phytoplankton paradox*High-nutrient, low-biomass & productivity
1) high turbidity2) strong vertical mixing3) strong grazing by exotic clams
*Cloern & Jassby2012, Jassby et al. 2002
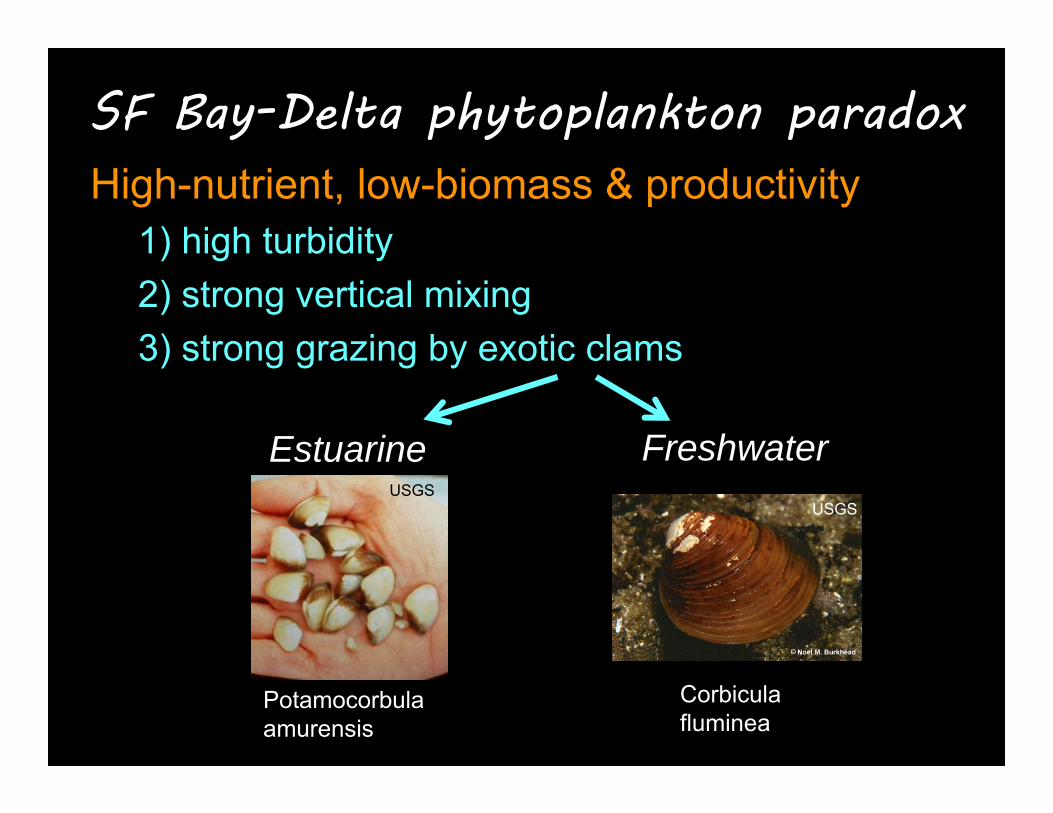
SF Bay-Delta phytoplankton paradoxHigh-nutrient, low-biomass & productivity
1) high turbidity2) strong vertical mixing3) strong grazing by exotic clams
Potamocorbulaamurensis
Corbiculafluminea
Estuarine FreshwaterUSGS
USGS
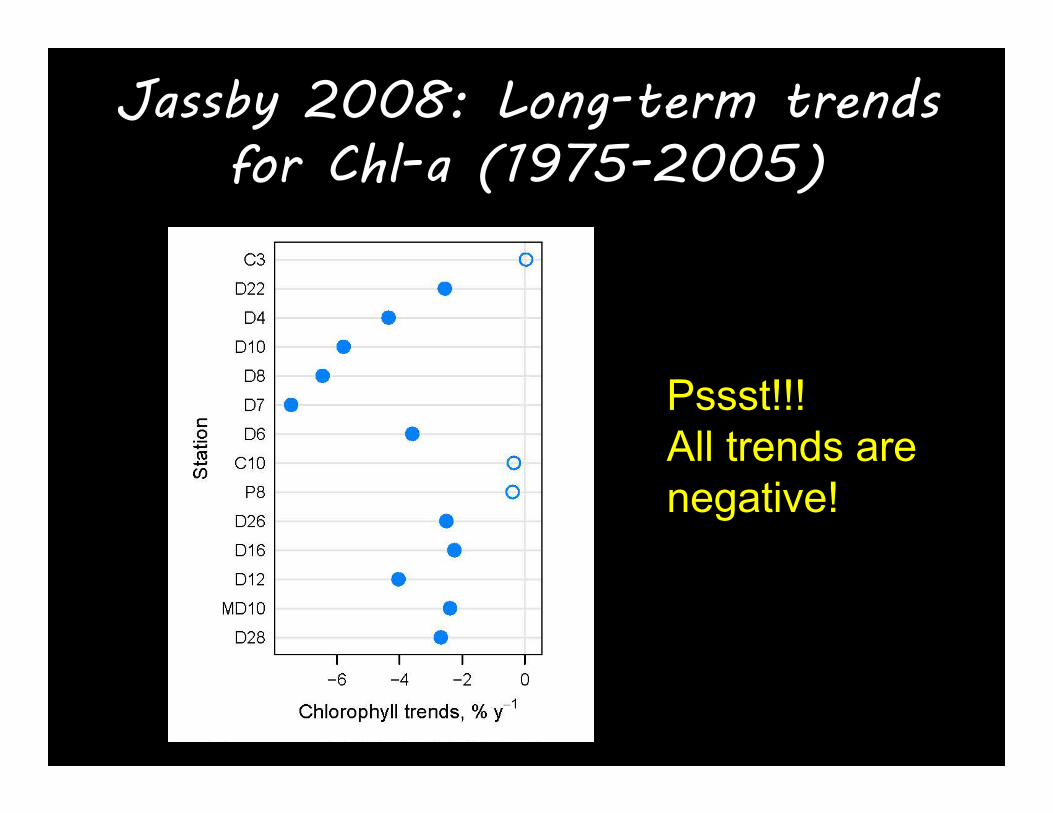
Jassby 2008: Long-term trends for Chl-a (1975-2005)
Pssst!!! All trends are negative!
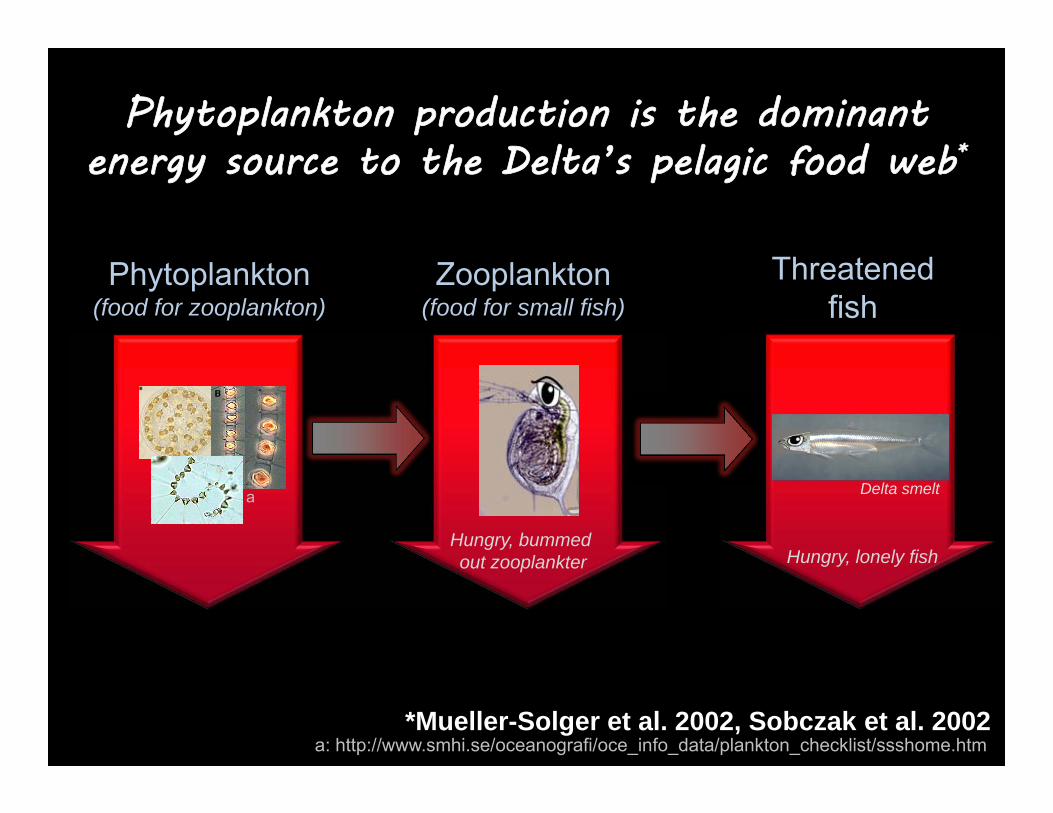
Phytoplankton production is the dominant energy source to the Delta’s pelagic food web*
Threatenedfish
Zooplankton(food for small fish)
Phytoplankton(food for zooplankton)
Hungry, bummed out zooplankter Hungry, lonely fish
Delta smelt
*Mueller-Solger et al. 2002, Sobczak et al. 2002a: http://www.smhi.se/oceanografi/oce_info_data/plankton_checklist/ssshome.htm
a
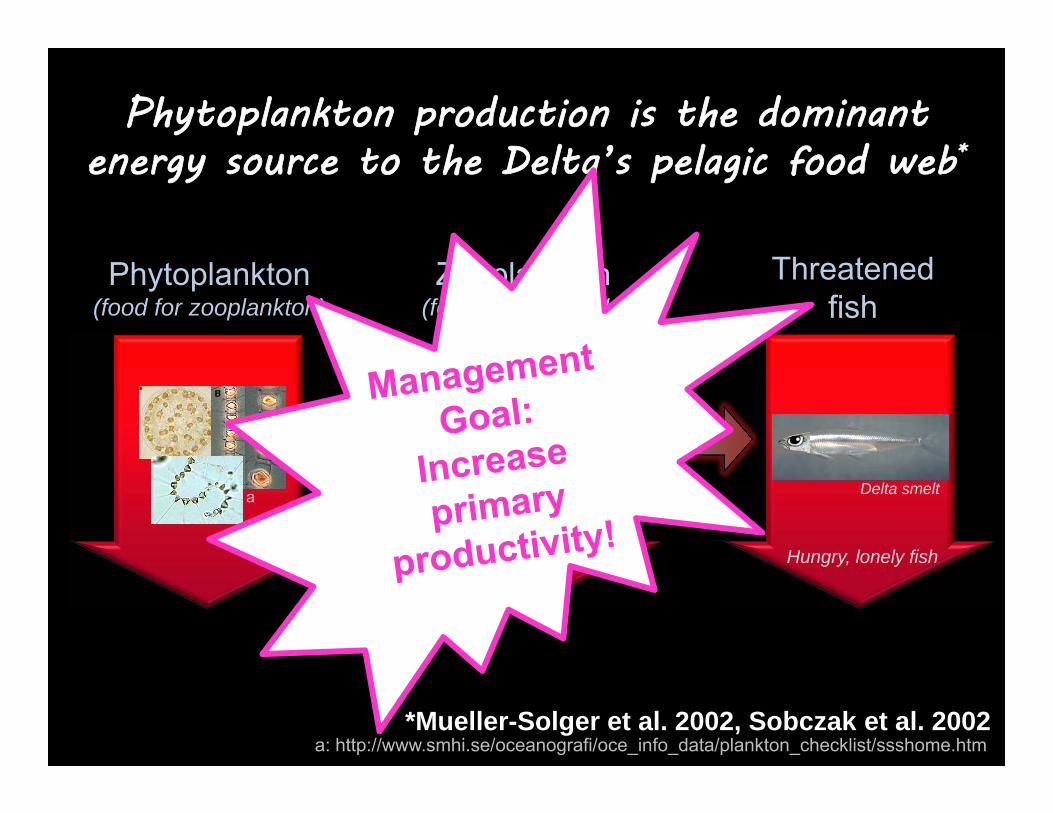
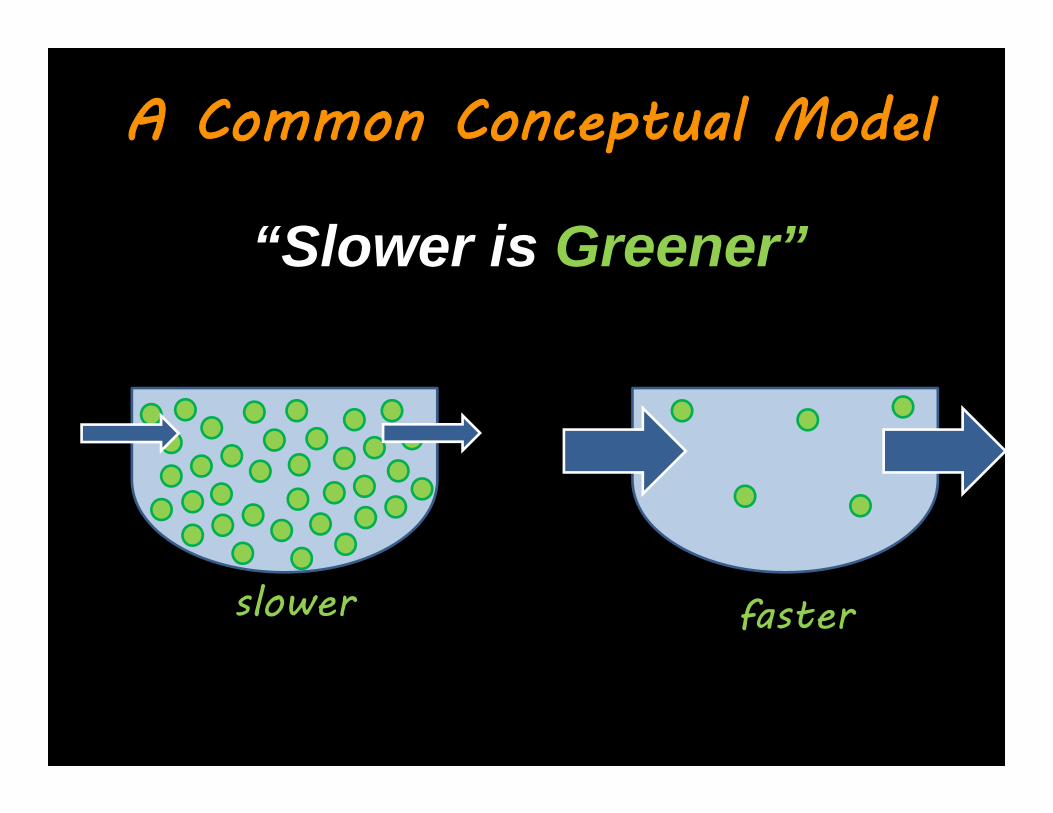
“Slower is Greener”
slower faster
A Common Conceptual Model
“Slower is Greener”
slower faster
A Common Conceptual Model
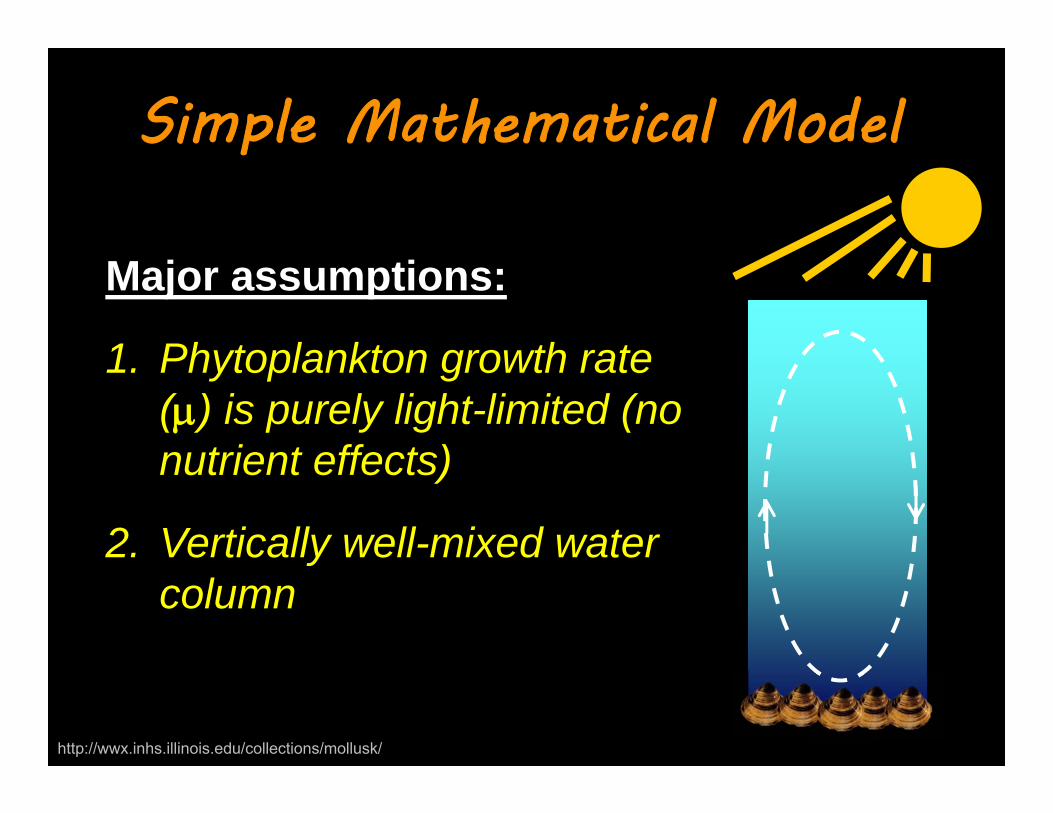
Simple Mathematical Model
Major assumptions:
1. Phytoplankton growth rate () is purely light-limited (no nutrient effects)
2. Vertically well-mixed water column
http://wwx.inhs.illinois.edu/collections/mollusk/
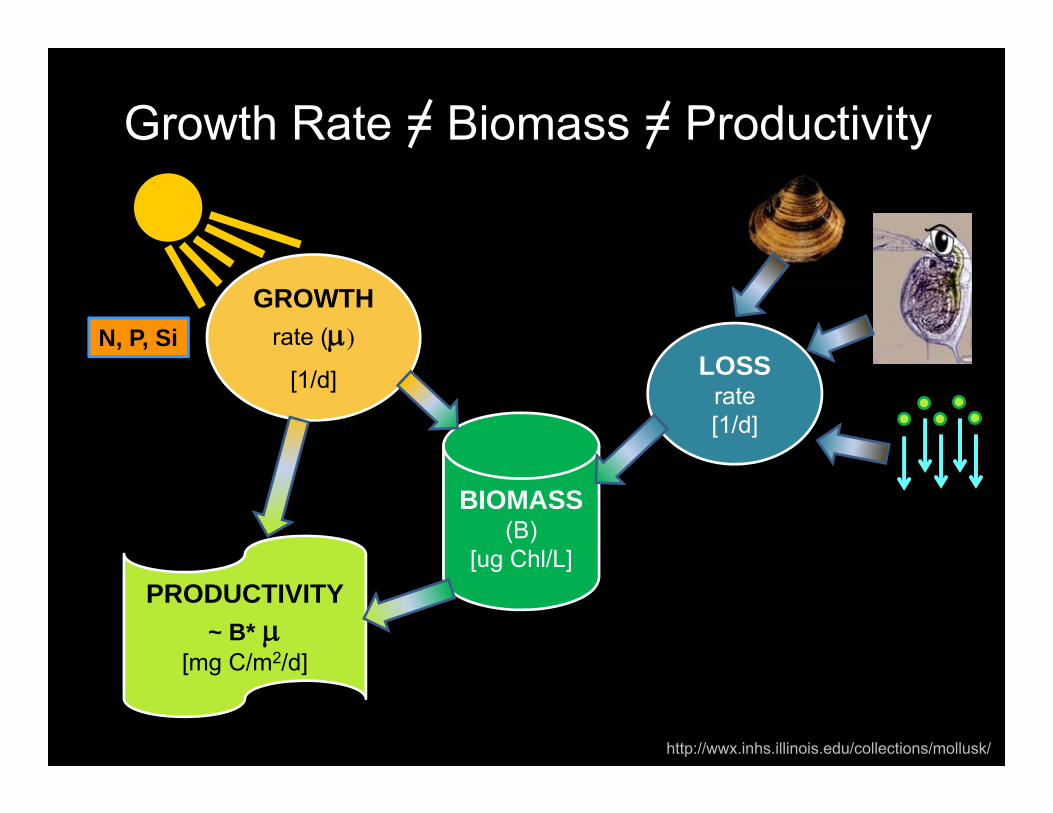
GROWTHrate (
[1/d] LOSSrate[1/d]
Growth Rate = Biomass = Productivity
BIOMASS(B)
[ug Chl/L]PRODUCTIVITY
~ B* [mg C/m2/d]
N, P, Si
http://wwx.inhs.illinois.edu/collections/mollusk/
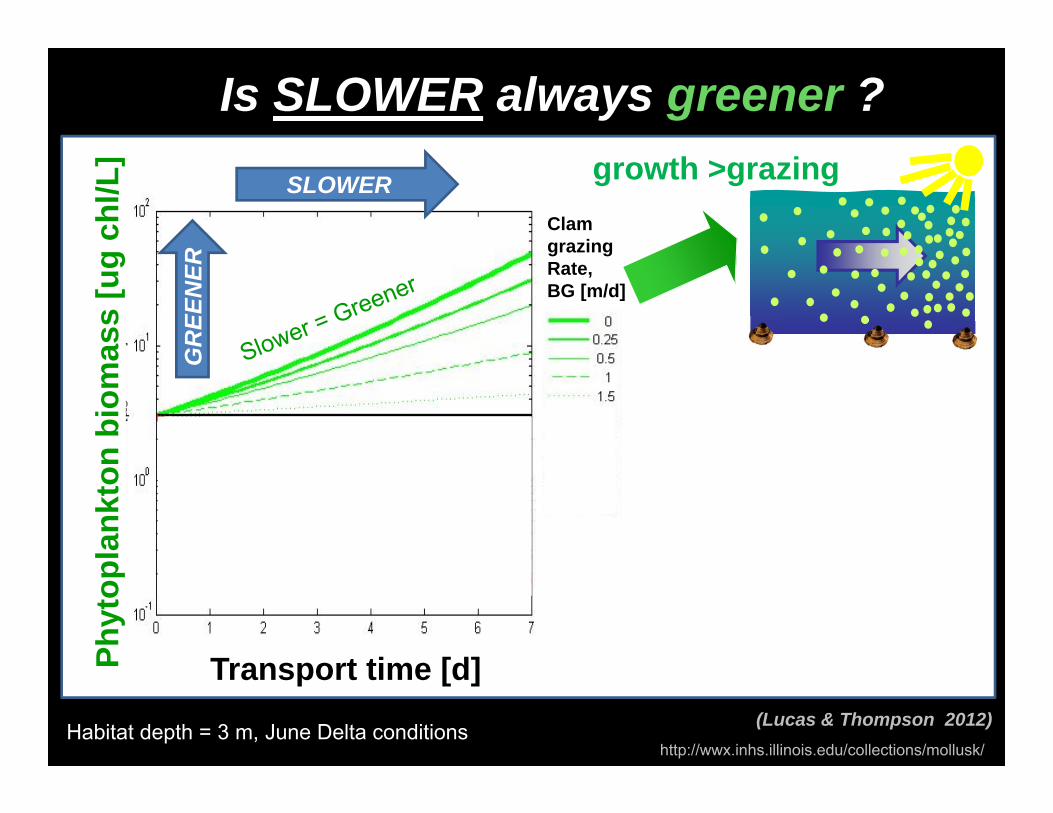
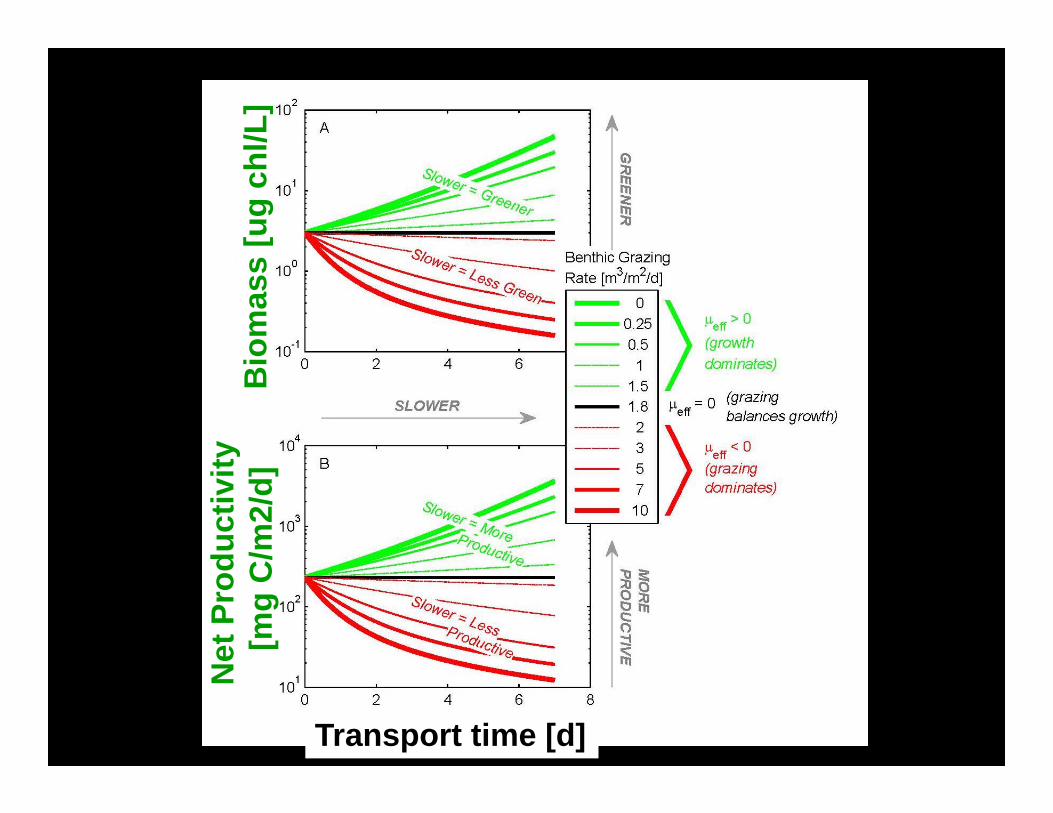
Is SLOWER always greener ?
ClamgrazingRate, BG [m/d]
Habitat depth = 3 m, June Delta conditions
SLOWERG
REE
NER
growth >grazing
(Lucas & Thompson 2012)
Phyt
opla
nkto
n bi
omas
s [u
gch
l/L]
Transport time [d]
http://wwx.inhs.illinois.edu/collections/mollusk/
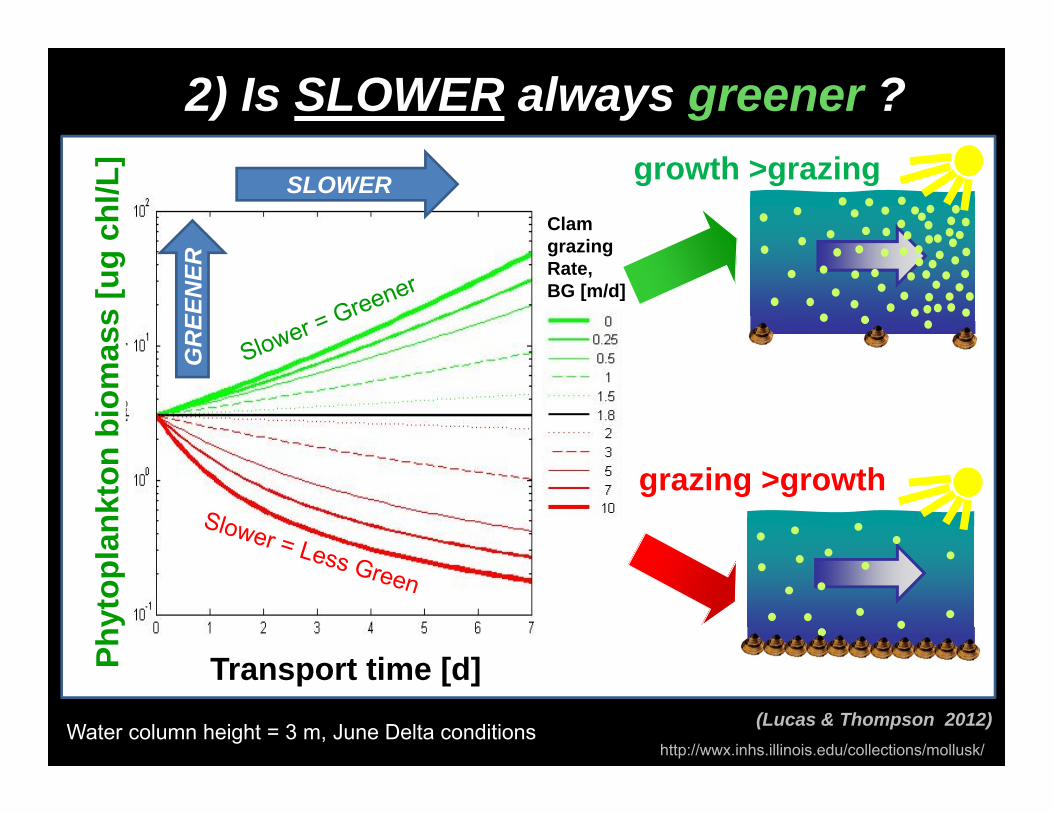
2) Is SLOWER always greener ? Ph
ytop
lank
ton
biom
ass
[ug
chl/L
]
Transport time [d]
ClamgrazingRate, BG [m/d]
Water column height = 3 m, June Delta conditions
SLOWERG
REE
NER
growth >grazing
grazing >growth
(Lucas & Thompson 2012)http://wwx.inhs.illinois.edu/collections/mollusk/
Bio
mas
s [u
gch
l/L]
Transport time [d]
Net
Pro
duct
ivity
[mg
C/m
2/d]

Is SLOWER always greener ? NO !!!
SLOWERG
REE
NER
ClamgrazingRate, BG [m/d]
1. Slower habitat can be more green or lessgreen, depending on growth-loss balance (e.g. clam presence/absence).
2. Slower water has broader range of possibilities than faster habitat.
(Lucas & Thompson 2012; Lucas et al. 2009)
Phyt
opla
nkto
n bi
omas
s [u
gch
l/L]
Transport time [d]
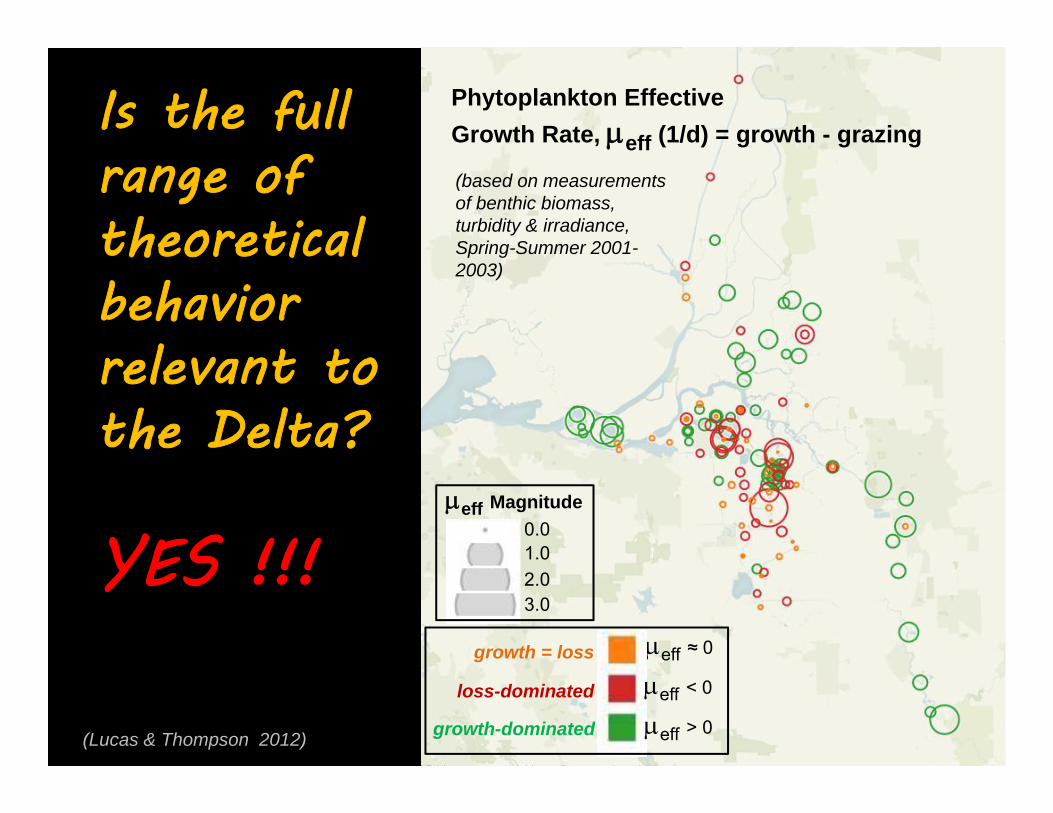
Phytoplankton EffectiveGrowth Rate, eff (1/d) = growth - grazing
eff Magnitude0.01.02.03.0
Is the full range of theoretical behaviorrelevant to the Delta?
YES !!!
(based on measurements of benthic biomass, turbidity & irradiance,Spring-Summer 2001-2003)
eff ≈ 0
growth-dominated
loss-dominated
growth = loss
eff < 0
eff > 0(Lucas & Thompson 2012)
Is this dual role for transport time relevant to the Bay?
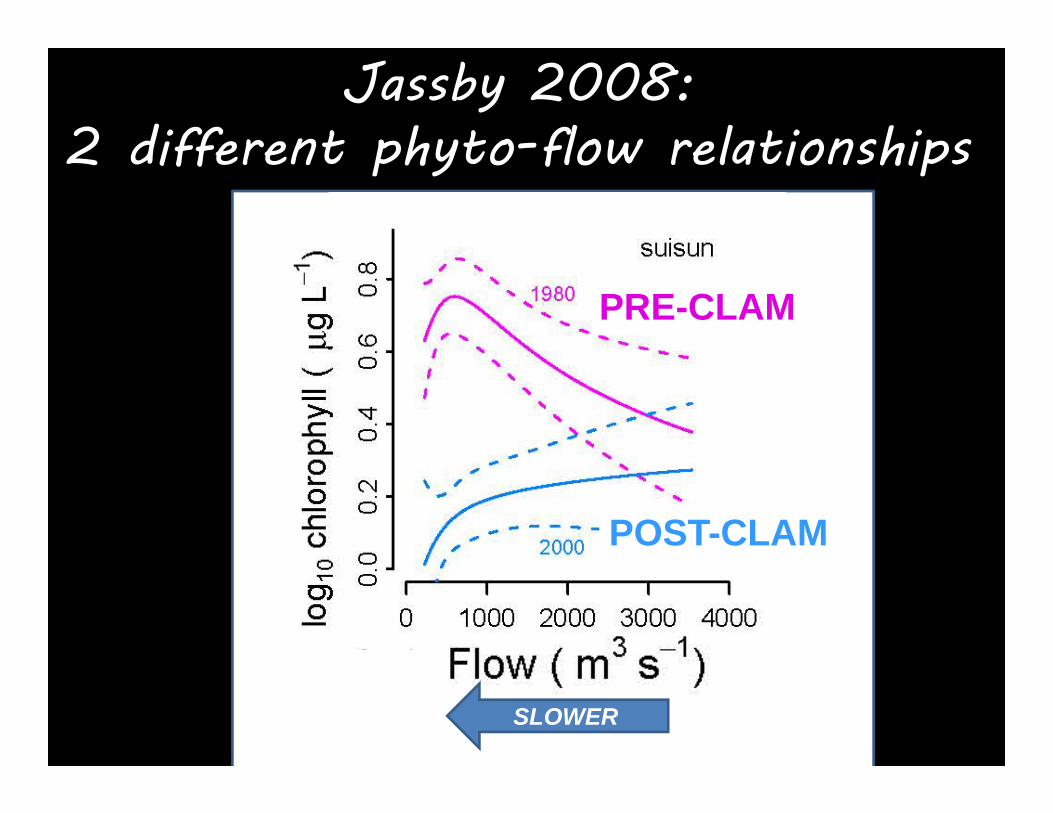
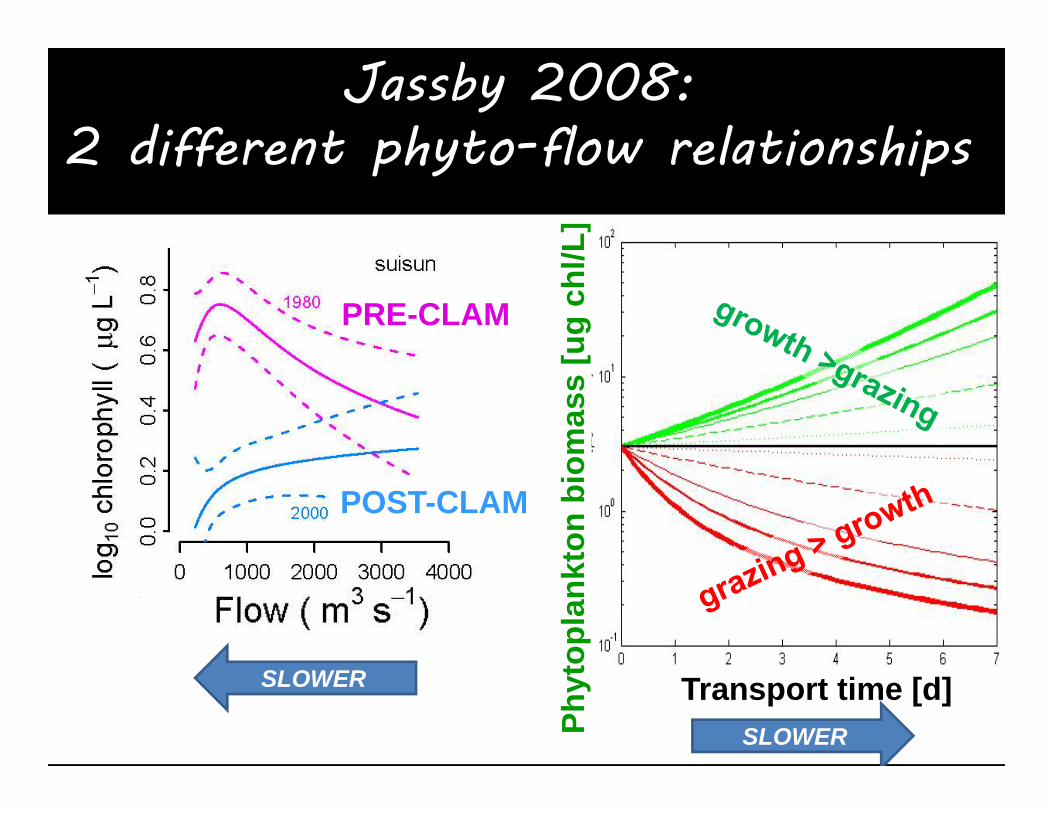
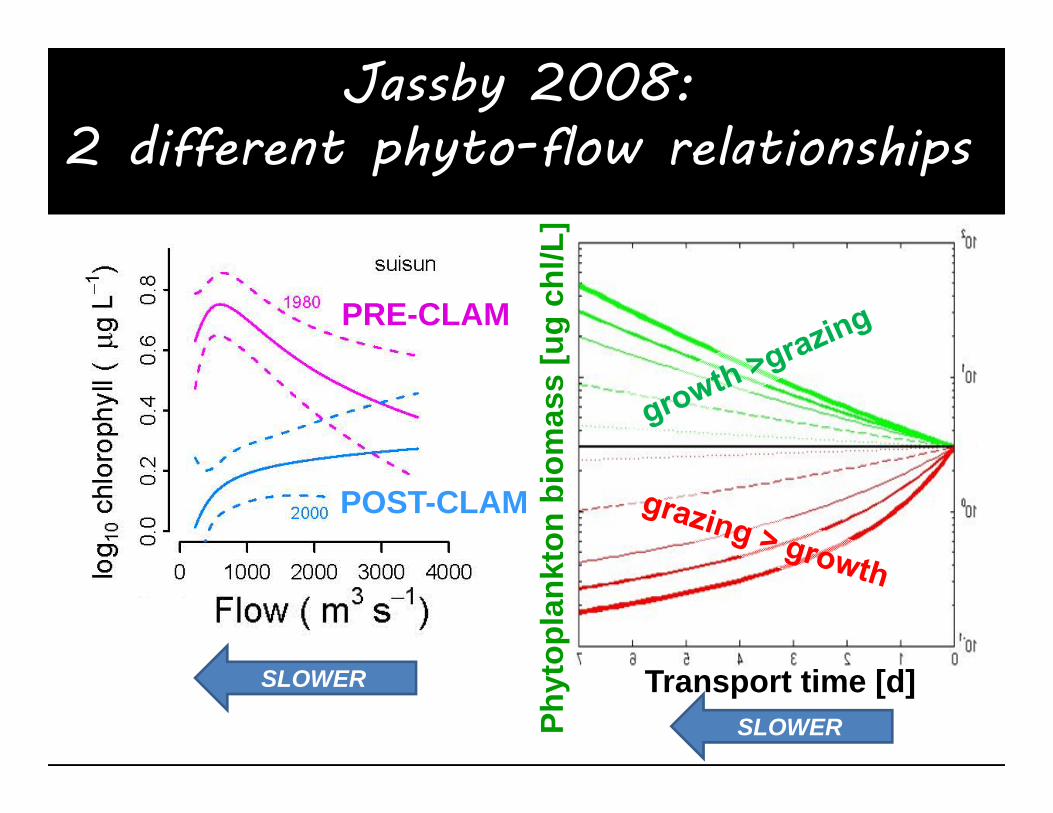
Jassby 2008: 2 different phyto-flow relationships
PRE-CLAM
POST-CLAM
SLOWER
Jassby 2008: 2 different phyto-flow relationships
PRE-CLAM
POST-CLAM
Phyt
opla
nkto
n bi
omas
s [u
gch
l/L]
Transport time [d]SLOWER
SLOWER
Jassby 2008: 2 different phyto-flow relationships
PRE-CLAM
POST-CLAMPh
ytop
lank
ton
biom
ass
[ug
chl/L
]
Transport time [d]SLOWER
SLOWER
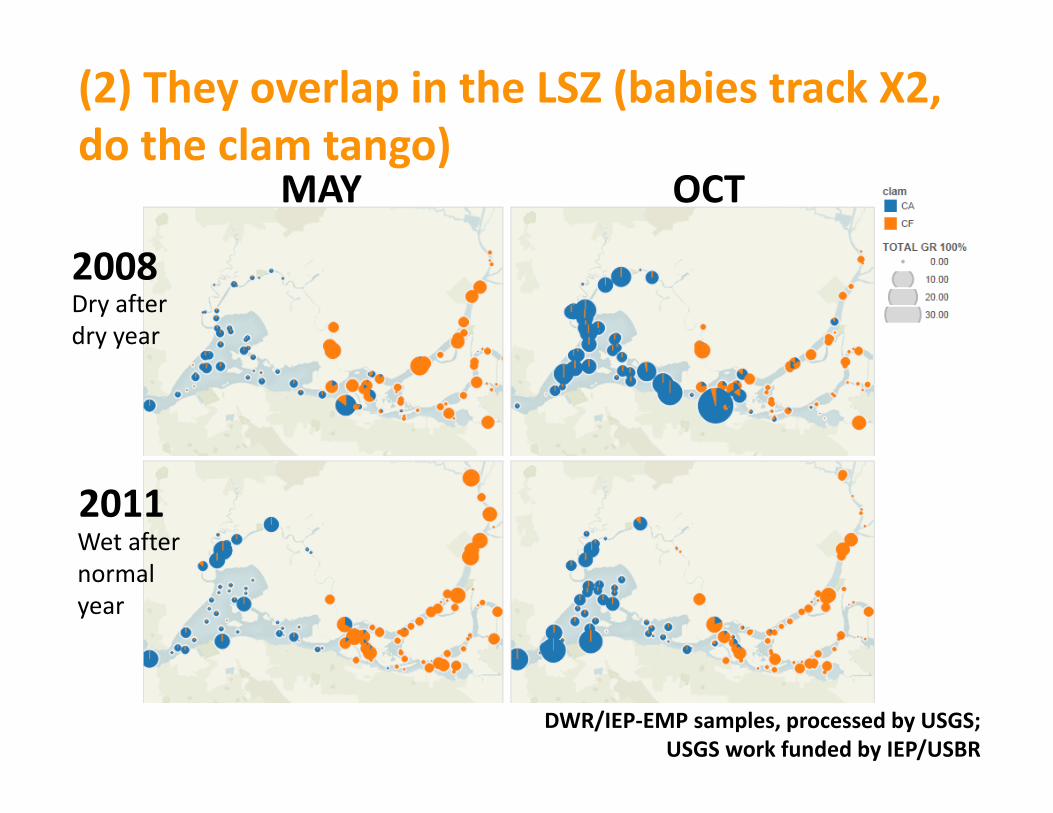
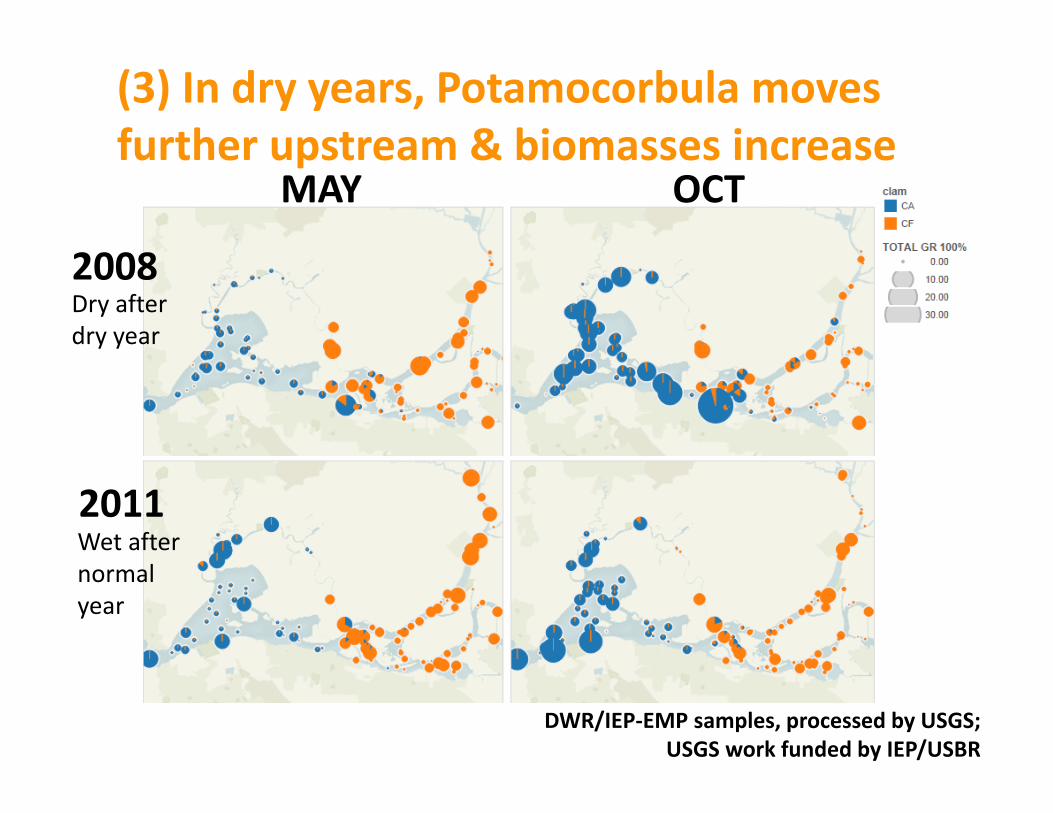
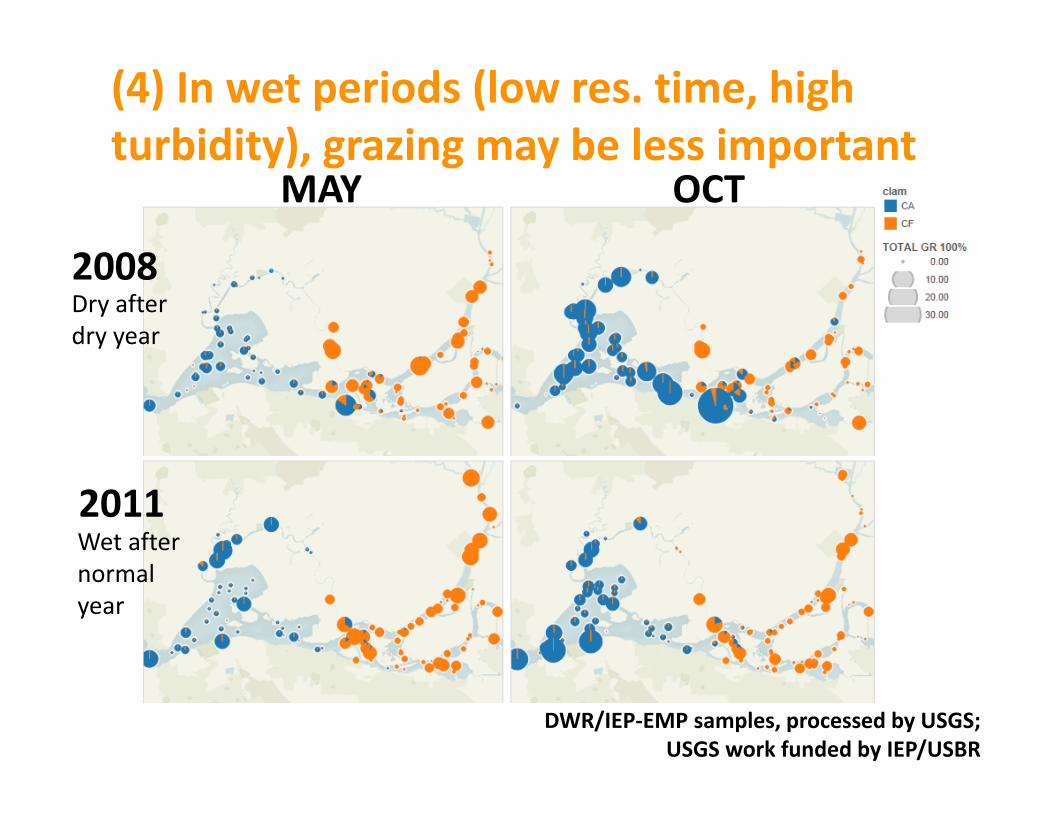
Wet after normal year
DWR/IEP‐EMP samples, processed by USGS; USGS work funded by IEP/USBR
2011
MAY OCT
Dry after dry year
2008
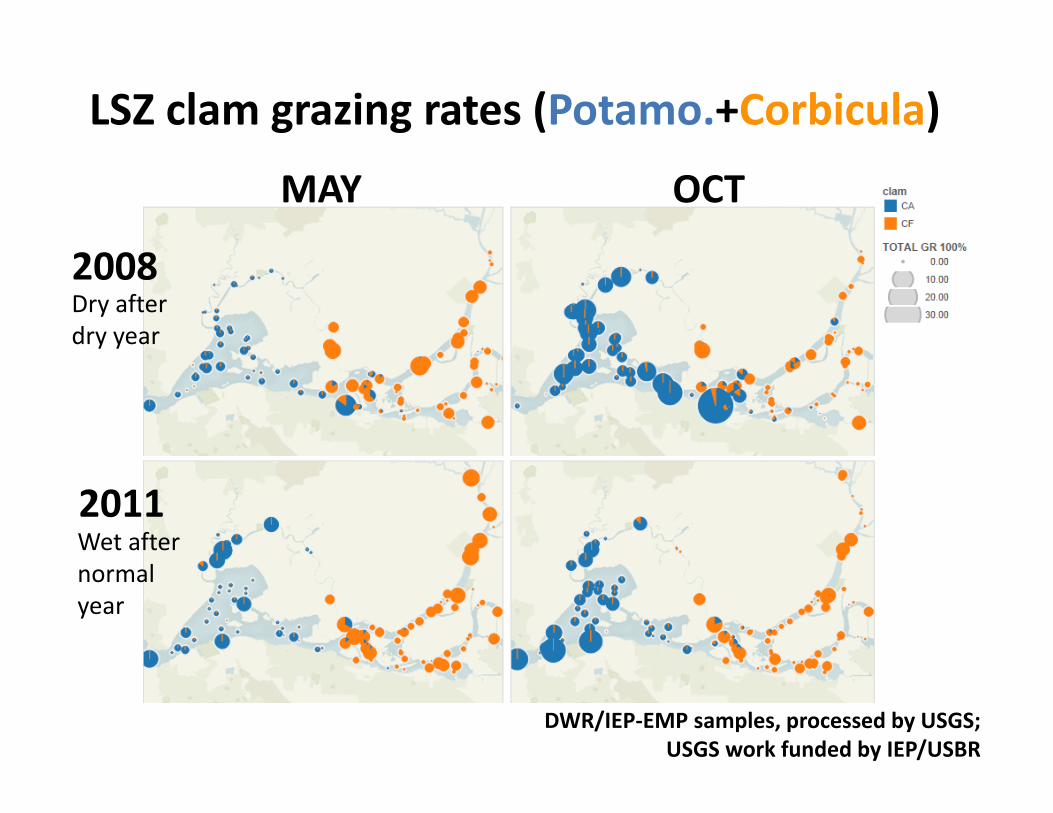
LSZ clam grazing rates (Potamo.+Corbicula)
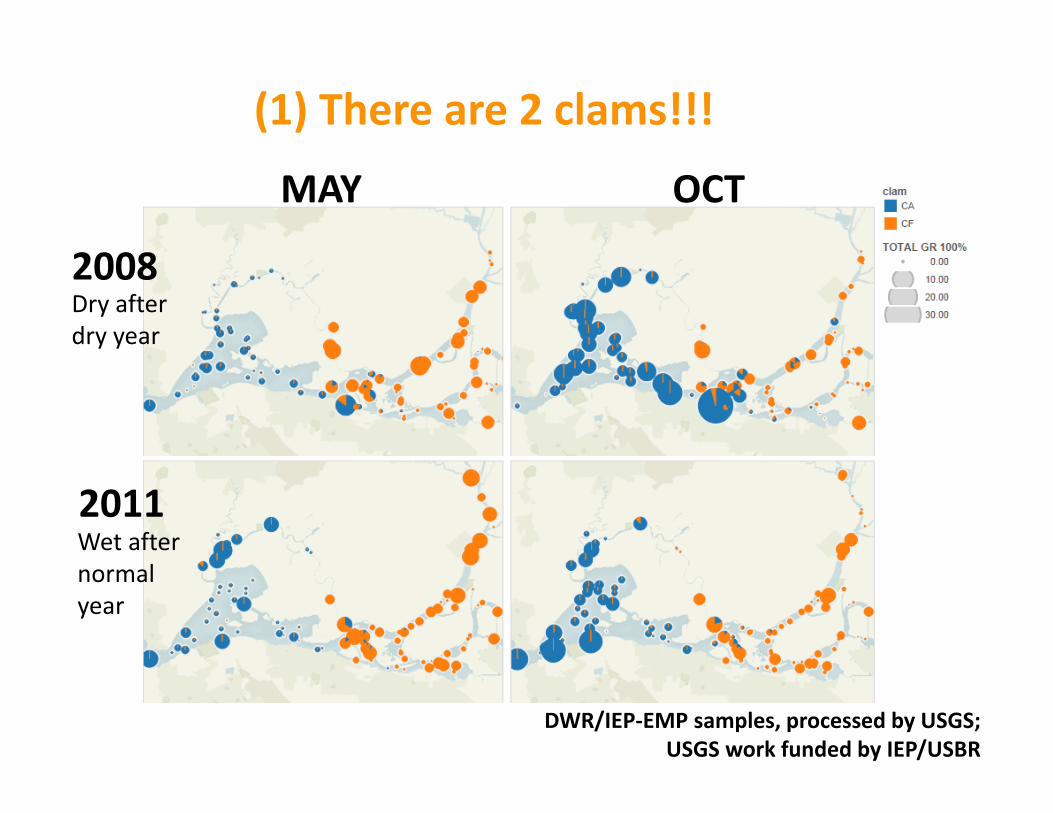
Wet after normal year
DWR/IEP‐EMP samples, processed by USGS; USGS work funded by IEP/USBR
2011
MAY OCT
Dry after dry year
2008
(1) There are 2 clams!!!
Wet after normal year
DWR/IEP‐EMP samples, processed by USGS; USGS work funded by IEP/USBR
2011
MAY OCT
Dry after dry year
2008
(2) They overlap in the LSZ (babies track X2, do the clam tango)
Wet after normal year
DWR/IEP‐EMP samples, processed by USGS; USGS work funded by IEP/USBR
2011
MAY OCT
Dry after dry year
2008
(3) In dry years, Potamocorbula moves further upstream & biomasses increase
Wet after normal year
DWR/IEP‐EMP samples, processed by USGS; USGS work funded by IEP/USBR
2011
MAY OCT
Dry after dry year
2008
(4) In wet periods (low res. time, high turbidity), grazing may be less important
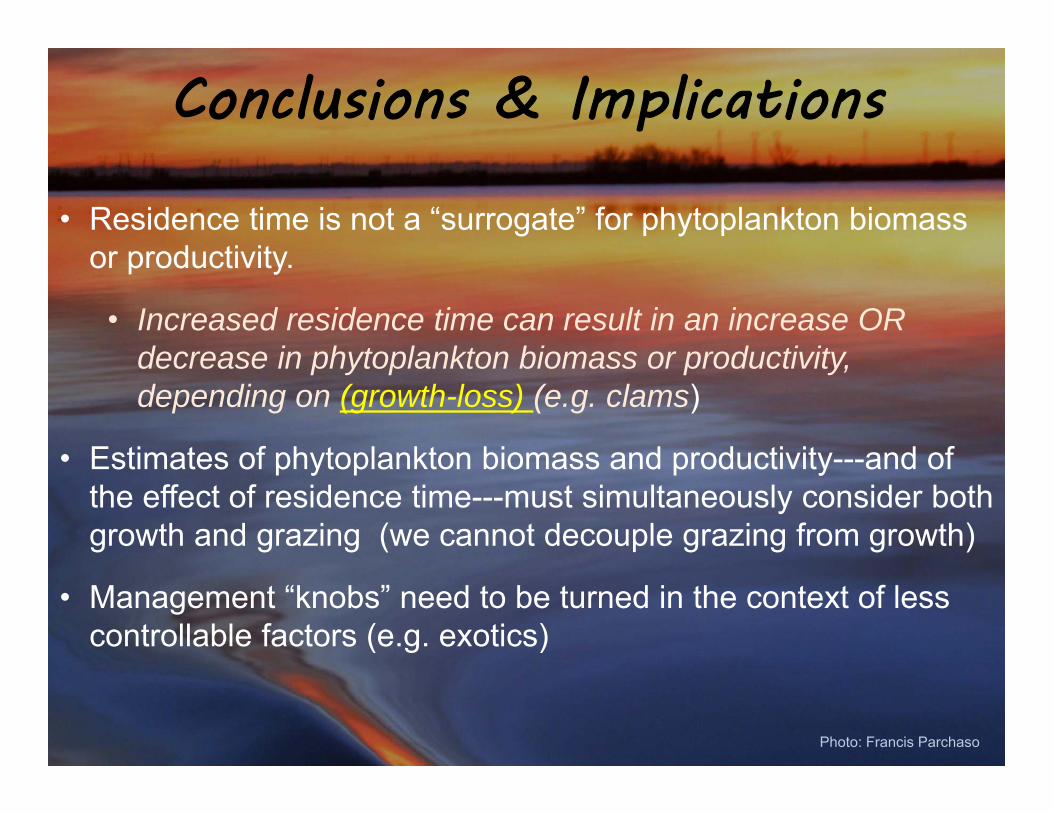
Conclusions & Implications
• Residence time is not a “surrogate” for phytoplankton biomass or productivity.
• Increased residence time can result in an increase OR decrease in phytoplankton biomass or productivity, depending on (growth-loss) (e.g. clams)
• Estimates of phytoplankton biomass and productivity---and of the effect of residence time---must simultaneously consider both growth and grazing (we cannot decouple grazing from growth)
• Management “knobs” need to be turned in the context of less controllable factors (e.g. exotics)
Photo: Francis Parchaso
Thank you
Jim CloernFrancis ParchasoCary LopezBill SobczakJon BurauTara SchragaAnke Mueller-SolgerMarc Vayssieres
Delta Stewardship Council/Delta Science Program
National Research ProgramPriority Ecosystem Science
Toxic Substances & Hydrology
Interagency Ecological ProgramPhoto: Francis Parchaso


