
Renewable Energy I:
Hydro, Geothermal, Wind, and Solar
AOSC 433/633 & CHEM 433/633
Ross Salawitch
Class Web Site: http://www.atmos.umd.edu/~rjs/class/spr2013
Next three lectures:
Pros and cons of meeting energy needs by means other than
combustion of fossil fuel
We’ll begin today by going over a few Course Logistics and afew loose ends
Lecture 20
23 April 2013
1Copyright © 2013 University of MarylandThis material may not be reproduced or redistributed, in whole or in part, without written permission from Ross Salawitch or Tim Canty
Course Logistics
• Course evaluation now open
− Everyone encouraged to participate :https://www.courseevalum.umd.edu/portal (open now to Friday night, 10 May)
• Problem Set #5 posted:− Due Thursday, 2 May
10 points per day late penalty; hard deadline 6 pm, 6 May (Mon)Allison will lead review of P Set #5 at 6 pm, 6 May (Mon)
• Problem Set #6 posted:− Due Tuesday, 7 May
20 points per day late penalty; hard deadline Thurs, 9 May (start of last class)
A few students will be asked to present P Set #6 in class on 9 May;
to be considered, must turn problem set in on time
• Projects:− Paper due Wed, 8 May
Presentation also on Wed, 8 May (evening); all are welcome to attendWe’ll be delighted to provide comments on either a draft of the paper and/orpresentation provided we have by start of class Tues, 7 May
2Copyright © 2013 University of MarylandThis material may not be reproduced or redistributed, in whole or in part, without written permission from Ross Salawitch or Tim Canty

Course Logistics
• Final Exam
− Wednesday, 15 May, 10:30 am to 12:30 pm
− This room− Format similar to prior exams− Closed book, no notes− Perhaps slight emphasis on material covered since last exam, but
entire course will be covered on the final exam
− Tim and Allison will be present to answer questions
− Lecture on Thus, 9 May 2013 will be a class review/final exam prep
3Copyright © 2013 University of MarylandThis material may not be reproduced or redistributed, in whole or in part, without written permission from Ross Salawitch or Tim Canty
World Energy & Electricity Supply
World Energy World Electricity
Nuclear6.8% Nuclear
14.5%
Olah et al., Beyond Oil and Gas: The Methanol Economy, 2006.
19.1%
1.1 %
World obtains ~80% of its energy & ~68% of its electricityfrom combustion of fossil fuels
4Copyright © 2013 University of MarylandThis material may not be reproduced or redistributed, in whole or in part, without written permission from Ross Salawitch or Tim Canty

World Electricity Generating Capacity:
Power (energy/time)
Total Source GW (year 2012)
Coal 1,627
Natural Gas 1,237
Hydro-electric 960
Wind 226
Other Renewable (Biomass)
173
Solar 41
Geothermal 12
Liquid Fossil Fuel 378
Nuclear 402
Total 5058
Source: http://www.eia.doe.gov/forecasts/ieo/ieo_tables.cfm
5Copyright © 2013 University of MarylandThis material may not be reproduced or redistributed, in whole or in part, without written permission from Ross Salawitch or Tim Canty
World Electricity Generating Capacity:
Power (energy/time)
Biomass
Geothermal
Wind
Solar
Source: http://www.eia.doe.gov/forecasts/ieo/ieo_tables.cfm
6Copyright © 2013 University of MarylandThis material may not be reproduced or redistributed, in whole or in part, without written permission from Ross Salawitch or Tim Canty

World Electricity Generating Capacity:
Power (energy/time)
Biomass
Geothermal
Wind
Solar
Source: http://www.eia.doe.gov/forecasts/ieo/ieo_tables.cfm
7Copyright © 2013 University of MarylandThis material may not be reproduced or redistributed, in whole or in part, without written permission from Ross Salawitch or Tim Canty
U.S. Electricity Supply: 2009
http://www.eia.doe.gov/cneaf/electricity/epa/epa_sum.html
U.S. obtains ~70% of its electricity from fossil fuels &~11% from sources other than fossil fuels + nuclear energy
8Copyright © 2013 University of MarylandThis material may not be reproduced or redistributed, in whole or in part, without written permission from Ross Salawitch or Tim Canty

Market Force #1: Cost of Fossil Fuel
25 Feb2011
20 Apr2013:$ 88
http://www.nytimes.com/2011/02/28/business/global/28oil.html
9Copyright © 2013 University of MarylandThis material may not be reproduced or redistributed, in whole or in part, without written permission from Ross Salawitch or Tim Canty
Residential Electricity Cost, United States
http://www.eia.doe.gov/forecasts/steo/report/electricity.cfm
10Copyright © 2013 University of MarylandThis material may not be reproduced or redistributed, in whole or in part, without written permission from Ross Salawitch or Tim Canty
Cl Cl
O
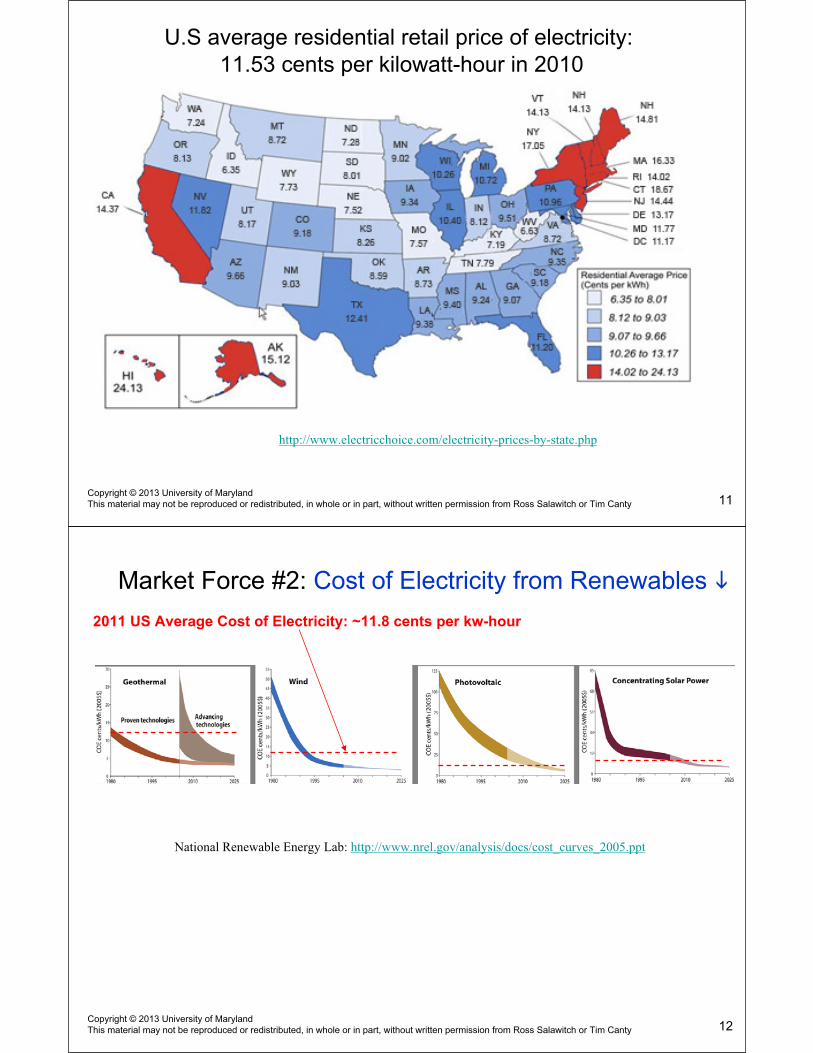
U.S average residential retail price of electricity:11.53 cents per kilowatt-hour in 2010
http://www.electricchoice.com/electricity-prices-by-state.php
11Copyright © 2013 University of MarylandThis material may not be reproduced or redistributed, in whole or in part, without written permission from Ross Salawitch or Tim Canty
Market Force #2: Cost of Electricity from Renewables
2011 US Average Cost of Electricity: ~11.8 cents per kw-hour
National Renewable Energy Lab: http://www.nrel.gov/analysis/docs/cost_curves_2005.ppt
12Copyright © 2013 University of MarylandThis material may not be reproduced or redistributed, in whole or in part, without written permission from Ross Salawitch or Tim Canty

Hydro
13Copyright © 2013 University of MarylandThis material may not be reproduced or redistributed, in whole or in part, without written permission from Ross Salawitch or Tim Canty
• World’s largest renewable energy source for production of electricity− 17% of world’s electricity needs
− Nearly 100% of electricity in Norway, Uruguay, and Paraguay
− Canada: 50% US: ~7% in 2005
• Technology very mature
• Only ~20% of world overall potential being tapped
Olah et al., Beyond Oil and Gas: The Methanol Economy, 2006.
Largest Capacities:• Itaipú, Paraná River, South America: 14,000 MW
− Built 1975 to 1991− Volume of iron and steel: enough to build 380 Eiffel Towers− Volume of concrete :15 × that of Channel Tunnel between France and England
• Three Gorges Dam, Yangtze River, China: 22,500 MW− Fully operational in 2012− Cost: $22.5 billion or 1 million $ / MW− Largest construction project in China since Great Wall
− 1 million people displaced − Provides 3.0% of China’s electricity needs
Source:
14Copyright © 2013 University of MarylandThis material may not be reproduced or redistributed, in whole or in part, without written permission from Ross Salawitch or Tim Canty
http://en.wikipedia.org/wiki/Three_Gorges_Dam
Hydro
http://ga.water.usgs.gov/edu/hybiggest.html
Typical coal plant: 670 MWTypical nuclear plant: 1000 MW
second
Three Gorges Dam

HydroEnvironmental Ledger
• Positive:− No NOx and SOx during operation− CO2 release only during construction (page 90, Olah et al.)
• Negative:− Flooding: over 1 million people displaced by Three Gorge Dam− Soil fertility: High Aswan Dam in Egypt has resulted in fertile silt collecting
at bottom of Lake Nassar, necessitating use of 1×10⁶ tons of fertilizer− GHG emissions from lost forest and decaying biomass under dammed water
http://ga.water.usgs.gov/edu/hyhowworks.html
http://www.springerlink.com/content/k30639u4n8pl5266/
http://www.newscientist.com/article.ns?id=dn7046
15Copyright © 2013 University of MarylandThis material may not be reproduced or redistributed, in whole or in part, without written permission from Ross Salawitch or Tim Canty
Hydro
• Negative:− Flooding: over 1 million people displaced by Three Gorge Dam− Soil fertility: High Aswan Dam in Egypt has resulted in fertile silt collecting
at bottom of Lake Nassar, necessitating use of 1×10⁶ tons of fertilizer− GHG emissions from lost forest and decaying biomass under dammed water
http://www.springerlink.com/content/k30639u4n8pl5266/
http://www.newscientist.com/article.ns?id=dn7046
16Copyright © 2013 University of MarylandThis material may not be reproduced or redistributed, in whole or in part, without written permission from Ross Salawitch or Tim Canty

Top Hydropower Producing States, 2011
• Over half of the total U.S. hydroelectric capacity for electricity generationconcentrated in three States (Washington, Oregon, and California)
• ~30% in Washington, location of the largest hydroelectric facility:Grand Coulee Dam.
http://www.eia.doe.gov/kids/energy.cfm?page=hydropower_home-basics-k.cfm
17Copyright © 2013 University of MarylandThis material may not be reproduced or redistributed, in whole or in part, without written permission from Ross Salawitch or Tim Canty
Wind• Fastest growing renewable resource: 30% per year from 1992 to 2004
• Germany: 29,000 MW capacity, generating 8% of country’s electricity
− Europe dominates wind energy turbine market
• Turbine capability has increased dramatically past 20 years:
−Went from 20 m diameter generating 20-60 kW to 100 m diameter generating 2 MW
About ~4.5% of world energy production capacity
173Other Renewable
(Biomass)
12Geothermal
41Solar
226Wind
960Hydro-electric
378Liquid Fossil Fuel
1,237Natural Gas
5058Total
402Nuclear
1,627Coal
GW (year 2012)Total Source
173Other Renewable
(Biomass)
12Geothermal
41Solar
226Wind
960Hydro-electric
378Liquid Fossil Fuel
1,237Natural Gas
5058Total
402Nuclear
1,627Coal
GW (year 2012)Total Source
18Copyright © 2013 University of MarylandThis material may not be reproduced or redistributed, in whole or in part, without written permission from Ross Salawitch or Tim Canty

Wind Power Potential, World• Wind power varies as [Wind Velocity]3 :
− Betz law: http://en.wikipedia.org/wiki/Betz%27_law
− Installation benefits from accurate knowledge of wind fields
• Potential electricity generation from "sustainable Class 3 winds" is 72 Terawatts!
• Installation of ~5 Terawatts (current global electricity capacity) requiresharnessing only a fraction of this potential with current turbine technology
Archer and Jacobson, JGR, 2006
19Copyright © 2013 University of MarylandThis material may not be reproduced or redistributed, in whole or in part, without written permission from Ross Salawitch or Tim Canty
Wind• Wind power varies as [Wind Velocity]3 :
− Betz law: http://en.wikipedia.org/wiki/Betz%27_law
− Installation benefits from accurate knowledge of wind fields
http://rredc.nrel.gov/wind/pubs/atlas/maps/chap2/2-01m.html
20Copyright © 2013 University of MarylandThis material may not be reproduced or redistributed, in whole or in part, without written permission from Ross Salawitch or Tim Canty
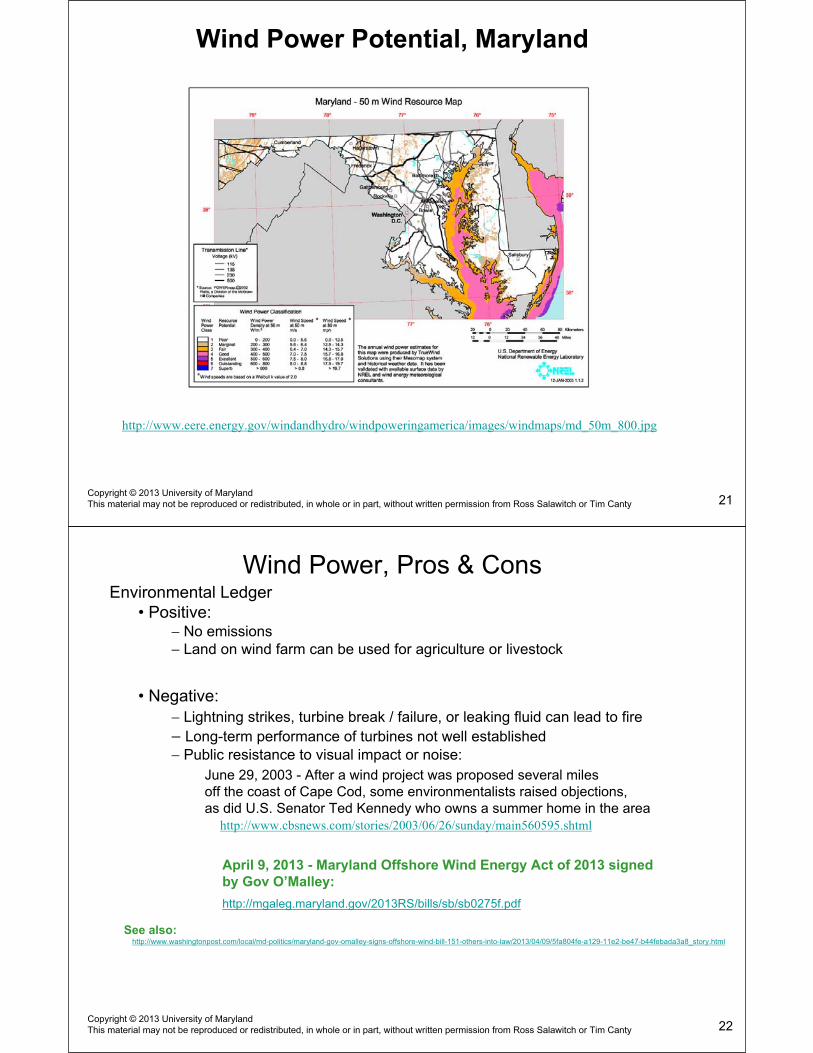
Wind Power Potential, Maryland
http://www.eere.energy.gov/windandhydro/windpoweringamerica/images/windmaps/md_50m_800.jpg
21Copyright © 2013 University of MarylandThis material may not be reproduced or redistributed, in whole or in part, without written permission from Ross Salawitch or Tim Canty
Wind Power, Pros & ConsEnvironmental Ledger
• Positive:− No emissions− Land on wind farm can be used for agriculture or livestock
• Negative:− Lightning strikes, turbine break / failure, or leaking fluid can lead to fire
− Long-term performance of turbines not well established− Public resistance to visual impact or noise:
June 29, 2003 - After a wind project was proposed several milesoff the coast of Cape Cod, some environmentalists raised objections, as did U.S. Senator Ted Kennedy who owns a summer home in the area
http://www.cbsnews.com/stories/2003/06/26/sunday/main560595.shtml
April 9, 2013 - Maryland Offshore Wind Energy Act of 2013 signed by Gov O’Malley:
http://mgaleg.maryland.gov/2013RS/bills/sb/sb0275f.pdf
See also:http://www.washingtonpost.com/local/md-politics/maryland-gov-omalley-signs-offshore-wind-bill-151-others-into-law/2013/04/09/5fa804fe-a129-11e2-be47-b44febada3a8_story.html
22Copyright © 2013 University of MarylandThis material may not be reproduced or redistributed, in whole or in part, without written permission from Ross Salawitch or Tim Canty
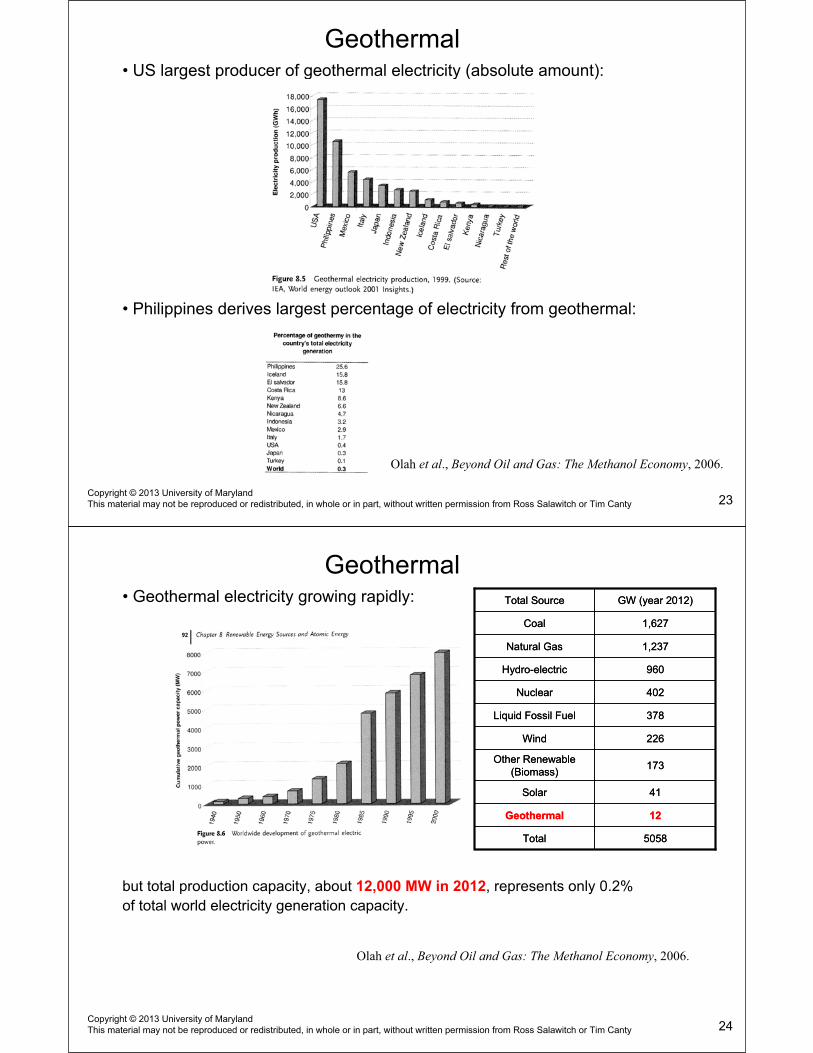
Geothermal• US largest producer of geothermal electricity (absolute amount):
• Philippines derives largest percentage of electricity from geothermal:
Olah et al., Beyond Oil and Gas: The Methanol Economy, 2006.
23Copyright © 2013 University of MarylandThis material may not be reproduced or redistributed, in whole or in part, without written permission from Ross Salawitch or Tim Canty
Geothermal• Geothermal electricity growing rapidly:
but total production capacity, about 12,000 MW in 2012, represents only 0.2%
of total world electricity generation capacity.
173Other Renewable
(Biomass)
12Geothermal
41Solar
226Wind
960Hydro-electric
378Liquid Fossil Fuel
1,237Natural Gas
5058Total
402Nuclear
1,627Coal
GW (year 2012)Total Source
173Other Renewable
(Biomass)
12Geothermal
41Solar
226Wind
960Hydro-electric
378Liquid Fossil Fuel
1,237Natural Gas
5058Total
402Nuclear
1,627Coal
GW (year 2012)Total Source
Olah et al., Beyond Oil and Gas: The Methanol Economy, 2006.
24Copyright © 2013 University of MarylandThis material may not be reproduced or redistributed, in whole or in part, without written permission from Ross Salawitch or Tim Canty

Geothermal• Temperature of source critical:
− dry steam (T > 220°C) most profitable− hot water (150 to 300°C) can generate electricity using “flash steam”
(depressurization and boiling)−low temperature (T < 150°C) used for heat (Iceland) or to extract H2 from H2O or
fossil fuels
Where will favorable conditions for geothermal most likely be found?
http://geothermal.inel.gov/publications/future_of_geothermal_energy.pdf
25Copyright © 2013 University of MarylandThis material may not be reproduced or redistributed, in whole or in part, without written permission from Ross Salawitch or Tim Canty
Geothermal• Margins of tectonic plates most favorable
(1) Geothermal fields producing electricity(2) mid-oceanic ridges crossed by transform faults (long transversal fractures)(3) subduction zones, where the subducting plate bends downwards and melts
in the asthenosphere (~100 to 200 km below surface)
http://iga.igg.cnr.it/geo/geoenergy.php
26Copyright © 2013 University of MarylandThis material may not be reproduced or redistributed, in whole or in part, without written permission from Ross Salawitch or Tim Canty

Geothermal• Temperature of source critical:
− dry steam (T > 220°C) most profitable− hot water (150 to 300°C) can generate electricity using “flash steam”
(depressurization and boiling)−low temperature (T < 150°C) used for heat (Iceland) or to extract H2 from H2O or
fossil fuels
Map of U.S. Water Temperature
Water Temperature, 6 km depth
http://www1.eere.energy.gov/geothermal/geomap.html
27Copyright © 2013 University of MarylandThis material may not be reproduced or redistributed, in whole or in part, without written permission from Ross Salawitch or Tim Canty
Geothermal Heating
About 95% of the buildings in Reykjavik are heated with geothermal water. Reykjavik is one of the cleanest cities in the world.
http://geothermal.marin.org/geopresentation/sld095.htm
28Copyright © 2013 University of MarylandThis material may not be reproduced or redistributed, in whole or in part, without written permission from Ross Salawitch or Tim Canty

Low Earth Geothermal Heating
Winter: pump drives fluid to transfer energy from ground to building
http://geothermal.marin.org/geopresentation/sld102.htm
29Copyright © 2013 University of MarylandThis material may not be reproduced or redistributed, in whole or in part, without written permission from Ross Salawitch or Tim Canty
Geothermal Heating/Cooling
Geo-thermal heating/cooling at local church:
Paint Branch Unitarian / Universalist, Adelphi, Md
30Copyright © 2013 University of MarylandThis material may not be reproduced or redistributed, in whole or in part, without written permission from Ross Salawitch or Tim Canty

• Everything you ever wanted to know about Geothermal electricity:http://geothermal.inel.gov/publications/future_of_geothermal_energy.pdf
• Claim: geothermal is a largely untapped resource for electricity in the US− improvements in deep drilling and management of water flow within wells needed
• Strong association of electricity production and price:
Geothermal
GETEM: Geothermal Electric Technology Evaluation ModelEGS: Enhanced Geothermal Systems: i.e., engineered reservoirs that have been
created to extract economical amounts of heat from geothermal resources
31Copyright © 2013 University of MarylandThis material may not be reproduced or redistributed, in whole or in part, without written permission from Ross Salawitch or Tim Canty
Solar PV
• Sun delivers about 10,000 times more energy than world consumption
• Photovoltaic: converts solar energy into electricity
− photovoltaic effect: Nobel Prize in went 1921 to __________
− solar cells developed in 1960s for military and satellites
− crystals from silicon, cadmium, copper, arsenic, etc
− efficiency increased from 15% in mid-1970s to ~25% today
• PV capacity increased 30% per year from 1990 to 2004:
Year Solar MW
2005 4,267
2006 6,274
2010 25,249
2011 32,710
2007 8,535
2008 13,992
2009 18,275
2012 41,180
World Capacity
All Sources, 20125,058,000
Recent Trends
0.8% of world electricity capacity
0.1% of world electricity capacity
32Copyright © 2013 University of MarylandThis material may not be reproduced or redistributed, in whole or in part, without written permission from Ross Salawitch or Tim Canty

Solar PV Efficiency
MaterialLaboratoryEfficiency
ProductionEfficiency
MonocrystallineSilicon
24 % 14 to 17 %
Polycrystalline
Silicon
18 % 13 to 15%
Amorphous
Silicon
13 % 5 to 7 %
In Oct 2010, efficiency of 42.3% reachedusing a triple junction cell array.
http://optics.org/news/1/5/5
Limited Efficiency
Limited spectral range of effective photons (depends on material used)
Use arrays of cells made of different materials to cover broaderspectral range.
Surplus energy transformed into heat
Use mirrors and lenses to focus more light onto cell
Optical losses from shadowing and/or reflection
Structure the surface so reflected light hits another cell
33Copyright © 2013 University of MarylandThis material may not be reproduced or redistributed, in whole or in part, without written permission from Ross Salawitch or Tim Canty
http://www.solarserver.de/wissen/photovoltaik-e.html
Concentrated Solar Power (CSP)• Parabolic mirrors heat fluid that drives Stirling engine
− Fluid is permanently contained within the engine's hardware
− Converts heat to energy
− Theoretical efficiencies often challenging to achieve
http://en.wikipedia.org/wiki/Stirling_engine
• Highest electrical efficiencies for solar → lowest costs!
http://www.powerfromthesun.net/Book
http://www.oilcrisis.com/us/ca/CaliforniaCSP_Benefits200604.pdf
Kramer Junction, Calif
Fully operational in 1991: 350 MW capacity
Low output in 1992 due to Pinatubo aerosol!
Present operating cost: ~11 ¢ / kWh
Nevada Solar One
Output: 64 MW capacity / 134,000 MW-hr / year
Could supply all US electricity needsif built over a ~ 130 mile × 130 mile area
Construction cost: ~$2 / kW-hr for one yr’s prod
34Copyright © 2013 University of MarylandThis material may not be reproduced or redistributed, in whole or in part, without written permission from Ross Salawitch or Tim Canty

Renewable Energy Portfolio Standard (RPS)
29 States have a RPS mandating that a certain % of electricity must begenerated using renewable sources by a particular year
http://www.dsireusa.org/documents/summarymaps/RPS_map.pdf
35Copyright © 2013 University of MarylandThis material may not be reproduced or redistributed, in whole or in part, without written permission from Ross Salawitch or Tim Canty
Renewable Energy Credits (RECs)
• Property right to 1 megawatt-hour (MWh) of electricity generated by a renewable source
• Sold on the open market
• Designed to facilitate achievement of state RPS
States can mandate that utilities either generate electricity using renewable sources
(in which cases RECs are not sold but rather “retired”) or purchase RECs
• Maryland RECs:
Tier I: Solar: ~$200/SREC
Non-Solar (wind, biomass, etc.): ~$1/REC
Tier II: Hydro only (expiring)
36Copyright © 2013 University of MarylandThis material may not be reproduced or redistributed, in whole or in part, without written permission from Ross Salawitch or Tim Canty
http://www.dsireusa.org/documents/summarymaps/RPS_map.pdf

Renewable Energy Credits (RECs)Maryland RECs:
Tier I: Solar: ~$200/SREC
Non-Solar (wind, biomass, etc.): ~$1/REC
Tier II: Hydro only (expiring)
Maryland Compliance Requirements:
http://www.dsireusa.org/incentives/incentive.cfm?Incentive_Code=MD05R&re=1&ee=1
37Copyright © 2013 University of MarylandThis material may not be reproduced or redistributed, in whole or in part, without written permission from Ross Salawitch or Tim Canty
SREC pricesSolar Renewable Energy Credit (SREC) Prices
2010-03 $ 225
2011-03
2012-03
2013-04
2010-03 $ 390
2011-03 $ 181Pennsylvania
2013-03 $ 10
2010-03 $ 290
2011-03 $ 200
2012-03 $ 275
2012-03 $ 15
2011-03
2012-03Maryland
2013-03 $ 132
2010-03 $ 250
Washington, DC
2013-03
$ 163
$ 40
n.a.
$ 275
$ 218
Delaware
$ 381
March 2013 SREC prices, otherstates:
Mass : $ 220NJ : $ 112
Ohio : $ 40 (in state)
http://srectrade.com/srec_prices.php
38Copyright © 2013 University of MarylandThis material may not be reproduced or redistributed, in whole or in part, without written permission from Ross Salawitch or Tim Canty

Renewable Energy Credit (REC) Prices
http://apps3.eere.energy.gov/greenpower/markets/certificates.shtml?page=5
39Copyright © 2013 University of MarylandThis material may not be reproduced or redistributed, in whole or in part, without written permission from Ross Salawitch or Tim Canty
UMd Climate Action Plan
Update to http://www.sustainability.umd.edu/documents/2010_Campus_Sustainability_Report.pdf
40Copyright © 2013 University of MarylandThis material may not be reproduced or redistributed, in whole or in part, without written permission from Ross Salawitch or Tim Canty


