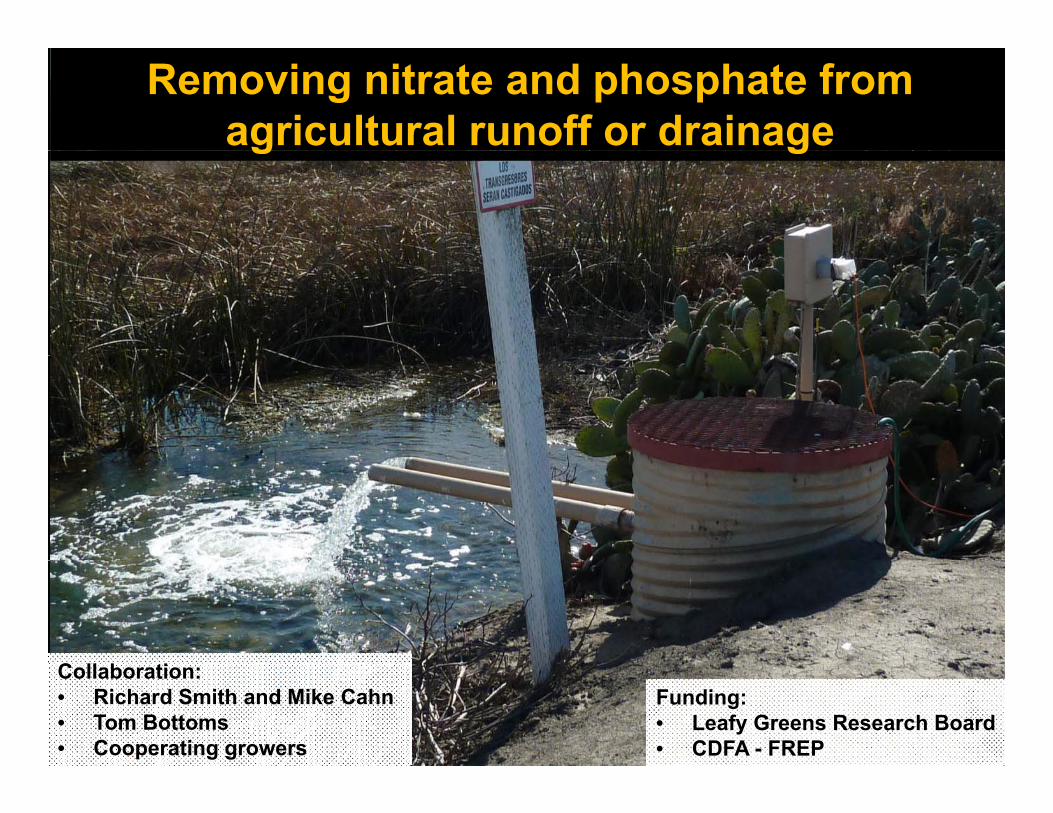
Removing nitrate and phosphate from agricultural runoff or drainageg g
CCollaboration:• Richard Smith and Mike Cahn• Tom Bottoms• Cooperating growers
Funding:• Leafy Greens Research Board• CDFA - FREP

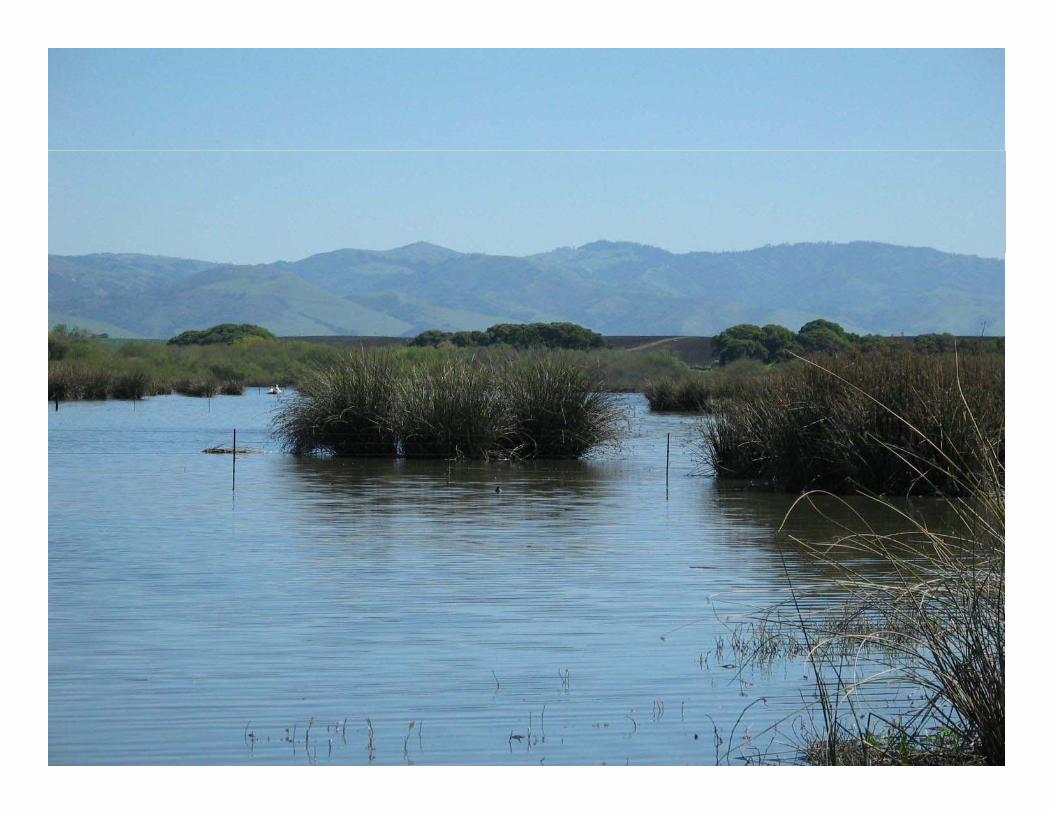
Surface water monitoring shows high NO3-N is common…

Irrigation and fertilization practices can be improved …
I il NO N t ti Upgrade irrigation efficiencyIn‐season soil NO3‐N testing Upgrade irrigation efficiency
Grow winter cover where practical
… but some wastewater remediation will likely be needed toconsistently meet environmental targets

What remediation practices can remove soluble nutrients ?Conservation practices that remove sediment are generallyConservation practices that remove sediment are generally
ineffective in removing soluble nutrients
Biological denitrification has potential
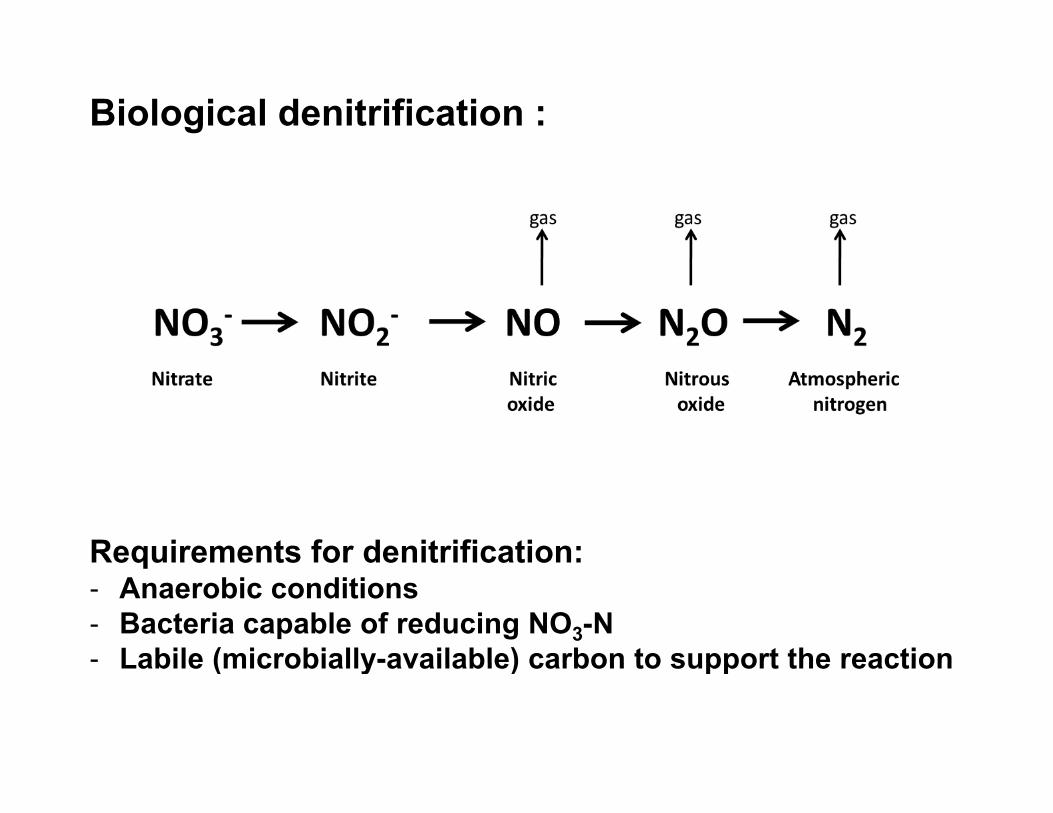
Biological denitrification :
Requirements for denitrification:Requirements for denitrification:- Anaerobic conditions- Bacteria capable of reducing NO3-N- Labile (microbially-available) carbon to support the reactionLabile (microbially available) carbon to support the reaction

Denitrification occurs in wetlands, but …denitrification rate is usually limited by carbon availability, meaning that nitrate removal per unit land area is lowthat nitrate removal per unit land area is lowwildlife attraction can raise microbial food safety concerns
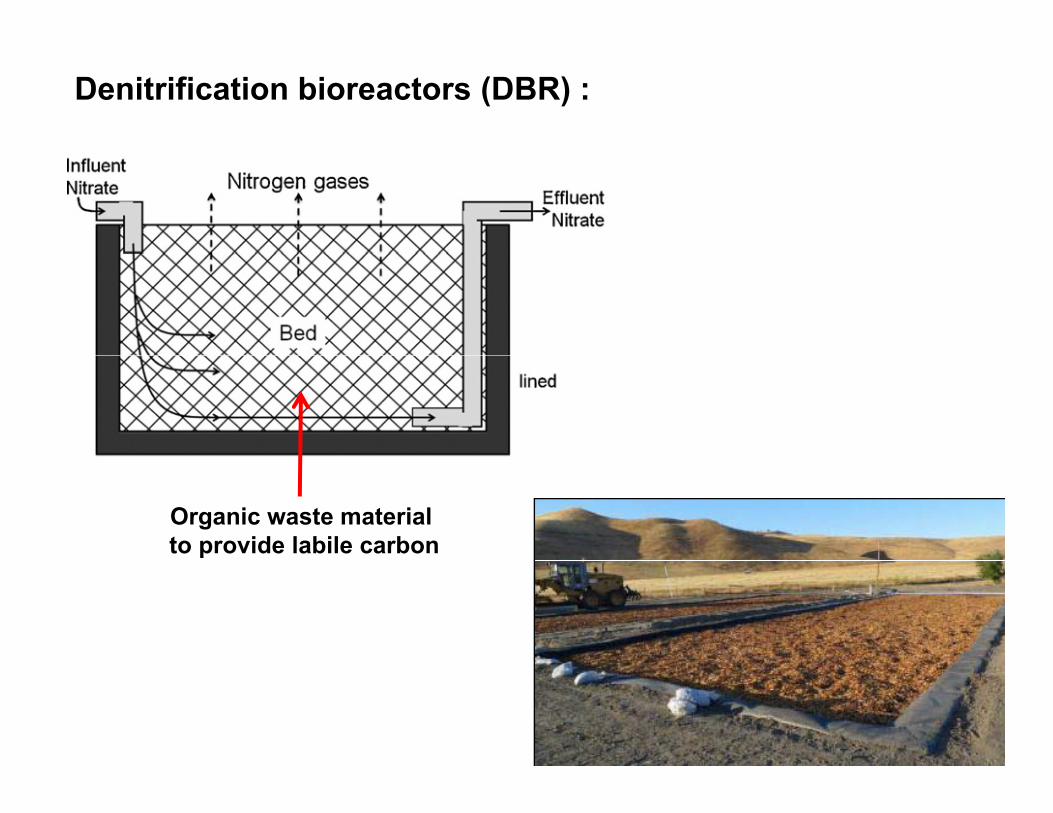
Denitrification bioreactors (DBR) :
Organic waste materialto provide labile carbon

Building a DBR Salinas Valley, 2011 :
chipped construction wood fromMonterey Regional Waste
Management District
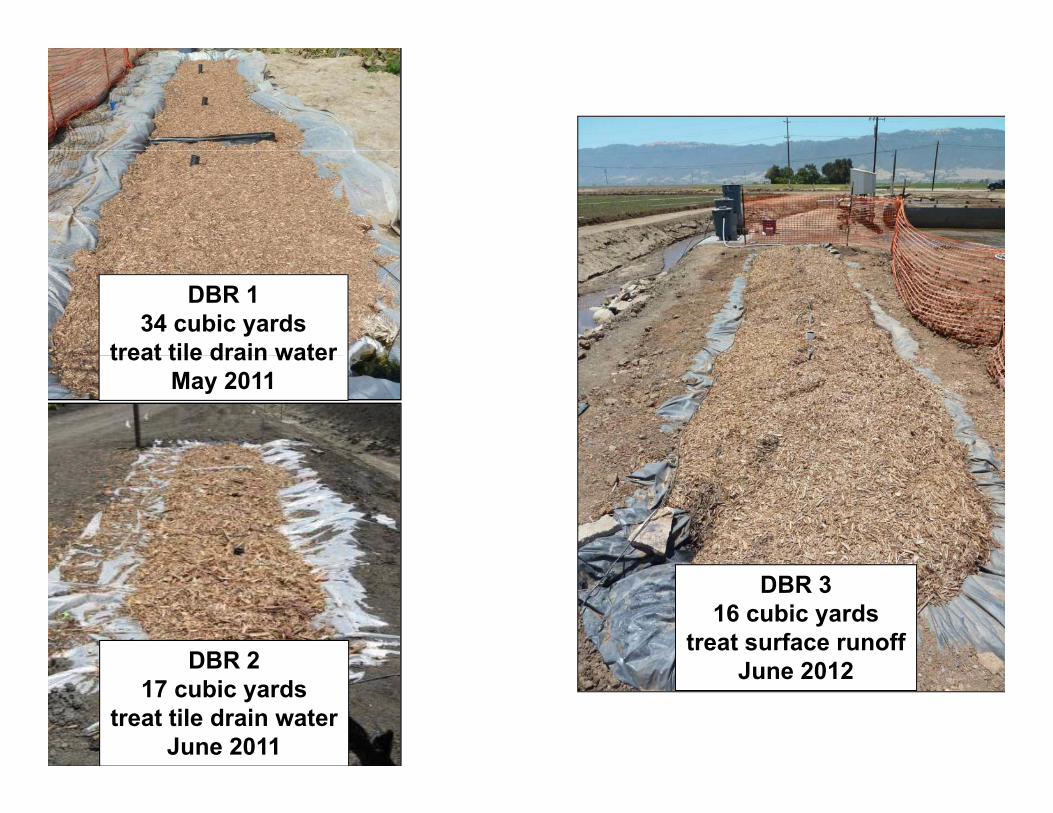
DBR 134 cubic yards
treat tile drain watertreat tile drain waterMay 2011
DBR 2
DBR 316 cubic yards
treat surface runoffJ 2012DBR 2
17 cubic yardstreat tile drain water
June 2011
June 2012

Continuous pumping into DBRs from tile drain sump or tailwater pond
DBR outlet drains into surface ditch after approximately 2 days of residence time

• Surface water pretreated with polyacrylamide (PAM) to keep sediment out of the bioreactor

Moderate temperature allows denitrification all year :
24Sit 1
re (C
o ) 20
22Site 1Site 2Site 3 Surface water
empe
ratur
14
16
18Tile effluent
Te
10
12
14
Date
Jun
Jul
Aug
Sep
Oct
Nov
De
c
Jan
Feb
Mar
Apr
May
Jun
Jul
Aug
Sep
Oct
2011 2012Date

DBR performance on tile drain effluent :
Denitrification rates achieved
Summer average:≈ 8 PPM NO3-N / day
Winter average:Winter average:≈ 5 PPM NO3-N / day

DBR performance on surface runoff :
50
60InletOutlet
mg L‐1)
40
50 Outlet
NO3‐N (m
20
30
0
10
Date
Jun Jul Aug Sep Oct Nov
Irrigation season average:≈ 11-13 PPM NO3-N / day

DBR performance on surface runoff :What about PO4-P ?4• Aluminum sulfate (alum) was injected during portions of 2012
(shaded area)
0.8
1.0
P (m
g L‐1)
0.6 Runoff pond Bioreactor inlet
PO4‐P
0.2
0.4 Bioreactor outlet
Jun Jul Aug Sep Oct Nov 0.0
Salinas TMDL summer target0.07 PPM
• Both alum and bioreactor treatment appear to remove PO4-PDate

Are there environmental issues with DBRs ?nitrous oxide (N O) releasenitrous oxide (N2O) release
‐ high per unit land area, small as a % of N denitrifieddissolved organic carbon (DOC) and tannins in DBR effluentg ( )
‐ effluent may need to be recycled on‐farm in the initialweeks of operation

Are there microbial food safety implications?No exposed water = no wildlife attractionNo exposed water = no wildlife attraction

Is a commercial scale DBR feasible ?Based on a year around operation:Based on a year-around operation:
at an average of 6 PPM NO3-N removal per day of residence time, a DBR has the theoretical capacity to remove about 3 lb N / yd3 of volume annually; operational capacity probably lessvolume annually; operational capacity probably lessunder commercial conditions, a DBR 50 x 100 x 5 ft could probably remove at least 2,000 lb N annuallycosts are probably between $1 - 4 per lb of NO3-N denitrifiedmanagement practice changes would still be needed to come close to meeting environmental goals, particularly with tile drain effluent