RELIABILITY ANALYSIS OF DISTRIBUTION NETWORK
ROYSTONE ANTHONY
A project report submitted in
fullfillment of the requirement for the award of the
Degree of Master of Electrical Engineering
Faculty of Electrical and Electronic Engineering
Universiti Tun Hussein Onn Malaysia
JULY 2014
iv
Abstract
The knowledge of the reliability of distribution networks and systems is important
consideration in the system planning and operations for development and
improvements of power distribution systems. To achieve the target as minimum
interruptions as possible to customers, utilities must strive to improve the reliability
but at the same time reduce cost. It is a known fact that most of customer
interruptions are caused by the failure in distribution system. However, valid data are
not easy to collect and the reliability performance statistic not easy to obtain. There is
always uncertainty associated with the distribution network reliability. For evaluation
and analysis of reliability, it is necessary to have data on the number and range of the
examined piece of equipment. It’s important to have database for failure rates, repair
time and unavailability for each component in distribution network. These studies
present the analysis of distribution networks and systems by using analytical methods
in SESB’s distribution substations and network systems. These studies use analytical
methods to determine the reliability indices and effect of distribution substation
configuration and network to the reliability indices performance. Then the result
obtained will be compare with the actual data from SESB to determine the area of
improvement required for mutual benefit and also for improvement in the future
studies.

v
Abstrak
Pengetahuan tentang reliability terhadap sistem dan rangkaian pengagihan adalah
sangat penting dalam perancangan and operasi untuk tujuan peningkatan mutu
pengagihan kuasa. Untuk mencapai objektif bagi meminimumkan gangguan bekalan
keatas pengguna-pengguna di kawasan pengagihan, syarikat utility perlu berusaha
untuk meningkatkan mutu kebolehpercayaan sistem tetapi dalam masa yang sama
mengurangkan kos. Menurut fakta, kebanyakan gangguan bekalan yang dihadapi
pengguna adalah disebabkan oleh kegagalan system pengagihan itu sendiri.
Walaubagaimanapun, data yang sah serta statistik prestasi kebolehpercayaan tidak
mudah untuk dikumpul dan diperolehi. Ketidakpastian dan ketepatan data menjadi
masalah utama dalam sistem pengagihan. Sebagai tujuan menilai dan menganalisis
sistem pengagihan, adalah menjadi keperluan untuk mempunyai data yang sah bagi
semua peralatan yang terlibat dalam sistem pengagihan. Data – data tersebut adalah
merujuk kepada kadar kegagalan dalam satu tempoh tertentu dan maklumat berkaitan
yang dapat membantu dalam analisis kebolehpercayaan sistem. Pembelajaran dan
penyelidikan dalam tajuk ini adalah menjurus kepada analisis sistem dan rangkaian
pengagihan menggunakan kaedah analitikal terhadap pencawang pengagihan di
SESB. Kaedah analitikal digunakan secara terperinci untuk mendapatkan indeks
kebolehpercayaan dan kesan konfigurasi pencawang terhadap prestasi indeks
kebolehpercayaan pengagihan tersebut. Keputusan yang diperolehi akan
dibandingkan dengan indeks sebenar yang diperoleh daripada SESB. Berdasarkan
perbandingan tersebut, penambahbaikan akan diambil kira untuk kegunaan dan
aplikasi pada masa akan datang.
vi
TABLE OF CONTENTS
ACKNOWLEDGMENT iii
ABSTRACT
ABSTRAK
iv
v
LIST OF TABLES ix
LIST OF FIGURES xi
LIST OF SYMBOLS AND
ABBREVIATIONS
xiii
LIST OF APPENDICES xiv
CHAPTER 1 INTRODUCTION 1
1.1 Project Background 1
1.2 Problem Statements 2
1.3 Project Objectives 4
1.4 Project Scopes 4
1.5 Thesis Outline 5
CHAPTER 2 LITERATURE REVIEW 6
2.1 Introduction 6
2.2
2.3
2.4
2.5
Reliability
2.2.1 Reliability Evaluation
2.2.2 Reliability Indices
Power Quality and Availability
Network Equivalent Technique
Description of Previous Methods
2.5.1 Reliability Evaluation of
Distribution Networks Using Fuzzy
Logic
2.5.2 The Reliability Analysis of
7
7
8
9
10
10
10

vii
Distribution System Based on
Dynamic Bayesian Network
2.5.3 Case Study of Distribution
Network Reliability Analysis Based
on Probabilistic Method.
2.5.4 Summary of Previous Methods
11
12
14
CHAPTER 3 METHODOLOGY 16
3.1 Project Methodology
3.1.1 Overview
3.1.2 Feasible Study on Reliability
Analysis
3.1.3 Markov Modelling
3.1.4 Network Modelling
16
16
18
18
20
3.2 Overview and Analysis of the Existing
Distribution Network
24
3.3 Reliability Indices of the Existing
Distribution Network
24
3.4 Interruptions Causes 26
CHAPTER 4 RESULT AND ANALYSIS 28
4.1 Failure Mode and Effect Analysis
(FMEA), Network Modelling And
Assumptions
30
4.2 Reliability Parameter 31
4.3 Case 1: Effects of Parallel Mode
Operations of 66/11kV Transformers
32
4.4 Case 2: Effects of Independent Mode
Operations of 66/11kV Transformers
38
4.5 Case 3: Effects of Double 11kV
Busbar
43
4.6 Case 4: Effects of Parallel 11kV
Feeders
49
CHAPTER 5 CONCLUSION AND
RECOMMENDATION
57

viii
5.1 Conclusion 57
5.2 Recommendations
5.2.1 Outage Mitigation Technique
5.2.2 Maintenance Strategy
5.2.3 Tree Trimming Strategy
58
59
59
61
REFERENCES 63
APPENDIX 64

ix
LIST OF TABLES
Table 2.1 Summary of previous method for reliability analysis 14
Table 3.1 Component data for system in Figure 3.6 23
Table 3.2 Load Point reliability indices for the system of Figure 3.6 23
Table 3.3 SESB’s Interruption causes for year 2012 and 2013 (Overall) 26
Table 4.1 Reliability Parameter 32
Table 4.2 Analysis of failure for circuit breaker and feeder cable 34
(Overhead line, OHL and Underground line (UG)) for load point 1 – load
point 4 using FMEA method for Case 1.
Table 4.3 Analysis of failure for circuit breaker and feeder cable 35
(Overhead line, OHL and Underground line (UG)) for load point 5 –
load point 8 using FMEA method for Case 1.
Table 4.4 Analysis of failure for circuit breaker and feeder cable 36
(Overhead line, OHL and Underground line (UG)) for load point 9 – load
point 10 using FMEA method for Case 1.
Table 4.5 11kV Distribution load point average current, average power 37
and estimate number of customer.
Table 4.6 Reliability Indices for Distribution feeder (11kV) for Case 1. 37
Table 4.7 Analysis of failure for load point 1 – load point 4 using FMEA 40
method for Case 2.
Table 4.8 Analysis of failure for load point 5 – load point 8 using FMEA 41
method for Case 2.
Table 4.9 Analysis of failure for load point 9 – load point 10 using FMEA 42
method for Case 2.
Table 4.10 Reliability Indices for Distribution feeder (11kV) for Case 2. 42
Table 4.11 Reliability parameter for double busbar configuration. 44
Table 4.12 Analysis of failure for load point 1 – load point 4 using FMEA 46
method for Case 3.
Table 4.13 Analysis of failure for load point 5 – load point 8 using FMEA 47
method for Case 3.

x
Table 4.14 Analysis of failure for load point 9 – load point 10 using FMEA 48
method for Case 3.
Table 4.15 Reliability Indices for Distribution feeder (11kV) for Case 3. 48
Table 4.16 Effects on the distribution reliability indices for parallel 51
configuration of feeder (overhead line cable)
Table 4.17 Effects on the distribution reliability indices for parallel 52
configuration of feeder (Underground cable)
Table 4.18 Reliability indices for distribution feeder (11kV) for Case 4. 53
Table 4.19 Summary of reliability indices for Case 1 to Case 4. 53
xi
LIST OF FIGURES
Figure 2.1 System Reliability Subdivision 6
Figure 2.2 The simple sketch map of Single Bayesian Network 12
(SBN) and Double Bayesian Network (DBN)
Figure 2.3 Probabilistic Reliability Assessment Flowchart 13
Figure 2.4 A Weibull Markov model. 14
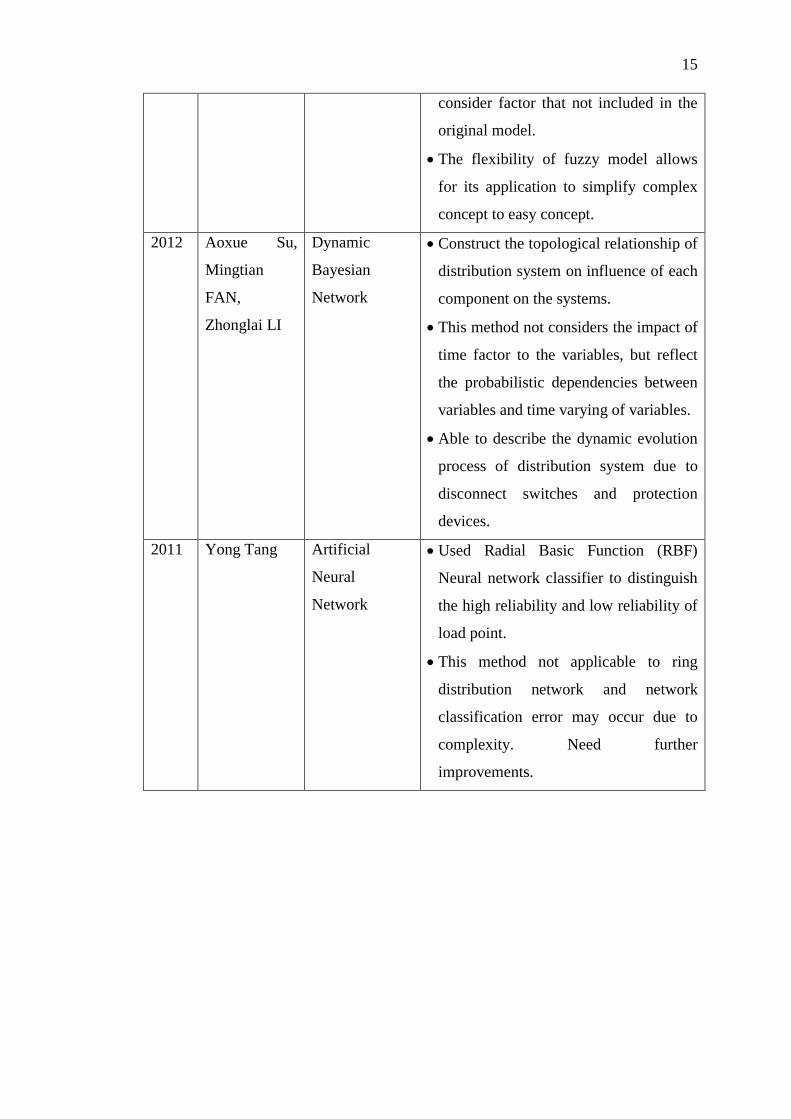
Figure 3.1 The planning approach for the Reliability Analysis 17
of Distribution network.
Figure 3.2 Example of simple distribution system. 18
Figure 3.3 (a) Primary Markov model (b) Secondary Markov 20
Model (c) Tertiary Markov Model
Figure 3.4 Series Structure 21
Figure 3.5 Parallel Structure 21
Figure 3.6 Simple 3-load point radial system 23
Figure 3.7 Overall SAIDI Sabah from year 2006 to year 2013. 25
Figure 4.1 Single Line Diagram of Tuaran 66/11kV Substation. 29
Figure 4.2 Parallel operations of 66/11kV transformers. 33
Figure 4.3 Independent mode of operation for Transformer 1 – 39
Transformer 3 for 66/11kV Tuaran substation. The 11kV bus
section assumes to be open to enable the independent mode operation.
Figure 4.4 Double bus configurations for 11kV bus system 44
Figure 4.5 Double bus configuration 45
Figure 4.6 Series and parallel modelling for 11kV feeder. 49
Figure 4.7 Summary of result of Reliability Indices (Underground 54
cable)
Figure 4.8 Summary of result of Reliability Indices (Overhead line 54
cable)
Figure 5.1 Three step procedure for developing of a Reliability 58
Improvement Strategy
Figure 5.2 Various types of tree trimming. Side trimming is preferable 62

xii
from a reliability perspective, but other types of trimming may be
required due to wire location or aesthetic needs
xiii
LIST OF SYMBOLS AND ABBREVIATIONS
SAIDI – System Average Interruption Duration Index
SAIFI – System Average Interruption Duration Index
CAIDI – Customer Average Interruption Duration Index
ASAI – Average Service Availability Index
ASUI – Average Service Unavailability Index
ENS – load- and energy-orientated indices such as Energy Not
Supplied
AENS – Average Energy Not Supplied
ACCI – Average Customer Curtailment Index
SESB – Sabah Electricity Sendirian Berhad
kV – kilo volt
U – Average unavailability
r – Average repair rate
λ – Average failure rate
FMEA – Failure mode and effect analysis
DBN – Dynamic Bayesian Networks
xiv
LIST OF APPENDICES
APPENDIX TITLE PAGE
A SAIDI & SAIFI Data from Sabah Electricity Sdn. Bhd.
(SESB) Year 2011 – 2013
64
A1 SAIDI YTD 2011 (SECTOR 1 & 2) 64
A2 SAIDI Sector 2 Year 2011 for Distribution,
Transmission and Generation
65
A3 SAIDI Sector 2 Year 2011 for Distribution,
Transmission and Generation
66
A4 SAIDI YTD 2012 (SECTOR 1 & 2) 67
A5 SAIDI Sector 2 Year 2012 for Distribution,
Transmission and Generation
68
A6 SAIDI Sector 2 Year 2012 for Distribution,
Transmission and Generation
69
A7 SAIDI YTD 2013 (SECTOR 1 & 2) 70
A8 SAIDI Sector 2 Year 2013 for Distribution,
Transmission and Generation
71
A9 SAIDI Sector 2 Year 2013 for Distribution,
Transmission and Generation
72
A10 SESB SAIFI and CAIDI data for Year 2011 to 2013 73
B Sabah Grid Network 74
C DETAIL SINGLE LINE DIAGRAM 75
C1 Single Line Diagram (SLD) for Tuaran 66/11kV &
66/33 kV
75
C2 GRID NETWORK FOR SECTOR 2 76

1
CHAPTER 1
INTRODUCTION
1.1 Project Background
Power distribution network system established mainly to provide adequate electricity
supply to customers as economically as possible with reasonable assurance of
reliability. Nowadays, the power distribution networks have grown exponentially in
term of size and technology over the past few years. As a result, utility company
must strive to ensure that the customer’s reliability requirements are met with
optimum strategic planning and lowest possible cost. The ability of the system to
provide adequate supply of electricity energy determine by the term reliability.
Reliability analysis of distribution network is not a new topic in electric power
industries, a lot of studies and research have been carried out due to the increasing
cost of blackouts and fault outages.
Over the past, distribution network system have received less attention
devoted to reliability studies compared to generation and transmission system [1].
The reasons being is the generation and transmission systems are capital intensive
and the inadequacy can have widespread consequences for both society and
environment. However, a distribution system is slightly cheaper compare to the
other two because its effects are localized. Analysis of the customer failure statistics
of most utilities shows that distribution system makes the greatest individual
contribution to the unavailability of electrical supply to customer.
It is very important to assess and evaluate the reliability of power system
networks in order to obtain the most accurate and effective way in decision making
especially in planning, operation, and maintenance. Historical assessment and
2
predictive methods are normally used to evaluate the reliability of a distribution
network. Most utilities focus more on historical assessment rather than predictive
methods. Predictive methods are categorized into analytical and simulation methods.
Reliability assessment method for distribution system fall into two classes:
simulation and analytical [2]. Simulation is the most flexible method but require
extensive time in computational and also uncertainty in precision. Analytical method
can be further divided into network modeling and Markov modeling. Network
modeling has been the most popular technique for distribution system reliability
analysis due to the simplicity of the method and natural similarities between network
model and the distribution topology. The difference between simulation and
analytical method is the way in which the system reliability indices are evaluated. By
applying both analytical and simulation method, the reliability indices for
distribution systems will be determined such as System Average Interruption
Frequency Index (SAIFI) and System Average Interruption Duration Index (SAIDI).
The probability distribution of SAIFI and SAIDI which give information about the
variability of the indices also need to obtain in order to improve in decision making.
1.2 Problem Statements
There are many factors that contribute to the failure of distribution network system.
Reliability is very important issue in dealing with planning and operation of the
networks. In distribution system planning, reliability aspects are an important part of
the decision base. Thus, to be able to assess and evaluate, reliability is needed in the
planning process. The data obtained from Sabah Electricity Sdn Bhd (SESB) showed
that the distribution network contribute the highest SAIDI and SAIFI for three years
from 2011 to 2013.
The main problem facing is the power demand is rapidly increased whilst supply
growth is constrained by limited sources, environmental problem and other social
concerns. According to statistic, about 80% of power interruptions result from power
distribution system failure [2]. Historical assessment and predictive methods are
normally used to evaluate the reliability of a distribution network. Most utilities
focus more on historical assessment rather than predictive methods. Hence, it is vital
in design and development of distribution network to study and analyze the
reliability. Enhance knowledge in reliability analysis of distribution network will
3
contribute to the measurement of how far the system meet the performance criteria,
to help quantify comparison between various options, and to help in term of
economic decision [3]. Besides that, reliability analysis result will determine the
failure rate and mean failure duration for particular equipment or group of
equipments, thus with more detail in databases, the information gained may be
important for utilities operators, such as the most frequent cause of failures, areas of
greatest amount of undelivered energy [4] or the most weakness area of protection
system which contribute to interruptions and fault.
In this project, the most challenging and difficult aspect will be on the
analytical part where details concentration are required to acquire input data from
utilities and industries and calculation to obtained useful reliability indices which
will be used for comparison with the historical assessment. Incorrect input data will
of course lead to false result [6]. Furthermore, the difficulties for completing this
project are to apply the analytical methods for analysis of the existing distribution
network and systems. The advantages and disadvantages associates with both
analytical and simulation techniques are as follows:
(a) The analytical model always gives the same numerical result for the same
system, same model and same set of input data, whereas the result from a
simulation method is dependent on the random number generator used and
the number of simulations.
(b) The model used in the analytical approach is usually a simplification of the
system. The simulation approach, however, can incorporate and simulate any
system characteristic that can be recognized. Thus it gives a better description
of practical system behavior.
(c) The solution time for analytical techniques is relatively short, as compared to
that for simulation techniques which is usually extensive. This disadvantage
has been partially overcome by the development of modern computational
facilities. However, the solution time still remains high in applications that
demand several reliability assessments.
(d) Simulation techniques can provide a wide range of output parameters,
including, probability density functions and their respective moments,
whereas the output of the analytical techniques is usually limited only to
expected values.

4
1.3 Project Objectives
The major objective of this project is to evaluate the reliability of distribution
networks in Sector 2 of Sabah Grid network and to determine the system reliability
indices by using analytical method. The reliability indices are System Average
Interruption Frequency Index (SAIFI) and System Average Interruption Duration
Index (SAIDI). Result from these approaches and some changes in philosophy study
are analyze and compared. The following issues shall be discussed:
a) To assess and evaluate the existing reliability indices of distribution network
system of Sector 2 area in Sabah grid network.
b) To determine the reliability indices System Average Interruption Frequency
Index (SAIFI) and System Average Interruption Duration Index (SAIDI)
using predictive (analytical) methods.
c) To compare the results for further recommendation and improvement in
decision making of planning and design based on predictive methods and
some changes in the operating philosophy.
1.4 Project Scopes
This study will focus on the analysis of 33kV and 11kV distribution network in
Sector 2 of Sabah Grid network. The parameter used to determine the reliability
indices are failure rate, repair rate and unavailability. The scopes of this project are:
a) Implementation of predictive analysis methods for the existing distribution
network 33kV and 11kV system.
b) Analysis of SAIDI and SAIFI for distribution level. Compare both method
and further evaluate to obtain optimum reliability indices.
c) The operating philosophy and system configuration which includes
protection, control, monitoring and equipment used.
This project will concentrate on analytical methods since historical assessment has
been used by the utilities over the past few years. Moreover, analytical methods are
more enhance to provide more useful and higher accuracy of results. By comparing
both methods, further evaluation will be discussed and result obtained can be used as
reference for decision making in planning and operation. The actual source of
5
databases such as SAIDI and SAIFI acquired from Sabah Electricity Sendirian
Berhad (SESB), from System Operation Division.
The past or historical data will be used as benchmarking and reference for
comparison with predictive analysis results. Two methods in analytical technique
which has been used extensively by researchers and as a bench mark system:
Network Modelling Markov chain modelling.
The result of analytical methods depends on the quality of input data or the
data available with the company and user. Therefore, it is very important for the
utilities to maintain and update the data recording systems for future use. This would
enhance to improve the system studies in future and the overall reliability in the
system.
1.5 Project Outline
This project is organized in 5 chapters. An overview of the research along with
features and aim are outline in Chapter 1. A literature review is carried out in
Chapter 2. This chapter consist of the previous research by other students and it’s
illustrated a comprehensive technique and method used for reliability analysis.
Chapter 3 is the methodologies elaborate further on how the project will be carried
out, the technique used and its present the historical data for the past three years from
SESB operation division. Besides that, the interruption causes which contribute to
the performance of reliability indices also present in this chapter. The calculation and
determination of reliability analysis was performed in Chapter 4. An analytical
technique was applied to determine the reliability indices by using different
configurations and operational concept. Further discussion and justification was
explained in this chapter, the comparison of the result obtained and its advantages
and disadvantages. A bar chart representation was constructed to illustrate the
comparison. Chapter 5 presents the conclusions as well as recommendations for
future works. The list of references and list of publications resulted from this project
are present after this chapter.

6
CHAPTER 2
LITERATURE REVIEW
2.1 Introduction
Electrical power are vital important to our modern society nowadays in line with the
challenges to provide the most efficient and cost effective way of supplying
electricity from industrial area up until residential consumers. The availability of a
reliable power supply at reasonable cost is crucial for the economic growth and
development of a country [5]. Power Utilities Company nowadays try to enhance and
develop their own strategies based on experience, trending, research and studies to
meet customer demands as economically as possible at reasonable service of
reliability. An analysis throughout the word shows that around 90% of all customer
reliability problems are due to the problem in distribution system. Thus, improving
distribution reliability is the key to improving customer reliability [6]. The concept of
power-reliability is extremely broad and covers all aspects of the ability of the
system to satisfy the customer requirements. There is a reasonable subdivision of the
concern designated as system reliability which is shown in Figure 2.1.
Figure 2.1: System Reliability Subdivision.
System Reliability
System Adequacy System Security
7
Figure 2.1 represents two basic aspects of a power system: system adequacy and
security. Adequacy relates to the existence of sufficient facilities within the system to
satisfy the consumer load demand. These include the facilities necessary to generate
sufficient energy and the associated transmission and distribution facilities required
to transport the energy to the actual consumer load points. Security relates to the
ability of the system to respond to disturbances arising within that system. Security is
therefore associated with the response of the system to whatever perturbations it is
subject to [3].
2.2 Reliability
2.2.1 Reliability Evaluation
The ultimate goal of reliability analysis is to help answer questions like “is the
system reliable enough?”, “which scheme will fail less?” and “where can the next
dollar be best spent to improve the system?”. As discuss before, reliability in power
system can be divided into two basic aspects which is System Adequacy and System
Security. Since distribution system are seldom loaded near their limits, reliability
emphasis in system security compared to system adequacy. Reliability evaluation of
distribution systems consist of two main approaches Simulation and Analytical
methods.
(a) Simulation methods based on drawings from statistical distributions (Monte
Carlo).
(b) Analytical methods based on solution of mathematical models.
The Monte Carlo techniques are normally very time consuming due to large number
of drawing necessary in order to obtain accurate results. The fault distribution from
each component is given by a statistical distribution of failure rates and outage times.
The analytical approach is based upon assumptions concerning statistical distribution
of failure rate and repair times. The most common evaluation techniques are using a
set of approximate equation of failure mode analysis or minimum cut analysis. This
method is less time consuming than the simulation method, but suffers from problem
representing repair times adequately.
8
2.2.2 Reliability Indices
The basic load-point reliability indices used to predict the reliability of a distribution
system are the average load point failure rate (λs), the average load point outage
duration (rs), and the average annual load point time or unavailability (Us) [7]. A
wide range of system indices can be calculated with these three parameters. The
system reliability indices may be customer-orientated such as SAIFI, SAIDI,
Customer Average Interruption Frequency Index (CAIFI), Customer Average
Interruption Duration Index (CAIDI), Average Service Availability Index (ASAI),
Average Service Unavailability Index (ASUI) or load- and energy-orientated indices
such as Energy Not Supplied (ENS), Average Energy Not Supplied (AENS) and
(ACCI).
Quantitative reliability evaluation of a distribution system can be divided into two
basic segments; measuring of the past performance and predicting the future
performance [8]. Below are some of the basic indices that have been used to assess
the past performance;
• System Average Interruption Frequency Index (SAIFI). It is designed to give
information about the average frequency of sustained interruption per customer over
predefined area.
i
ii
N
NSAIFI
SERVED CUSTOMER OF NUMBER TOTAL
ONSINTERRUPTI CUSTOMER OF NUMBER TOTAL
• System Average Interruption Duration Index (SAIDI). It is commonly referred to as
customer minutes of interruption or customer hours, and is designed to provide
information about the average time that the customers are interrupted.
i
ii
N
NUSAIFI
SERVED CUSTOMER OF NUMBER TOTAL
DURATIONS ONINTERRUPTI CUSTOMER OF SUM
Past performance statistics provide valuable reliability profile of the existing system.
However, distribution planning involves the analysis of future systems and
evaluation of system reliability when there are changes in; configuration, operation
conditions or in protection schemes. This estimates the future performance of the
9
system based on system topology and failure data of the components. Due to
stochastic nature of failure occurrence and outage duration, it is generally based on
probabilistic models. The basic indices associated with system load points are;
failure rate, average outage duration and annual unavailability.
2.3 Power Quality and Availability
Perfect power quality is characterized by a perfect sinusoidal voltage source without
waveform distortion, variation in amplitude or variation in frequency. To attain near
perfect quality, a utility could spend vast amounts of money and accommodate
equipment with higher power quality needs. On the other hand a utility could spend
little and require customer s to compensate for the resulting power quality problems.
Neither of extreme is desirable, utilities must find a balance between cost and power
quality provided to the customer. Power quality concerns are becoming more
frequent with the proliferation of sensitive electronic equipment and automated
process. Power quality problems are basically divided into many categories such as
interruptions, sags, swells, transients, noise, flicker, harmonic distortion and
frequency variations [9].
Availability is defined as the percentage of time a voltage source is
uninterrupted. Power quality deals with any deviation from a perfect sinusoidal
voltage source. Reliability deals with interruptions. Availability deals with the
probability of being in an interrupted state. Availability is the probability of
something being energized and Unavailability is the probability of not being
energized. It is most basic aspect of reliability and is typically measure in percent or
per unit. Unavailability can be computed directly from interruption duration
information. If a customer experiences 9 hours of interrupted power in a year,
unavailability is equal to 9/8760 = 0.10% (8760 hours in a year). Then availability is
equal to 100% - 0.1% = 99.90%. With the growth of ultrasensitive loads, it has
become common to describe high levels of reliability.

10
2.4 Network Equivalent Technique
The analytical techniques required for distribution system reliability evaluation are
highly developed. Many of the published concepts and techniques are presented and
summarized in [1]. Conventional techniques for distribution system reliability
evaluation are generally based on failure mode and effect analysis (FMEA) [10].
This is an inductive approach that systematically details, on a component-by-
component basis, all possible failure modes and identifies their resulting effects on
the system. Possible failure events or malfunctions of each component in the
distribution system are identified and analysed to determine the effect on surrounding
load points. A final list of failure events is formed to evaluate the basic load point
indices. The FMEA technique has been used to evaluate a wide range of radial
distribution systems. In systems with complicated configurations and a wide variety
of components and element operating modes, the list of basic failure events can
become quite lengthy and can include thousands of basic failure events. This requires
considerable analysis when the FMEA technique is used. It is therefore difficult to
directly use FMEA to evaluate a complex radial distribution system. A reliability
network equivalent approach is use to simplify the analytical process. The main
principle in this approach is using an equivalent element to replace a portion of the
distribution network and therefore decompose a large distribution system into a
series of simpler distribution systems. This approach provides a repetitive and
sequential process to evaluate the individual load point reliability indices.
2.5 Description of Previous Methods
2.5.1 Reliability Evaluation of Distribution Networks Using Fuzzy Logic
The fuzzy logic concept is used to evaluate the reliability distribution network. The
basic concept underlying fuzzy logic is that of a linguistic variable whose values are
words rather than numbers. The use of fuzzy logic as an evaluation tool has
distinguish characteristic, this technique aims at exploiting the tolerance for
imprecision and uncertainty to achieve tractability, robustness and low solution cost
[11].
11
The fuzzy logic method was used to predict the reliability as there was no
mathematic function describing the relationship between subsystems and the network
reliability. The advantage of fuzzy logic method is its enabling the possibility of
adding new fuzzy systems to the existing model, in order to account for factors that
were not included in the model. These new fuzzy level can be added into fuzzy level
1 or 2. The reason is that all subsystems are assumed to be independent to each other.
Furthermore, fuzzy logic is more flexible thus it allow for its application to simplify
complex models. Due the simplification, the computation time is reduced and larger
model could be easily evaluated with minimal computation time.
2.5.2 The Reliability Analysis of Distribution System Based on Dynamic
Bayesian Network
Dynamic Bayesian network is a time extension of the static Bayesian network, which
consists of the initial network and transfer network. Based on Dynamic Bayesian
networks, the actual value of the component failure rates and repair rates can be
accurately reflected and failure frequency and duration of distribution system can be
calculated. Bayesian network method permits not only computing the reliability
indices of a distribution system but also presenting the effect of each component or
some components on the system reliability.
This method can't calculate the situation with time, which not only can't
calculate outage frequency index and outage time index, but also can't exactly reflect
the actual value of the failure rate and repair rate of components. In order to solve
these problems, an approximate Bayesian network inference algorithm for time-
sequence simulation is presented [12]. But this method is similar to the Monte Carlo
simulation method, which simulate the events using the sampling, and suffer in
computation time and uncertainty of precision. Dynamic Bayesian Network inherits
the advantages of static Bayesian Networks, and it can be able to describe the
dynamic evolution process of the distribution system due to the disconnect switches
and protection devices.

12
(a) SBN (b) DBN
Figure 2.2: The simple sketch map of Single Bayesian Network (SBN) and Double
Bayesian Network (DBN)
2.5.3 Case Study of Distribution Network Reliability Analysis Based on
Probabilistic Method.
This study is based on probabilistic method where the reliability of a large
distribution network is calculated. Some solutions were introduced to improve the
weaknesses of the network system. A probabilistic distribution model is proposed by
using radial basis function neural network with orthogonal least square learning
method [13]. Monte-Carlo time sequential simulation technique also applied for
worth assessment. Probabilistic reliability assessment flowchart is illustrated in
Figure 2.3.

13
Figure 2.3: Probabilistic Reliability Assessment Flowchart
The failure model describe that the system component will fail, how it fail and how
long the repair time required. The load models may consist of only a few possible
load demands, or based on precise load forecast and growth scenarios. The
combination of one or more simultaneous faults and a specific load condition is
called a system state. The system state production module will use failure and load
models to build a list of relevant system states. Each of this system states may have
one or more faults.
This case study also using the Stochastic models where it describes how and
how frequent a certain object changes. A line, for example, may suffer an outage due
to a short circuit and it will be back to service after an outage repair completed. This
study used Markov model to define stochastic model by using two states constant
failure rate and constant repair rate. These two parameters will be used to calculate
and obtained other parameter such as mean time to repair (MTTR), mean time to
failure (MTTF), availability (P) and unavailability (Q). The availability gives the
fraction of time during which the component is in service and the unavailability gives
the fraction of time it is in repair. The total of P and Q therefore equal to 1. The
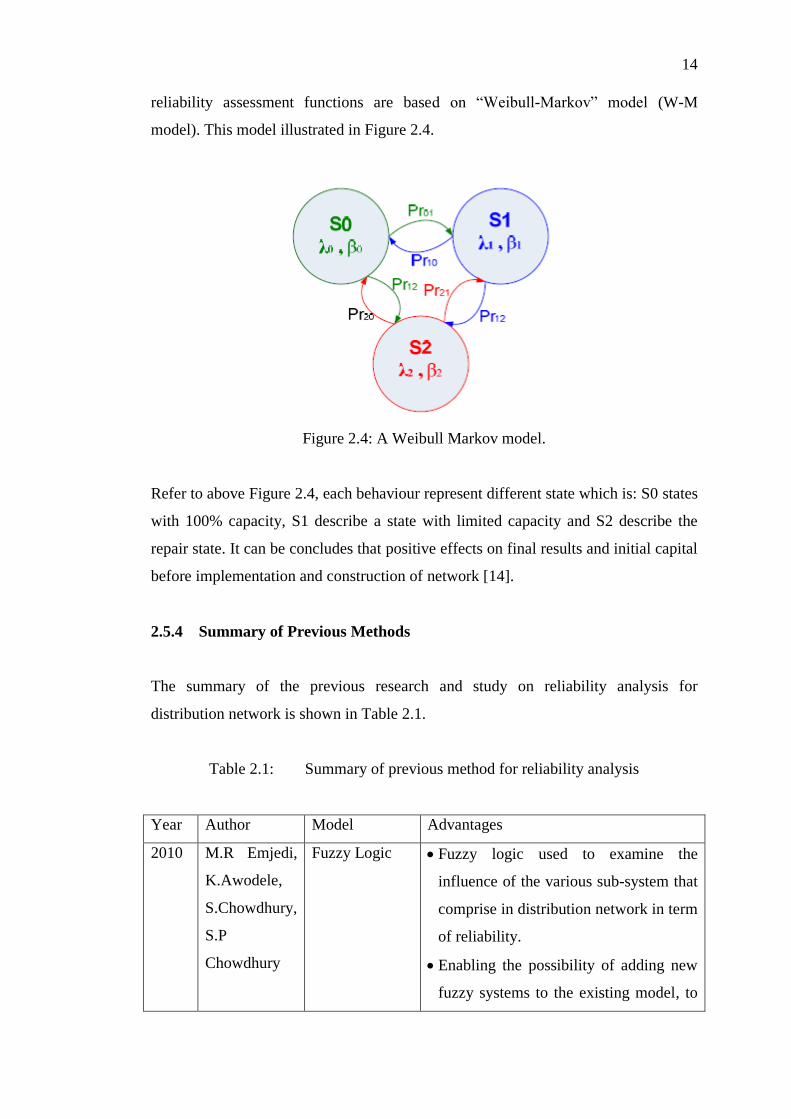
14
reliability assessment functions are based on “Weibull-Markov” model (W-M
model). This model illustrated in Figure 2.4.
Figure 2.4: A Weibull Markov model.
Refer to above Figure 2.4, each behaviour represent different state which is: S0 states
with 100% capacity, S1 describe a state with limited capacity and S2 describe the
repair state. It can be concludes that positive effects on final results and initial capital
before implementation and construction of network [14].
2.5.4 Summary of Previous Methods
The summary of the previous research and study on reliability analysis for
distribution network is shown in Table 2.1.
Table 2.1: Summary of previous method for reliability analysis
Year Author Model Advantages
2010 M.R Emjedi,
K.Awodele,
S.Chowdhury,
S.P
Chowdhury
Fuzzy Logic Fuzzy logic used to examine the
influence of the various sub-system that
comprise in distribution network in term
of reliability.
Enabling the possibility of adding new
fuzzy systems to the existing model, to
15
consider factor that not included in the
original model.
The flexibility of fuzzy model allows
for its application to simplify complex
concept to easy concept.
2012 Aoxue Su,
Mingtian
FAN,
Zhonglai LI
Dynamic
Bayesian
Network
Construct the topological relationship of
distribution system on influence of each
component on the systems.
This method not considers the impact of
time factor to the variables, but reflect
the probabilistic dependencies between
variables and time varying of variables.
Able to describe the dynamic evolution
process of distribution system due to
disconnect switches and protection
devices.
2011 Yong Tang Artificial
Neural
Network
Used Radial Basic Function (RBF)
Neural network classifier to distinguish
the high reliability and low reliability of
load point.
This method not applicable to ring
distribution network and network
classification error may occur due to
complexity. Need further
improvements.

16
CHAPTER 3
METHODOLOGY
3.1 Project Methodology
3.1.1 Overview
This research is adopting methods involving analysis and evaluation of reliability of
the distribution network in sector 2 of Sabah grid network to see how reliability
could be improved in the distribution system by incorporating reliability analysis in
the systematic planning approach so that optimum reliability is achieved. The
reliability indices of the present system shall be evaluated, assessed and compared
and sees how risk of failure could be mitigated. The reliability indices for the year
2011 to 2013 are being considered as base year for the case study.
Reliability indices such as SAIFI, SAIDI and CAIDI can be calculated using
equation given in 2.2.2 [3]. These indices provide a relative measure for a group of
load points or for the entire system. Analysis will be carried out at distribution
network substation Tuaran 66/11kV system. But the selection of distribution
substation depends on the availability of data and information required for
calculation and analysis. Result from these approaches will be compare with the
actual value of reliability indices obtain from year 2011 to 2013. In this project, we
will apply two analytical methods to determine the reliability indices which are
Markov model and Network modelling. The project’s Gantt chart is given in
Appendix A. The research is conducting in phase’s basis as shown in flowchart in
Figure 3.1:
17
Figure 3.1: The planning approach for the Reliability Analysis of Distribution
network.
Analysis of Existing
networks
- SAIDI, SAIFI of existing
distribution network
Reliability Analysis
- Selection of networks,
feeders, line or equipments.
- Implement analytical
method: Markov, Network
Modelling.
- Reliability indices
calculation
Satisfy
Decision
- Selection of plan
- Recommend system
improvement
- Documentation
Modification
- Change or discard
method of calculation
and analysis
No
Yes
Feasible Study on
Reliability Analysis
Implementation
- Evaluate performance
- System review and audit
- Improvement and
development
18
3.1.2 Feasible Study on Reliability Analysis
The feasible study on reliability analysis concentrates on the previous methods used
for reliability evaluation and assessment. The existing system network will be bench
mark and compare with the previous study and research so that the methods that need
to be apply is suitable with the current systems. In order to achieve this, details study
and research is required to be conduct by referring to SESB distribution system
operation and design.
The technique required to analyze a distribution system depend on the type of
system being considered and depth of analysis needed. Firstly, we need to know the
basic evaluation technique then extend to more complex system inclusive of more
refined modeling aspects. This project will be base on two methods which are
Network modeling including basic evaluation technique for distribution system and
Markov chain model. More concentration on the basic evaluation technique as the
existing distribution network system is more compatible with this technique.
3.1.3 Markov Modelling
In this project, the technique term Hierarchical Markov Modelling (HMM) will be
used to determine the reliability indices. The HMM decompose the reliability
problem into three levels according to system topology, integrated protection system
behaviour and individual protection devices behaviour [13]. To illustrate HMM, the
example distribution system in Figure 3.2 will be used.
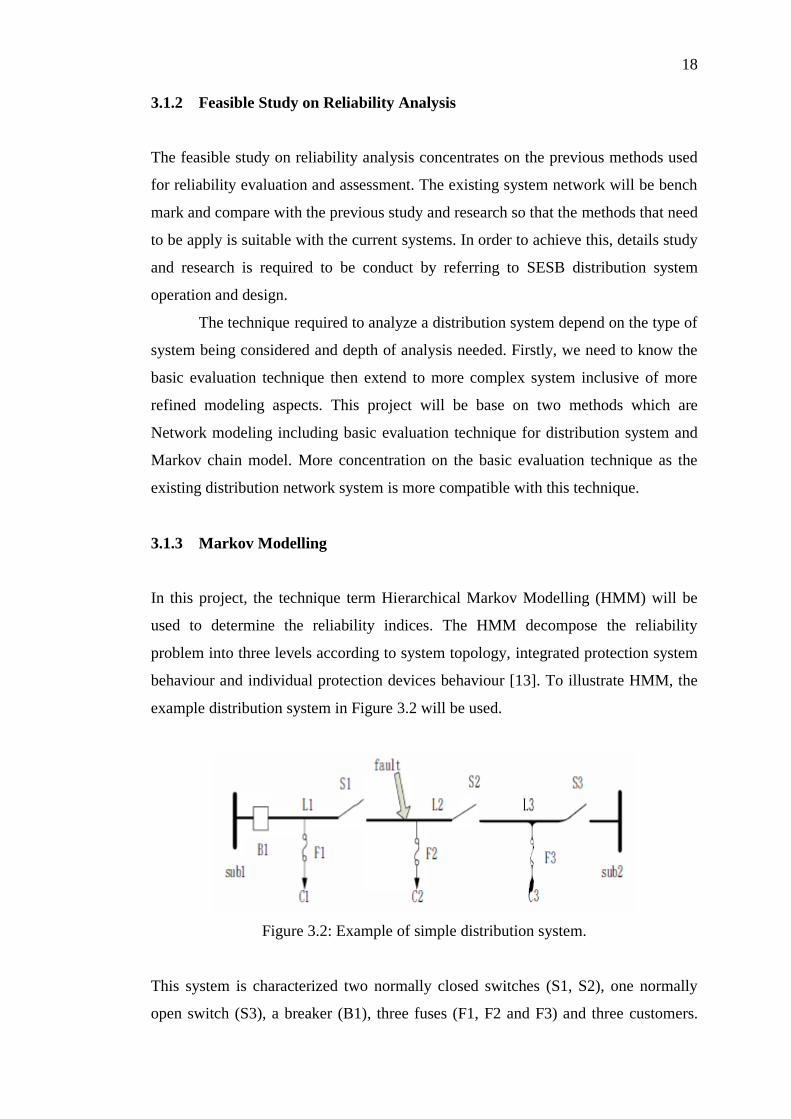
Figure 3.2: Example of simple distribution system.
This system is characterized two normally closed switches (S1, S2), one normally
open switch (S3), a breaker (B1), three fuses (F1, F2 and F3) and three customers.
19
This system is normally fed from a substation and can be back fed from a second
substation if needed. HMM begins by creating primary model based on system
topology. Primary model has a normal operating state (S0) and additional states
corresponding to various switching actions. Parameter such as repair rates and
switching rates will be required. In the primary model, states are determined
exclusively by sectionalizing switch positions and not by the status of protection
devices. The sectionalizing switches determine the system topology while the
protection system determines how the system will respond to contingencies while in
a certain topology.
Secondary Markov models will be created to model the protection system
behavior of each primary model state. These model have a base state of all protective
devices in a close position. The secondary model protection devices can either be
open or closed, and are characterized by a failure rate and repair rate.
Tertiary Markov models accommodate the complex behavior of individual
protection devices. This model has a base state for when the device is closed, and an
additional states corresponding to specific causes of tripping for examples primary
tripping, backup tripping, maintenance and false tripping. After the tertiary models
have been solved, the behavior of each protection device is known. This protective
device behavior is used by secondary models to determine the overall protective
system behavior of each configuration. After the protective system is known, HMM
is completed by finding the primary model state durations. After the primary model
is solved, the total expected interruption frequency and duration for each customer
can be found.

20
Figure 3.3: (a) Primary Markov model (b) Secondary Markov Model (c) Tertiary
Markov Model
Figure 3.3 illustrate the three models in HMM. In Figure 3.3 (a), µ represent repair
rates, and σ represent switching rates, in (b) λ represent failure rates and µ represent
repair rates. To implement HMM, a software application is required and further
study and research will be conduct to find suitable software for HMM.
3.1.4 Network Modelling
Network modelling is the use of series-parallel combinations to reduce the network.
It determines the load point indices and aggregates them to get the system wide
indices. A radial system basically consists of set of series components like; breakers,
lines, switches, transformers and at the end a “Customers”. In the series structure
(a) (b
)
(c)

21
both components must be intact for the system to function, "a chain is no stronger
than its part" while in the parallel structure both must fail for the system to stop
functioning. In this case, all the components are connected in series as shown in
Figure 3.4 and the equations needed to evaluate the basic indices are as follows;
Figure 3.4: Series Structure
(a) Average Failure rate of the system:
2
1
21s
i
i (3.1)
(b) Average outage time of the system:
s
s
i
ii Urrrrr
21
21212211sr (3.2)
If λ1 λ2 r1 r2 << λ1 r1 or λ2 r1 r2
(c) Average Annual Outage time of the system:
ssss rrf sU (3.3)
Where λi the failure rate at node i, ri is the outage time at node i. In parallel
system, the failure modes of the load point involve overlapping outages, i.e. two or
more components must be on outage at the same time in order to interrupt a load
point as shown in Figure 3.5. It is assumed that the failures are independent and that
restoration involves repair or replacement, the equations used to evaluate the indices
of the overlapping outage are as shown below.
Figure 3.5: Parallel Structure

22
(d) Average Failure rate of the system:
)(1
)(21212
2211
2121p rr
rr
rr
(3.4)
Where λ1 r1 and λ2 r2 usually << 1
(e) Average outage time of the system:
21
21pr
rr
rr
(3.5)
(f) Average Annual Outage time of the system:
pprpU (3.6)
These are adequate for simple radial systems and more extended indices have to be
used for general distribution systems (mixed radial and meshed systems). In this
master project, the following alternatives which may improves reliability in the
system shall be considered:
i) Assessment of the existing network
ii) Change in the network configuration
iii) Use of additional sectionalizing switches
iv) Automation and control facilities via control centre monitoring and
supervision.
In this project, we will assume that the distribution system are design and construct
as single radial and parallel systems:
i) Single radial system
11kV feeder supply direct to customer
33kV feeder for interconnection between substation
ii) Parallel System
33kV transformer (incomer) connected to two bus bar system (reserve
and main) to supply 11kV feeder connected to customer.
Three basic reliability parameters requires for analysis:
i
is :rate failure Average (3.7)
i
iis rU : timeoutage annual Average (3.8)
ii
i
ii
s
ss
rU
r
: timeoutage Average (3.9)
23
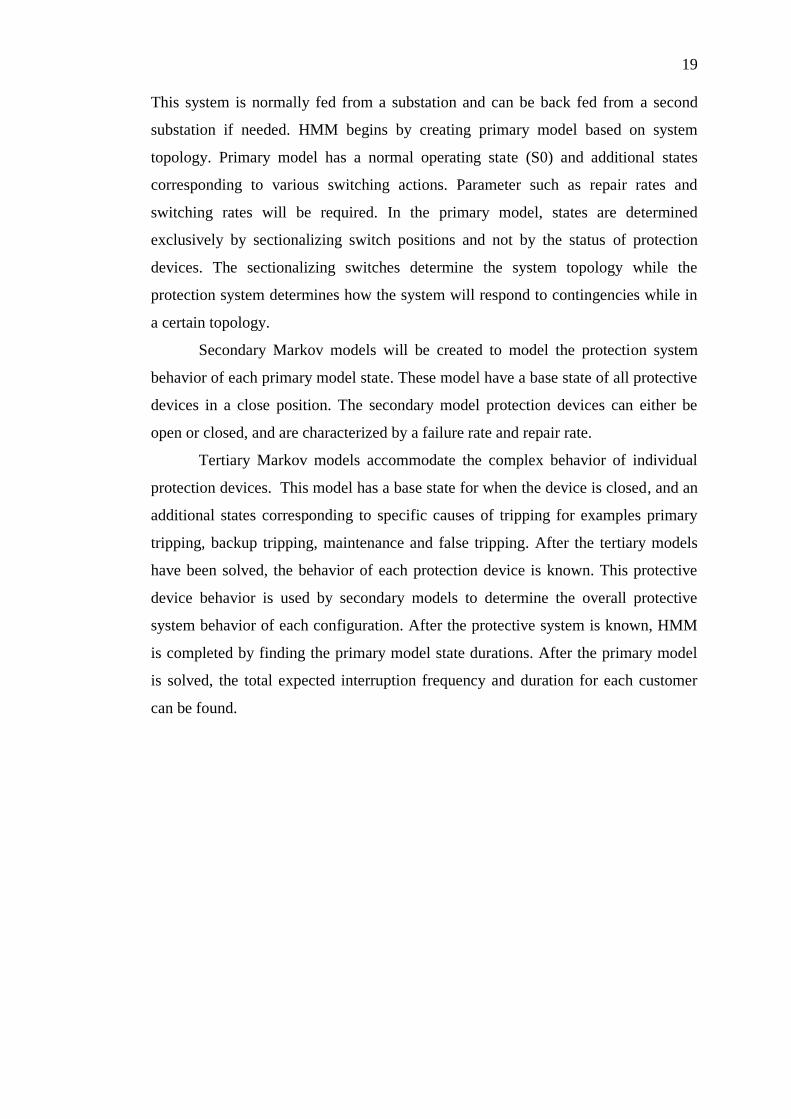
Figure 3.6: Simple 3-load point radial system
A radial system consist of a set of series components, including lines, cables,
disconnects (or isolator), bus bar, breaker, earth switch and etc [15]. A customer or
substation connected to any load point of such system requires all components
between himself and the supply point to be operating. A simple radial system shown
in Figure 3.8. The assume failure rates and repair times of each line A, B and C are
shown in Table 3.1 and the load point reliability indices are shown in Table 3.2. Data
shown is the typical and general feature of radial system. The assumption made is
perfect isolation of faults on line element A, B and C by the circuit breaker.
Table 3.1 Component data for system in Figure 3.6
Line λ (f/yr) r (hours)
A 0.2 6.0
B 0.10 5.0
C 0.15 8.0
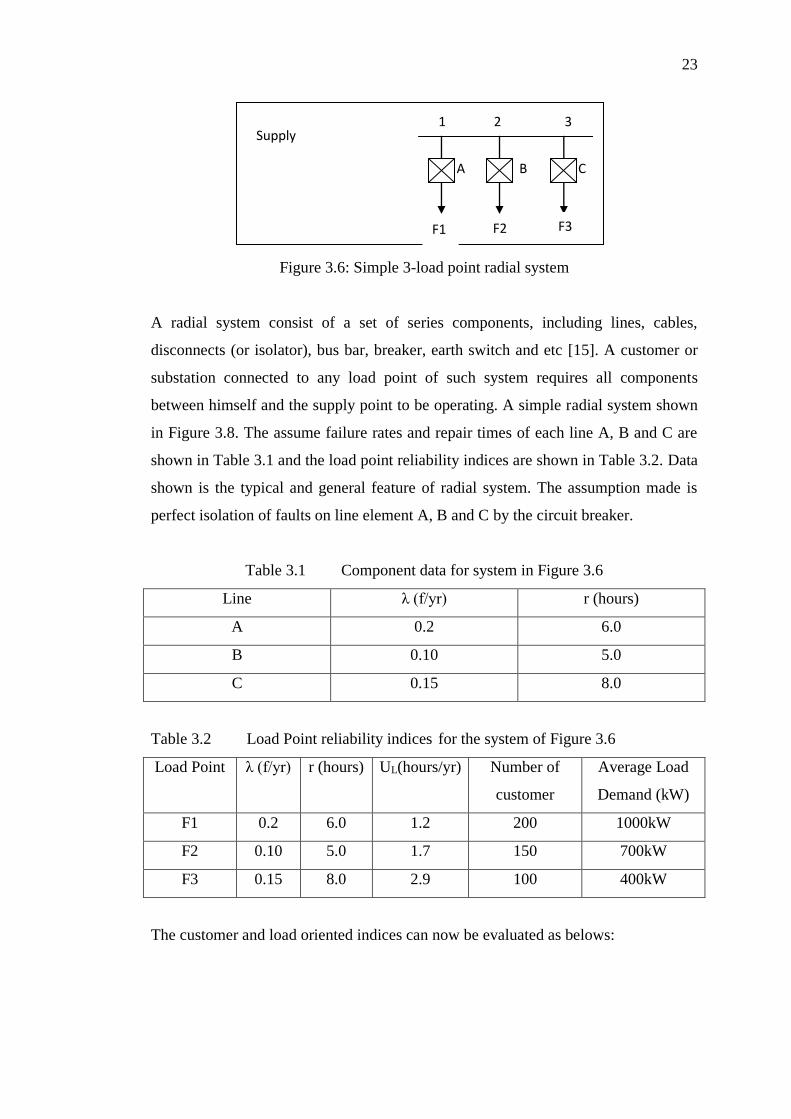
Table 3.2 Load Point reliability indices for the system of Figure 3.6
Load Point λ (f/yr) r (hours) UL(hours/yr) Number of
customer
Average Load
Demand (kW)
F1 0.2 6.0 1.2 200 1000kW
F2 0.10 5.0 1.7 150 700kW
F3 0.15 8.0 2.9 100 400kW
The customer and load oriented indices can now be evaluated as belows:
Supply
F1 F2 F3
A B C
1 2 3
24
oninterruptiomer hours/cust 02.6SAIFI
SAIDI CAIDI
yearomer hours/cust 1.74 450
)1009.2()1507.1((1.2X200) SAIDI
on/yearinterrupti 289.0100150200
)10045.0()1503.0((0.2X200)
XX
XXSAIFI
The above illustration is the basic evaluation technique for basic radial system. For
the purpose of this study, further operating philosophy will be apply such as
additional of isolation (disconnects), additional protection and automation,
transferrable load and others system configuration that might affect the reliability
indices. It shall be observe that, when the additional features applied on the
evaluation, there will be changes and improvement in the reliability indices.
3.2 Overview and Analysis of the Existing Distribution Network.
Appendix D1 shows the detail single line diagram of Tuaran 66/11kV and 66/33 kV
system. For the purposed of the study, we will consider the distribution feeder for
supply direct to customer or feeder that interconnect between substation such as
Tuaran 11kV, Mengaris 132/33kV interconnect to Kota Marudu 33/11kV. Here we
will also look at the future performance of the distribution system reliability when
there are changes in the configuration, operation condition and or protection
schemes, and expansion in the network. In this project, the predictive reliability
analysis shall be carried out in 33kV and 11kV feeder and a number of alternatives
shall be evaluated. Further evaluation and study on the existing network will be
conducted to determined type of network configuration either radial, parallel or
mesh.
3.3 Reliability Indices of the Existing Distribution Network
Data was obtained from Sabah Electricity Sdn Bhd (SESB), from System Operation
division. In this project, it will concentrate on the reliability analysis of the case
study area at Tuaran within Sector 2 where the total number of customer among the
highest compared to other distribution area. The total number of customer serves
25,376 in 2011, 26,655 in 2012 and 26,941 in 2013. Detail data is shown in
63
REFERENCES
1 Roy Billinton, Ronald N. Allan, Reliability Evaluation of Power System,
Second Edition, 2008.
2 Hongyun Zhang, Pengxiang Bi, “Development and Application of Reliability
Analysis System for Medium and High Voltage Distribution Networks”,
DRPT2008 6-9, China, 2008.
3 M.R Emjedi, K.Awodele, S.Chowdhury, S.P.Chowdhury, Reliability
Evaluation of Distribution Networks Using Fuzzy Logic, IEEE 2010.
4 Radomir Gono, Stanislav Rusek, Michal Kratky, Reliability Analysis of
Distribution Networks, 9th International Conference, Electrical Power
Quality and Utilization, Barcelona 2007.
5 Tempa Dorji, Reliability Assessment of Distribution Systems, Norweigan
University of Science and Technology (NTNU), 2009.
6 Richard E. Brown, Electric Power Distribution Reliability, Second Edition.
7 R. Billinton and W. Li, Reliability Assessment of Electric Power
Systems Using Monte Carlo Methods, New York, Plenum Press, 1994.
8 M.G. Da Silva, A. B. Rodrigues, C. L.C. de Castro, A.C. Neto, E.A.
Moutinho, N.S.A. Neto, A.B. Cavalcante. Reliability Assessment of
Distribution Networks in Brazil’s Northeast, 8th International Conference on
Probabilistic Methods Applied to Power Systems, Iowa State University,
September 12-16, 2004.
9 Edited by Angelo Baggini, Handbook of Power Quality, John Wiley and
Sons, Ltd.
10 Henley EJ, Hiromitsu K (1981) Reliability Engineering and Risk Assessment,
Prentice-Hall, Englewood Cliffs, NJ.
11 M.R Emjedi, K.Awodele, S.Chowdhury, Reliability Evaluation of
Distribution Networks Using Fuzzy Logic, IEEE 2010.
64
12 HUO Limin, ZHU YongLi, Zhang Liguo, Bayesian Network Time Sequence
Simulation Inference Algorithm for Reliability Assessment of Power Systems
[J], TRANSACTIONS OF CHINA ELECTROTECHNICAL SOCIETY,
2008, 23(6):S9-95.
13 A.Coelho, A.B.Rodrigues, M.G.Dasilva, “Distribution Network
Reconfiguration Reliability Constraints”, IEEE, 2004.
14 Aoxue SU, Mingtian FAN, Zhonglai LI, The Reliability Analysis of
Distribution System Based on Bayesian Network, China International
Conference on Electricity Distribution (CICED 2012), Shanghai China, 5-6
September 2012.
15 Lokesh Prakash Manohar, Reliability Assessment of a Power Grid With
Customer Operated CHP Systems using Monte Carlo Simulation, University
of Massachusetts Amherst, 2009.
16 Tim Taylor, Mike Markshall and Eric Neumann, Developing a Reliability
ImprovementStrategy for Utility Distribution Systems, IEEE, page 444-449.
17 M.G. Da Silva, A. B. Rodrigues, C. L.C. de Castro, A.C. Neto, E.A.
Moutinho, N.S.A. Neto, A.B. Cavalcante, Reliability Assessment of
Distribution Networks in Brazil’s Northeast, 8th International Conference on
Probabilistic Methods Applied to Power Systems, Iowa State University,
September 12-16, 2004.

![AN INTEGRATED HIGH-PERFORMANCE COMPUTING RELIABILITY ... · Figure 1 Vehicle reliability prediction flowchart [3] 5) Compute the local stresses refined using stochastic response surface](https://cdn.vdocuments.site/doc/165x107/5f0b7de77e708231d430c8c1/an-integrated-high-performance-computing-reliability-figure-1-vehicle-reliability.jpg)


