Redundancy and indispensability of NFATc1-isoforms in the adaptive and innate immune system
Dissertation zur Erlangung
des naturwissenschaftlichen Doktorgrades
der Julius-Maximilians-Universität Würzburg
vorgelegt von
Rhoda Busch
geboren in
Brilon
Würzburg 2013
Eingereicht am: 06. August 2013
Mitglieder der Promotionskommission:
Vorsitzender: Professor Dr. Wolfgang Roessler
Gutachter : Professor Dr. Edgar Serfling
Gutachter: Professor Dr. Thomas Rudel
Tag des Promotionskolloquiums: 05. Februar 2014
Doktorurkunde ausgehändigt am: ...........................................................................................
It always seems impossible until it’s done.
Nelson Mandela

Danksagung
Mein spezieller Dank gilt Professor Dr. Edgar Serfling für die Möglichkeit in seiner
Arbeitsgruppe zu promovieren, seine Betreuung und seine unerschöpflichen Ideen. Seine
Leidenschaft für die Forschung hat mich immer fasziniert und inspiriert.
Für die Bereitschaft das Zweitgutachten zu übernehmen, bedanke ich mich sehr bei
Professor Dr. Rudel.
Dr. Andris Avots möchte ich besonders danken. Seine Betreuung, die vielen Anregungen
und Ratschläge haben mich immer vorangebracht. Vielen Dank für die guten
Diskussionen, das gute Arbeitsklima und die vielen Lacher.
Bedanken möchte ich mich bei meinen Kollegen Dr. Friederike Berberich-Siebelt, Dr.
Stefan Klein-Heßling, Ronald Rudolf, Dr. Amiya Patra, Hani Alrefai, Duong Pham Anh
Thuy und Angelika Skiadas, die immer ein offenes Ohr hatten und mich unterstützt haben.
Herzlich bedanken möchte ich mich bei Lena Dietz, Dr. Khalid Muhammad, Tobias Pusch,
Dr. Martin Väth, Nadine Winter, Janina Findeis, Hendrik Fender und Krisna Murti – nicht
nur für hilfreiche wissenschaftliche Diskussionen, sondern auch für die vielen guten
Gespräche, die das Labor zu einem Ort gemacht haben, an dem man gerne ist. Sehr
dankbar bin ich Ilona Pietrowski und Doris Michel, die mir immer eine große Hilfe waren
und dadurch die Arbeit oft erleichtert haben.
Für die Möglichkeit in seinem Labor in Mainz zu arbeiten möchte ich mich bei Prof. Dr.
Ari Waisman bedanken. Bei Dr. Simone Wörtge und Dr. Jula Huppert bedanke ich mich
für ihre Unterstützung und Geduld. Mein herzlicher Dank gilt auch Dr. Friederike Hezel-
Frommer, Dr. Susanne Karbach, Susanne Gahr, Julia Bruttger, Dominika Lukas, Dr. Nir
Yogev, Christian Reichhold, Dr. Sonja Reißig und Dr. Filiz Demircik dafür, dass sie die
Zeit zu einer ganz besonderen gemacht und mich mit offenen Armen aufgenommen haben.
Bei meinen Freunden möchte ich mich für eine unvergessliche Zeit bedanken und dafür,
dass sie immer für mich da waren und mich unterstützt haben.
Meiner Oma danke ich für die vielen aufmunternden Worte und ihre optimistische
Weltsicht.

Meine Eltern verdienen einen ganz besonderen Dank. Sie waren immer für mich da und
haben nie aufgehört an mich zu glauben. Danke, dass ihr nie an mir gezweifelt habt.
Sebastian danke ich für seine unendliche Unterstützung, seine guten Nerven und die
Begabung mich immer wieder in die Realität zurückzuholen. Danke, dass du die Zeit mit
mir zusammen durchlebt hast.
I
Table of Contents
Summary ................................................................................................................................ 1
Zusammenfassung ................................................................................................................. 2
1 Introduction ........................................................................................................................ 3
1.1 The immune system ..................................................................................................... 3
1.2 Macrophages ................................................................................................................ 4
1.2.1 The Dectin-1 receptor............................................................................................ 5
1.2.2 Phagocytosis .......................................................................................................... 7
1.2.3 Recruitment of monocytes by the chemokine CCL2 ............................................ 7
1.3 T- and B-cells ............................................................................................................... 9
1.4 The NFAT family ...................................................................................................... 12
1.4.1 NFAT structure ................................................................................................... 13
1.4.2 NFATc1 ............................................................................................................... 15
1.4.3 NFAT activation .................................................................................................. 16
1.4.4 NFAT in myeloid cells ........................................................................................ 18
1.4.5 NFAT’s role in macrophages .............................................................................. 19
1.5 The aim of the project ................................................................................................ 22
2 Material and Methods ....................................................................................................... 23
2.1 Material ...................................................................................................................... 23
2.1.1 Antibodies ........................................................................................................... 23
2.1.2 Antibiotics and inhibitors .................................................................................... 24
2.1.3 Chemicals ............................................................................................................ 24
2.1.4 Cell lines .............................................................................................................. 25
2.1.5 Electronical data processing ................................................................................ 26
2.1.6 Enzymes .............................................................................................................. 26
2.1.7 Equipment ........................................................................................................... 26
2.1.8 Instruments .......................................................................................................... 27
2.1.9 Ligands and stimulants ........................................................................................ 28
2.1.10 Kits .................................................................................................................... 28
2.1.11 Mice ................................................................................................................... 29
2.1.12 Oligonucleotides ............................................................................................... 29
2.1.13 Plasmids ............................................................................................................ 31
2.1.14 Size standards .................................................................................................... 36
2.1.15 Statistical analysis ............................................................................................. 36
II
2.2 Methods ..................................................................................................................... 37
2.2.1 Cell culture .......................................................................................................... 37
2.2.1.1 Cell counting ................................................................................................ 37
2.2.1.2 Freezing and thawing.................................................................................... 37
2.2.1.3 Culture of J774 and L929 cells ..................................................................... 37
2.2.1.4 Isolation and stimulation of primary cells .................................................... 38
2.2.1.4.1 Isolation and stimulation of peritoneal macrophages ............................ 38
2.2.1.4.2 Phagocytosis and antigen presentation assays ....................................... 38
2.2.1.4.3 Isolation of bone marrow cells ............................................................... 39
2.2.1.4.4 Isolation of T- and B-cells ..................................................................... 39
2.2.1.4.5 T-cell stimulation and CSFE labeling .................................................... 39
2.2.1.4.6 B-cell stimulation ................................................................................... 40
2.2.1.5 Embryonic stem cell culture ......................................................................... 40
2.2.1.5.1 Embryonic fibroblast (EF) culture ......................................................... 41
2.2.1.5.2 Embryonic stem cell culture .................................................................. 42
2.2.2 Fluorescent-activated cell sorting (FACS) .......................................................... 43
2.2.3 Transfection / Luciferase assay ........................................................................... 44
2.2.4 Molecular biological methods ............................................................................. 45
2.2.4.1 DNA isolation from mouse tail biopsies ...................................................... 45
2.2.4.2 DNA isolation from cells or tissues .............................................................. 46
2.2.4.3 DNA isolation from agarose gels or PCRs ................................................... 46
2.2.4.4 RNA isolation ............................................................................................... 46
2.2.4.5 Reverse transcription of cDNA .................................................................... 47
2.2.4.6 Polymerase chain reaction (PCR) ................................................................. 47
2.2.4.6.1 RT-PCR ................................................................................................. 47
2.2.4.6.2 Real-Time PCR ...................................................................................... 48
2.2.4.7 Sequencing of DNA fragments..................................................................... 48
2.2.4.8 Gel electrophoresis of DNA and RNA ......................................................... 48
2.2.4.9 Digestion of DNA plasmids and fragments .................................................. 49
2.2.4.10 Ligation of DNA fragments ........................................................................ 49
2.2.4.11 Transformation of chemical competent bacteria ........................................ 49
2.2.4.12 Isolation of plasmid-DNA .......................................................................... 49
2.2.4.13 Genomic southern Blot ............................................................................... 50
2.2.4.14 Chromatin immunoprecipitation (ChIP) ..................................................... 52
III
2.2.4.15 Immunocytochemistry ................................................................................ 54
2.2.4.16 Western Blot ............................................................................................... 55
2.2.4.17 Yeast culture ............................................................................................... 57
2.2.4.17.1 Yeast colony-forming-unit assay ......................................................... 57
2.2.4.18 Induction of peritonitis ............................................................................ 57
3 Results .............................................................................................................................. 59
3.1 NFATc1 in resident macrophages during a fungal infection ..................................... 59
3.1.1 Yeast infection induced transient Nfatc1 gene transcription in resident peritoneal macrophages ................................................................................................................. 59
3.1.2 Rapid translocation of NFATc1, but not of NFATc2 and NFATc3 after yeast stimulation .................................................................................................................... 61
3.1.3 Rapid simultaneous activation of NFATc1 and canonical NF-κB ...................... 64
3.1.4 Predominant expression of NFATc1β-isoforms in peritoneal resident macrophages ................................................................................................................. 66
3.2 Predominant role of NFATc1β-isoforms in antifungal response in macrophages .... 67
3.2.1 NFATc1β-deficient mouse .................................................................................. 67
3.2.2 Normal myeloid compartment in P2Δ mice ........................................................ 69
3.2.3 Unimpaired phagocytosis and antigen presentation in P2Δ mice ....................... 71
3.2.4 NFATc1β deficiency results in a strong reduction of NFATc1-protein expression in P2Δ macrophages ..................................................................................................... 72
3.2.5 Impaired clearance of fungal infections in P2Δ mice ......................................... 73
3.2.6 Reduced infiltration of inflammatory monocytes upon fungal infection in P2Δ mice .............................................................................................................................. 74
3.2.7 Decreased Ccl2 expression in resident P2Δ macrophages .................................. 75
3.3 Ccl2 is a direct novel NFATc1 target gene ................................................................ 76
3.3.1 Interplay between NFATc1 and NF-κB factors during induction of Ccl2 gene transcription .................................................................................................................. 78
3.4 Characterization of the lymphoid compartment in P2Δ mice .................................... 79
3.4.1 Unimpaired lymphoid compartments in P2Δ mice specified NFATc1α-isoforms as critical regulators of B1a cell development ............................................................. 79
3.4.2 Expression of β-isoforms is irrelevant for the major functions of NFATc1 in T- and B-cells .................................................................................................................... 79
3.4.3 Increased levels of NFATc1α-transcripts in P2Δ lymphoid cells ....................... 81
3.5 Generation of the Nfatc1-dsRed knock-in reporter mouse ........................................ 82
3.5.1 Analysis of the Nfatc1-dsRed reporter mouse ..................................................... 85
4 Discussion ......................................................................................................................... 88
4.1 NFATc1 in resident macrophages during fungal infection........................................ 88
IV
4.1.1 Yeast induction results in a rapid nuclear translocation of NFATc1, but not of NFATc2 and NFATc3 .................................................................................................. 88
4.1.2 Predominant expression of NFATc1β-isoforms in peritoneal resident macrophages ................................................................................................................. 89
4.2 The predominant role of NFATc1ß-isoforms in antifungal response ........................ 90
4.2.1 Impaired clearance of fungal infections in P2Δ mice ......................................... 91
4.3 Ccl2 is a novel direct NFATc1 target gene in macrophages ..................................... 92
4.3.1 The interplay between NFATc1- and NF-κB pathways during the induction of Ccl2 gene transcription ................................................................................................ 92
4.4 NFATc1β-deficiency in lymphoid cells .................................................................... 92
4.4.1 Expression of β-isoforms was irrelevant for important functions of NFATc1 in T- and B-cells ............................................................................................................... 93
4.5 Nfatc1-dsRed knock-in reporter mouse ..................................................................... 94
4.5.1 Analysis of the Nfatc1-dsRed reporter mouse ..................................................... 94
Literature ............................................................................................................................. 96
Abbreviations .................................................................................................................... 106
Eidesstattliche Erklärung ................................................................................................... 112

Summary
1
Summary
Peritonitis is a common disease in man, frequently caused by fungi, such as Candida
albicans; however, in seldom cases opportunistic infections with Saccharomyces
cerevisiae are described. Resident peritoneal macrophages (prMΦ) are the major group of
phagocytic cells in the peritoneum. They express a broad range of surface pattern
recognition receptors (PRR) to recognize invaders. Yeast infections are primarily detected
by the Dectin-1 receptor, which triggers activation of NFAT and NF-κB pathways.
The transcription of the Nfatc1 gene is directed by the two alternative promoters, inducible
P1 and relatively constitutive P2 promoter. While the role of P1-directed NFATc1α-
isoforms to promote survival and proliferation of activated lymphocytes is well-
established, the relevance of constitutively generated NFATc1β-isoforms, mainly
expressed in resting lymphocytes, myeloid and non-lymphoid cells, remains unclear.
Moreover, former work at our department indicated different roles for NFATc1α- and
NFATc1β-proteins in lymphocytes.
Our data revealed the functional role of NFATc1 in peritoneal resident macrophages. We
demonstrated that the expression of NFATc1β is required for a proper immune response of
prMΦ during fungal infection-induced acute peritonitis. We identified Ccl2, a major
chemokine produced in response to fungal infections by prMΦ, as a novel NFATc1 target
gene which is cooperatively regulated through the NFAT- and canonical NF-κB pathways.
Consequently, we showed that NFATc1β deficiency in prMΦ results in a decreased
infiltration of inflammatory monocytes, leading to a delayed clearance of peritoneal fungal
infection.
We could further show that the expression of NFATc1β-isoforms is irrelevant for
homeostasis of myeloid and adaptive immune system cells and that NFATc1α- (but not β-)
isoforms are required for a normal development of peritoneal B1a cells. In contrast to the
situation in myeloid cells, NFATc1β deficiency is compensated by increased expression of
NFATc1α-isoforms in lymphoid cells. As a consequence, NFATc1ß is dispensable for
activation of the adaptive immune system.
Taken together our results illustrate the redundancy and indispensability of NFATc1-
isoforms in the adaptive and innate immune system, indicating a complex regulatory
system for Nfatc1 gene expression in different compartments of the immune system and
likely beyond that.
Zusammenfassung
2
Zusammenfassung
Peritonitis ist eine alltägliche Erkrankung des Menschen, die häufig durch Pilze wie
Candida albicans verursacht wird. In seltenen Fällen sind opportunistische Infektionen mit
Saccharomyces cerevisiae beschrieben. Residente peritoneale Makrophagen (prMΦ)
stellen die größte Gruppe phagozytischer Zellen im Peritoneum dar. Sie exprimieren eine
Vielzahl an Oberflächenrezeptoren (PRR), mit denen sie Eindringlinge erkennen.
Hefeinfektionen werden dabei vorrangig durch den Dectin-1 Rezeptor erkannt, der die
Signalkaskaden von NFAT und NF-κB aktiviert.
Die Transkription des Nfatc1 Gens wird von zwei Promotoren gelenkt, dem induzierbaren
P1-Promotor und dem relativ konstitutiven P2-Promotor. Während die Funktionen der vom
P1-Promotor erzeugten NFATc1α-Isoformen beim Überleben und der Proliferation von
aktivierten Lymphozyten wohl bekannt sind, blieb die Rolle der NFATc1β-Isoformen, die
vor allem in ruhenden lymphoiden, myeloiden und nicht-lymphoiden Zellen exprimiert
sind, bisher ungeklärt. Unser Labor konnte zudem zeigen, dass NFATc1α- und NFATc1β-
Proteine unterschiedliche Funktionen in Lymphozyten haben.
Unsere Daten lassen die Funktion von NFATc1 in peritonealen Makrophagen erkennen.
Wir konnten zeigen, dass während einer pilzinduzierten Peritonitis die Expression von
NFATc1β für eine vollständige Immunantwort der prMΦ erforderlich ist. Wir haben Ccl2,
das am stärksten von prMΦ als Antwort auf Pilzinfektionen produzierte Chemokin, als
neues NFATc1 Zielgen identifiziert, welches kooperativ von den NFATc1- und NF-κB-
Signalwegen reguliert wird. Folglich konnten wir zeigen, dass das Fehlen von NFATc1β in
prMΦ zu einer Abnahme der eindringenden entzündlichen Monozyten führt, was eine
verspätete Abwehr von peritonealen Pilzinfektionen zur Folge hat.
Des Weiteren konnten wir zeigen, dass die Expression von NFATc1β-Isoformen irrelevant
für die Homöostase von myeloiden und adaptiven Immunzellen ist, und dass NFATc1α-
(aber nicht β-) Isoformen für die normale Entwicklung von B1a-Zellen erforderlich sind. In
lymphoiden Zellen wird das Fehlen von NFATc1β, im Gegensatz zur Situation in
myeloiden Zellen, durch eine erhöhte Expression von NFATc1α kompensiert. Demzufolge
ist NFATc1β entbehrlich für die Aktivierung des adaptiven Immunsystems.
Zusammengenommen zeigen unsere Ergebnisse die Redundanz und die Unentbehrlichkeit
der NFATc1-Isoformen im adaptiven und natürlichen Immunsystem, welche auf ein
komplexes regulatorisches System der Genexpression von NFATc1 in den verschiedenen
Kompartimenten des Immunsystems und wahrscheinlich darüber hinaus hinweist.

Introduction
3
1 Introduction
1.1 The immune system
The immune system is a complex network for protection against invaders, such as
microbes, and removes transformed and dead cells from healthy organisms. It is generally
divided into innate and adaptive immunity. The innate immune system is the first line of
defense – it reacts very fast, relatively unspecific and has no memory. It comprises two
subsets: 1.) physical and chemical barriers, like skin or mucosa, supported by the
complement system, a biochemical system of small proteins to maintain the detection of
targets, and 2.) innate immune cells, such as macrophages, dendritic cells and granulocytes
(neutrophils, eosinophils, mast cells and basophils). Natural killer (NK) cells are
categorized as innate immune cells, although they are of lymphoid origin.
All immune cells originate from a common precursor, the hematopoietic stem cell in bone
marrow, which can differentiate into the myeloid lineage giving raise to innate immune
cells, and into the lymphoid lineage. To guard the organism, innate immune cells are found
to be resident in tissues and circulating in the blood stream. Primarily, the immune system
essentially distinguishes between self and foreign. To do so innate immune cells detect
pathogen associated molecule patterns (PAMP), such as conserved microbial structures,
with their surface germ line encoded pattern recognition receptors (PRR). To eliminate
targets their weapon repertoire is huge: they can phagocyte, produce toxic substances, as
nitrogen monoxide (NO) or reactive oxygen species (ROS), and they can produce a broad
range of cytokines, such as IFNγ, TNFα, IL2 and CCL2. Furthermore, they are able to
present antigens to cells of the adaptive immune system by loading foreign peptides to
their major histocompatibility complex molecule II (MHCII). Therefore they are
designated as antigen-presentation cells (APC).
The adaptive immune system is evolutionary younger and present in all jawed vertebrates.
Because it needs the activation and/or presentation by other cells it forms the second line
of defense. The advantage of this system is its high specificity and a formed memory. Due
to somatic recombination of their immunoglobulin VJD genes it has a diverse repertoire of
receptors. It can be divided in two parts – the cellular and the humoral system. The cellular
part is constituted by lymphocytes. Lymphocytes are derived from lymphoid lineage
precursors, which differentiate mainly into T- and B-cells. T-cell differentiation takes place
in the thymus, whereas B-cells are educated in bone marrow. Every lymphocyte carries a
unique specific receptor (T-cell receptor (TCR), B-cell receptor (BCR)), which is depicted

Introduction
4
by clonal selection before the lymphocytes enter the periphery. During clonal selection,
cells are checked for their autoreactivity. If a lymphocyte reacts against self-antigens it is
removed. After clonal selection T- and B-cells are found in the periphery in lymphatic
organs, mainly in the spleen and lymph nodes. In these organs, antigens are presented to T-
and B-cells, which show after activation a fast clonal expansion and, thereby, are able to
react efficiently. After an infection is cleared some of the antigen-specific cells become
long-lived memory cells to enable a faster reaction next time facing the same antigen.
Some B-cells become plasma cells, which produce highly specific antibodies
(immunoglobulins) against antigens. These build up the humoral part of the adaptive
immune system.
1.2 Macrophages
Macrophages (“big eater” (greek: markos = large, phagein = eat)) are important tissues
resident cells of the innate immune system. Two cell surface molecules are used to define
macrophages: CD11b, a subunit of the heterodimeric integrin MAC1 (CR3), which could
be found on all leucocytes and F4/80 (homolog to hEmr3 (EGF-module-containing mucin-
like hormone receptor)), an EGF-TM7 family member, which is only expressed by
macrophages, eosinophils and some dendritic cells (Solovjov et al., 2005; Taylor et al.,
2005).
Due to their specific adaptation to the tissues, macrophages are heterogeneous. They form
Kupffer cells in liver, aveolar macrophages in lung, osteoclasts in bones or peritoneal
macrophages in the peritoneal cavity (Gordon and Taylor, 2005). Beside their anatomic
localization and surface markers these subpopulations are defined by their different
expression of specific growth and transcription factors (Yona et al., 2013).
The microenvironment influences the differentiation of macrophages into two subtypes:
the activated “classical” M1 or the activated “alternative” M2 macrophage. Due to their
activation by LPS (Lipopolysaccharide) and/or IFNγ M1 macrophages show a pro-
inflammatory phenotype. M2 macrophages respond to IL4 and IL13 in a more anti-
inflammatory manner and are involved in tissue repair (Varin et al., 2010; Murray and
Wynn, 2011). The M2 cells have some common characteristics with tumor associated
macrophages (TAM) and are able to induce the translocation of c-myc into the nucleus
(Pello et al., 2012).
How resident macrophages propagate themselves is still under discussion – are they able to
proliferate or are they derived from circulating bone-marrow-derived monocytes (Taylor et
al., 2005; Davies et al., 2011; Hashimoto et al., 2013; Yona et al., 2013)? Recently it was

Introduction
5
shown that tissue macrophages proliferate in newborns. Nevertheless, proliferation is
strongly reduced in adults, but could be resumed after inflammation (Davies et al., 2011).
Tissue resident macrophages have a specific receptor repertoire with a wide range of
functions, as differentiation, survival, adhesion, migration, cytotoxicity, activation and
phagocytosis (Taylor et al., 2005). Some of these receptors (PRR) are able to recognize
conserved microbial structures, like LPS and β-glucan, so called PAMP (Taylor et al.,
2005). LPS is a gram-negative bacterial cell wall component, which binds to TLR4, a
member of the Toll-like receptor family. TLR-family members, such as TLR1, TLR2,
TLR4, TLR7 and TLR9 control besides the recognition of bacterial components, antifungal
immunity. But in comparison to CLRs (C-type lectin receptor), they are not essential in
this respect (Hardison and Brown, 2012). β-glucan is a prominent component of fungi cell
walls which makes up to 50% of the dry weight of a Saccharomyces cerevisiae cell and is
recognized by the CLR Dectin-1 on peritoneal macrophages (Taylor et al., 2005; Taylor et
al., 2007).
1.2.1 The Dectin-1 receptor
Dectin-1 is a Natural Killer- like C-type lectin receptor (NKCL). It has as a type II
transmembrane receptor an extracellular carbohydrate binding domain, a transmembrane
spanning domain and an intracellular tail with an ITAM (immune receptor tyrosine based
activation motif). With its extracellular domain, it recognizes a variety of plant, bacterial
and fungal β-glucan (β-1,3 and/or β-1,6) cell wall components (Taylor et al., 2005). It is
even able to recognize intact fungi, such as S. cerevisiae and Candida albicans (Brown et
al., 2003).
After a fungus binds to the Dectin-1 receptor, its tyrosine residues in the ITAM are
phosphorylated by Src family kinases and act as platform for Syk kinases. Syk kinases can
activate a broad range of proteins and enzymes downstream of the Dectin-1 receptor, such
as PLCγ (Phospholipase C) and CARD9. PLCγ can cleave PIP2 (phospholipid
phosphatidylinositol 4,5-bisphosphate) into DAG (diacyl-glycerol) and IP3 (inositol 1,4,5-
trisphosphate). IP3 leads to Ca2+ release from the ER and, by this, to activation of
calcineurin and to dephosphorylation of NFAT and its translocation into the nucleus
(Fig.1.1 A&B). CARD9 functions as an adapter protein for Bcl10 (B-cell CLL/lymphoma-
10) and Malt1 (Mucosa Associated Lymphoid Tissue Lymphoma Translocation Gene-1),
which are needed to phosphorylate IKK (Iκb kinase), a complex formed by IKKα and β
together with the scaffold and sensing protein NEMO, which itself phosphorylates IκB in
order to ubiquinate it. The degradation of IκB allows the translocation of p65 (RelA)and

Introduction
6
p50 into the nucleus. There, the canonical NF-κB pathway finally activates a broad range
of genes. Indications for an involvement of the non-canonical NF-κB pathway downstream
of the Syk kinase are described as well (Osorio and Reis e Sousa, 2011). Due to their DNA
binding domain, RHD (Rel-homology domain), NFAT and NF-κB belong both to the same
superfamily of Rel-transcription factors. The NF-κB family consists of NF-κB- or Rel-
proteins, which form dimers after activation and translocate to the nucleus. In the
cytoplasm, they are found in a “latent” and inactive form, in complexes with Inhibitory κB-
(IκB) proteins, or IκB-domain containing proteins. The non-canonical pathway needs
activation of its IKK complex (formed by two IKKα subunits) by the NF-κB-inducing
kinase NIK. This IKK complex phosphorylates the C-terminal IκB subunit of p100 leading
to a partial proteolysis of p100 to p52, which forms dimers with RelB and translocates in
the nucleus (Gilmore, 2006).
Fig.1.1 Yeast cell wall and signaling of Dectin-1. (A) Structure of a yeast cell wall. Electron micrograph of a fungal cell wall and a detailed scheme of the cell wall of C. albicans. It consists mainly of Mannan indicating mannosylated proteins, β-glucan, that can be exposed in specific areas and chitin. Modified after Hardison et. al, 2012. (B) Signaling through Dectin-1. β-glucan binds to the Dectin-1 receptor, Src kinases phosphorylate residues in the ITAM, which allows Syk kinase binding and phosphorylation of proteins, such as CARD9 and PLCγ. This leads to the activation of NF-κB and NFAT and their translocation to induce a broad range of target genes. Adopted from Osorio et al., 2011.
During antifungal responses, the Dectin-1 receptor can “crosstalk” with TLRs. One of the
first described interaction partners of Dectin-1 was TLR2. These interactions provide an
optimal reaction to fungal infections, but they are still poorly understood (Dennehy et al.,
2009; Hardison and Brown, 2012).
Few others noteworthy characteristics of Dectin-1 are that, (1.) in addition to macrophages
it is found on CD4+ and CD8+ T-cells where it could act as a costimulatory molecule to
A
B
Introduction
7
induce proliferation and that, (2.) it acts as phagocytic receptor which could be internalized
to phagocyte bound fungi (Herre, 2004; Reid et al., 2004).
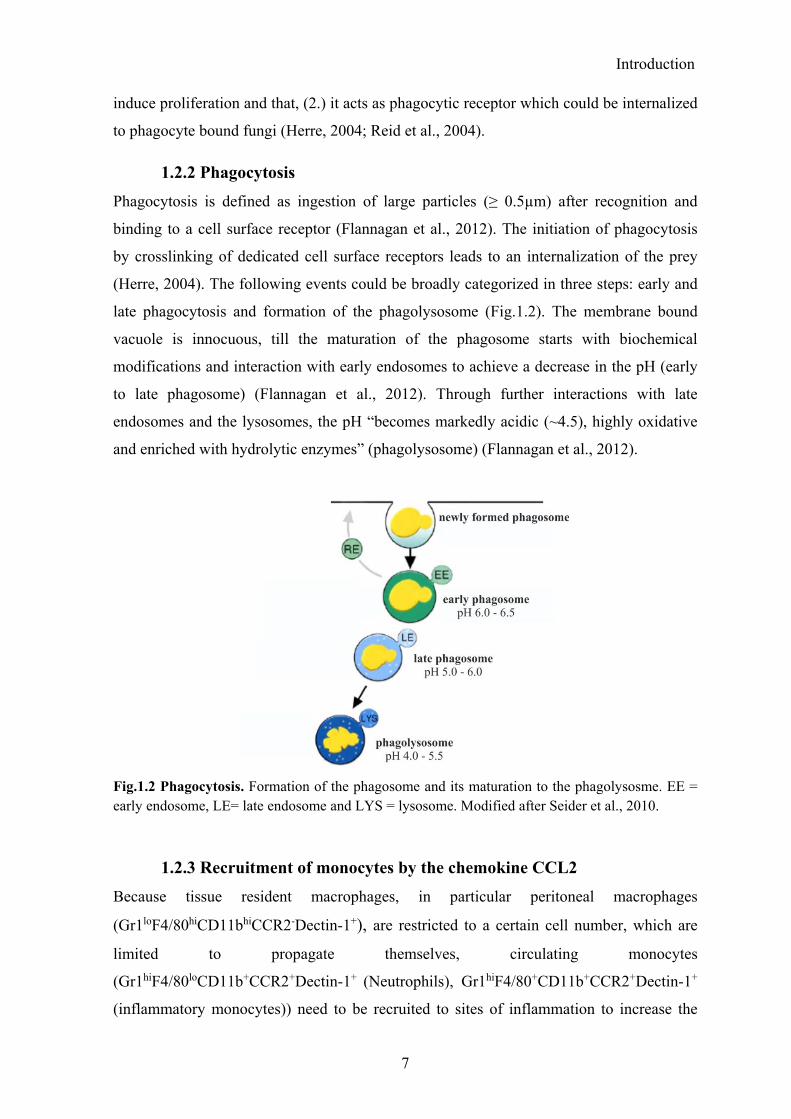
1.2.2 Phagocytosis
Phagocytosis is defined as ingestion of large particles (≥ 0.5µm) after recognition and
binding to a cell surface receptor (Flannagan et al., 2012). The initiation of phagocytosis
by crosslinking of dedicated cell surface receptors leads to an internalization of the prey
(Herre, 2004). The following events could be broadly categorized in three steps: early and
late phagocytosis and formation of the phagolysosome (Fig.1.2). The membrane bound
vacuole is innocuous, till the maturation of the phagosome starts with biochemical
modifications and interaction with early endosomes to achieve a decrease in the pH (early
to late phagosome) (Flannagan et al., 2012). Through further interactions with late
endosomes and the lysosomes, the pH “becomes markedly acidic (~4.5), highly oxidative
and enriched with hydrolytic enzymes” (phagolysosome) (Flannagan et al., 2012).
Fig.1.2 Phagocytosis. Formation of the phagosome and its maturation to the phagolysosme. EE = early endosome, LE= late endosome and LYS = lysosome. Modified after Seider et al., 2010.
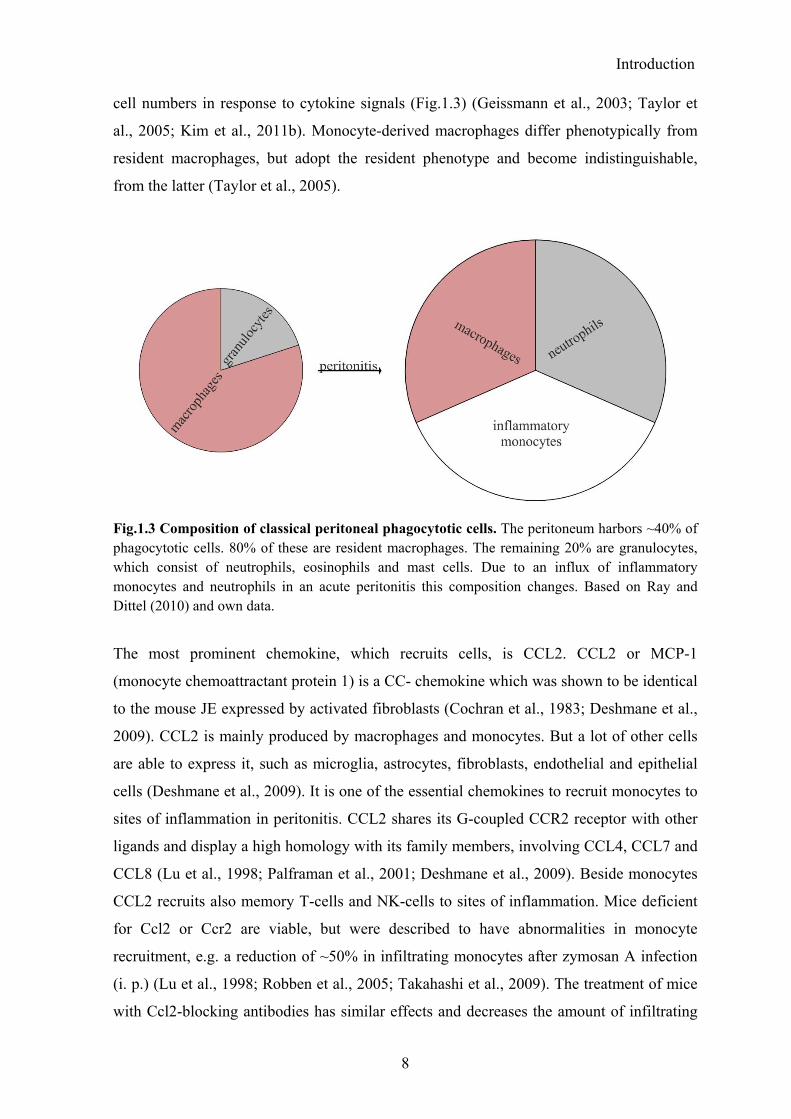
1.2.3 Recruitment of monocytes by the chemokine CCL2
Because tissue resident macrophages, in particular peritoneal macrophages
(Gr1loF4/80hiCD11bhiCCR2-Dectin-1+), are restricted to a certain cell number, which are
limited to propagate themselves, circulating monocytes
(Gr1hiF4/80loCD11b+CCR2+Dectin-1+ (Neutrophils), Gr1hiF4/80+CD11b+CCR2+Dectin-1+
(inflammatory monocytes)) need to be recruited to sites of inflammation to increase the
Introduction
8
cell numbers in response to cytokine signals (Fig.1.3) (Geissmann et al., 2003; Taylor et
al., 2005; Kim et al., 2011b). Monocyte-derived macrophages differ phenotypically from
resident macrophages, but adopt the resident phenotype and become indistinguishable,
from the latter (Taylor et al., 2005).
Fig.1.3 Composition of classical peritoneal phagocytotic cells. The peritoneum harbors ~40% of phagocytotic cells. 80% of these are resident macrophages. The remaining 20% are granulocytes, which consist of neutrophils, eosinophils and mast cells. Due to an influx of inflammatory monocytes and neutrophils in an acute peritonitis this composition changes. Based on Ray and Dittel (2010) and own data.
The most prominent chemokine, which recruits cells, is CCL2. CCL2 or MCP-1
(monocyte chemoattractant protein 1) is a CC- chemokine which was shown to be identical
to the mouse JE expressed by activated fibroblasts (Cochran et al., 1983; Deshmane et al.,
2009). CCL2 is mainly produced by macrophages and monocytes. But a lot of other cells
are able to express it, such as microglia, astrocytes, fibroblasts, endothelial and epithelial
cells (Deshmane et al., 2009). It is one of the essential chemokines to recruit monocytes to
sites of inflammation in peritonitis. CCL2 shares its G-coupled CCR2 receptor with other
ligands and display a high homology with its family members, involving CCL4, CCL7 and
CCL8 (Lu et al., 1998; Palframan et al., 2001; Deshmane et al., 2009). Beside monocytes
CCL2 recruits also memory T-cells and NK-cells to sites of inflammation. Mice deficient
for Ccl2 or Ccr2 are viable, but were described to have abnormalities in monocyte
recruitment, e.g. a reduction of ~50% in infiltrating monocytes after zymosan A infection
(i. p.) (Lu et al., 1998; Robben et al., 2005; Takahashi et al., 2009). The treatment of mice
with Ccl2-blocking antibodies has similar effects and decreases the amount of infiltrating

Introduction
9
cells, which leads to a higher recovery of pathogens in peritonitis models (Lu et al., 1998;
Matsukawa et al., 1999). Its absence also leads to an elevated bone mass, which indicates
an important role in osteoclasts (Sul et al., 2012).
After TNFα induction or due to activation of the Dectin-1 receptor pathway Ccl2 was
described to be a target gene of the canonical NF-κB pathway (Ping et al., 1996; Saccani et
al., 2001; Taylor et al., 2007). In C. albicans-infected Dectin-1 ko-mice a decreased
amount of Ccl2 was detected in the peritoneal fluid, which led to less efficient recruitment
of inflammatory cells into the peritoneal cavity (Taylor et al., 2007).
There are some hints that CCL2 could be a target of NFAT. It is described that CCL2 is
sensible to CsA treatment after stimulation with Pam3Cys in the human mast cell line
LAD2, but not in MLMC or BMMC (murine lung derived mast cells or bone marrow
derived mast cells) and that CsA completely inhibits PAF- (platelet activation factor)
induced NFAT activation and CCL2 production in RBL-3H3 cells (basophilic leukemia
cell line) (Venkatesha, 2004; Zaidi et al., 2006). In microglia and astrocytes NFATc1 and
NFATc2 are described to translocate upon UDP (uridine 5’ diphosphate) activation, which
leads to Ccl2 expression (Kim et al., 2011a). For microglia it is known that LPS can induce
NFATc1/c2-dependent Ccl2 production which can be strongly reduced with the NFAT
inhibitor VIVIT (Nagamoto-Combs and Combs, 2010).
1.3 T- and B-cells
T- and B-cells are the most prominent cells of the adaptive immune system. T-cells are
derived from a common lymphoid progenitor (CLP), but contrary to other immune cells
their lymphoid progenitor leaves the bone marrow via the blood stream to develop in the
thymus (Graf, 2008). Thymocytes migrate from the thymic cortex during their further
differentiation into the medulla. At the latest CD4-CD8- double negative stage, which
displays the DN4 stage of thymocytes, the pre-TCR is expressed. After the somatic
recombination, the DN thymocytes become double positive (DP) for CD4 and CD8 and
express the complete rearranged TCR (McCaughtry and Hogquist, 2008; Patra et al.,
2013). In both subunits of the thymus special epithelial cells (c or mTECs (cortex or
medullas thymus epithelial cells)) express MHCI and MHCII molecules to present self-
antigens to the freshly generated TCRs of the DP thymocytes. The DP cells undergo a
process called central tolerance. It consists of two selection steps: firstly positive selection
to make sure that the cells react to MHC presented antigens, known as MHC restriction
(McCaughtry and Hogquist, 2008). The decision, if they become CD4 or CD8 single
positive (SP) cells, is made during this first step depending on the antigen-presentation via
Introduction
10
MHCI, which leads to only CD8 positive cells, or via MHCII, which leads to CD4 positive
cells (Germain, 2002). Secondly, the positively selected thymocytes pass through negative
selection, where auto-reactive cells are eliminated. The naïve T-cells leave the thymus to
the secondary lymphoid organs.
In the peripheral lymphoid organs, naïve T-cells can find their antigen and become
activated. Due to activation, CD8+ T-cells differentiate to cytotoxic T-cells (CTLs), which
kill transformed and infected cells by the induction of apoptosis. They have a special
repertoire of weapons, which consists of perforins and granzymes (Andersen et al., 2006).
CD4+ T-cells display the helper and regulatory T-cell subset. They differentiate after
activation in response to the cytokine milieu, e.g. provided by APCs, into different
subtypes. The two most prominent subtypes are the TH1-cells, which are generated in
response to IL12 and IFNγ, and TH2-cells, generated in response to IL4. TH2-cells are
specialized to protect against extracellular pathogens, such as worms and help TH1-cells to
protect against intracellular infections (Petermann and Korn, 2011). In the recent years,
new CD4+ T-cell subtypes were identified, such as TH9-, TH17- and TFH-cells. Important
CD4+-regulatory cells are Tregs, which keep immune reactions under control by suppressing
effector cells.
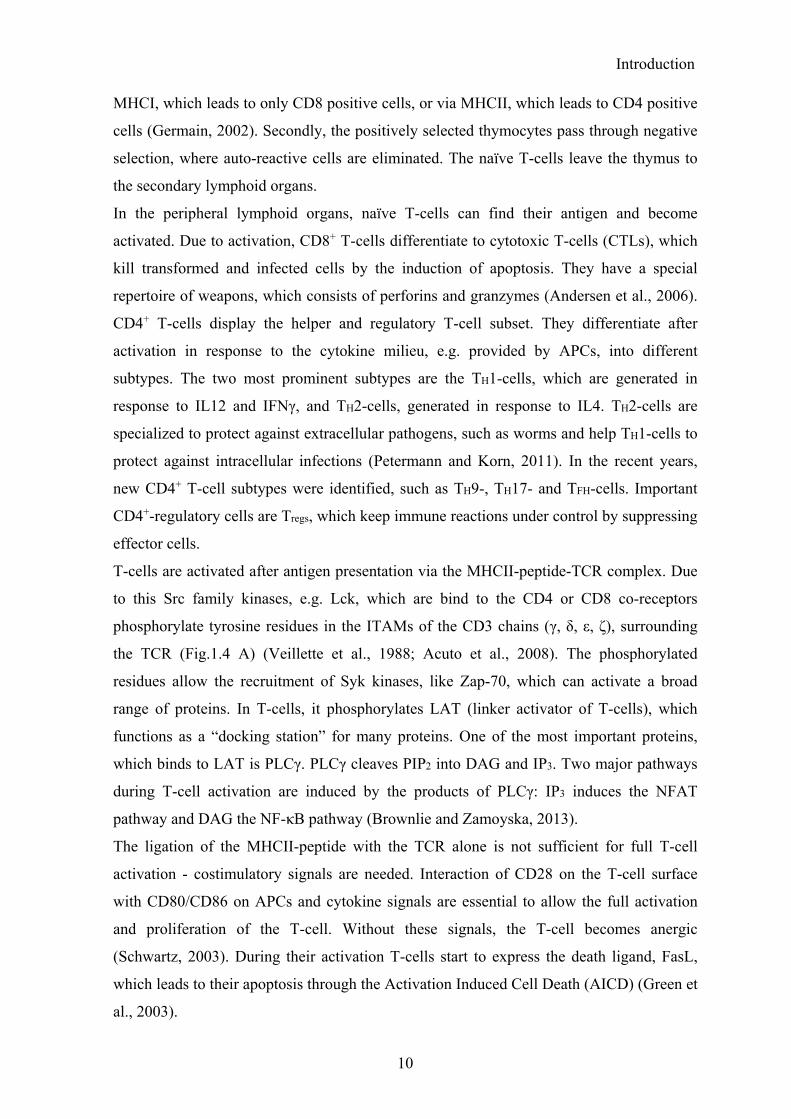
T-cells are activated after antigen presentation via the MHCII-peptide-TCR complex. Due
to this Src family kinases, e.g. Lck, which are bind to the CD4 or CD8 co-receptors
phosphorylate tyrosine residues in the ITAMs of the CD3 chains (γ, δ, ε, ζ), surrounding
the TCR (Fig.1.4 A) (Veillette et al., 1988; Acuto et al., 2008). The phosphorylated
residues allow the recruitment of Syk kinases, like Zap-70, which can activate a broad
range of proteins. In T-cells, it phosphorylates LAT (linker activator of T-cells), which
functions as a “docking station” for many proteins. One of the most important proteins,
which binds to LAT is PLCγ. PLCγ cleaves PIP2 into DAG and IP3. Two major pathways
during T-cell activation are induced by the products of PLCγ: IP3 induces the NFAT
pathway and DAG the NF-κB pathway (Brownlie and Zamoyska, 2013).
The ligation of the MHCII-peptide with the TCR alone is not sufficient for full T-cell
activation - costimulatory signals are needed. Interaction of CD28 on the T-cell surface
with CD80/CD86 on APCs and cytokine signals are essential to allow the full activation
and proliferation of the T-cell. Without these signals, the T-cell becomes anergic
(Schwartz, 2003). During their activation T-cells start to express the death ligand, FasL,
which leads to their apoptosis through the Activation Induced Cell Death (AICD) (Green et
al., 2003).
Introduction
11
Fig.1.4 TCR and BCR. (A) αβTCR with the CD3 chains γ, ε, ζ and δ. ITAMs are marked in red. Src kinases like Lck are bound to CD4 or CD8 and phosphorylate tyrosine residues in the ITAMs of the CD3 chains after ligand binding. These phosphorylated residues are bound by Syk kinases, e.g. Zap-70, to activate further proteins. Adopted from Brownlie and Zamoyska, 2013. (B) BCR with the associated Src kinase family PTK (protein tyrosine kinase), which phosphorylates tyrosine residues (Y) in the ITAM motifs (grey) of the Igα and Igβ chains. The phosphorylated residues allow the binding of Syk family kinases. Modified after Monroe, 2006.
B-cells differentiate in bone marrow from germ line lymphoid precursor cells into pre-pro-,
pro- and pre- B-cells. During these developmental stages, they rearrange their
immunoglobulin heavy chains and light chains in the pre-B-cell stage. Both chains are
transported to the surface and build up the specific BCR. An immature B-cell carries
membrane bound IgM (Fig.1.4 B) and leaves the bone marrow to the secondary lymphoid
organs, like spleen or lymph nodes. They differentiate further to naïve mature B-cells,
which carries IgM and IgD and produce both as soluble antibodies (Hardy and Hayakawa,
2001).
If a naïve mature B-cell becomes activated, it class-switches its immunoglobulins to IgG,
IgE or IgA and differentiates to either a plasma cell or a memory cell (Klein and Dalla-
Favera, 2008; Harwood and Batista, 2010). Depending on its location it will produce low-
affinity antibodies or undergo somatic hypermutation in germinal centers to produce
antibodies with high-affinity (Harwood and Batista, 2010). B-cells can be activated by T-
cell-dependent or also by T-cell-independent signals. In the latter case, BCRs are
crosslinked by an antigen, and the cell gets a second signal, for instants from a Toll-like
receptor (Pihlgren et al., 2013). B-cells process their BCR-bound antigens and can present
Introduction
12
them via MHCII, which makes them to antigen-presenting cells (Rodriguez-Pinto, 2005;
Rodriguez-Pinto and Moreno, 2005).
The signaling cascade following BCR activation is in principal very similar to the cascade
following the TCR ligation (compare above). But each cell has also special features, e.g.
instead of the Src kinases Lck and Fyn in T-cells, B-cells express mainly Lyn (Monroe,
2006). The AICD of B-cells is similar to the AICD in T-cells, too.
Two subclasses of B-cells are know: B1- and B2-cells (Duber et al., 2009). B2-cells are the
conventional B-cells. Although B1-cells have classical B-cell features, they are mainly
generated in the fetal liver and maintain themselves by self-renewal (Carey et al., 2008).
They are subdivided by their CD5 expression in B1a-cells (CD5+) and B1b-cells (CD5-),
which are mainly found in the peritoneal and pleural cavities (Martin and Kearney, 2001;
Hardy, 2006; Carey et al., 2008).
1.4 The NFAT family
The NFAT (Nuclear Factor of Activated T-cells) transcription factor family consists of the
five members NFATc1 (NFAT2, NFATc), NFATc2 (NFAT1, NFATp), NFATc3 (NFAT4,
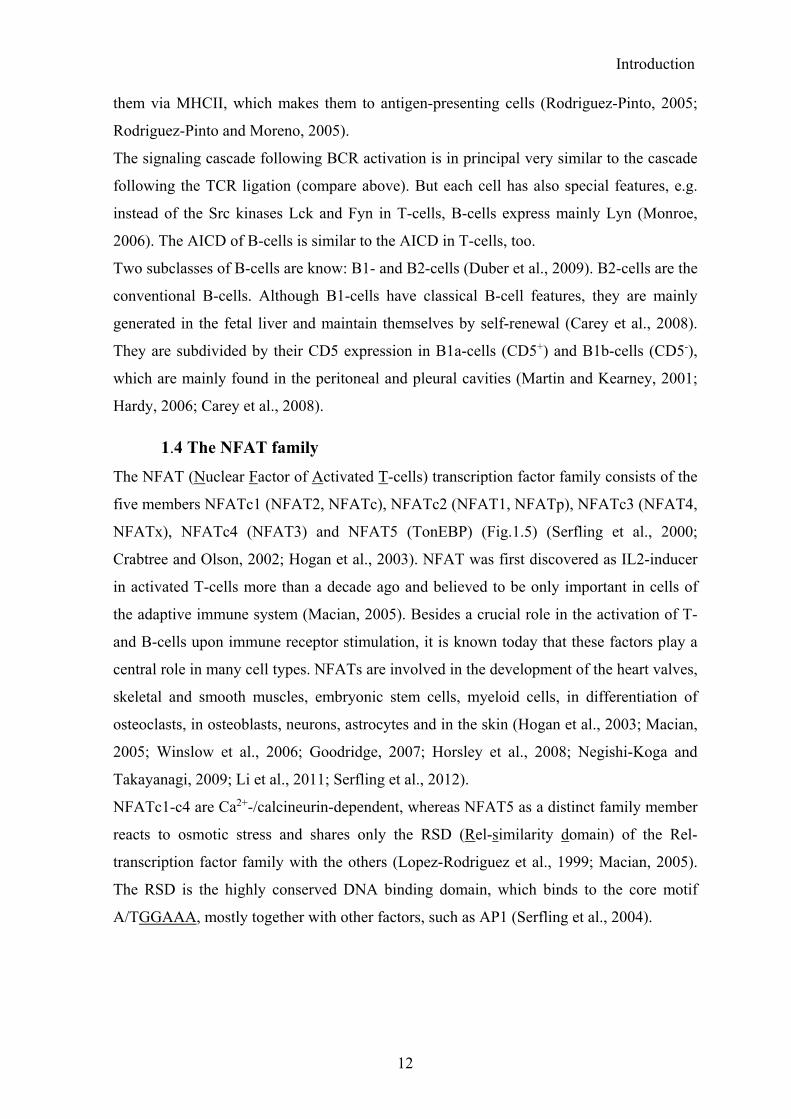
NFATx), NFATc4 (NFAT3) and NFAT5 (TonEBP) (Fig.1.5) (Serfling et al., 2000;
Crabtree and Olson, 2002; Hogan et al., 2003). NFAT was first discovered as IL2-inducer
in activated T-cells more than a decade ago and believed to be only important in cells of
the adaptive immune system (Macian, 2005). Besides a crucial role in the activation of T-
and B-cells upon immune receptor stimulation, it is known today that these factors play a
central role in many cell types. NFATs are involved in the development of the heart valves,
skeletal and smooth muscles, embryonic stem cells, myeloid cells, in differentiation of
osteoclasts, in osteoblasts, neurons, astrocytes and in the skin (Hogan et al., 2003; Macian,
2005; Winslow et al., 2006; Goodridge, 2007; Horsley et al., 2008; Negishi-Koga and
Takayanagi, 2009; Li et al., 2011; Serfling et al., 2012).
NFATc1-c4 are Ca2+-/calcineurin-dependent, whereas NFAT5 as a distinct family member
reacts to osmotic stress and shares only the RSD (Rel-similarity domain) of the Rel-
transcription factor family with the others (Lopez-Rodriguez et al., 1999; Macian, 2005).
The RSD is the highly conserved DNA binding domain, which binds to the core motif
A/TGGAAA, mostly together with other factors, such as AP1 (Serfling et al., 2004).
Introduction
13
Fig.1.5 NFAT family members. All five family members are shown with their different structures and isoforms. NFATc1-c4 are closely related and contain all a Ca2+-dependent regulatory domain (NHR) and a highly conserved DNA binding domain RSD (Rel similarity domain) (grey). The transactivation domains (TADs) are marked in green. Violet ellipses mark the SP1-3 motifs. Modified from Serfling et al. 2006.
1.4.1 NFAT structure
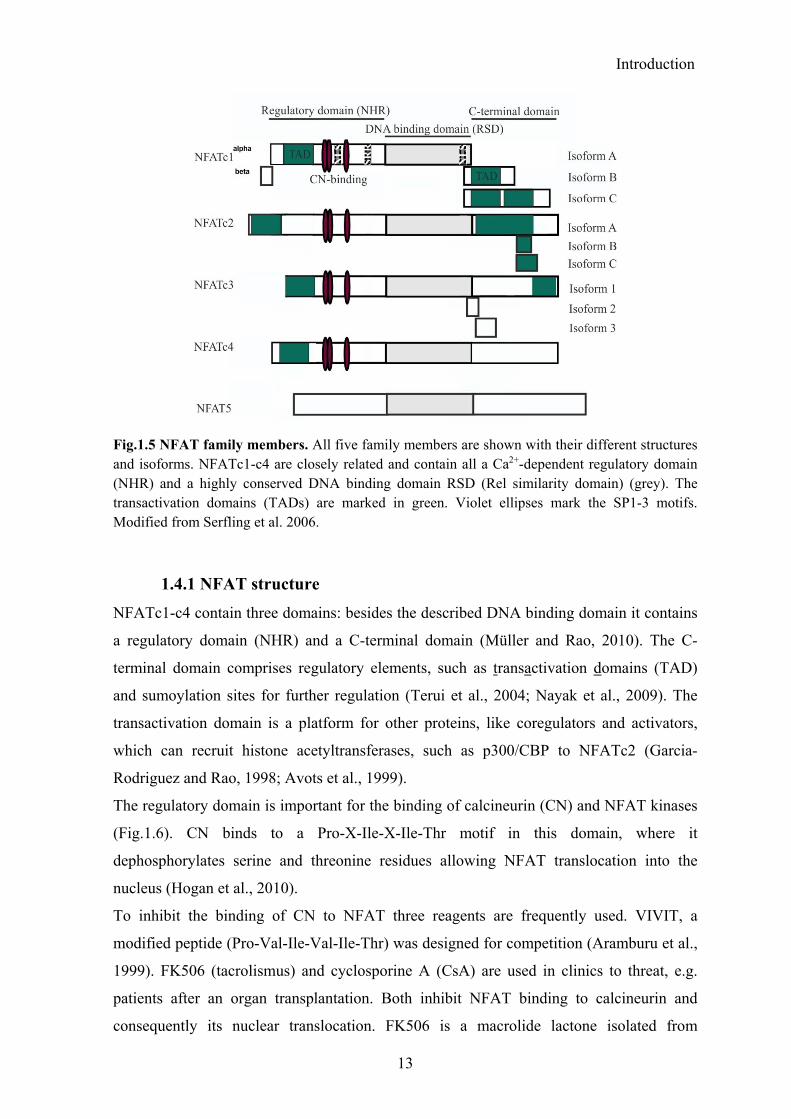
NFATc1-c4 contain three domains: besides the described DNA binding domain it contains
a regulatory domain (NHR) and a C-terminal domain (Müller and Rao, 2010). The C-
terminal domain comprises regulatory elements, such as transactivation domains (TAD)
and sumoylation sites for further regulation (Terui et al., 2004; Nayak et al., 2009). The
transactivation domain is a platform for other proteins, like coregulators and activators,
which can recruit histone acetyltransferases, such as p300/CBP to NFATc2 (Garcia-
Rodriguez and Rao, 1998; Avots et al., 1999).
The regulatory domain is important for the binding of calcineurin (CN) and NFAT kinases
(Fig.1.6). CN binds to a Pro-X-Ile-X-Ile-Thr motif in this domain, where it
dephosphorylates serine and threonine residues allowing NFAT translocation into the
nucleus (Hogan et al., 2010).
To inhibit the binding of CN to NFAT three reagents are frequently used. VIVIT, a
modified peptide (Pro-Val-Ile-Val-Ile-Thr) was designed for competition (Aramburu et al.,
1999). FK506 (tacrolismus) and cyclosporine A (CsA) are used in clinics to threat, e.g.
patients after an organ transplantation. Both inhibit NFAT binding to calcineurin and
consequently its nuclear translocation. FK506 is a macrolide lactone isolated from
Introduction
14
Streptomyces tsukubaensis, which forms a complex with the immunophilin FKBP (FK506-
binding protein) (Kino et al., 1987a; Kino et al., 1987b; Huai et al., 2002). CsA was
isolated from the fungus Tolypocladium inflatum, which forms, like FK506, a complex
with an immunophilin - CyPA (cyclophillin A) (Borel et al., 1976). The binding of both
drugs to immunophilins, which are peptidyl-prolyl cis-trans isomerases (PPIase), leads to
the inhibition of their PPIase activity. Therefore, these complexes function as
noncompetitive inhibitors of NFAT by binding to the active pocket of CN, which is built
by its regulatory and catalytic domain (Huai et al., 2002; Sieber and Baumgrass, 2009).
The regulatory domain of NFATc proteins contains various motifs for the binding of
NFAT kinases casein kinase 1 (CK1), glycogen synthase kinase 3 (GSK3) and dual-
specificity-tyrosine-phosphorylation-regulated kinase (DYRK). These motifs are serine-
containing short peptide sequences, like Ser-Pro-X-X (SP1-3) and serine rich regions
(SRR1&2), which are phosphorylated by NFAT kinases to relocate NFAT to the
cytoplasm. CK1 binds to SSR1 only in NFATc2 for export or maintenance in the
cytoplasm (Okamura et al., 2004). GSK3 binds to SP2 and SP3 to control the export of
NFATc1 and to SP2 in NFATc2 (Beals et al., 1997). In NFATc1, both SP2 and SP3 need
to be “pre-phosphorylated” by DYRK or PKA to be recognized by GSK3 (Arron et al.,
2006; Gwack et al., 2006). DYRK binds and phosphorylates SP3 for export or, if it takes
place under resting conditions, in the cytoplasm, for maintenance (Arron et al., 2006;
Gwack et al., 2006). Both the nuclear translocation signal (NLS) and the nuclear export
signal (NES) are part of the regulatory domain and become accessible due to
conformational changes after dephosphorylation and phosphorylation events (Crabtree and
Olson, 2002).
Fig.1.6 NFATc structure. The N-terminal regulatory domain contains a TAD, three SP motifs 1-3 (violet ellipses), where CN and NFAT kinases bind, and two SRR motifs (1&2). The DNA binding domain (Rel-similarity-domain) is highly conserved between the family members. The C-terminal domain contains further TADs and regulatory elements, such as sumoylation sites. Based on Müller & Rao, 2010.
Introduction
15
Besides reversible phosphorylation to control NFAT location, additional control
mechanisms were discovered. The cytoplasmic scaffold proteins HOMER2 and HOMER3
compete with CN to inhibit NFAT translocation, the NRON-LRRK2 complex in BMDM
inhibits NFAT shuffling and in non-apoptotic effector T-cells the expression of NFATc2 is
controlled by Caspase 3. Further control mechanisms are, e.g. the ubiqutination by MDM2
in breast cancer cells and sumoylation, which is crucial for nuclear retention in T-cells
(Terui et al., 2004; Willingham et al., 2005; Yoeli-Lerner et al., 2005; Wu et al., 2006;
Huang et al., 2008; Nayak et al., 2009; Yoeli-Lerner et al., 2009; Liu et al., 2011).
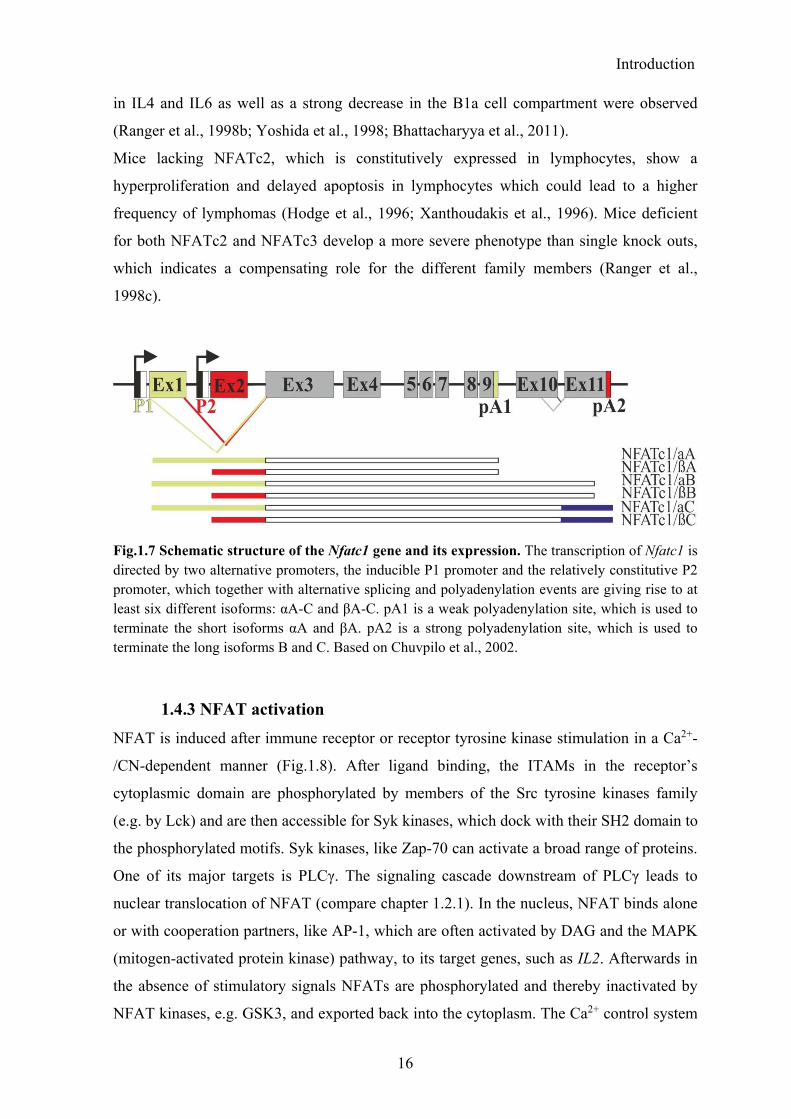
1.4.2 NFATc1
NFATc1 is unique among the NFATc members. At first its isoforms come in two
“flavors”, as α- or β-isoforms according to the used promoter, second, NFATc1 expression
is controlled by an autoregulatory loop, which allows a self-induction/control and, third, its
αA-isoform acts anti-apoptotic and supports the antigen-mediated proliferation of
lymphocytes (Chuvpilo et al., 1999; Chuvpilo et al., 2002; Hock et al., 2013). The murine
and human NFATc1 genes are highly conserved spanning 110-140kb and 11 exons
(Serfling et al., 2012). The transcription of Nfatc1 is directed by two alternative promoters,
the inducible P1 promoter and the constitutively active P2 promoter, which together with
alternative splicing and polyadenylation events are giving rise to at least six different
isoforms with individual functions (Fig.1.7) (Park et al., 1996; Chuvpilo et al., 1999). The
α-peptide has a length of 42 aa with nine proline and eight serine and threonine residues,
whereas the β-peptide has only a length of 29 aa. It contains one proline and two serine and
threonine residues (Park et al., 1996; Serfling et al., 2012). While the role of the P1-
directed NFATc1α-isoforms to promote survival of activated lymphocytes is well-
established and shown to be essential upon immune receptor stimulation in lymphocytes,
the relevance of constitutively generated NFATc1β-isoforms remains unclear. NFATc1β-
isoforms are mainly expressed in resting lymphocytes, myeloid and non-lymphoid cells
(Park et al., 1996; Serfling et al., 2012). NFATc1αA is highly induced in activated
lymphocytes and can autoregulate itself by binding to P1, which leads to a predominant
expression of NFATc1αA after activation and an induction within hours in a secondary
stimulation (Serfling et al., 2012). Due to a failure in heart valves differentiation, the lack
of NFATc1 during development leads to embryonic lethality at E14/15, which indicates an
essential role of NFATc1 during development (Ranger et al., 1998a). Nevertheless, the
lack of the other NFAT family members is tolerated. In mice missing NFATc1 in T- or B-
cells a marked decrease in proliferation after immune receptor stimulation, and a decrease
Introduction
16
in IL4 and IL6 as well as a strong decrease in the B1a cell compartment were observed
(Ranger et al., 1998b; Yoshida et al., 1998; Bhattacharyya et al., 2011).
Mice lacking NFATc2, which is constitutively expressed in lymphocytes, show a
hyperproliferation and delayed apoptosis in lymphocytes which could lead to a higher
frequency of lymphomas (Hodge et al., 1996; Xanthoudakis et al., 1996). Mice deficient
for both NFATc2 and NFATc3 develop a more severe phenotype than single knock outs,
which indicates a compensating role for the different family members (Ranger et al.,
1998c).
Fig.1.7 Schematic structure of the Nfatc1 gene and its expression. The transcription of Nfatc1 is directed by two alternative promoters, the inducible P1 promoter and the relatively constitutive P2 promoter, which together with alternative splicing and polyadenylation events are giving rise to at least six different isoforms: αA-C and βA-C. pA1 is a weak polyadenylation site, which is used to terminate the short isoforms αA and βA. pA2 is a strong polyadenylation site, which is used to terminate the long isoforms B and C. Based on Chuvpilo et al., 2002.
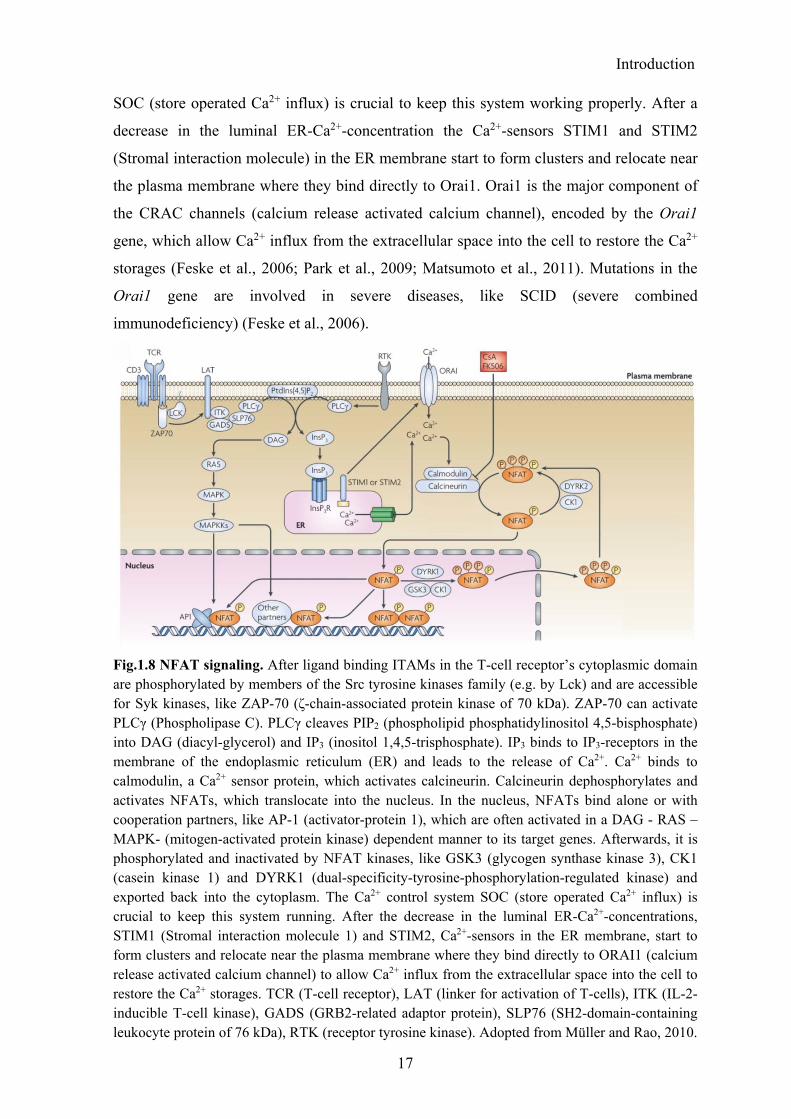
1.4.3 NFAT activation
NFAT is induced after immune receptor or receptor tyrosine kinase stimulation in a Ca2+-
/CN-dependent manner (Fig.1.8). After ligand binding, the ITAMs in the receptor’s
cytoplasmic domain are phosphorylated by members of the Src tyrosine kinases family
(e.g. by Lck) and are then accessible for Syk kinases, which dock with their SH2 domain to
the phosphorylated motifs. Syk kinases, like Zap-70 can activate a broad range of proteins.
One of its major targets is PLCγ. The signaling cascade downstream of PLCγ leads to
nuclear translocation of NFAT (compare chapter 1.2.1). In the nucleus, NFAT binds alone
or with cooperation partners, like AP-1, which are often activated by DAG and the MAPK
(mitogen-activated protein kinase) pathway, to its target genes, such as IL2. Afterwards in
the absence of stimulatory signals NFATs are phosphorylated and thereby inactivated by
NFAT kinases, e.g. GSK3, and exported back into the cytoplasm. The Ca2+ control system
Introduction
17
SOC (store operated Ca2+ influx) is crucial to keep this system working properly. After a
decrease in the luminal ER-Ca2+-concentration the Ca2+-sensors STIM1 and STIM2
(Stromal interaction molecule) in the ER membrane start to form clusters and relocate near
the plasma membrane where they bind directly to Orai1. Orai1 is the major component of
the CRAC channels (calcium release activated calcium channel), encoded by the Orai1
gene, which allow Ca2+ influx from the extracellular space into the cell to restore the Ca2+
storages (Feske et al., 2006; Park et al., 2009; Matsumoto et al., 2011). Mutations in the
Orai1 gene are involved in severe diseases, like SCID (severe combined
immunodeficiency) (Feske et al., 2006).
Fig.1.8 NFAT signaling. After ligand binding ITAMs in the T-cell receptor’s cytoplasmic domain are phosphorylated by members of the Src tyrosine kinases family (e.g. by Lck) and are accessible for Syk kinases, like ZAP-70 (ζ-chain-associated protein kinase of 70 kDa). ZAP-70 can activate PLCγ (Phospholipase C). PLCγ cleaves PIP2 (phospholipid phosphatidylinositol 4,5-bisphosphate) into DAG (diacyl-glycerol) and IP3 (inositol 1,4,5-trisphosphate). IP3 binds to IP3-receptors in the membrane of the endoplasmic reticulum (ER) and leads to the release of Ca2+. Ca2+ binds to calmodulin, a Ca2+ sensor protein, which activates calcineurin. Calcineurin dephosphorylates and activates NFATs, which translocate into the nucleus. In the nucleus, NFATs bind alone or with cooperation partners, like AP-1 (activator-protein 1), which are often activated in a DAG - RAS – MAPK- (mitogen-activated protein kinase) dependent manner to its target genes. Afterwards, it is phosphorylated and inactivated by NFAT kinases, like GSK3 (glycogen synthase kinase 3), CK1 (casein kinase 1) and DYRK1 (dual-specificity-tyrosine-phosphorylation-regulated kinase) and exported back into the cytoplasm. The Ca2+ control system SOC (store operated Ca2+ influx) is crucial to keep this system running. After the decrease in the luminal ER-Ca2+-concentrations, STIM1 (Stromal interaction molecule 1) and STIM2, Ca2+-sensors in the ER membrane, start to form clusters and relocate near the plasma membrane where they bind directly to ORAI1 (calcium release activated calcium channel) to allow Ca2+ influx from the extracellular space into the cell to restore the Ca2+ storages. TCR (T-cell receptor), LAT (linker for activation of T-cells), ITK (IL-2-inducible T-cell kinase), GADS (GRB2-related adaptor protein), SLP76 (SH2-domain-containing leukocyte protein of 76 kDa), RTK (receptor tyrosine kinase). Adopted from Müller and Rao, 2010.
Introduction
18
Quite recently, new pathways targeting NFATc1, e.g. in an IL7-Jak3 kinase-dependent
manner in DN thymocytes were discovered (Patra et al., 2013).
1.4.4 NFAT in myeloid cells
NFAT family members are factors, which are well-characterized for the lymphocyte
system, but new data indicate their important role in cells of the innate immune system,
such as in dendritic cells (DCs), neutrophils, mast cells or macrophages. Several NFAT
family members are expressed during the differentiation of hematopoietic stem cells
(HSCs) towards myeloid lineage cells, e.g. in the differentiation to megakaryocytes, but
not to granulocytes and erythroid cells. This reveals an important function of the NFATs in
the innate immune system (Kiani et al., 2004; Kiani et al., 2007).
NFATs are found to be involved mainly in the induction of cytokines and chemokines
downstream of the TLR4, Dectin-1 and CD14 receptors. Interestingly, dependent on their
needs myeloid cells express a distinct subset of NFAT factors (Fric et al., 2012).
Recent findings suggest that NFATs are mostly active during early phases of innate
immune reactions, which was shown especially in DCs in which NFAT-dependent IL2
production could be detected after 4 – 8 hours upon translocation of NFATc2 into the
nucleus within two hours after LPS stimulation (Zanoni et al., 2009; Fric et al., 2012).
LPS, the “classical” NF-κB pathway activator in myeloid cells and numerous others, can
induce NFAT translocation and activation. In DCs, LPS induces NFATc1 and NFATc2
translocation, depending on the extracellular calcium level through TLR4 or CD14 alone,
which leads to induction of GM-CSF and IL2 (Fric et al., 2012). LPS-induced edema
formation could be blocked by classical NFAT inhibitors, such as FK506 (Zanoni et al.,
2012). Besides LPS, other bacterial components as CpG and Pam3Cys can induce NFAT
translocation via TLR2 and TLR9 (Fric et al., 2012).
Another myeloid cell lineage in which NFATs play an important role are neutrophils. They
express NFATc1 and NFATc4 (Fric et al., 2012). Greenblatt et al. showed that calcineurin
and NFATc1 have key functions in the antifungal immunity against C. albicans. NFATc1
induces IL10, cyclooxygenase 2 (Cox2) and the early response genes Erg1 and Erg2 by
translocation after 30 min stimulation with yeasts in vitro. Mice deficient for calcineurin
subunit B (CnB) in neutrophils are unable to protect themselves against C. albicans, and
impaired NFATc1 leads to the loss of their ability to kill yeasts in vitro (Greenblatt et al.,
2010).
Introduction
19
NFATs are further described to have a critical role in eosinophils, basophils and mast cells.
In eosinophils, NFATc1 and NFATc2 are constitutively expressed and can induce GM-
CSF and IL2 (Fric et al., 2012). Basophils express IL4 in a NFAT-dependent manner after
crosslinking of their FcεRI receptors (Fric et al., 2012). In mast cells, NFATs are involved
in the activation during hypoxia and in survival by controlling IL13, TNF, HIF1α and A1
expression (Müller and Rao, 2010; Fric et al., 2012). To ensure survival, NFAT induces in
mast cells A1/Bfl-1, a member of the anti-apoptotic Bcl2 family after activation of the IgE
(FcεRI) receptors (Fric et al., 2012).
In NK cells, which are originally part of the lymphoid system, but are also strongly
involved in innate immune reactions, NFATc1 and NFATc2 are expressed after CD16
ligand stimulation and activate the genes encoding TNFα, GM-CSF and IFNγ.
All these findings indicate an important role of NFATs in the innate immune system,
which was and is a meaningful observation for therapeutic aspects. Therapies which should
block NFAT activation with CsA or FK506 in lymphoid cells, for example after an organ
transplantation to reduce rejections, often leads to an increased amount of viral and fungal
infections, which should be considered today as direct effects and not as side effects of
NFAT inactivation in lymphoid cells.
1.4.5 NFAT’s role in macrophages
In macrophages, all family members of the NFATs are expressed and were found to be
involved in different processes, such as induction of chemokines and cytokines, which are
engaged in a wide range of actions upon innate immune responses (Goodridge, 2007;
Yamaguchi et al., 2011; Fric et al., 2012).
NF-κB and NFAT can “cross-react” in macrophages and, therefore, provide a broad
reaction spectrum for defense (Zanoni et al., 2009; Elloumi et al., 2012; Fric et al., 2012).
In mouse BMDM (bone marrow derived macrophages) and RAW264.7 cells, a
macrophage cell line, it was shown that NFAT activates the IL12p40 chain after LPS (+/-
IFNγ) or C. albicans stimulation (Zhu, 2003; Goodridge, 2007). In line with these findings,
NFATs translocate in response to LPS alone or in combination with IFNγ into the nucleus
(Elloumi et al., 2012). Calcineurin, as an upstream phosphatase of NFAT, seems to be
involved as a “negative regulator” of NF-κB in steady-state macrophages (Conboy et al.,
1999). Another link for NFAT and NF-κB interactions in macrophages is that the NFAT
inhibitors CsA or FK506 are able to prolong the survival of a LPS-induced sepsis,
probably by blocking TNFα and IL2 production (Elloumi et al., 2012; Fric et al., 2012).
Other researchers also claimed contrary results showing that NFAT in BMDM is not

Introduction
20
directly induced by LPS, but necessary for TLR activation through a steady nuclear
presence of NFATc3 and NFATc4. Their localization was shown to be unaffected by LPS
or Pam3Cys stimulation (Minematsu et al., 2011).
NFAT appears to be essential in antifungal infections. After the activation of the Dectin-1
receptor by C. albicans or zymosan, NFAT leads to induction of IL2, IL10, IL12p70, Cox2,
Erg2 and Erg3 (Goodridge, 2007). Dectin-1 recognizes β-glucan cell wall structures of
yeasts, which leads to phosphorylation of Dectin’s ITAM, the activation of downstream
kinases and translocation of NFAT into the nucleus (Zanoni and Granucci, 2012) (Fig.1.9).
The structure of β-glucan influences the activation of different pathways. It can trigger the
NFAT pathway or, if it appears in polymers, predominantly the TLRs (Goodridge et al.,
2011).
Fig.1.9 NFAT signaling in macrophages. Dectin-1 and TLR4/CD14 pathways in macrophages. β-glucan binds to Dectin-1 and leads to a phosphorylation of its ITAM and the activation of the Syk signaling cascade: Syk kinases phosphorylates PLCγ (phospholipase C) which cleaves PIP2 (phospholipid phosphatidylinositol 4,5-bisphosphate) into DAG (diacyl-glycerol) and IP3 (inositol 1,4,5-trisphosphate). IP3 leads to Ca2+ release from the ER and to the activation of calcineurin, dephosphorylation of NFATs and their translocation into the nucleus. PLCγ activates CARD9 as well, which functions as an adapter protein for Bcl10 and Malt1, which are needed to phosphorylate IκB in order to activate the canonical NF-κB pathway and allow to the translocation of p65 and p50 into the nucleus. (Zanoni and Granucci, 2012)
Introduction
21
A new negative regulation of NFAT activity was found by Liu et al., 2011 in BMDM. In
these cells the LRRK2 (leucin rich repeat kinase 2) is localized with the noncoding RNA
NRON, a known NFAT repressor, in one complex to block the translocation of NFATc2
independent of its phosphorylation status. In LRRK2-KO cells a pronounced translocation
of NFATc2 was observed after LPS or zymosan stimulation (Liu et al., 2011).
NFAT5, the distinct member of the NFAT family, which is involved in osmotic stress
reactions, was found to induce iNOS, TNF and IL6 in a concentration dependent manner in
response to TLR agonists (Buxade et al., 2012). These findings are a further indication
how important NFATs are for regulation of gene expression in macrophages.
NFATc1 is especially involved in TNFα responses. In human macrophages, NFATc1 is
induced and translocated after TNFα stimulation for 24hrs and stays in the nucleus for up
to four days (Yarilina et al., 2011). In a TLR-independent response, NFATc1 is described
to be crucial in Trypanosoma cruzi infections (Kayama et al., 2009).
Besides the participation of NFATc1 in cytokines or chemokine induction, it is involved
directly in phagocytosis. In RAW264.7 cells it is essential in a cyclophillin C – CyCAP
dependent manner to phagocyte microsphere beads (Yamaguchi et al., 2011).
Indications that NFATc1 could have important roles in macrophages were found in related
cell types. After LPS stimulation cardiomyocytes were found to be protected by a
CN/NFAT-dependent induction of iNOS (Obasanjoblackshire et al., 2006). In astrocytes
and microglia, NFATc1 and NFATc2 translocate in response to UDP into the nucleus and
lead to an induction of Ccl2 (Kim et al., 2011a).
In summary, NFATs are not only transcription factors acting in the lymphoid lineage, but
essential for the functions of the innate immune system with a broad range of actions.
Through their “crosstalk” with NF-κB and their main role in anti-fungal responses NFATs
even seem to be one of the central factors. The expression of all NFAT-isoforms in
macrophages is a further hint for its central role in these cells. Many functions of the
NFAT-isoforms in myeloid cells need to be explored to get a better understanding of the
complicated networks of the innate immune system.
Aim of the project
22
1.5 The aim of the project
The transcription of the Nfatc1 gene is directed by two alternative promoters, the inducible
P1 and the relatively constitutive P2 promoter. While the role of P1-directed NFATc1α-
isoforms to promote survival of activated lymphocytes is well-established, the relevance of
constitutively generated NFATc1β-isoforms remained unclear. Therefore we investigated
the role of NFATc1β-isoforms within the innate and adaptive immune system.
In the first part we focused on myeloid cells, especially on resident macrophages, because
recent studies indicated a new and essential role of NFATs in these cells, in particular
during antifungal responses. Our data revealed the overall role of NFATc1 expression in
peritoneal resident macrophages (prMΦ) in an acute peritonitis, induced by a fungal
infection. In order to reveal the contribution of NFATc1β- and NFATc1α-isoforms we
analyzed antifungal responses in peritoneal macrophages of the Nfatc1-P2fl/fl-CMV-cre and
Nfatc1-P2fl/fl-LysM-cre mice.
In the second part of this project we investigated the role NFATc1β-isoforms in the
lymphoid compartment of the Nfatc1-P2fl/fl-CMV-cre mice.
The generation of the Nfatc1-dsRed knock-in reporter mouse facilitated an further in-depth
investigation of the NFATc1 expression.

Material and Methods
23
2 Material and Methods
2.1 Material
2.1.1 Antibodies
Primary reagents for FACS analysis (anti-mouse)
AnnexinV APC BD Pharmingen
B220 Biotin (clone RA3-6B2) BD Pharmingen
B220 FITC (clone RA3-6B2) eBioscience
CD117 (c-kit) FITC (clone 2B8) BD Pharmingen
CD11b FITC (clone M1/70) eBioscience
CD11b PE (clone M1/70) eBioscience
CD16/CD32 (Fc-Block) eBioscience
CD23 FITC (clone B3B4) BD Pharmingen
CD34 eFluor 660 (clone RAM34) eBioscience
CD4 FITC (GK1.5) BD Pharmingen
CD5 PerCP-Cy5.5(clone 53-7.3) eBioscience
CD8a APC-eFlour 780 (clone 53-6.7) eBioscience
F4/80 Biotin (clone CI:A3-1) BioLegend
IgM APC (clone Il/41) BD Pharmingen
Ly6-A/E (Sca1) PerCP-Cy5.5 (clone D7) eBioscience
Ly-6G (Gr1) PerCP-Cy5.5 (clone RB6-8C5) eBioscience
Streptavidin APC eBioscience
Streptavidin eFluor 450 eBioscience
Primary antibodies for Western Blot and immunofluorescence analysis (anti-mouse)
Mouse - anti-dsRed (polyclonal) SantaCruz
Mouse - anti-NFATc1 (clone 7A6) BD Pharmingen
Mouse - anti-NFATc3 (clone F-1) SantaCruz
Rabbit - anti-NFATc1α (polyclonal) Immunoglobe
Rabbit - anti-NFATc2 (polyclonal) CellSignaling
Rabbit - anti-NF-κB p65 (D14E12) CellSignaling
Rabbit - anti- NF-κB p52 (polyclonal) Abcam
Rat - anti-F4/80 Biotin (clone CI:A3-1) BioLegend
HRP-coupled secondary antibodies for Western Blot analysis
Goat - anti-mouse HRP Sigma-Aldrich
Goat - anti-rabbit HRP Sigma-Aldrich
Material and Methods
24
Fluorescent-coupled secondary antibodies and reagents for immunofluorescence
Donkey - anti-mouse Alexa 555 Molecular Probes
Donkey - anti-rabbit Alexa 488 Molecular Probes
Donkey - anti-rat Alexa 488 Elita Avota, University of Würzburg
Streptavidin APC eBioscience
2.1.2 Antibiotics and inhibitors
Ampicillin Roth
Cyclosporin A (CsA) Calbiochem
FK506 (Tacrolimus) Sigma-Aldrich
GolgiStop (Monensin) BD Bioscience
HALT protease inhibitor cocktail Pierce
Kanamycin Roth
Penicillin/Streptamycin Gibco
2.1.3 Chemicals
Acetic acid Roth
Agar Roth
Agarose Roth
β-Mercaptoethanol Roth, Gibco
Bradford reagent BioRad
Bromophenol blue Sigma-Aldrich
[α-P32]-dCTP Hartmann Analytic
Disodium hydrogen phosphate (Na2HPO4) Roth
Dimethyl-sulfoxide (DMSO) Roth, Gibco
Dulbecco's Modified Eagle Medium Gibco
6x DNA loading Dye Fermentas
EDTA Roth
Ethanol (EtOH) Roth
Ethidium Bromide (EtBr) Roth
Fetal Bovine Serum, Qualified, US origin Gibco
Fluoroshield with DAPI Sigma-Aldrich
Glycine Roth
Glycerol Roth
Hydrogen chloride (HCL) Roth
Isopropanol Roth
LB medium Roth
Magnesium chloride Roth

Material and Methods
25
Magnesium chloride (MgCl2 25mM) PeqLab
Methanol Roth
Midori Green Nippon Genetics
Monosodium phosphate (NaH2PO4) Roth
Non-fat dried milk powder AppliChem
2xPCR Mix Fermentas
Phenol Roth
Penicillin (10000U)/Streptomycin (10000µg) Gibco
Ponceou S Sigma-Aldrich
Power SYBR Green PCR Master Mix AB Applied Biosystems
Propidium iodide Sigma-Aldrich
protein G agarose Pierce
Roswell Memorial Institute Medium Institute of Virology, University
of Würzburg
Rotiphorese®Gel 30 Roth
Sarkosyl Sigma-Aldrich
Sephadex G50 Sigma-Aldrich
Spermidin S. Wörtge, University of Mainz
Sodium citrate Roth
Sodium chloride (NaCl) Roth
Sodium dodecyl sulfate (SDS) Roth
Sodium hydroxide (NaOH) Roth
Triton-X-100 AppliChem
Tris Roth
Trypan Blue Solution Sigma-Aldrich
Trypsin/EDTA Gibco
YPD Medium Roth
dH2O was taken from the “Biocel MilliQ system” (Millipore), if not differently
indicated.
2.1.4 Cell lines
J774, mouse M. Heß, University of Würzburg
JM8, mouse AG Waismann, University of Mainz
L929, mouse AG Lutz, University of Würzburg
v6.5, mouse AG Waismann, University of Mainz
Material and Methods
26
2.1.5 Electronical data processing
Data were collected, analyzed and presented using several Microsoft Windows operated
computers (Samsung laptop and Fujitsu-Siemens desktop) and a scanner from HP.
Following programs were used:
Adobe Photoshop CS3 Leica Software ImagePro Plus
BD FACS Diva 5.0 Microsoft Office Excel 2010
CorelDraw Graphics Suite X5 Microsoft Office PowerPoint 2010
FlowJo Vs. 7 Microsoft Office Word 2010
FUSION CAPT Omega
GraphPad Prism 5 Thomson EndNote X6
Image Lab Software VectorNTI
2.1.6 Enzymes
All used enzymes were produced by Fermentas.
AatII NdeI
AccI NotI
ApaI ProteinaseK
BamHI RNase A
Bsp120I SacII
ClaI SdaI
EcoRI
HindIII
Klenow fragment, exo¯
2.1.7 Equipment
Cell culture plates (96 well) Greiner, Nunc
Cell culture plates (48, 24, 12, 6 well) Greiner, Nunc
Cell culture plates (6cm, 10cm) Greiner, Nunc
Cell culture flasks (75cm2 flask) Greiner
Cell separation columns (LS) Milteny Biotech
Cell scraper (24mm) Hartenstein
Cell strainer (70µm) BD Bioscience
Cover slips Paul Marienfeld GmbH
Cryo tube (2ml) Greiner
Cuvette (quartz) Hellma
Cuvette (plastic) Braun
Erlenmeyer flasks (1000ml, 500ml, 100ml) Schott
Material and Methods
27
FACS tubes BD Bioscience
50ml & 15ml falcon tubes Greiner
Forceps for animal preparation Hartenstein
Hybridization mesh Thermo Fisher
Hybridization bottle Thermo Fisher
Hyperfilm ECL Amersham
Freezing container Nalgene
Microcentrifuge tubes (1.5ml, 2ml) Eppendorf
Object slides Hartenstein
Parafilm Pechiney Plastic Packaging
Pasteur-pipettes Hartenstein
PCR plates, white (96 well) Thermo Fisher
Pipette tips (1000µl, 100µl, 10µl) Sarstedt
Razor blades Hartenstein
Scissor for animal preparation Hartenstein
Serological pipette (25ml, 10ml, 5ml, 2ml) Greiner
Sterile filters (0.2µm, 0.45µm) Sartorius stedim
Syringe (2ml, 5ml, 10ml) Braun
Syringe Needle (23GA, 20GA) Hartenstein
Tuberculin syringe (26 GA 3/8") Braun
Protran BA 85 Nitrocellulose GE Healthcare
Wathman 3MM filter paper Hartenstein
X-ray cassette Hartenstein
2.1.8 Instruments
Autoclave Systec
Balance FCB Kern
Biofuge 15R Heraeus
Confocal microscope TCS SP5 II Leica Microsystems
Gel DocTM XR+ BioRad
Electrophoresis chamber CTI
Electrophoresis Power Supply Micro-Bio-Tec Brand
FACS Canto II BD
Fridge (4-10°C, -20°C, -70°C) Liebherr, Siemens
Fusion SL Vilbert Lourmat
Ice machine Genheimer
In vivo imaging system (Maestro EX) CRI
Material and Methods
28
Light microscope CK2 Olympus
LUMIstar Omega BMG labtech
Centrifuge 5418 Eppendorf
Geiger-Müller counter (series 900 mini
monitor)
Thermo Fisher
Humidified tissue culture incubators Heraeus instruments
Hybridization oven Bachofer
Thermomixer compact Eppendorf
7000 Sequence Detection System AB Applied Biosystems
Shaker C40 GLW
Waterbath Hartenstein
T100 Thermocycler BioRad
Tank Blot Hoefer
TPersonal PCR machine Biometra
Photometer Pharmacia
pH-meter WTW
Vertical electrophoresis unit Hoefer
Vortex mixer RA
2.1.9 Ligands and stimulants
Anti-CD3ε(clone 145-2C11) BD Pharmingen
Anti-CD28 (clone 37.51) BD Pharmingen
Anti-IgM μ-chain F(ab)2 (polyclonal) Jackson ImmunoResearch
Ionomycin Sigma-Aldrich
LPS, ultra-pure Sigma-Aldrich
TPA (PMA) Merck
Yeast (Saccharomyces cerevisiae) Aldi Süd
2.1.10 Kits
B cell Isolation Kit, mouse Miltenyi Biotech
Beetle Juice BIG Kit P J K
BigDye® Terminator v3.1 Cycle Sequencing
Kit
Applied Biosystems
CD4 (L3T4) microBeads, mouse Miltenyi Biotech
CD11b microBeads, mouse/human Miltenyi Biotech
CellTrace™ CFSE Cell Proliferation Kit Molecular Probes
DecaLabel™ DNA Labeling Kit Fermentas
First Strand cDNA Synthesis Kit Fermentas

Material and Methods
29
InnuPREP DOUBLEpure Kit analytik jena
Intracellular Fixation & Permeabilization
Buffer Set
eBioscience
Long PCR Enzyme Mix Fermentas
NucleoBond Xtra Maxi Macherery-Nagel
2x PCR Mix Fermentas
RNeasy Mini Kit Qiagen
SuperSignal West Pico ECL Substrate Pierce
2.1.11 Mice
All mice were kept in a species appropriate environment at 22°C with a 12 hours circadian
rhythm in the animal facilities of the Institute of Pathology, the Institute of Microbiology
& Hygiene, at the Center of Experimental Molecular Medicine (ZEMM) of the University
of Würzburg and in the central animal facility ZVTE of the University of Mainz.
All offspring were genotyped around the fourth week after birth. The used experimental
animals were 8-18 weeks old gender-matched littermates. For some experiments age- and
gender-matched wild type mice were used as control.
All used mouse lines were maintained on C57BL/6 background.
B6.NFATc1-dsRed
B6.Nfatc1-P2f/f
B6.OTII (Barnden et al., 1998) F. Berberich-Siebelt, University of
Würzburg
CMV-cre (Schwenk et al., 1995) AG Lesch, University of Würzburg
LysM-cre (Clausen et al., 1999) AG Waismann, University of Mainz
2.1.12 Oligonucleotides
Oligonucleotides were ordered from Eurofins mwg/operon or Sigma-Aldrich. They were
dissolved in dH2O at a final concentration of 100pmol/µl.
Genotyping
P2fl/fl:
#305 P2-Lox_2F tctccacctgactttctgttcc
#306 P2-Lox_2R ctcttcccaatggttgtctctc
Deletion of P2 promoter:
#306 P2-Lox_2R ctcttcccaatggttgtctctc
CNS5_mNc1_rev ggccttgtgacttctttccta

Material and Methods
30
CMV-cre:
M54 cgagtgatgaggttcgcaag
M55 tgagtgaacgaacctggtcg
NFATc1-dsRed:
M16 cctgcctctctcagcctttga
dsRed_seq-L cctcgaagttcatggagcgc
ChIP
gCcl2-U2 acttgccatggaataaacaca
gCcl2-L2 gcccttagaattcatttcagc
Cloning
NFATc1-dsRed:
dsRed-AatII-U2 atgcatgacgtccatcaaggagttcatgcag
pA-ClaI-L atgcatatcgatacattgatgagtttggacaaacc
AccI>ClaI-U agcaatcgatgcacgc
AccI>ClaI-L cgcacgtagctaacga
Detection of homologous recombination with Long Distance PCR
Int-c1wt-U4 ctgacttcttacccgaagatgagc
Int-dsRed-L1 gtagtcctcgttgtggttggtga
Int-c1wt-L2 gaagtacgtcttccacctccac
Reverse Transcriptase (RT) and Real-Time PCR Primer
RT-PCR:
mP1-U #867 gggagcggagaaactttgc
mP1/P2-L #868 gatctcgattctcggactctcc
mP2-U #869 cgacttcgatttcctcttcgag
E1 mβAct-U caactgggacgacatggagaag
E2 mβAct-L ttctccagggaggaagaggatg
mNFATc1-Ex3_s catgcgccctctgtggccc
mNFATc1-Ex7_as ggagccttctccacgaaaatg
mNFATc2-Ex10_s catccgcgtgcccgtgaaag
mNFATc2-Ex11_as ctcggggcagtctgttgttg
mNFATc3-U #351 ccgatgactactgcaaactgtgg
mNFATc3-L #352 tttgaatacttgggcactcaaagg
dsRed_seq-L cctcgaagttcatggagcgc
Real Time PCR:
qCcl2-F attgggatcatcttgctggt
qCcl2-R cctgctgttcacagttgcc
qRT HPRT for agcctaagatgagcgcaagt

Material and Methods
31
qRT HPRT rev ttactaggcagatggccaca
qRT mL32 F (Buxade) accagtcagaccgatatgtg (Buxade
et al., 2012)
qRT mL32 R (Buxade) attgtggaccaggaacttgc (Buxade
et al., 2012)
P2 (Ex2/3-Ex3) Dir aggacccggagttcgacttc
P2 (Ex2/3-Ex3) rev gcagggtcgaggtgacactag
P1 promoter Dir gggagcggagaaactttgc
P1 promoter rev cagggtcgaggtgacactagg
qRT NFATc1 fwd gatccgaagctcgtatggac
qRT NFATc1 rev agtctctttccccgacatca
Actin-F gacggccaggtcatcactattg
Actin-R aggaaggctggaaaagagcc
Oligonucleotides for synthesis of Southern Blot probes
P2:
mP1/P2-South-U cggcattaaacagagggaaacag
mP1/P2-South-L ctgctctccttgaaagaggttgc
NFATc1-dsRed:
C-South-F ctgtgcttgtgaacagtgagtttg
C-South-R acctgtaccaacttccacttcctc
SB Probe 3'-U gaatcaggtgtcgggtggag
SB Probe 3'-L cacggtaactcggacagctc
NeoFull-U1 aagaactcgtcaagaaggcgatagaag
NeoFull-L1 ctatgactgggcacaacagacaatc
2.1.13 Plasmids
Luciferase Assay
pCcl2 -3009/+77 luciferase reporter Andris Avots, University of Würzburg
pNFATc1-αA Andris Avots, University of Würzburg
pNFATc1-βA Andris Avots, University of Würzburg
pNFATc1-αB Andris Avots, University of Würzburg
pNFATc1-βB Andris Avots, University of Würzburg
pNFATc1-αC Andris Avots, University of Würzburg
pNFATc1-βC Andris Avots, University of Würzburg
pNF-κB_p65 Andris Avots, University of Würzburg
pNF-κB_p50 Andris Avots, University of Würzburg
pNF-κB_RelB Andris Avots, University of Würzburg
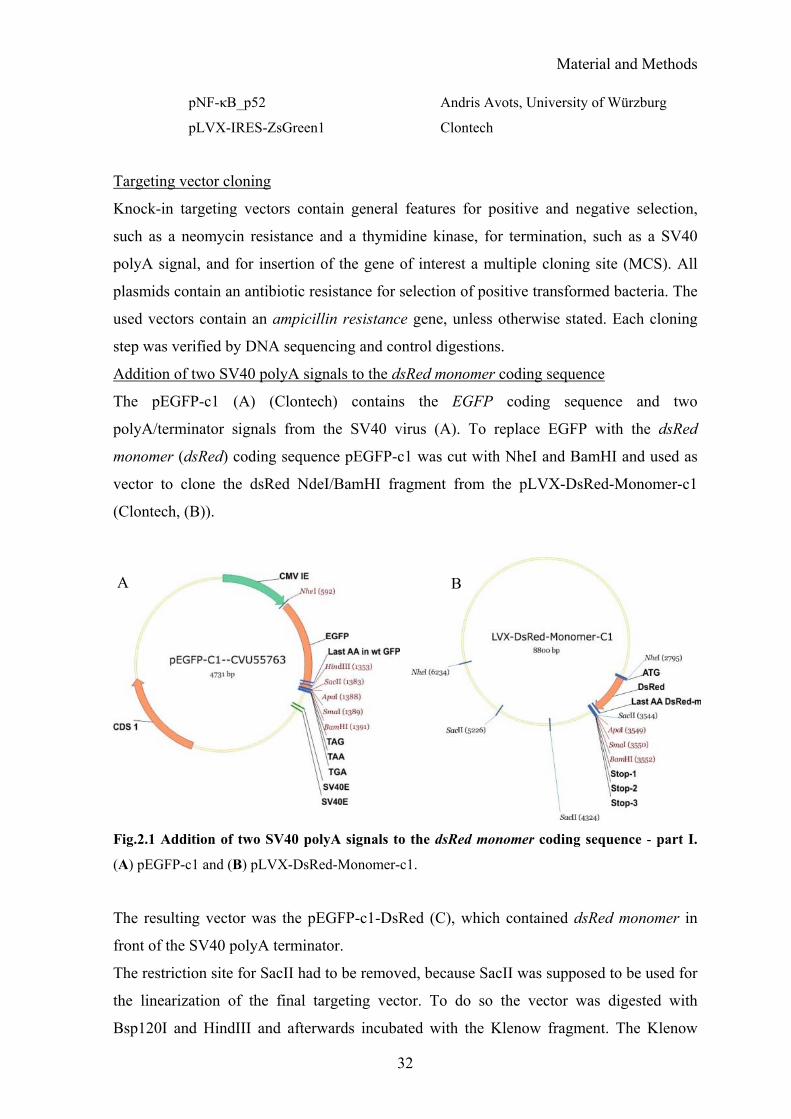
Material and Methods
32
pNF-κB_p52 Andris Avots, University of Würzburg
pLVX-IRES-ZsGreen1 Clontech
Targeting vector cloning
Knock-in targeting vectors contain general features for positive and negative selection,
such as a neomycin resistance and a thymidine kinase, for termination, such as a SV40
polyA signal, and for insertion of the gene of interest a multiple cloning site (MCS). All
plasmids contain an antibiotic resistance for selection of positive transformed bacteria. The
used vectors contain an ampicillin resistance gene, unless otherwise stated. Each cloning
step was verified by DNA sequencing and control digestions.
Addition of two SV40 polyA signals to the dsRed monomer coding sequence
The pEGFP-c1 (A) (Clontech) contains the EGFP coding sequence and two
polyA/terminator signals from the SV40 virus (A). To replace EGFP with the dsRed
monomer (dsRed) coding sequence pEGFP-c1 was cut with NheI and BamHI and used as
vector to clone the dsRed NdeI/BamHI fragment from the pLVX-DsRed-Monomer-c1
(Clontech, (B)).
Fig.2.1 Addition of two SV40 polyA signals to the dsRed monomer coding sequence - part I.
(A) pEGFP-c1 and (B) pLVX-DsRed-Monomer-c1.
The resulting vector was the pEGFP-c1-DsRed (C), which contained dsRed monomer in
front of the SV40 polyA terminator.
The restriction site for SacII had to be removed, because SacII was supposed to be used for
the linearization of the final targeting vector. To do so the vector was digested with
Bsp120I and HindIII and afterwards incubated with the Klenow fragment. The Klenow
A B
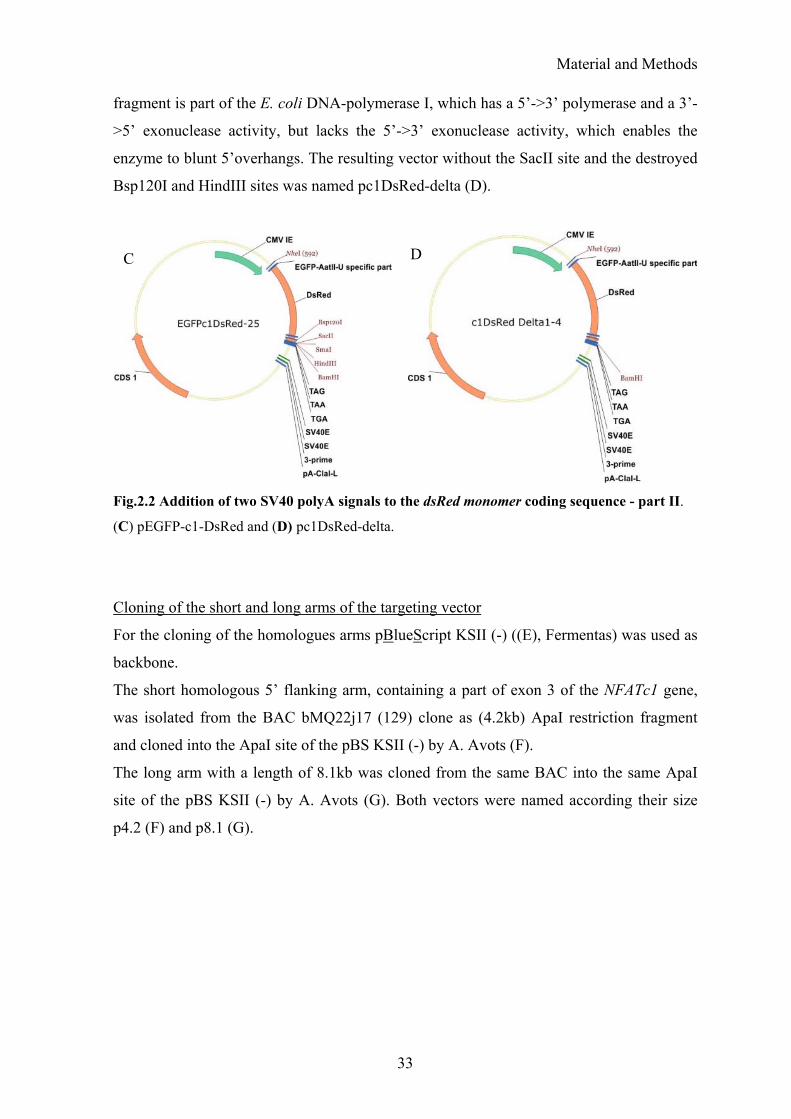
Material and Methods
33
fragment is part of the E. coli DNA-polymerase I, which has a 5’->3’ polymerase and a 3’-
>5’ exonuclease activity, but lacks the 5’->3’ exonuclease activity, which enables the
enzyme to blunt 5’overhangs. The resulting vector without the SacII site and the destroyed
Bsp120I and HindIII sites was named pc1DsRed-delta (D).
Fig.2.2 Addition of two SV40 polyA signals to the dsRed monomer coding sequence - part II.
(C) pEGFP-c1-DsRed and (D) pc1DsRed-delta.
Cloning of the short and long arms of the targeting vector
For the cloning of the homologues arms pBlueScript KSII (-) ((E), Fermentas) was used as
backbone.
The short homologous 5’ flanking arm, containing a part of exon 3 of the NFATc1 gene,
was isolated from the BAC bMQ22j17 (129) clone as (4.2kb) ApaI restriction fragment
and cloned into the ApaI site of the pBS KSII (-) by A. Avots (F).
The long arm with a length of 8.1kb was cloned from the same BAC into the same ApaI
site of the pBS KSII (-) by A. Avots (G). Both vectors were named according their size
p4.2 (F) and p8.1 (G).
C D

Material and Methods
34
Fig.2.3 Cloning of the short and long arms of the targeting vector – part I. (E)
pBlueScriptKSII (-), (F) p4.2 and (G) p8.1.
Two restrictions sites for AatII and ClaI were added to the dsRed-polyA fragment by PCR.
The used template was pc1DsRed-delta (D). The PCR fragment was digested and cloned
into the AatII and ClaI sites of p4.2 (F) leading to the new vector p4.2 DsRed-delta (H).
This step fused Nfatc1 exon 3 to dsRed.
To introduce the short arm with the exon3-dsRed fusion into the final targeting vector, we
had to shorten the short arm, because we needed a ClaI site. For this purpose we introduced
an AccI-ClaI linker into p4.2 DsRed-delta (H) to generate the needed ClaI site. The vector
with the new ClaI site in the former place of the AccI site was named as pBS-SSA-Red (I).
pBS KSII-2961 bp
AmpR
M13r
f1 origin
lacZ a
T3 Promotor
T7 Promotor
Lac Promotor
BamHI (690)
ClaI (727)
Eco RI (708)
HindIII (720)
Pst I (706)
SmaI (698)
XmaI (696)
Apa LI (1468)
Apa LI (2714)
Ava I (696)
Ava I (741)
E F
G
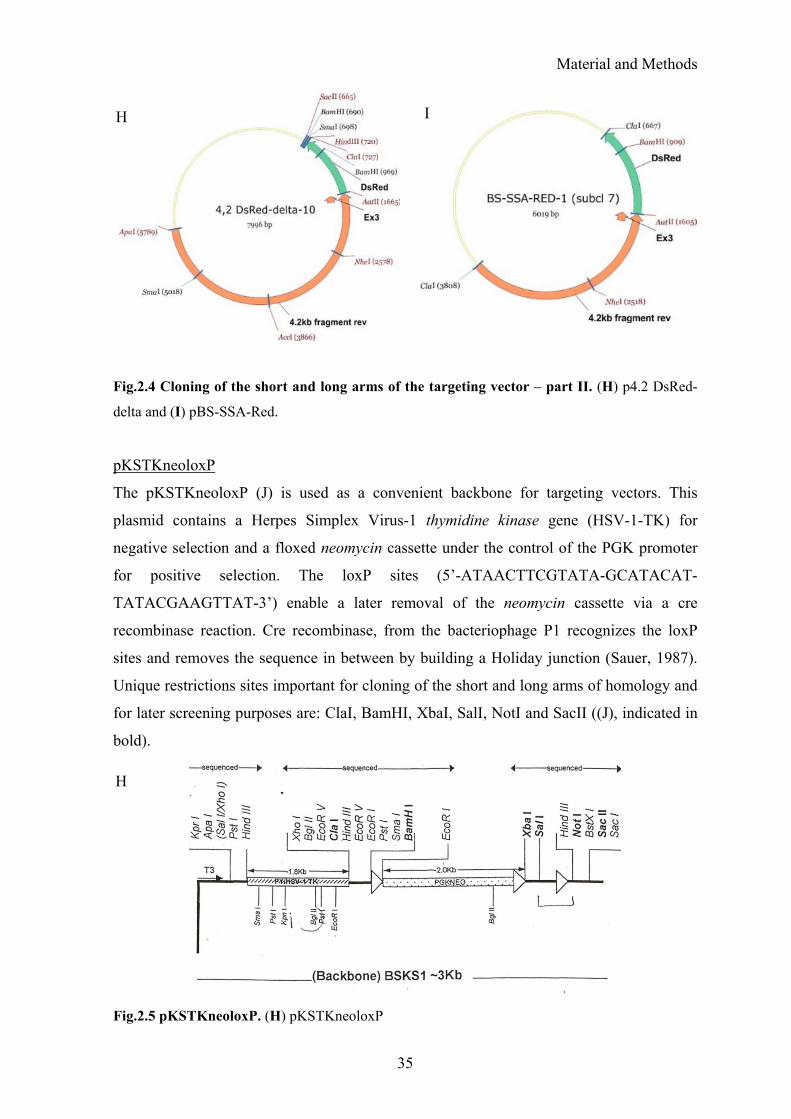
Material and Methods
35
Fig.2.4 Cloning of the short and long arms of the targeting vector – part II. (H) p4.2 DsRed-
delta and (I) pBS-SSA-Red.
pKSTKneoloxP
The pKSTKneoloxP (J) is used as a convenient backbone for targeting vectors. This
plasmid contains a Herpes Simplex Virus-1 thymidine kinase gene (HSV-1-TK) for
negative selection and a floxed neomycin cassette under the control of the PGK promoter
for positive selection. The loxP sites (5’-ATAACTTCGTATA-GCATACAT-
TATACGAAGTTAT-3’) enable a later removal of the neomycin cassette via a cre
recombinase reaction. Cre recombinase, from the bacteriophage P1 recognizes the loxP
sites and removes the sequence in between by building a Holiday junction (Sauer, 1987).
Unique restrictions sites important for cloning of the short and long arms of homology and
for later screening purposes are: ClaI, BamHI, XbaI, SalI, NotI and SacII ((J), indicated in
bold).
Fig.2.5 pKSTKneoloxP. (H) pKSTKneoloxP
H I
H
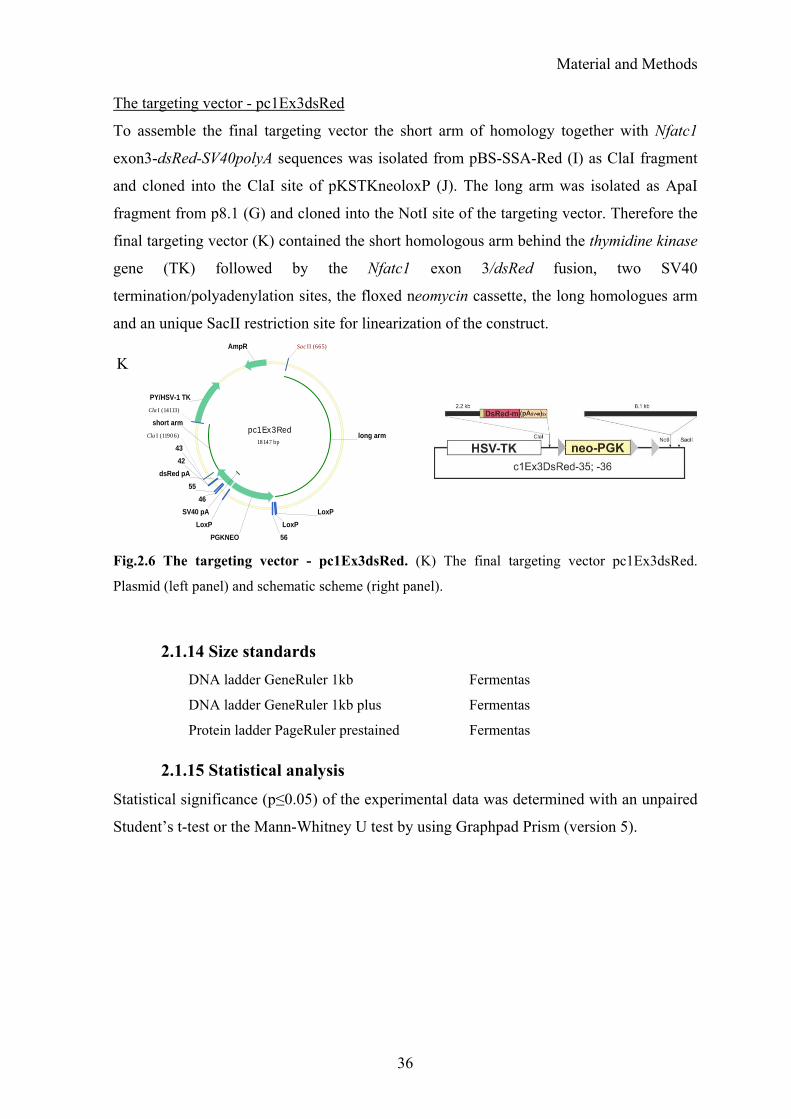
Material and Methods
36
The targeting vector - pc1Ex3dsRed
To assemble the final targeting vector the short arm of homology together with Nfatc1
exon3-dsRed-SV40polyA sequences was isolated from pBS-SSA-Red (I) as ClaI fragment
and cloned into the ClaI site of pKSTKneoloxP (J). The long arm was isolated as ApaI
fragment from p8.1 (G) and cloned into the NotI site of the targeting vector. Therefore the
final targeting vector (K) contained the short homologous arm behind the thymidine kinase
gene (TK) followed by the Nfatc1 exon 3/dsRed fusion, two SV40
termination/polyadenylation sites, the floxed neomycin cassette, the long homologues arm
and an unique SacII restriction site for linearization of the construct.
Fig.2.6 The targeting vector - pc1Ex3dsRed. (K) The final targeting vector pc1Ex3dsRed.
Plasmid (left panel) and schematic scheme (right panel).
2.1.14 Size standards
DNA ladder GeneRuler 1kb Fermentas
DNA ladder GeneRuler 1kb plus Fermentas
Protein ladder PageRuler prestained Fermentas
2.1.15 Statistical analysis
Statistical significance (p≤0.05) of the experimental data was determined with an unpaired
Student’s t-test or the Mann-Whitney U test by using Graphpad Prism (version 5).
pc1Ex3Red18147 bp
long arm
short arm
PY/HSV-1 TK
LoxP
PGKNEO
LoxP
LoxP
dsRed pA
AmpR
46
42
43
55
56
SV40 pA
Sac II (665)
ClaI (11906)
ClaI (14113)
K
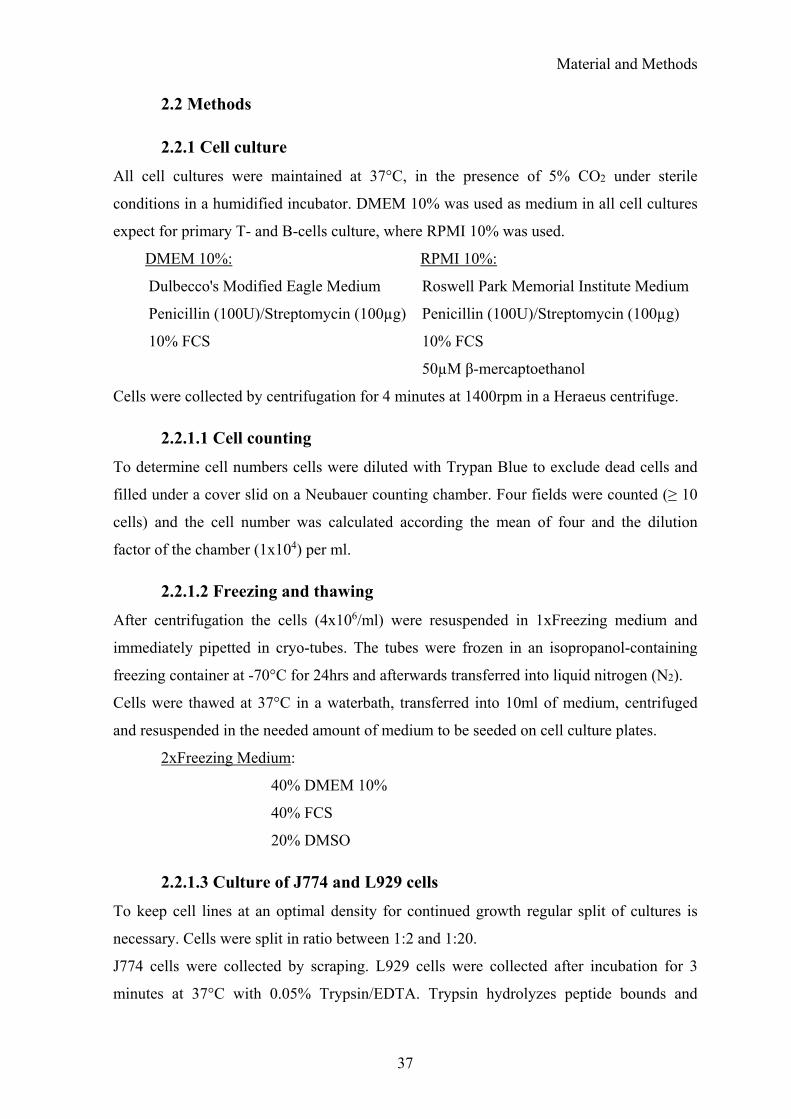
Material and Methods
37
2.2 Methods
2.2.1 Cell culture
All cell cultures were maintained at 37°C, in the presence of 5% CO2 under sterile
conditions in a humidified incubator. DMEM 10% was used as medium in all cell cultures
expect for primary T- and B-cells culture, where RPMI 10% was used.
DMEM 10%: RPMI 10%:
Dulbecco's Modified Eagle Medium Roswell Park Memorial Institute Medium
Penicillin (100U)/Streptomycin (100µg) Penicillin (100U)/Streptomycin (100µg)
10% FCS 10% FCS
50µM β-mercaptoethanol
Cells were collected by centrifugation for 4 minutes at 1400rpm in a Heraeus centrifuge.
2.2.1.1 Cell counting
To determine cell numbers cells were diluted with Trypan Blue to exclude dead cells and
filled under a cover slid on a Neubauer counting chamber. Four fields were counted (≥ 10
cells) and the cell number was calculated according the mean of four and the dilution
factor of the chamber (1x10⁴) per ml.
2.2.1.2 Freezing and thawing
After centrifugation the cells (4x10⁶/ml) were resuspended in 1xFreezing medium and
immediately pipetted in cryo-tubes. The tubes were frozen in an isopropanol-containing
freezing container at -70°C for 24hrs and afterwards transferred into liquid nitrogen (N2).
Cells were thawed at 37°C in a waterbath, transferred into 10ml of medium, centrifuged
and resuspended in the needed amount of medium to be seeded on cell culture plates.
2xFreezing Medium:
40% DMEM 10%
40% FCS
20% DMSO
2.2.1.3 Culture of J774 and L929 cells
To keep cell lines at an optimal density for continued growth regular split of cultures is
necessary. Cells were split in ratio between 1:2 and 1:20.
J774 cells were collected by scraping. L929 cells were collected after incubation for 3
minutes at 37°C with 0.05% Trypsin/EDTA. Trypsin hydrolyzes peptide bounds and
Material and Methods
38
thereby disassociates adherent cells from the cell culture plate. The reaction was stopped
by adding an excess of complete growth medium.
2.2.1.4 Isolation and stimulation of primary cells
The used buffers BSS/BSA, FACS-buffer (PBS/0.1%BSA), PBS-/- (w/o MgCl2, w/o Ca2+)
and PBS were produced by the Institute of Virology (University of Würzburg).
2.2.1.4.1 Isolation and stimulation of peritoneal macrophages
Before isolation of macrophages mice were sacrificed by cervical dislocation. Peritoneal
cells were isolated by lavage of the peritoneal cavity with 10ml of FACS-buffer injected
(23GA needle) into the peritoneum. After a short massage the cell suspension was
recovered. Peritoneal cells were collected by centrifugation and counted. The cells were
seeded on plates, glass slides or directly used for FACS analysis (see chapter 2.2.2). Glass
slides were incubated in wet chambers to avoid evaporation of medium (100µl/slide). After
4hrs the plates/ slides were washed twice with medium to remove non-adherent cells.
Macrophages were harvested by scraping. The purity of the macrophage cultures was
estimated with an anti-F4/80 staining and was typically within the range of 75-90%.
Macrophages were stimulated 24hrs later with LPS (1µg/ml) or inactivated (30’ at 90°C)
yeast in a ratio of 1:1 or 2:1 yeasts/cell for indicated time periods. FK506 and CsA were
used at the indicated concentrations. The cells were pre-incubated with the inhibitors for 30
minutes before stimulation with yeast. DMSO was used as solvent control.
For special purposes macrophages were isolated with the help of magnetic beads. For
isolation of CD11b+-specific cells the “CD11b microBeads, mouse/human Kit” (Miltenyi
Biotech) was used according the manufacturer’s protocol. For isolation of F4/80+-specific
cells a biotinylated antibody directed against F4/80 was used in combination with
streptavidin beads (Miltenyi Biotech) following the manufacturer’s protocol.
2.2.1.4.2 Phagocytosis and antigen presentation assays
For the phagocytosis assay FITC-labeled heat-inactivated yeasts (A. Avots, University of
Würzburg) were incubated with macrophages in a ratio of 10:1 yeasts/cell in a 24 well
plate. Before harvesting the macrophages (by scraping) the medium was removed. The
cells were washed twice with medium to remove unbound yeast and analyzed with FACS.
For antigen-presentation assays, T-cells isolated from OTII transgenic mice were used. All
TCRs on these T-cells have the same specificity for the OVA peptide (ovalbumin323-339)
(Barnden et al., 1998). OTII CD4+-T-cells were isolated and labeled with CFSE as
described in chapter 2.2.1.4.5. Macrophages were incubated with OVA peptide (1µg/ml, T.
Material and Methods
39
Pusch, University of Würzburg) for 1hr. CFSE labeled T-cells (1x10⁵) were added to 1x10⁵
macrophages in a 96 well plate (flat) in 200µl RPMI 10%. After 3 days the T-cells were
harvested and analyzed by FACS.
2.2.1.4.3 Isolation of bone marrow cells
Bone marrow cells were isolated from two femurs and tibias of the hind legs. The bones
were flushed with BSS/BSA using a tuberculin syringe and passed through a 70µm cell-
strainer. After centrifugation the cells were resuspended in 3ml Red blood cell lysis Buffer
(RBL) and incubated for 8 minutes at 37°C to lyse the erythrocytes. The reaction was
stopped by addition of BSS/BSA up to 30ml. After centrifugation the cells were
resuspended in FACS-Buffer, counted and used directly for FACS analysis (see 2.2.2) or
by A. Avots for differentiation into BMDM.
Red blood lysis buffer (RBL):
Solution A Solution B Solution C RBL ready-to-use
14g NH4Cl 0.42g MgCl2x6H2O 2.25g NaHCO3 10ml solution A
0.74g KCl 0.14g MgSO4x7H2O 2.5ml solution B
0.6g Na2HPO4 0.341g CaCl2 2.5ml solution C
0.048g KH2PO4
2g Glucose
dH2O to 400ml dH2O to 100ml dH2O to 100ml dH2O to 50ml
2.2.1.4.4 Isolation of T- and B-cells
To isolate lymphoid cells from mice the spleens were smashed through a 70µm cell-
strainer in BSS/BSA and centrifuged. Lysis of red blood cells was performed as described
above (2.2.1.4.3) using 3ml of RBL per spleen. After centrifugation and counting the
splenic cells were used directly for FACS analysis (see 2.2.2) or for isolation of T- or B-
cells.
For isolation of T- or B-cells the “CD4 (L3T4) microBeads, mouse” or the “B cell isolation
Kit” (Miltenyi Biotech) were used, respectively, according the manufacture’s protocol. The
cells were seeded at a density of 2x10⁶/ml for further use in RPMI 10%.
2.2.1.4.5 T-cell stimulation and CSFE labeling
T-cells were stimulated with antibodies directed against CD3 and CD28 on a coated 24
well plate. To coat the plates 4µg/ml anti-CD3 and 2µg/ml anti-CD28 were incubated for
2hrs at 37°C. The solution was removed and the plates dried at room temperature under
sterile conditions. The cells were seeded on the coated plates and incubated for the

Material and Methods
40
indicated time periods. Restimulation was performed by re-seeding the cells on a fresh
coated plate.
To follow the cell division, T-cells were labeled with carboxyfluorescein diacetate
succinimidyl ester (CFSE). This fluorescent ester forms conjugates with intracellular
amines, which are inherited to daughter cells. Therefore the fluorescence intensity will
decrease twice with every cell division. T-cells (1x10⁷) were washed twice with PBS-/-,
resuspended in 5ml PBS-/-, 2µl CFSE were added and the cells were incubated for 3
minutes at room temperature. The reaction was terminated by adding 3ml of FCS. The
labeled T-cells were centrifuged, seeded and stimulated as indicated.
2.2.1.4.6 B-cell stimulation
B-cells were stimulated for 48hrs with anti-IgM (10µg/ml) and restimulated by addition of
fresh anti-IgM in the same concentration.
2.2.1.5 Embryonic stem cell culture
The stem cell culture was performed in the Institute of Molecular Medicine at the
University of Mainz.
The cells were incubated at 37°C in a humidified 10% CO2 incubator. All centrifugation
steps were preceded at 1000 rpm for 4 minutes.
Reagents and Supplies
DMEM (high glucose, + glutamine, - pyruvate) Gibco
Knockout DMEM Gibco
Penicillin/Streptomycin, 10,000 U/ml Gibco
L-Glutamine (200mM, 100x) Gibco
Sodium Pyruvate (100mM, 100x) Gibco
Non-essential amino acids (10mM, 100x) Gibco
Trypsin EDTA Gibco
LIF (medium supernatant form HEK-cells stable transfected with a Lif
expression vector )
Fetal Bovine Serum (EF) Biochrom
Fetal Bovine Serum (ES) PAA
Chicken Serum Gibco
PBS (1X without Ca2+ or Mg2+) Gibco
DMSO, 100ml Roth
2(β)-Mercaptoethanol Sigma
Mitomycin C, 2mg Sigma

Material and Methods
41
Gelatine, 2% Sigma
Geneticin (G418), 50 mg/ml Gibco
2.2.1.5.1 Embryonic fibroblast (EF) culture
Thawing and maintenance of EF
EF cells were thawed at 37°C in a waterbath, transferred in 10ml EF-medium, centrifuged
and resuspended in medium to be seeded on four cell culture plates (15cm) in 20ml/plate.
The medium was changed on the next day.
After 3 till 5 days the plates reached confluence. After two washing steps with PBS the
cells were detached with 5ml trypsin supplemented with chicken serum. The reaction was
stopped with EF-medium and the cells were centrifuged. The cells were re-seeded 1:4 on
fresh plates (4 EF1-> 16EF2). To further expand the EF cells the same procedure was
repeated once more to get 64 plates of confluent “EF3” cells. These cells were inactivated
with mitomycin C (MMC), a cell cycle inhibitor.
EF-medium
1x Knockout-DMEM
10% EF-FBS
0.1mM Non-essential Amino acids
1mM L-Glutamine
100U/ml Penicillin/Streptomycin
Inactivation of EF cells with MMC
The 64 “EF3” plates were incubated for 2-4hrs with 10ml of inactivation medium, washed
twice with PBS and detached with trypsin (see above). Cells were plated for further use on
10cm plates at a concentration of 3.5x10⁶ in ES-medium or were frozen (see chapter
2.2.1.2) in a density of 4x10⁶/ vial. After 6-12hrs the cells were attached to the plates and
could be maintained for a maximum of 8-10 days.
EF-inactivation medium
1x EF-medium
10µg/ml mitomycin C (MMC)
2x EF-freezing medium
0,4x EF-medium
40% EF-FBS
20% DMSO
Material and Methods
42
2.2.1.5.2 Embryonic stem cell culture
Embryonic stem cells (ES) were handled with fire polished Pasteur-pipettes.
ES-cells were cultured on mitotic inactive embryonic fibroblasts (EF) in the presence of
LIF (leukemia inhibitory factor). LIF was “produced” by a LIF-producing cells line in the
laboratory. The supernatant was tested for the best concentration and aliquoted.
ES-medium
1x Knockout-DMEM
15% ES-FBS
2mM L-Glutamine
0.1mM Non-essential amino acids
100U/ml Penicillin/Streptomycin
1 vial LIF
0.1mM ß-Mercaptoethanol
Thawing and maintenance of ES
ES-cells were thawed at 37°C in a waterbath, transferred in 10ml ES-medium, centrifuged
and resuspended in again 10ml medium to be seeded on a MMC-treated EF-plate (compare
chapter 2.2.1.5.1). The medium was changed every day till the cells reached confluence
(within 2 - 4days). The medium of confluent cells was changed two hours before splitting.
The cells were then washed with PBS (twice) before one Pasteur-pipette trypsin
supplemented with chicken serum (1%) was added for 4 minutes at 37°C. The reaction was
stopped with one Pasteur-pipette of medium and the cells were singularized by pipetting.
After centrifugation the cells were re-seeded in a concentration of 3x10⁶cells/plate on a
fresh plate of inactivated fibroblasts.
Electroporation of ES-cells
For electroporation with the linearized targeting vector the cells were trypsinized and
harvested. The cells were resuspended at 1.3x10⁷cells/ml in PBS and 800µl of cell
suspension was mixed with 25µg of linearized DNA. After 10 minutes on ice the mix was
transferred into a pre-cooled cuvette (10mm gap) and pulsed at 240V and 500µF (time
constant should be 8-10msec). The mix was left for 10 minutes on ice and added to 50ml
of ES-medium, mixed well and seeded on 5 plates (10cm) with inactivated fibroblasts. One
control plate with un-electroporated cells at the same cell density was plated as survival
control. Two days after electroporation the selection was started by supplementing ES-
medium with geneticin (G418, 200µg/ml) for 8-12 days.
Material and Methods
43
Isolation of geneticin-resistant-ES-colonies
After selection with G418 the cells on the survival control plate were dead. The size of the
selected colonies on the electroporation plates was 0.5 - 2mm in diameter.
One day before isolation of the clones MMC-treated fibroblasts were plated on 96 well
plates (flat) [one frozen vial (4x10⁶cells)/96 well plate].
The medium of the ES-cells was changed 2hrs before start. The plates were washed twice
with 8ml of PBS supplemented with penicillin/streptomycin. The colonies were picked
under the microscope in a volume of 50µl and transferred to a 96 well plate with 50µl of
trypsin/well. After one row was picked (8 or 12 wells according the 96 well plate) the cells
were pipetted up and down with a multi-channel pipette and trypsin was inactivated by
addition of 100µl of ES-medium. Afterwards the cells were transferred to the 96 well plate
with fibroblasts. Routinely, 5 plates with clones were picked and further cultivated with
daily change of medium.
Split and freeze of ES-cells clones in 96 well plates
The colonies reached confluence around 5 days after picking. For splitting of colonies four
96 well plates, three with inactivated fibroblasts and one coated with gelatine (see next
paragraph) were prepared in advance.
The medium was changed two hours before. The ES-colonies were washed with PBS
(100µl/well) and then incubated with 50µl trypsin/well for 2 minutes at 37°C. The reaction
was stopped by addition of 100µl (for a split ratio of 1:3) or with 150µl of ES-
medium/well (for a split ratio of 1:4). 50µl cell suspension was transferred on a fibroblast
or gelatine plate with 150µl of ES-medium.
For freezing of clones the trypsinisation was stopped with 50µl of ES-medium followed by
addition of 100µl of pre-cooled 2xfreezing medium. The plates were immediately
incubated at -20°C for 0.5 - 2hrs and then transferred in a Styrofoam box at -80°C.
Gelatine coating of tissue culture plates
2% gelatine was pre-warmed at 37°C in a waterbath and diluted with PBS till the final
concentration of 0.1%. 50-100µl of gelatine 0.1% were pipetted per 96 well and incubated
for 30 minutes. Afterwards the gelatine solution was aspirated and the plate was dried
under the hood for 10-20 minutes.
2.2.2 Fluorescent-activated cell sorting (FACS)
The principle of FACS analysis is based on sorting of living cells according their size,
structure and expression of surface molecules and intracellular proteins. Fluorescence-
labeled antibodies are used to stain cells. In FACS machines cells pass through laser and
Material and Methods
44
are sorted according their size (forward), granularity (side scatter) and fluorescent
properties.
Surface staining
To stain cells with fluorescent labeled antibodies 0.5-1x10⁶ cells were transferred into
1.5ml reaction tubes and washed twice with FACS-Buffer (PBS/0.1%BSA). Fc-Block
(1:250) (anti-CD16/CD32) was added in 50µl FACS-Buffer before the cells were
incubated with antibodies (0.25µl/sample) for 15 minutes at room temperature. After two
more washing steps the cells were fixed in 2% FA.
Intracellular staining
After the surface staining, as described above, the cells were incubated for 20 minutes in
Fixation Buffer (eBioscience) at 4°C. After fixation the cells were washed twice with
1xPermeabilization Buffer, incubated with 1µl of antibody for 20 minutes at room
temperature in the dark in 100µl 1xPermeabilization Buffer, followed by one more
washing step with 1xPermeabilazition Buffer before fixation with 2% FA in FACS-Buffer.
Annexin/PI-staining
To stain dead and dying cells Annexin V and propidium iodide (PI) were used. Annexin V
is a protein, which binds to phosphatidylserine on the cell surface of apoptotic cells. PI is
membrane impermeable and therefore intercalates only into the DNA of dead cells.
The staining protocol started with two washing steps of the cells with FACS-Buffer before
1µl of Annexin V-APC was added to 100µl cells in Annexin-Binding Buffer (ABB). After
15 minutes at room temperature additional 100µl ABB were added and substituted with
1µl PI [1mg/ml]. The sample was measured on the FACS within one hour after staining.
Annexin-Binding Buffer:
10mM HEPES
149mM NaCl2
2.5mM CaCl2
2.2.3 Transfection / Luciferase assay
Transfection introduces foreign DNA into eukaryotic cells. To transfect cells a cationic
polymer polyethylenimine (PEI), which binds to DNA and build complexes, was used. The
PEI-DNA complex can be endocytosed by cells.
PEI (20mg/ml) needed to be diluted 50/950 in pure medium (medium-/-). 3µl of the
dilution were used per µg DNA. To transfect L929 cells 3µl PEI diluted in 97µl medium-/-
were mixed with 1µg DNA (800ng of luciferase reporter, 200ng transactivator) in 100µl
medium-/-. The PEI-DNA mix was incubated for 1hr at room temperature and drop-wise
Material and Methods
45
added to the cells in 1ml of complete medium. To ensure a better take up of the complexes
the plates were centrifuged for 5 minutes at 3000rpm and incubated overnight at 37°C. On
the next day the cells were stimulated with LPS (1µg/ml) for 24hrs and then used for a
luciferase assay.
Luciferase assay
Luciferase assays are used to analyze promoter activity in vitro. The promoter of interest is
cloned in front and controls the expression of the firefly luciferase reporter gene. The
enzyme activity is used to estimate the promoter activity after addition of the luciferase
substrate luciferin and ATP.
The cells were transient transfected 2 days before they were harvested with cold PBS. The
cell pellet was resuspended in 100µl of Harvesting-Buffer to lyse them. 50µl of Assay-
Buffer were mixed in a white non-transparent 96 well plate with 50µl lysis supernatant.
Directly before the measurement, ready-to-use luciferin solution was pumped into the
LUMIstar Omega and the enzyme activity was measured. To normalize the luciferase
values 5µl of the cell lysate were used to determine the protein concentration with
Bradford-reagent (see 2.2.2.16).
Harvesting-Buffer:
50mM Tris, pH7.8
2% Triton-X 100
50nM MES (2-(N-morpholino)ethanesulfonic acid)
1mM DTT (Dithiothreitol)
Assay-Buffer:
50mM Tris, pH7.8
50nM MES (2-(N-morpholino)ethanesulfonic acid)
20mM Magnesium acetate (Mg(C2H3O2)2)
10mM ATP pulver
Luciferin solution:
5mM K2PO4, pH7.8
10% Luciferin
2.2.4 Molecular biological methods
2.2.4.1 DNA isolation from mouse tail biopsies
To isolate DNA from mouse tails, tail biopsies were incubated at 56°C overnight in 20µl
genomic-lysis-Buffer (gLB) containing proteinase K (0.6mg/1ml). On the next day 480µl
Material and Methods
46
H2O were added, the samples were heated for 10 minutes at 95°C and used as template for
genotyping-PCRs.
Genomic-lysis-buffer:
300mM NaCl
25mM EDTA
50mM Tris, pH8
0.2% SDS
2.2.4.2 DNA isolation from cells or tissues
To isolate DNA, cells or tissue were incubated for 30 minutes in gLB containing RNase A
(100mg/ml) to digest the RNA. Afterwards the samples were digested in gLB, containing
proteinase K (60µg/ml) at 56°C. The incubation time depended on the cell amount and
tissue size (between one hour and overnight). Tissue pieces were incubated during rolling.
After digestion the samples were diluted 10-fold with TE-Buffer and thoroughly mixed.
One volume phenol was added and after mixing (for tissues rolling for 30 minutes at RT)
they were centrifuged for 10 minutes at full speed. The upper phase containing the DNA
was transferred into a new tube and one volume of isopropanol was added to precipitate
the DNA. Incubation for one hour at -70°C was optional. The DNA was pelleted by
centrifugation for 10 minutes at full speed, washed twice with EtOH 70% and dried at
room temperature. The pellet was dissolved in H2O according the pellet size.
TE-Buffer:
10mM Tris, pH8
1mM EDTA
2.2.4.3 DNA isolation from agarose gels or PCRs
To isolate DNA from agarose gels or from PCR reactions the InnuPREP DOUBLEpure Kit
(analytikJena) was used according the manufacture instructions.
2.2.4.4 RNA isolation
RNA was isolated with the “RNeasy Mini Kit” (Qiagen). To do so cells were resuspended
in 350µl RLT-Buffer supplemented with ß-mercaptoethanol (10µl/1ml) and homogenized
with a 20GA needle (6x up and down) before freezing at -70°C. Further steps were
preceded according the manufacturer’s protocol. The RNA was eluted in 30µl of the
provided water.
The yield of RNA was measured with the photometer. Purified RNA was used for cDNA
synthesis or stored at -20°C.
Material and Methods
47
For the measurement RNA was diluted 1:50 (dilution factor (DL)) in nuclease-free H2O
and filled into a quartz cuvette. The RNA concentration could be calculated in the
following manner:
μ /μ OD260nm∗ ∗
RNA was measured with an optical density (OD) of 260nm (absorption maximum of
RNA). The purity of RNA would be indicated by a ratio of OD260nm/OD280nm of ~2.0.
2.2.4.5 Reverse transcription of cDNA
The reverse transcription of single stranded cDNA was performed with the “First strand
synthesis kit” (Fermentas) following the manufacturer’s instructions. We used 100ng –
2µg RNA as starting material and random hexamer primers. The cDNA was diluted 1:2 in
H2O and directly used for RT- or Real Time PCR or stored for later use at -20°C.
2.2.4.6 Polymerase chain reaction (PCR)
Polymerase-chain reaction (PCR) is a method to amplify DNA – through a three step
cyclic reaction: denaturation of the double stranded DNA template (1), annealing of
primers (2) and elongation of DNA (3). This results in an exponential amplification of
DNA.
We used for our PCRs a master mix from Fermentas, which already contained 0.05U/μl
Taq DNA-Polymerase, 4mM MgCl2, 0.4mM dNTPs (dATP, dCTP, dGTP, dTTP) and an
optimal reaction buffer. Additional MgCl2 could be included. The used PCR conditions
were 2’ 95°C (opening denaturation) > (20’’ 95°C (denaturation) > 20’’ x°C (anneling) >
y’ 72°C (elongation)) 35-40x > 5’ 72°C (final elongation).
PCR reaction mix:
2.2.4.6.1 RT-PCR
Reverse-transcription PCR (RT-PCR) uses reversed transcripted cDNA as template.
The used PCR conditions were 2’ 95°C > (20’’ 95°C > 20’’ x°C > y’ 72°C) 24-37x > 5’
72°C.
DNA 3µl
Primer [100pmol] 0.15µl
Primer [100pmol] 0.15µl
MgCl2 [25mM] 1µl
2xPCR Mix 10µl
H2O to 20µl

Material and Methods
48
RT-PCR reaction mix:
The PCR products were normalized against housekeeping genes like ActB, HPRT and L32.
2.2.4.6.2 Real-Time PCR
In Real-Time PCRs the amount of amplified copies is quantified with fluorescent
substances, such as SYBR Green, which can intercalate into DNA. Fluorescence of such
dyes becomes significant at the beginning of the exponential phase. This point is named
crossing point (CP) and defines the threshold cycle (Ct).
The used PCR conditions were 2’ 50°C > 10’ 95°C > (15’’ 95°C > 1’ 60°C) 40x > (15’’
95°C > 20’’ 60°C> 15’’ 95°C (Dissociation)) 1x.
The Ct-values were used to calculate the fold induction of the amplified gene in
comparison with a reference gene. All values were normalized against a housekeeping
gene.
Ctgene-Cthousekeeping gene = ΔCt
ΔCtgene-ΔCtreference = ΔΔCtgene
2(-ΔΔCtgene) = relative fold inductiongene
2.2.4.7 Sequencing of DNA fragments
For DNA sequencing 1µl DNA of Maxi preparations (see 2.2.4.12) or 3µl of Mini
preparations (see 2.2.4.12) were mixed with 15pmol of a specific primer and 1µl of
BigDye® Terminator v3.1 Cycle Sequencing mix (Applied Biosystems). Water was added
up to 10µl. The used PCR conditions were 1’ 94°C > (15’’ 96°C > 15’’ 55°C > 4’ 60°C)
50x.
Before sequencing the samples were cleaned up over a Sephadex G50 column to remove
unincorporated dye terminators and analyzed at the DNA sequencing facility (Institute of
Pathology, University of Wuerzburg).
2.2.4.8 Gel electrophoresis of DNA and RNA
DNA and RNA are separated according their size in an electric field from negative to
positive. The optimal percentage of the agarose matrix depends on the size of DNA or
cDNA 1µl
Primer [100pmol] 0.25µl
Primer [100pmol] 0.25µl
2xPCR Mix 10µl
H2O to 20µl
Material and Methods
49
RNA. For DNA fragments ≥ 1kb we used 1% or less agarose and for fragments ≤ 500bp
2.5% agarose gels in 1xTAE buffer. Ethidium bromide (EtBr) or Midori Green was added
to the agarose to visualize DNA under UV-light (254nm).
50xTAE:
242g Tris
57.1ml Acetic acid
100ml 0.5M EDTA
to 1l dH2O
2.2.4.9 Digestion of DNA plasmids and fragments
Various bacterial restriction endonucleases recognize specific palindromic sequences in
double-stranded DNA and digest DNA, producing specific fragments with 5’- or 3’-
overhangs (sticky end) or blunt (blunt ends) ends.
To digest DNA we followed the enzyme manufactures advises. Reaction volumes were
adjusted according the required DNA amount.
2.2.4.10 Ligation of DNA fragments
Ligation of two DNA fragments is catalyzed by special bacteria enzymes - the DNA
ligases, which form covalent phosphodiester bonds between two nucleotides.
We used the T4 DNA ligase (Fermentas) and incubated it with our digested or synthetized
fragments according the manufactures advices overnight (ON) at 14°C.
2.2.4.11 Transformation of chemical competent bacteria
To transform bacteria with plasmid-DNA we used 50µl chemical competent bacteria per
reaction. Competent bacteria were thawed on ice and 1µl ligation sample or plasmid-DNA
was added and incubated for 30 minutes on ice. Bacteria were shocked at 42°C in a
waterbath for 30 seconds to enable DNA take-up. After 2 minutes on ice 950µl of LB-
medium without antibiotics were added. Bacteria were shaken (230rpm) for 1hr at 37°C
before plating on agar-plates with the required antibiotics and incubated overnight at 37°C.
On the next day bacterial colonies were picked and inoculated in a liquid overnight culture
for Mini or Maxi preparations (see 2.2.4.12).
2.2.4.12 Isolation of plasmid-DNA
Isolation of plasmid-DNA from bacteria was performed with the alkaline-lysis method
using solutions from the NucleoBond Xtra Maxi Kit (Macherey-Nagel).
Material and Methods
50
Bacteria were lysed with an alkaline buffer followed by the precipitation of proteins and
chromosomal DNA with a high-salt neutralization buffer. This leaves smaller plasmid-
DNA in the solution phase. Afterwards plasmid-DNA could be isolated and further
purified on a positive-charged column (Maxi preparations) or by precipitation with
isopropanol (Mini preparations).
Mini preparation
1.5ml of ON-culture was centrifuged (1 min at 14.000rpm). The pellet was completely
resuspended in 200µl of RES-Buffer. 200µl of LYS-buffer was added and after incubation
for 4 min at room temperature, 200µl of NEU-buffer were added. Chromosomal DNA and
proteins were pelleted by centrifugation for 30 minutes at full speed. The supernatant was
transferred into a fresh tube and 1 volume isopropanol was added to precipitate the
plasmid-DNA (15 min at 14.000rpm). The DNA was washed twice with EtOH 80% (5 min
at 14.000rpm) and dried at room temperature. After solving in 25µl water the DNA yield
was measured on the photometer.
μ /μ OD260nm∗ ∗
Maximum of DNA absorption is at 260nm. “Pure” DNA would be indicated by a ratio of
OD260nm/OD280nm of ~1.8.
Maxi preparation
To isolate larger amounts of pure plasmid-DNA the NucleoBond Xtra Maxi Kit
(Macherey-Nagel) was used according the manufactures instructions.
2.2.4.13 Genomic southern Blot
To detect specific DNA sequences in genomic DNA we preformed genomic Southern
Blots. A genomic Southern Blot consist of four steps: 1) digestion of genomic DNA with
restriction endonucleases, 2) separation of the digested fragments by electrophoresis, 3)
transfer of the separated fragments to a positively charged nylon membrane and 4)
radioactive labeling and hybridization of probes to detect the fragment of interest.
1) Digestion:
The cells were lysed in the presence of 40µl ES-lysis Buffer and 15µl proteinase K
[10mg/ml] overnight at 56°C in a 96 well plate. On the next day the plates were cooled to
room temperature (RT) and 200µl EtOH 100% were added per well. Afterwards the plates
were shaken at RT for one till two hours. To remove the liquid the plates were turned over
and put on a paper towel stack. After adding EtOH 70% twice for 10 minutes, the DNA
was dried for 10 minutes at RT and 40µl of DNA digestion mix were added per well.
Material and Methods
51
ES-lysis Buffer:
20mM NaCl
10mM Tris HCl, pH 7,5
10mM EDTA, pH 8
0,5% Sarcosyl
Digestion mix:
H2O
10x Buffer
RNase A [10 U/µl]
Spermidin [1 M]
DTT [1M]
enzyme [100U/µl]
34.9µl
4µl
0.4µl
0.1µl
0.1µl
0.5µl
40µl
After the overnight incubation the on-going digestion was verified on a 1% agarose gel
(see 2.2.4.8). If the digest was incomplete fresh enzyme was added for an additional over
day incubation (six till eight hours).
2) Separation:
The digested DNA was loaded on a large 0.8% agarose gel (900ml 1xTAE and 50µl EtBr)
and separated overnight at 25-30V.
For depurination the gel was incubated for 10 minutes in 0.25M HCl. Afterwards it was
rinsed with water and incubated for 30 minutes in denaturation buffer (0.5M NaOH, 1.5M
NaCl) and 30 minutes in neutralization buffer (1.5M NaCl, 1M Tris HCl pH 7.2) with
constant shaking.
3) Transfer:
The transfer was carried out in the same chamber used for gel electrophoresis. The blot
consisted of one big Wathman 3MM filter bridge at the bottom, followed by three wet (10x
SSC) filter papers in size of the gel, the gel itself, the membrane (pre-incubated in
10xSSC), two more dry Wathman filter papers, many dry paper towels, a plate and a
weight on the top. The tray was filled with 10xSSC and the DNA was transferred
overnight. After the transfer the membrane was denatured (0.4M NaOH) and neutralized
(0.2M Tris HCl pH 7,5, 1x SSC) for one minute . Finally the DNA was fixed by backing at
60°C for 2hr.
Material and Methods
52
4) Labeling and hybridization:
For pre-hybridization the membrane was soaked in 2xSSC, put on a hybridization mesh
and transferred into a hybridization roller bottle with 40ml of pre-warmed (65°C)
hybridization Buffer and incubated for 2hrs at 65°C with constant rolling. The probe was
labeled in a 1.5ml tube with the DecaLabel™ DNA Labeling Kit (Fermentas). 100ng of
DNA template were labeled using Mix C and [α-P32]-dCTP (1.85 MBq = 50 μCi)
according the manufacturer’s instructions. Unincorporated dNTPs were removed on a
Sephadex G-50 mini-column. The labeled probe was mixed with 1 volume of
formaldehyde, denaturated by heating at 95°C for 5 min, chilled on ice and mixed with
40ml fresh hybridization Buffer. The hybridization of the membrane was preformed
overnight at 65°C with constant rolling.
On the next day the membrane was washed at 65°C with SSC buffer at decreasing
concentrations (2x - 0.1x, 30 min shaking in the waterbath per wash, until the membrane
counted less than 50cps according the Geiger-counter). The membrane was exposed to an
X-ray film at -70°C using an intensifying screen and developed on the next day.
20x SSC: Sodium Phosphate Buffer pH 7,2
3M NaCl 280ml 1M NaH2PO4
300mM sodium citrate, pH 7 720ml 1M Na2HPO4
Hybridization Buffer: Wash-solution 1:
0.5M Sodium phosphate Buffer pH 7.2 2x SSC
7% SDS 0.1% SDS
10mM EDTA
Wash-solution 2: Wash-solution 3:
0.2x SSC 0.1x SSC
0.1% SDS 0.1% SDS
2.2.4.14 Chromatin immunoprecipitation (ChIP)
To analyze protein, mainly transcription factor, binding to DNA in vivo and in vitro
chromatin immunoprecipitation was used. For this approach the protein-DNA complexes
are cross-linked in situ. Cross-linked chromatin is sheared into smaller fragments which
could be immunoprecipitated using specific antibodies and protein A/G agarose. After
reversal of the cross-links, precipitated DNA is purified and the presence of specific
genomic sequences is detected by PCR (see 2.2.4.6).
Material and Methods
53
For the modified protocol (Soutoglou and Talianidis, 2002) 2-5x10⁷ cells were used. The
cells were washed once with medium before fixing in 1% FA (5 min at RT). The fixation
reaction was quenched with 125mM Glycine (5 min at RT). The cells were harvested by
scraping and washed twice with PBS-/-. Afterwards they were incubated in 1ml swelling
Buffer containing 10µl protease inhibitor (HALT protease Inhibitor (Fermentas)) (30
minutes on ice). The cell nuclei were collected by centrifugation (10 min at 5000rpm) and
resuspended in 500µl sonification Buffer. To shear the chromatin the nuclei were
sonificated for 10 min with 35% power. To avoid unspecific binding during the
immunoprecipitation the extract was pre-cleared with 3µg of unrelated antibody (anti-
dsRed) in the presence of 10µg salmon sperm DNA, 10µg BSA and 40µl protein G beads,
rolled for 2hrs at 4°C. The supernatant was transferred into a fresh tube and the DNA
content was measured at 260nm. 30 optical density units of chromatin were incubated in
300µl of sonification Buffer with 1.5µg anti-NFATc1 antibody in the presence of 10µg
salmon sperm DNA and 10µg BSA, rolled overnight at 4°C. As negative control a mouse
derived IgG1 was used. An input control was taken and stored at -20°C. On the next day
30µl protein G beads were added for 1hr rolling at 4°C. The beads were washed twice with
500µl of sonification /high salt / LiCl and TE-buffers, 250µl of elution Buffer were added
twice for 15 min, rolling at 65°C. 470µl elution Buffer were added to the input control,
which could be included then into the DNA preparation process. To reverse the cross-
linking 21µl 5M NaCl and 40µg proteinase K were added to the samples followed by
incubation at 65°C overnight. On the next day the RNA was digested with 20µg RNase A
for 2hrs at 42°C before the DNA was extracted with Phenol/Chloroform/Isoamylalkohol
(25/24/1) and Chloroform/Isoamylalkohol (25/1) (shaking for 15 minutes followed by 5
min centrifugation). The supernatant was transferred into a fresh tube and 33µl NH4Ac
(4M), 1µl linear polyacrylamide as carrier for the small fragments, and 1ml cold EtOH
were added and incubated for 1hr at -70°C. After 1hr centrifugation at full speed in the
cold room the DNA was washed with 200µl EtOH 70% and dried at room temperature.
The pellet was dissolved in 25µl of TE-Buffer. The DNA was used directly for PCR
(2.2.4.6) or stored at -20°C.
Material and Methods
54
Swelling Buffer: Sonification Buffer:
25mM HEPES, pH 7.8 50mM Tris, pH 7.9
10mM KCl 100mM NaCl
1.5mM MgCl2 10mM EDTA, pH 8
0.2% NP-40 0.1% SDS
0.5% Sodiumdeoycholate
LiCl Buffer: High salt Buffer:
20mM Tris, pH 8 500mM NaCl in sonification buffer
250mM LiCl
1mM EDTA, pH8
0.5% NP-40
0.5% Sodiumdeoycholate
Elution Buffer:
50mM Tris, pH 8
1mM EDTA, pH 8
1% SDS
50mM NaCO3
2.2.4.15 Immunocytochemistry
With immunocytochemistry proteins can be visualized. One method within the
immunocytochemistry is the staining of proteins for confocal microscopy. In this case
fluorochrome coupled antibodies are used to stain proteins of interests on fixed and
permeabilized cells on a glass slide. The stained cells can be analyzed with confocal
scanning microscopy, which detects the emitted light of fluorochromes after excitation
with laser light. Major advantages of confocal scanning microscopy are higher resolution
by usage of two pinholes to blind out diffused light and the possibility to scan through a
whole cell.
For confocal stainings glass slides with attached macrophages were washed (all washing
steps were performed in PBS-/- in a staining jar) and fixed for 15 min in 3% FA/PBS at
room temperature. After three washing steps the slides were incubated at least overnight in
PBS/0.1% BSA in the fridge. Cell permeabilization was performed with 0.1% Triton-
X100/PBS for 15 min on ice. After three washing steps the slides were transferred into a
wet chamber and incubated for 1hr with the primary antibody (1:100 or 1:50 depending on
Material and Methods
55
the antibody) in 1% BSA/PBS (sterile filtrated). After three more washing steps the slides
were incubated with the secondary fluorescent-labeled antibody (1:400) in the wet
chamber for 1hr. After the final three washing steps (5 min/ each) one drop of mounting
medium with DAPI (Fluoroshield, Sigma-Aldrich) was added and covered with a cover
slip.
The pictures were taken with a Leica Confocal microscope (TCS SP5 II) and analyzed with
the Leica Software Image Pro Plus. For further demonstration the digital images were
processed with CorelDRAW X5.
2.2.4.16 Western Blot
Proteins can be analyzed by Western Blot technique, which consists of three steps:
separation of proteins according to the size on the SDS-PAGE (1), transfer of proteins to a
nitrocellulose membrane (2) and detection of specific proteins with antibodies (3).
Harvested cells were washed twice with PBS-/- and lysed in RIPA-Buffer supplemented
with protease inhibitor (10µl/1ml). Around 3 ‘cell-pellet volumes’ of RIPA-Buffer were
routinely used. In order to lyse the cells completely they were sonificated (30 seconds,
50% amplitude) and chilled on ice for 20 minutes. Lysates were either used directly for the
Bradford assay or stored again at -70°C
RIPA-Buffer:
50mM Tris HCl, pH 7.5
150mM NaCl
1% Triton-X 100
1% Na-deoxycholat
0.1% SDS
1mM EDTA, pH 8
Bradford assay
The protein concentration of the samples was determined using the Bradford assay. This
assay is based on complexes built between the Bradford reagent (Coomassie-Brilliant-Blue
G-250) and proteins under acidic conditions, leading to different absorption characteristics
(465nm without and 595nm with proteins).
The samples were centrifuged and the protein-containing supernatant was transferred into a
fresh tube. “Protein Assay Dye Reagent Concentrate” (BioRad) was diluted 1:4. 1ml of the
dilution was mixed with 1µl protein sample in a plastic cuvette and the absorption was
measured at 595nm. The standard curve was prepared with BSA solution [1µg/µl].
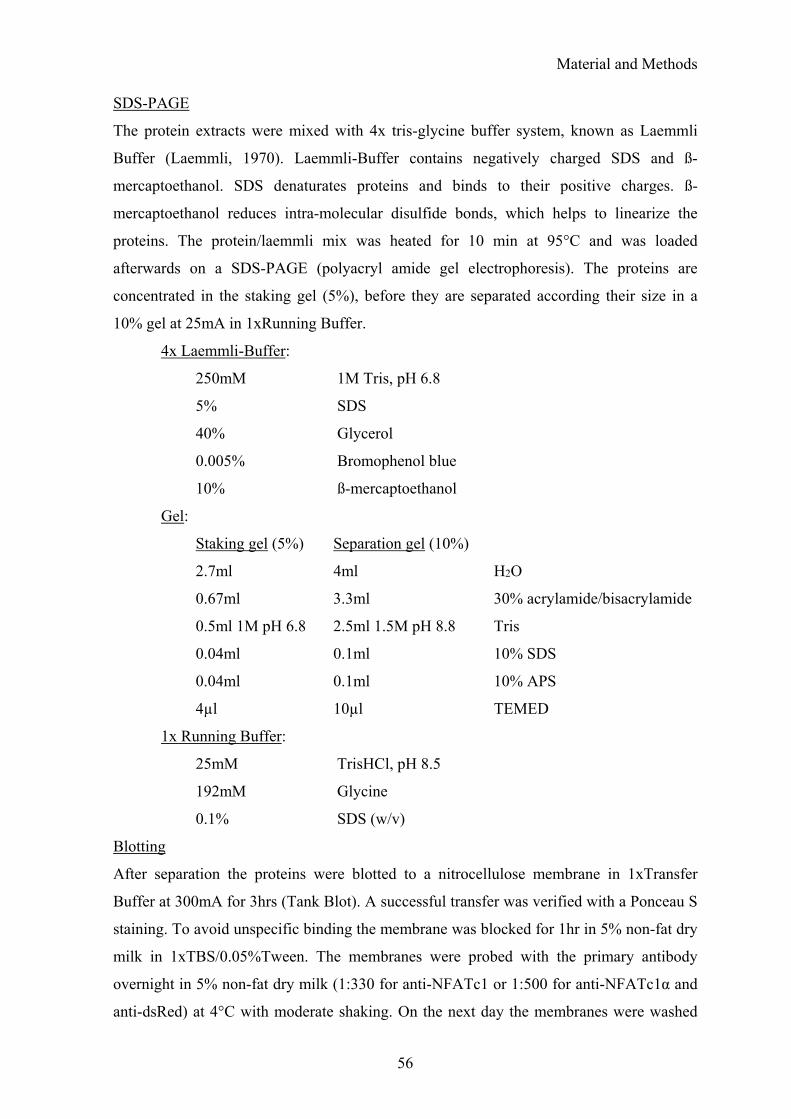
Material and Methods
56
SDS-PAGE
The protein extracts were mixed with 4x tris-glycine buffer system, known as Laemmli
Buffer (Laemmli, 1970). Laemmli-Buffer contains negatively charged SDS and ß-
mercaptoethanol. SDS denaturates proteins and binds to their positive charges. ß-
mercaptoethanol reduces intra-molecular disulfide bonds, which helps to linearize the
proteins. The protein/laemmli mix was heated for 10 min at 95°C and was loaded
afterwards on a SDS-PAGE (polyacryl amide gel electrophoresis). The proteins are
concentrated in the staking gel (5%), before they are separated according their size in a
10% gel at 25mA in 1xRunning Buffer.
4x Laemmli-Buffer:
250mM 1M Tris, pH 6.8
5% SDS
40% Glycerol
0.005% Bromophenol blue
10% ß-mercaptoethanol
Gel:
Staking gel (5%) Separation gel (10%)
2.7ml 4ml H2O
0.67ml 3.3ml 30% acrylamide/bisacrylamide
0.5ml 1M pH 6.8 2.5ml 1.5M pH 8.8 Tris
0.04ml 0.1ml 10% SDS
0.04ml 0.1ml 10% APS
4µl 10µl TEMED
1x Running Buffer:
25mM TrisHCl, pH 8.5
192mM Glycine
0.1% SDS (w/v)
Blotting
After separation the proteins were blotted to a nitrocellulose membrane in 1xTransfer
Buffer at 300mA for 3hrs (Tank Blot). A successful transfer was verified with a Ponceau S
staining. To avoid unspecific binding the membrane was blocked for 1hr in 5% non-fat dry
milk in 1xTBS/0.05%Tween. The membranes were probed with the primary antibody
overnight in 5% non-fat dry milk (1:330 for anti-NFATc1 or 1:500 for anti-NFATc1α and
anti-dsRed) at 4°C with moderate shaking. On the next day the membranes were washed

Material and Methods
57
three times with 1xTBS/0.05%Tween (30 min/ each) and incubated with the secondary
antibody (anti-mouse-HRP or anti-rabbit-HRP 1:5000) for 1hr at RT. Three more washing
steps around 10 minutes followed by seven short ones were preceded before adding the
substrate (SuperSignal West Pico ECL Substrate). The signal was detected with the Fusion
SL (Vilbert) camera or with an X-ray film (Hyperfilm ECL, Amersham).
1xTransfer Buffer:
48mM Tris HCL, pH 8.5
40mM Glycine
14mM SDS
20% Methanol
1xTBS/0.05%Tween:
25mM Tris HCL, pH 7.5
150mM Glycine
0.05% Tween-20
2.2.4.17 Yeast culture
Saccharomyces cerevisiae were cultivated in YPD medium supplemented with ampicillin
(100µg/ml) to avoid bacterial contaminations. For liquid cultures one single colony was
inoculated in 100ml of YPD and cultivated overnight at 30°C and 220rpm in a 500ml flask.
For solid cultures YPD/Agar (20g/1l) plates with ampicillin (100µg/ml) were used.
Saccharomyces cerevisiae were cultivated on pre-warmed plates overnight at 30°C.
2.2.4.17.1 Yeast colony-forming-unit assay
100µl – 1ml of peritoneal fluid from yeast injected mice was plated on YPD plates and
incubated for 24hrs at 30°C. In a second set-up the recovered peritoneal fluid was
centrifuged, resuspended in 2ml PBS-/- and 1ml, 100µl and 10µl were seeded on plates.
Yeast colonies were counted after 24hrs incubation at 30°C and the number of yeast cells
per mouse was calculated.
2.2.4.18 Induction of peritonitis
To induce peritonitis 1x10⁷ Saccharomyces cerevisiae were injected in mice (in 400µl
sterile PBS-/-), i.p. (tuberculin syringe). For injections fresh liquid yeast cultures were
prepared as described (2.2.4.17). Yeasts were harvested by centrifugation (10 minutes at
5000rpm) and washed three times with 30ml PBS-/- (centrifugation for 10 minutes at
5000rpm). The yeasts were counted and dissolved at a concentration of 2.5x10⁷/ml in PBS-
/-. NaCl 0.9% was used as physiological control. After indicated time periods the mice

Material and Methods
58
were killed by cervical dislocation and the peritoneal fluid was taken by lavage (2.2.1.4.1).
The cells were analyzed by FACS (2.2.2) or used for RNA isolation (2.2.4.4). The yeasts
were cultured for cfu assays (2.2.4.17.1).

Results
59
3 Results
NFATc1 β-isoforms in innate and adaptive immunity
NFATc1 plays critical roles in lymphoid activation (Serfling et al., 2012), myeloid
regulation (Fric et al., 2012), cardiovascular development (de la Pompa et al., 1998) and
cancerogenesis (Müller and Rao, 2010).
The transcription of Nfatc1 is directed by two alternative promoters, from the inducible P1
promoter and the constitutive P2 promoter. While the role of P1-directed NFATc1α-
isoforms to promote survival of activated lymphocytes is well-established (Chuvpilo et al.,
2002), the relevance of constitutively generated NFATc1β-isoforms mainly expressed in
resting lymphocytes, myeloid and non-lymphoid cells remains unclear.
Former work at our department indicated different roles for NFATc1α and NFATc1β in
lymphocytes (Chuvpilo et al., 2002; Hock et al., 2013). We focused on myeloid cells,
especially on macrophages, where the essential role for NFAT transcription factors was
recently discovered (Kayama et al., 2009; Greenblatt et al., 2010; Yamaguchi et al., 2011;
Yarilina et al., 2011).
3.1 NFATc1 in resident macrophages during a fungal infection
Peritoneal resident macrophages (prMΦ) are tissue restricted local guardians which
provide the first line of defense against peritoneal infections (Yona et al., 2013). As
NFATs were described to be involved in antifungal response (Goodridge, 2007; Greenblatt
et al., 2010), we focused on fungal-induced peritonitis as experimental system.
3.1.1 Yeast infection induced transient Nfatc1 gene transcription in
resident peritoneal macrophages
To induce peritonitis we injected C57/B6 mice i.p. with the non-pathogenic yeast S.
cerevisiae. To determine if NFATc1 is involved in antifungal responses, we analyzed the
relative levels of P1- and P2-directed Nfatc1 transcripts by Real-Time PCR. While yeast
infection resulted only in a marginal increase of P1 transcripts, a strong induction of P2-
directed transcripts was observed within one hour after yeast injection (Fig.3.1 A). Similar
levels of P1- and P2-directed Nfatc1 transcripts (Fig.3.1 B) and of total Nfatc1 RNA
(Fig.3.1 C) were detected 24hrs upon infection. This suggests a transient induction of P2-
directed transcripts where the maximum is reached upon 24hrs infection.
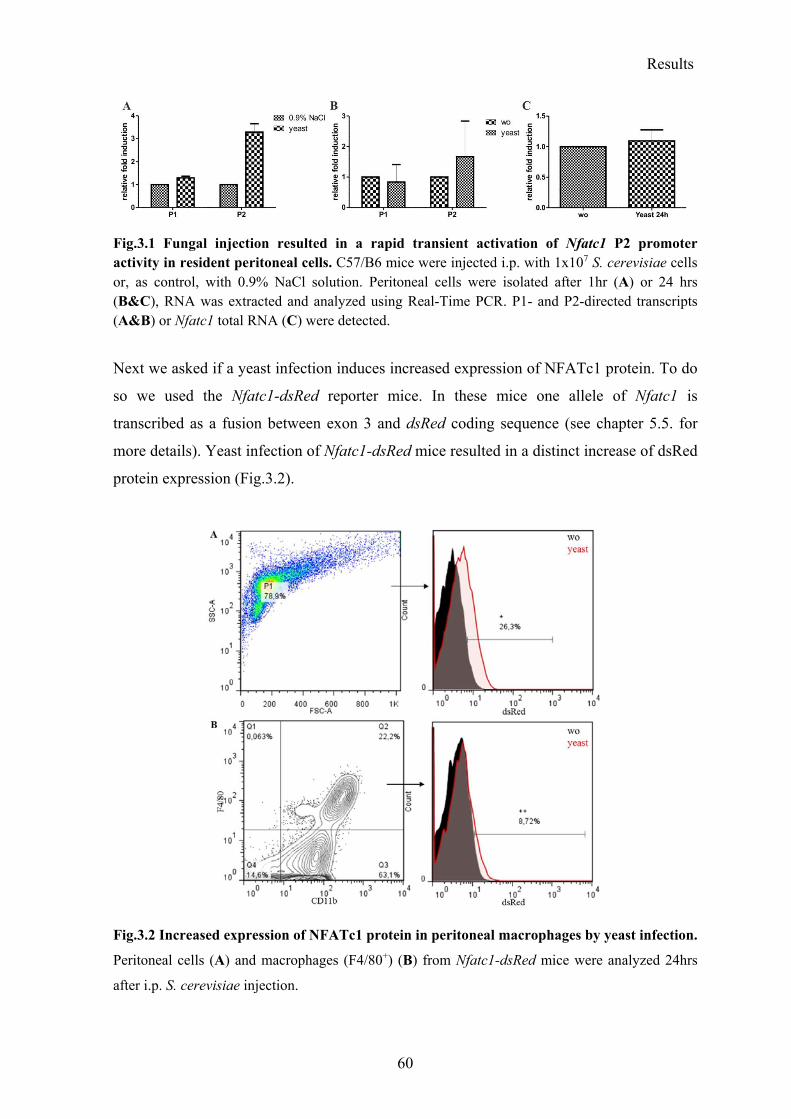
Results
60
Fig.3.1 Fungal injection resulted in a rapid transient activation of Nfatc1 P2 promoter activity in resident peritoneal cells. C57/B6 mice were injected i.p. with 1x10⁷ S. cerevisiae cells or, as control, with 0.9% NaCl solution. Peritoneal cells were isolated after 1hr (A) or 24 hrs (B&C), RNA was extracted and analyzed using Real-Time PCR. P1- and P2-directed transcripts (A&B) or Nfatc1 total RNA (C) were detected.
Next we asked if a yeast infection induces increased expression of NFATc1 protein. To do
so we used the Nfatc1-dsRed reporter mice. In these mice one allele of Nfatc1 is
transcribed as a fusion between exon 3 and dsRed coding sequence (see chapter 5.5. for
more details). Yeast infection of Nfatc1-dsRed mice resulted in a distinct increase of dsRed
protein expression (Fig.3.2).
Fig.3.2 Increased expression of NFATc1 protein in peritoneal macrophages by yeast infection.
Peritoneal cells (A) and macrophages (F4/80+) (B) from Nfatc1-dsRed mice were analyzed 24hrs
after i.p. S. cerevisiae injection.

Results
61
These data indicate that yeast infections enhance NFATc1 protein expression in prMΦ and
suggest that the P2-directed NFATc1-isoforms play an important role during
phagocytosis and/or other antifungal responses.
3.1.2 Rapid translocation of NFATc1, but not of NFATc2 and NFATc3
after yeast stimulation
Our immunohistochemical analyzes showed a cytosolic localization of NFATc1, NFATc2
and NFATc3 proteins in mouse prMΦ (Fig.3.3 and 3.5). These findings were consistent
with other reports about the localization of NFATs in macrophages (Conboy et al., 1999;
Goodridge, 2007; Liu et al., 2011). Stimulation of macrophages with yeast ex vivo resulted
in a very rapid nuclear translocation of NFATc1 protein. However, translocation of
NFATc2 protein was detected only in a small fraction of F4/80+ peritoneal cells (≤ 10%). It
should be noted that the NFATc2 expression level in these cells was significantly lower
than in bone marrow derived macrophages (BMDM, see Fig.3.6). In contrast, NFATc3
protein remained consistently cytosolic in all macrophages (Fig.3.5).
Together, these data suggest that the nuclear translocation of NFATc1-protein plays a
specific and important role in response of peritoneal resident macrophages against yeast
infection.
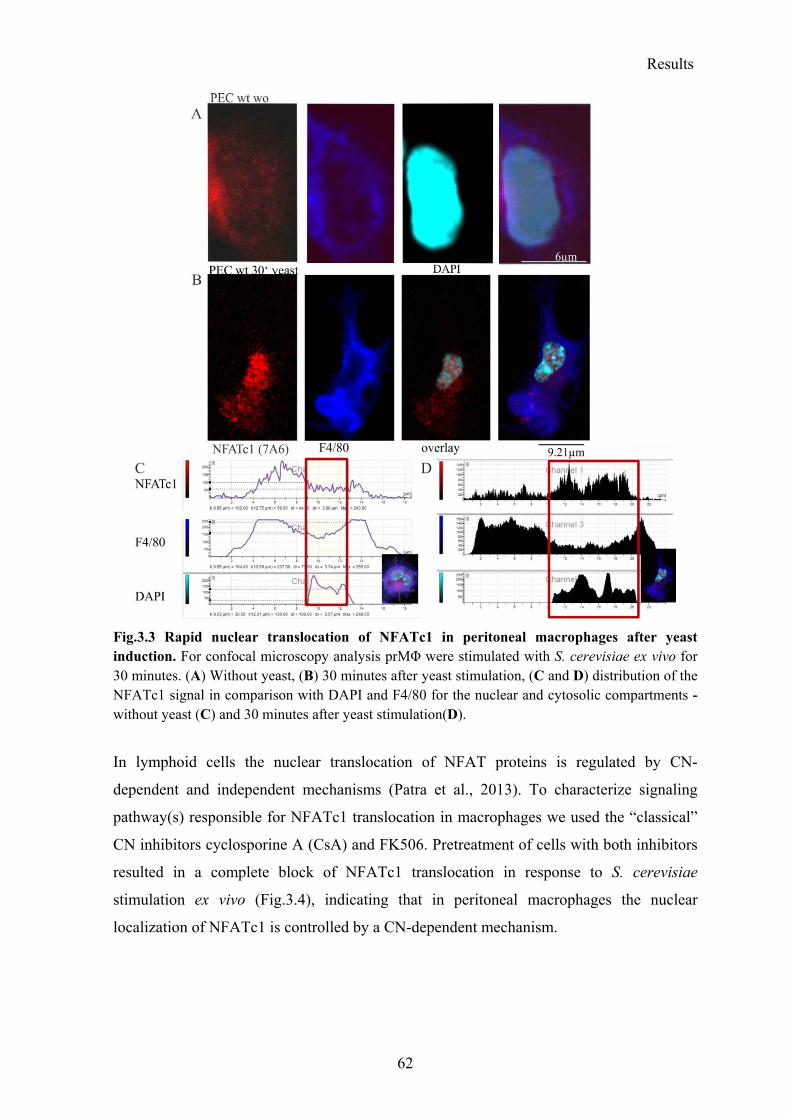
Results
62
Fig.3.3 Rapid nuclear translocation of NFATc1 in peritoneal macrophages after yeast induction. For confocal microscopy analysis prMΦ were stimulated with S. cerevisiae ex vivo for 30 minutes. (A) Without yeast, (B) 30 minutes after yeast stimulation, (C and D) distribution of the NFATc1 signal in comparison with DAPI and F4/80 for the nuclear and cytosolic compartments - without yeast (C) and 30 minutes after yeast stimulation(D).
In lymphoid cells the nuclear translocation of NFAT proteins is regulated by CN-
dependent and independent mechanisms (Patra et al., 2013). To characterize signaling
pathway(s) responsible for NFATc1 translocation in macrophages we used the “classical”
CN inhibitors cyclosporine A (CsA) and FK506. Pretreatment of cells with both inhibitors
resulted in a complete block of NFATc1 translocation in response to S. cerevisiae
stimulation ex vivo (Fig.3.4), indicating that in peritoneal macrophages the nuclear
localization of NFATc1 is controlled by a CN-dependent mechanism.
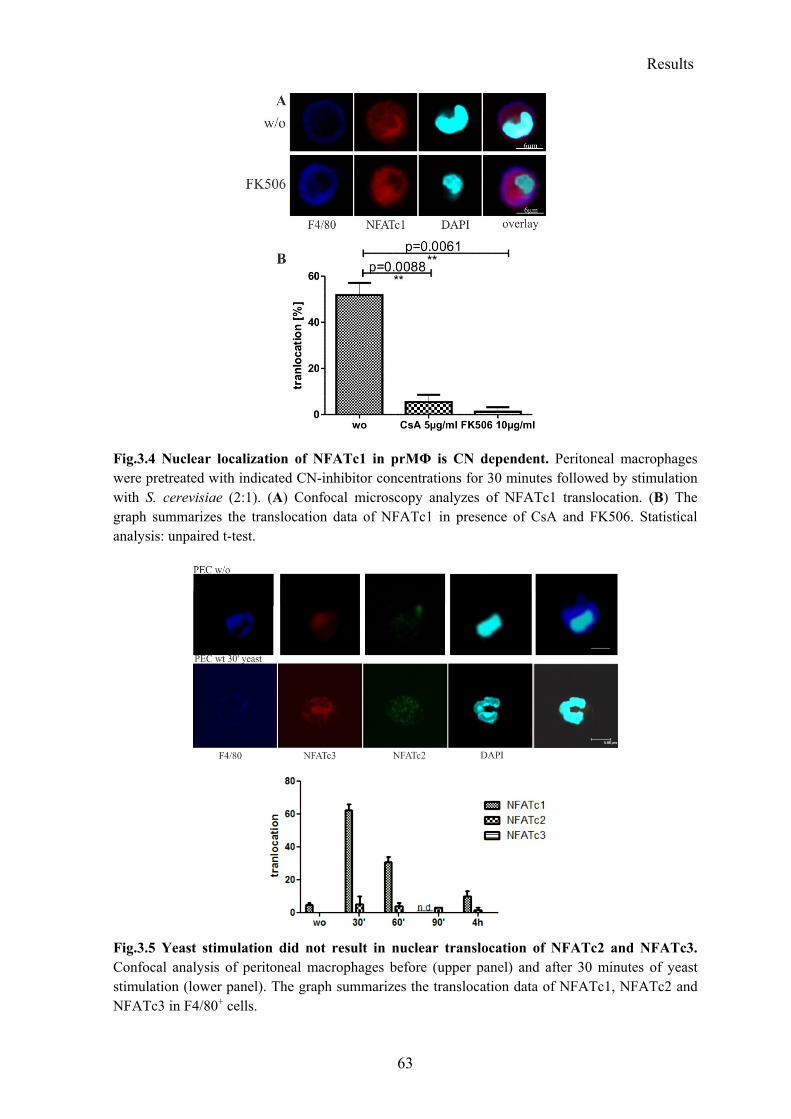
Results
63
Fig.3.4 Nuclear localization of NFATc1 in prMΦ is CN dependent. Peritoneal macrophages were pretreated with indicated CN-inhibitor concentrations for 30 minutes followed by stimulation with S. cerevisiae (2:1). (A) Confocal microscopy analyzes of NFATc1 translocation. (B) The graph summarizes the translocation data of NFATc1 in presence of CsA and FK506. Statistical analysis: unpaired t-test.
Fig.3.5 Yeast stimulation did not result in nuclear translocation of NFATc2 and NFATc3. Confocal analysis of peritoneal macrophages before (upper panel) and after 30 minutes of yeast stimulation (lower panel). The graph summarizes the translocation data of NFATc1, NFATc2 and NFATc3 in F4/80+ cells.
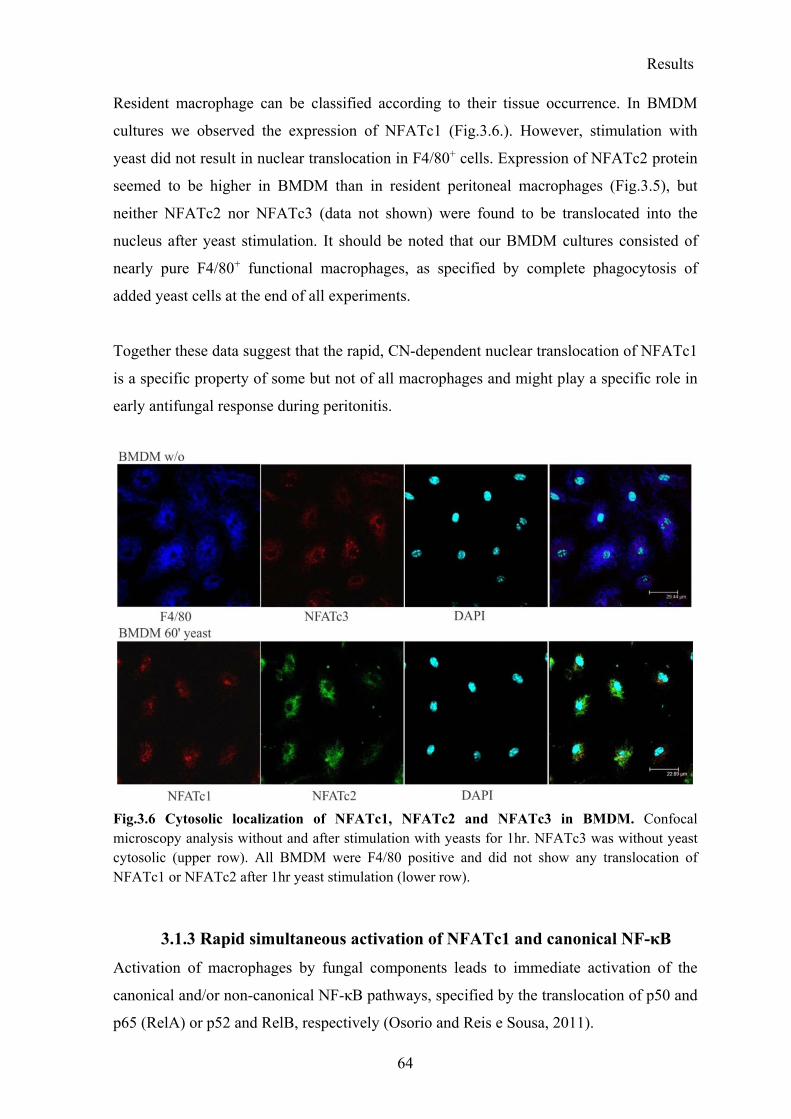
Results
64
Resident macrophage can be classified according to their tissue occurrence. In BMDM
cultures we observed the expression of NFATc1 (Fig.3.6.). However, stimulation with
yeast did not result in nuclear translocation in F4/80+ cells. Expression of NFATc2 protein
seemed to be higher in BMDM than in resident peritoneal macrophages (Fig.3.5), but
neither NFATc2 nor NFATc3 (data not shown) were found to be translocated into the
nucleus after yeast stimulation. It should be noted that our BMDM cultures consisted of
nearly pure F4/80+ functional macrophages, as specified by complete phagocytosis of
added yeast cells at the end of all experiments.
Together these data suggest that the rapid, CN-dependent nuclear translocation of NFATc1
is a specific property of some but not of all macrophages and might play a specific role in
early antifungal response during peritonitis.
Fig.3.6 Cytosolic localization of NFATc1, NFATc2 and NFATc3 in BMDM. Confocal microscopy analysis without and after stimulation with yeasts for 1hr. NFATc3 was without yeast cytosolic (upper row). All BMDM were F4/80 positive and did not show any translocation of NFATc1 or NFATc2 after 1hr yeast stimulation (lower row).
3.1.3 Rapid simultaneous activation of NFATc1 and canonical NF-κB
Activation of macrophages by fungal components leads to immediate activation of the
canonical and/or non-canonical NF-κB pathways, specified by the translocation of p50 and
p65 (RelA) or p52 and RelB, respectively (Osorio and Reis e Sousa, 2011).
Results
65
To determine whether yeast stimulation activates the NF-κB pathways in peritoneal
macrophages, we performed immunohistochemical stainings with antibodies raised against
p65 and p52 proteins.
We found that p65 was translocated in the nuclei of most of the peritoneal macrophages
along with NFATc1 within 30 minutes after yeast stimulation (Fig.3.7), while translocation
of p52 was detected only in a small proportion (≤ 10%) of F4/80+ cells.
To investigate the kinetics of this activation, we analyzed peritoneal macrophages at later
time-points of yeast stimulation (Fig.3.7 D). Nuclear translocation of NFATc1 appeared to
be relatively transient, which reached maximum already 30 minutes after stimulation. It
was only found in approximately 50% of F4/80+ cells after 1hr and was nearly absent 4hrs
post stimulation. The activity of the canonical NF-κB pathway, as judged from
translocation of p65 protein, persisted much longer and showed only a slight decrease after
4hrs. Even after prolonged stimulation, the non-canonical NF-κB pathway appeared not to
be stimulated.
These data indicate a rapid and simultaneous activation of the canonical NF-κB- and
NFATc1-dependent pathways in response to yeast stimulation. The transient nature of the
nuclear residence of NFATc1 suggests that NFATc1 is involved in an early stage of
defense against peritoneal fungal infections, perhaps initiating a resident macrophage
specific transcription program which could be maintained by the transcriptional activity of
the canonical NF-κB pathway.

Results
66
Fig.3.7 Simultaneous translocation of NFATc1 and NF-κB p65 after yeast stimulation. Confocal microscopy analysis of the appearance of NFATc1 and p65 in peritoneal macrophages. Localization of NFATc1 and p65 prior (A) and after 1hr of yeast stimulation (B) and of NFATc1 and p52 after 30 minutes of yeast stimulation (C). (D) Time kinetics of NFATc1, p65 and p52 nuclear translocation in F4/80+ cells.
3.1.4 Predominant expression of NFATc1β-isoforms in peritoneal
resident macrophages
The transient activation of the Nfatc1 P2 promoter (Fig.3.1) suggested that
NFATc1isoforms might be predominantly expressed in prMΦ and that their expression
might be increased after yeast stimulation. To determine the composition of NFATc1-
protein-isoforms expressed in prMΦ, we used the Nfatc1-dsRed reporter mouse which
enabled the distinct differentiation and quantitation of all NFATc1-isoforms as fusions
with the dsRed-protein (see chapter 5.5. for more details). Protein induction was first
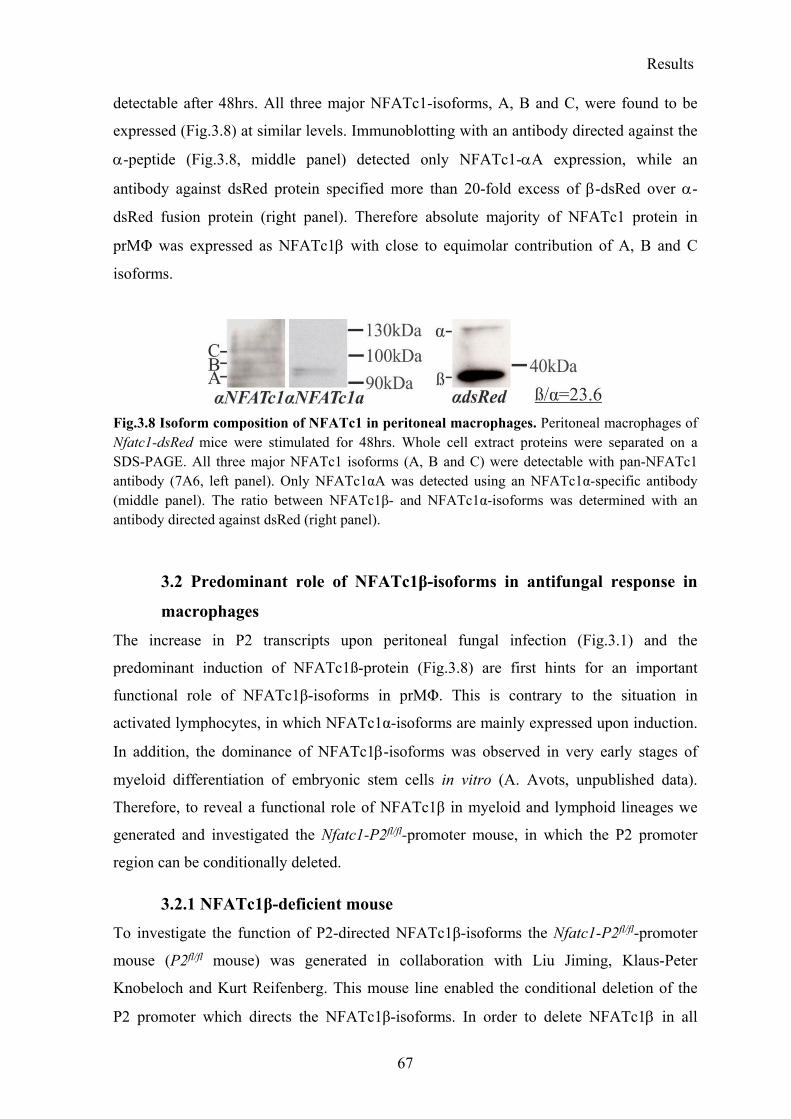
Results
67
detectable after 48hrs. All three major NFATc1-isoforms, A, B and C, were found to be
expressed (Fig.3.8) at similar levels. Immunoblotting with an antibody directed against the
-peptide (Fig.3.8, middle panel) detected only NFATc1-A expression, while an
antibody against dsRed protein specified more than 20-fold excess of -dsRed over -
dsRed fusion protein (right panel). Therefore absolute majority of NFATc1 protein in
prMΦ was expressed as NFATc1 with close to equimolar contribution of A, B and C
isoforms.
Fig.3.8 Isoform composition of NFATc1 in peritoneal macrophages. Peritoneal macrophages of Nfatc1-dsRed mice were stimulated for 48hrs. Whole cell extract proteins were separated on a SDS-PAGE. All three major NFATc1 isoforms (A, B and C) were detectable with pan-NFATc1 antibody (7A6, left panel). Only NFATc1αA was detected using an NFATc1α-specific antibody (middle panel). The ratio between NFATc1β- and NFATc1α-isoforms was determined with an antibody directed against dsRed (right panel).
3.2 Predominant role of NFATc1β-isoforms in antifungal response in
macrophages
The increase in P2 transcripts upon peritoneal fungal infection (Fig.3.1) and the
predominant induction of NFATc1ß-protein (Fig.3.8) are first hints for an important
functional role of NFATc1β-isoforms in prMΦ. This is contrary to the situation in
activated lymphocytes, in which NFATc1α-isoforms are mainly expressed upon induction.
In addition, the dominance of NFATc1-isoforms was observed in very early stages of
myeloid differentiation of embryonic stem cells in vitro (A. Avots, unpublished data).
Therefore, to reveal a functional role of NFATc1β in myeloid and lymphoid lineages we
generated and investigated the Nfatc1-P2fl/fl-promoter mouse, in which the P2 promoter
region can be conditionally deleted.
3.2.1 NFATc1β-deficient mouse
To investigate the function of P2-directed NFATc1β-isoforms the Nfatc1-P2fl/fl-promoter
mouse (P2fl/fl mouse) was generated in collaboration with Liu Jiming, Klaus-Peter
Knobeloch and Kurt Reifenberg. This mouse line enabled the conditional deletion of the
P2 promoter which directs the NFATc1β-isoforms. In order to delete NFATc1 in all

Results
68
tissues (P2Δ mice) we crossed the P2fl/fl mice with a CMV-cre deleter line. In addition, first
experiments were performed with the P2fl/fl-LysM-cre mice which allow myeloid lineage
specific ablation of NFATc1.
To establish a reliable genotyping of the P2fl/fl mice we first proved the correct integration
site of the P2fl/fl targeting vector in the founder lines. Genomic Southern Blots of DNA
isolated from mouse tail biopsies confirmed a correct 5’ integration site of the targeting
vector (Fig.3.9 B). To verify the integrity of the targeted allele we established genomic
PCR protocols for the detection of the 3’-loxP sites, and for detecting of the cre-mediated
deletion of P2 sequences (see Fig.3.9 A for more details).
Fig.3.9 Genetic validation of Nfatc1-P2fl/fl founder mice. (A) Targeting scheme (E = EcoRI, P = Southern blot probe, neo = neomycin resistance gene under control of the PGK promoter). Positions of the PCR primers for the detection of the 3’-loxP site (#1 and #2) and for detection of the cre-mediated deletion of the P2 promoter (#2, #3) are indicated (B) EcoRI-digested genomic DNA from tail biopsies of P2fl/fl founder mice was hybridized with a P32-labeled probe representing region ‘P’ outside of the targeting vector. The size of the wild type and mutated Nfatc1 alleles is 21.4 and 6.8 kb, respectively. (C) Genomic DNA was amplified via PCR using primers #1 and #2 to confirm the presence of the 3’-loxP site. (D) Deletion of P2 promoter sequences in P2fl/fl-CMV-cre and P2fl/fl-LysM-cre mice were detected via PCR using primers #2 and #3.
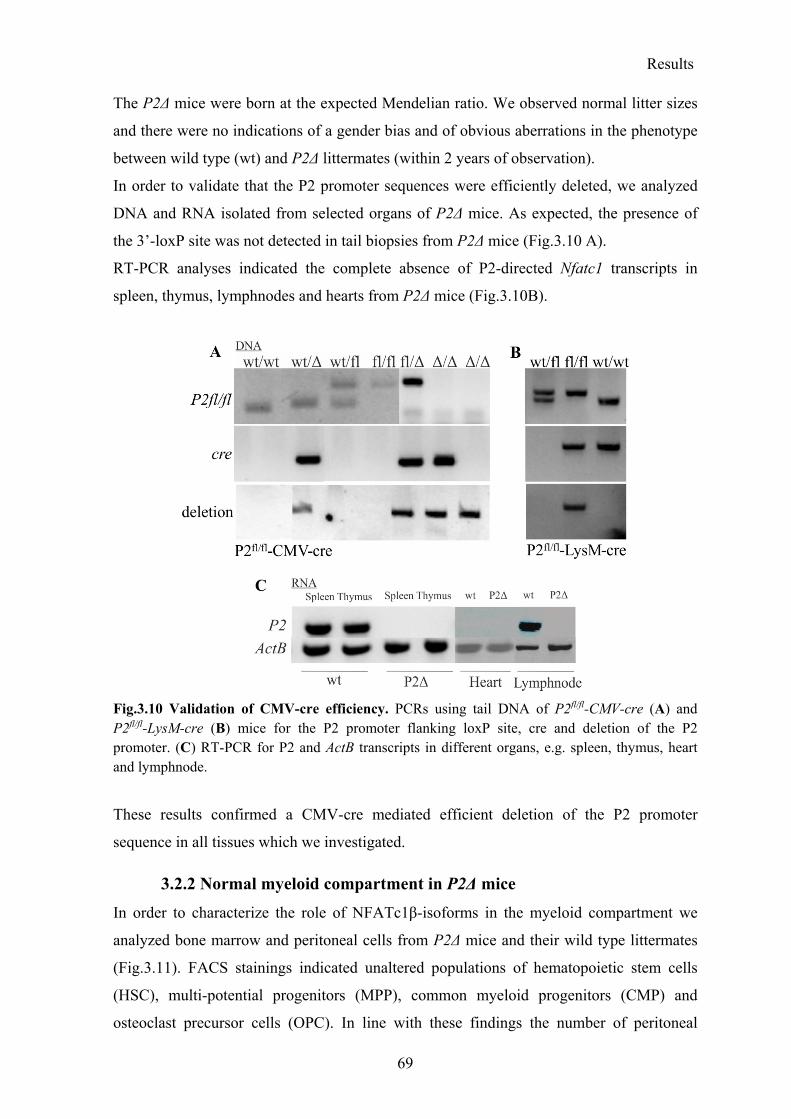
Results
69
The P2Δ mice were born at the expected Mendelian ratio. We observed normal litter sizes
and there were no indications of a gender bias and of obvious aberrations in the phenotype
between wild type (wt) and P2Δ littermates (within 2 years of observation).
In order to validate that the P2 promoter sequences were efficiently deleted, we analyzed
DNA and RNA isolated from selected organs of P2Δ mice. As expected, the presence of
the 3’-loxP site was not detected in tail biopsies from P2Δ mice (Fig.3.10 A).
RT-PCR analyses indicated the complete absence of P2-directed Nfatc1 transcripts in
spleen, thymus, lymphnodes and hearts from P2Δ mice (Fig.3.10B).
Fig.3.10 Validation of CMV-cre efficiency. PCRs using tail DNA of P2fl/fl-CMV-cre (A) and P2fl/fl-LysM-cre (B) mice for the P2 promoter flanking loxP site, cre and deletion of the P2 promoter. (C) RT-PCR for P2 and ActB transcripts in different organs, e.g. spleen, thymus, heart and lymphnode.
These results confirmed a CMV-cre mediated efficient deletion of the P2 promoter
sequence in all tissues which we investigated.
3.2.2 Normal myeloid compartment in P2Δ mice
In order to characterize the role of NFATc1β-isoforms in the myeloid compartment we
analyzed bone marrow and peritoneal cells from P2Δ mice and their wild type littermates
(Fig.3.11). FACS stainings indicated unaltered populations of hematopoietic stem cells
(HSC), multi-potential progenitors (MPP), common myeloid progenitors (CMP) and
osteoclast precursor cells (OPC). In line with these findings the number of peritoneal
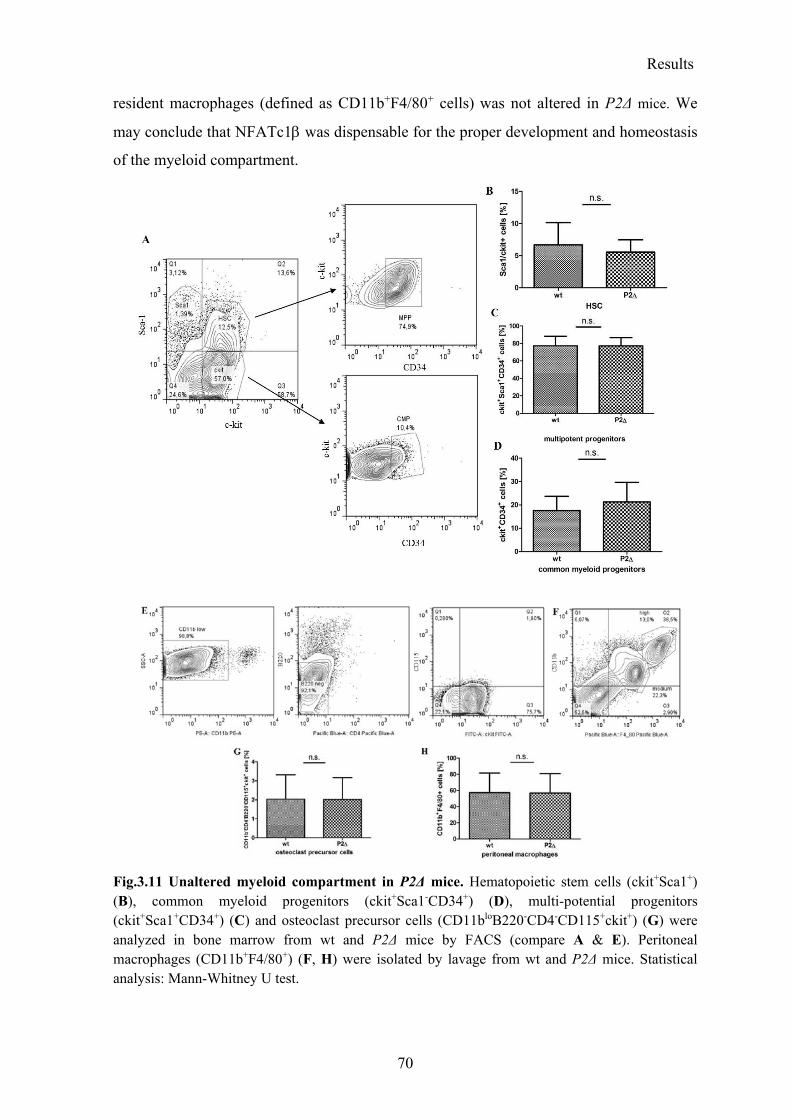
Results
70
resident macrophages (defined as CD11b+F4/80+ cells) was not altered in P2Δ mice. We
may conclude that NFATc1 was dispensable for the proper development and homeostasis
of the myeloid compartment.
Fig.3.11 Unaltered myeloid compartment in P2Δ mice. Hematopoietic stem cells (ckit+Sca1+) (B), common myeloid progenitors (ckit+Sca1-CD34+) (D), multi-potential progenitors (ckit+Sca1+CD34+) (C) and osteoclast precursor cells (CD11bloB220-CD4-CD115+ckit+) (G) were analyzed in bone marrow from wt and P2Δ mice by FACS (compare A & E). Peritoneal macrophages (CD11b+F4/80+) (F, H) were isolated by lavage from wt and P2Δ mice. Statistical analysis: Mann-Whitney U test.
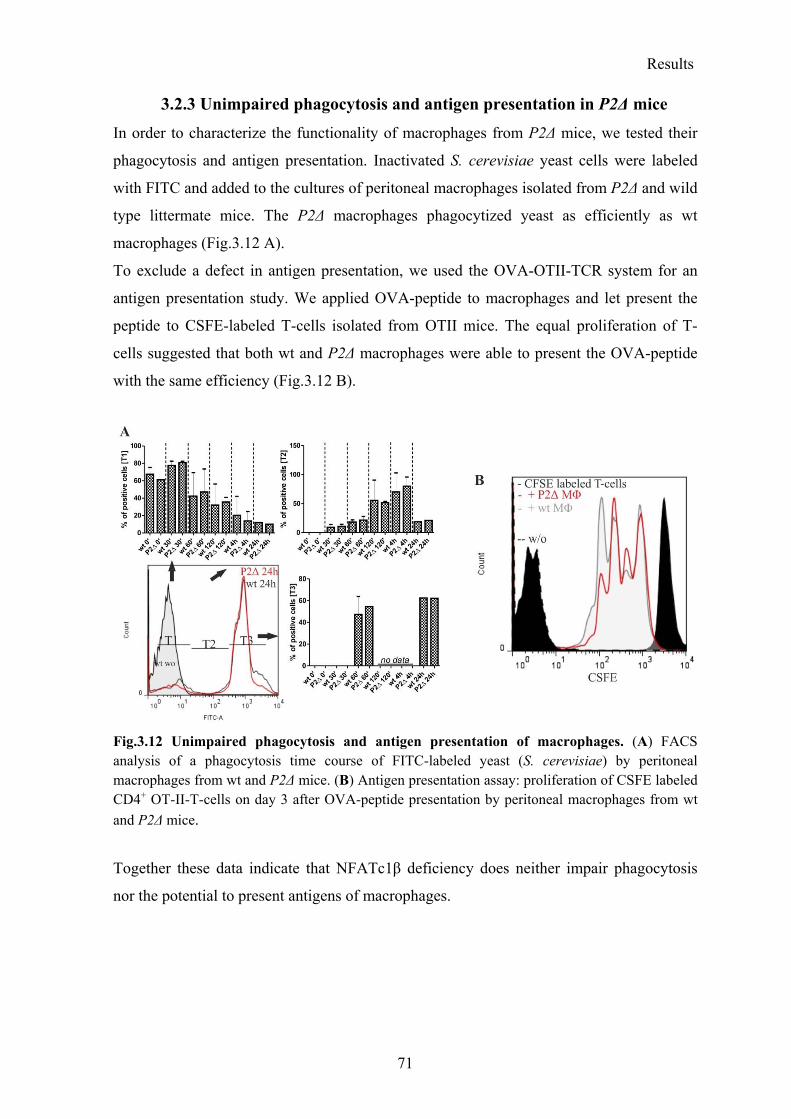
Results
71
3.2.3 Unimpaired phagocytosis and antigen presentation in P2Δ mice
In order to characterize the functionality of macrophages from P2Δ mice, we tested their
phagocytosis and antigen presentation. Inactivated S. cerevisiae yeast cells were labeled
with FITC and added to the cultures of peritoneal macrophages isolated from P2Δ and wild
type littermate mice. The P2Δ macrophages phagocytized yeast as efficiently as wt
macrophages (Fig.3.12 A).
To exclude a defect in antigen presentation, we used the OVA-OTII-TCR system for an
antigen presentation study. We applied OVA-peptide to macrophages and let present the
peptide to CSFE-labeled T-cells isolated from OTII mice. The equal proliferation of T-
cells suggested that both wt and P2Δ macrophages were able to present the OVA-peptide
with the same efficiency (Fig.3.12 B).
Fig.3.12 Unimpaired phagocytosis and antigen presentation of macrophages. (A) FACS analysis of a phagocytosis time course of FITC-labeled yeast (S. cerevisiae) by peritoneal macrophages from wt and P2Δ mice. (B) Antigen presentation assay: proliferation of CSFE labeled CD4+ OT-II-T-cells on day 3 after OVA-peptide presentation by peritoneal macrophages from wt
and P2Δ mice.
Together these data indicate that NFATc1β deficiency does neither impair phagocytosis
nor the potential to present antigens of macrophages.
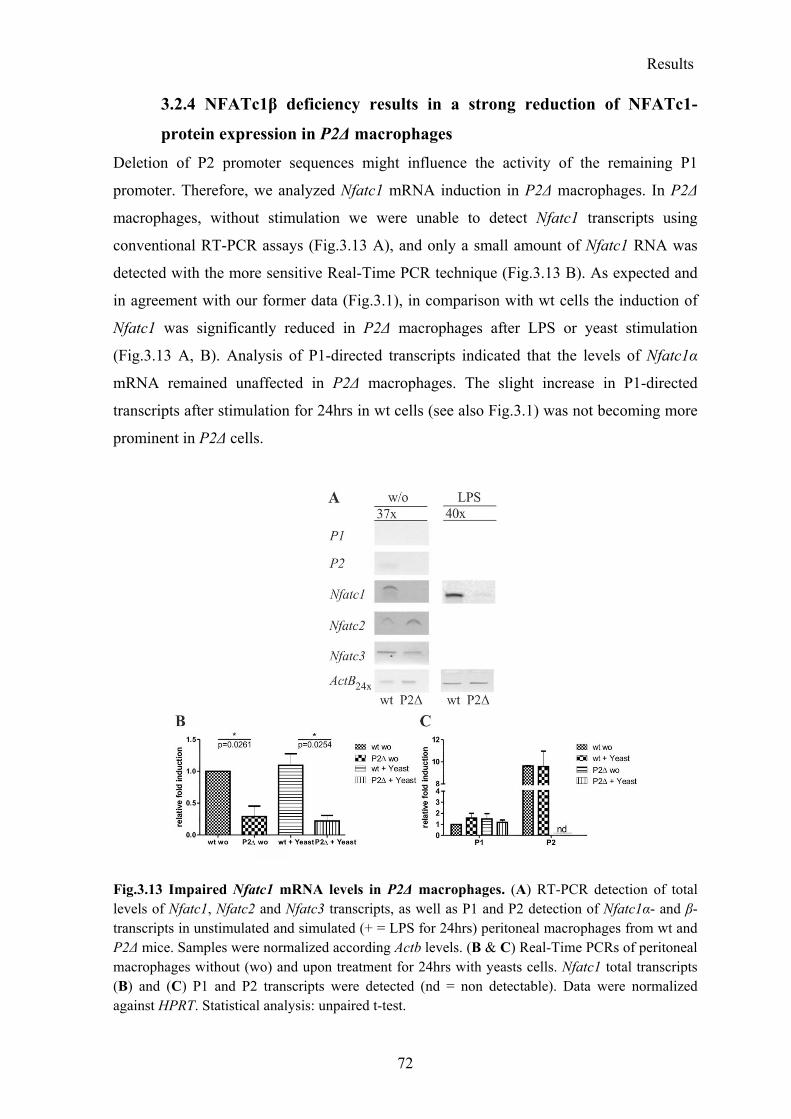
Results
72
3.2.4 NFATc1β deficiency results in a strong reduction of NFATc1-
protein expression in P2Δ macrophages
Deletion of P2 promoter sequences might influence the activity of the remaining P1
promoter. Therefore, we analyzed Nfatc1 mRNA induction in P2Δ macrophages. In P2Δ
macrophages, without stimulation we were unable to detect Nfatc1 transcripts using
conventional RT-PCR assays (Fig.3.13 A), and only a small amount of Nfatc1 RNA was
detected with the more sensitive Real-Time PCR technique (Fig.3.13 B). As expected and
in agreement with our former data (Fig.3.1), in comparison with wt cells the induction of
Nfatc1 was significantly reduced in P2Δ macrophages after LPS or yeast stimulation
(Fig.3.13 A, B). Analysis of P1-directed transcripts indicated that the levels of Nfatc1α
mRNA remained unaffected in P2Δ macrophages. The slight increase in P1-directed
transcripts after stimulation for 24hrs in wt cells (see also Fig.3.1) was not becoming more
prominent in P2Δ cells.
Fig.3.13 Impaired Nfatc1 mRNA levels in P2Δ macrophages. (A) RT-PCR detection of total levels of Nfatc1, Nfatc2 and Nfatc3 transcripts, as well as P1 and P2 detection of Nfatc1α- and β- transcripts in unstimulated and simulated (+ = LPS for 24hrs) peritoneal macrophages from wt and P2Δ mice. Samples were normalized according Actb levels. (B & C) Real-Time PCRs of peritoneal macrophages without (wo) and upon treatment for 24hrs with yeasts cells. Nfatc1 total transcripts (B) and (C) P1 and P2 transcripts were detected (nd = non detectable). Data were normalized against HPRT. Statistical analysis: unpaired t-test.
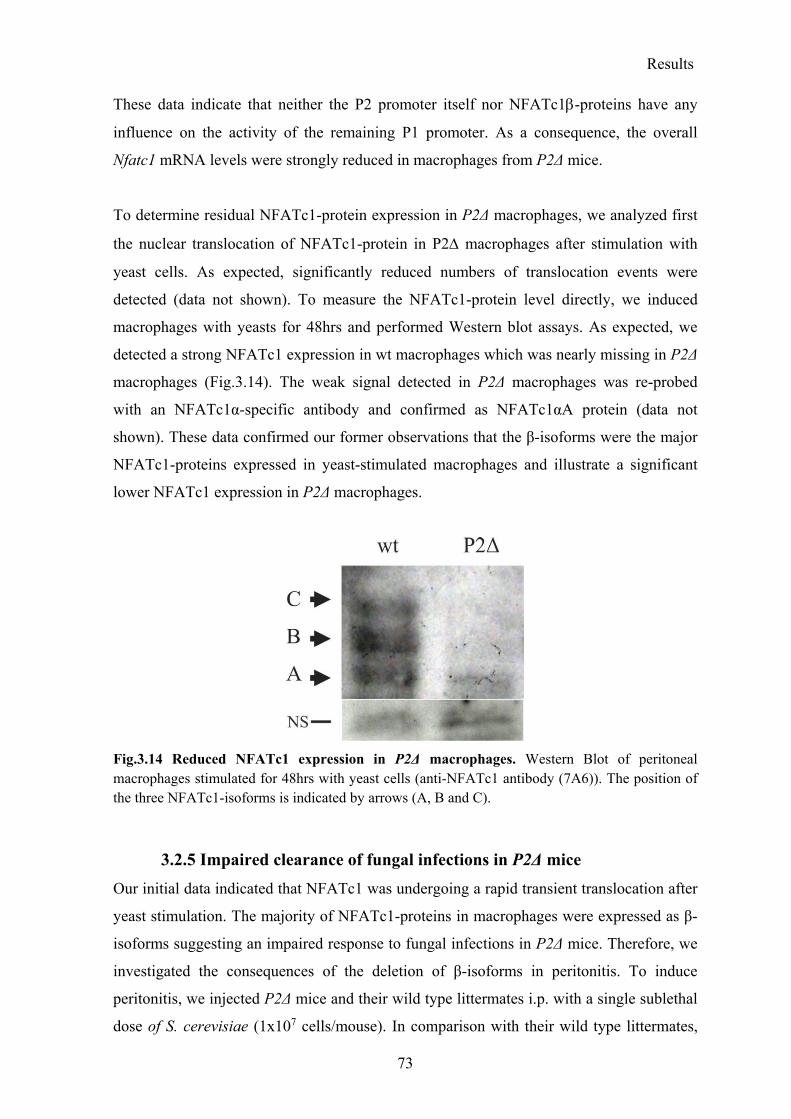
Results
73
These data indicate that neither the P2 promoter itself nor NFATc1-proteins have any
influence on the activity of the remaining P1 promoter. As a consequence, the overall
Nfatc1 mRNA levels were strongly reduced in macrophages from P2Δ mice.
To determine residual NFATc1-protein expression in P2Δ macrophages, we analyzed first
the nuclear translocation of NFATc1-protein in P2 macrophages after stimulation with
yeast cells. As expected, significantly reduced numbers of translocation events were
detected (data not shown). To measure the NFATc1-protein level directly, we induced
macrophages with yeasts for 48hrs and performed Western blot assays. As expected, we
detected a strong NFATc1 expression in wt macrophages which was nearly missing in P2Δ
macrophages (Fig.3.14). The weak signal detected in P2Δ macrophages was re-probed
with an NFATc1α-specific antibody and confirmed as NFATc1αA protein (data not
shown). These data confirmed our former observations that the β-isoforms were the major
NFATc1-proteins expressed in yeast-stimulated macrophages and illustrate a significant
lower NFATc1 expression in P2Δ macrophages.
Fig.3.14 Reduced NFATc1 expression in P2Δ macrophages. Western Blot of peritoneal macrophages stimulated for 48hrs with yeast cells (anti-NFATc1 antibody (7A6)). The position of the three NFATc1-isoforms is indicated by arrows (A, B and C).
3.2.5 Impaired clearance of fungal infections in P2Δ mice
Our initial data indicated that NFATc1 was undergoing a rapid transient translocation after
yeast stimulation. The majority of NFATc1-proteins in macrophages were expressed as β-
isoforms suggesting an impaired response to fungal infections in P2Δ mice. Therefore, we
investigated the consequences of the deletion of β-isoforms in peritonitis. To induce
peritonitis, we injected P2Δ mice and their wild type littermates i.p. with a single sublethal
dose of S. cerevisiae (1x10⁷ cells/mouse). In comparison with their wild type littermates,

Results
74
we detected increased numbers of recovered yeast colony forming units (cfu) from the
peritoneum of P2Δ mice 24hrs after infection (Fig.3.15 A). The difference was slightly less
pronounced after 48hrs (Fig.3.15 B), and all mice were able to clear the infection 96hrs
post-infection, as evidenced by the lack of recovered yeast cfu (data not shown). First
results of P2fl/fl-LysM-cre mice treated with yeast cells for 24hrs (Fig.3.15 C) confirmed
that our observations were specific for the myeloid compartment of P2Δ mice.
These data show that NFATc1β deficiency significantly impairs the clearance of peritoneal
fungal infections.
Fig.3.15 Impaired clearance of peritoneal yeast infections. Colony forming units/per mouse (cfu) of yeasts 24hrs (A) and 48hrs (B) after injection. 24hrs: n=11 and 48hrs: n= 9. Statistical analysis: Mann-Whitney U test. Cfu/mouse from P2fl/flLysM-cre mice (C) after treatment for 24hrs with yeast cells (n=2).
3.2.6 Reduced infiltration of inflammatory monocytes upon fungal
infection in P2Δ mice
Resident macrophages from P2Δ mice did not show any impairment of phagocytotic
functions (Fig.3.12). In order to understand the reason for the delayed clearance of fungal
infections in these mice, we analyzed the composition of peritoneum-infiltrating cells. As
expected, the numbers of resident macrophages remained unchanged (Fig.3.16 A).
However we observed significantly less infiltrating inflammatory monocytes
(Gr1hiCD11b+F4/80+) in the peritoneum of P2Δ mice 24hrs after infection (Fig.3.16 B),
without any changes in the population of infiltrating neutrophils (F4/80loCD11b+Gr1+).

Results
75
Fig.3.16 Reduced numbers of infiltrating inflammatory monocytes during peritoneal fungal infection of P2Δ mice. The composition of peritoneal cells was analyzed by FACS 24hrs after S. cerevisiae infection. The cells were pre-gated according their Gr1 expression to identify resident macrophages (Gr1loCD11b+F4/80+) (A), infiltrating inflammatory monocytes (Gr1hiCD11b+F4/80+) (B) and infiltrating neutrophils (F4/80loCD11b+Gr1+) (C). n=8-9. Statistical analysis: Mann-Whitney U test.
These data suggest that the delayed clearance of peritoneal yeast infections in P2Δ mice
was likely due to a decreased number of infiltrating inflammatory monocytes.
3.2.7 Decreased Ccl2 expression in resident P2Δ macrophages
The observed decreased amount of infiltrating inflammatory monocytes suggested a partial
alteration in expression of chemotactic chemokines by prMΦ in P2Δ mice. Ccl2 (also
known as MCP-1) is a major chemokine secreted by activated resident macrophages,
which is responsible for the recruitment of inflammatory monocytes, which are Ccr2+.
Indeed, the levels of Ccl2-protein in the peritoneal cavity of P2Δ mice were significantly
lower in comparison with those of wild type littermates (Fig.3.18 A). As expected,
peritoneal cells in wild type and P2Δ mice expressed similar basal levels of Ccl2 mRNA
(Fig.3.18 B), but the induction of Ccl2 expression was strongly reduced in peritoneal cells
of P2Δ mice 1hr after yeast injection, and in CD11b+ cells 24hrs upon injection (Fig.3.18
C, D, summarized in E).
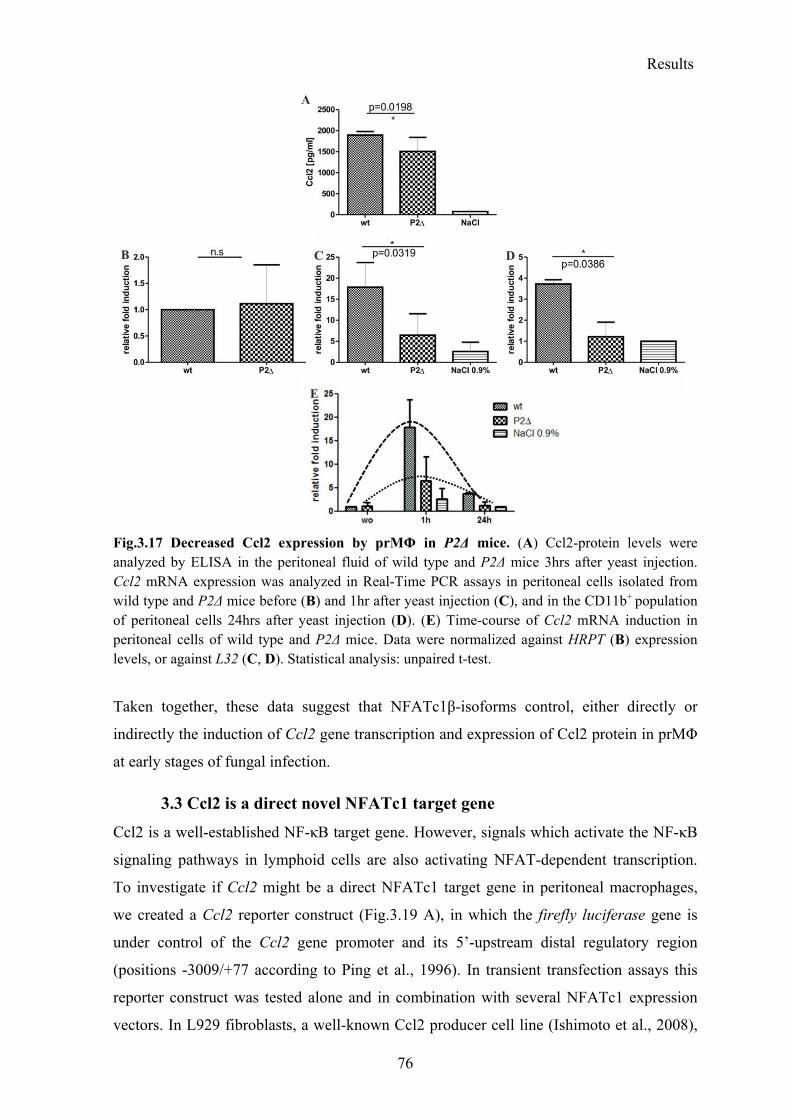
Results
76
Fig.3.17 Decreased Ccl2 expression by prMΦ in P2Δ mice. (A) Ccl2-protein levels were analyzed by ELISA in the peritoneal fluid of wild type and P2Δ mice 3hrs after yeast injection. Ccl2 mRNA expression was analyzed in Real-Time PCR assays in peritoneal cells isolated from wild type and P2Δ mice before (B) and 1hr after yeast injection (C), and in the CD11b+ population of peritoneal cells 24hrs after yeast injection (D). (E) Time-course of Ccl2 mRNA induction in peritoneal cells of wild type and P2Δ mice. Data were normalized against HRPT (B) expression levels, or against L32 (C, D). Statistical analysis: unpaired t-test.
Taken together, these data suggest that NFATc1β-isoforms control, either directly or
indirectly the induction of Ccl2 gene transcription and expression of Ccl2 protein in prMΦ
at early stages of fungal infection.
3.3 Ccl2 is a direct novel NFATc1 target gene
Ccl2 is a well-established NF-κB target gene. However, signals which activate the NF-κB
signaling pathways in lymphoid cells are also activating NFAT-dependent transcription.
To investigate if Ccl2 might be a direct NFATc1 target gene in peritoneal macrophages,
we created a Ccl2 reporter construct (Fig.3.19 A), in which the firefly luciferase gene is
under control of the Ccl2 gene promoter and its 5’-upstream distal regulatory region
(positions -3009/+77 according to Ping et al., 1996). In transient transfection assays this
reporter construct was tested alone and in combination with several NFATc1 expression
vectors. In L929 fibroblasts, a well-known Ccl2 producer cell line (Ishimoto et al., 2008),
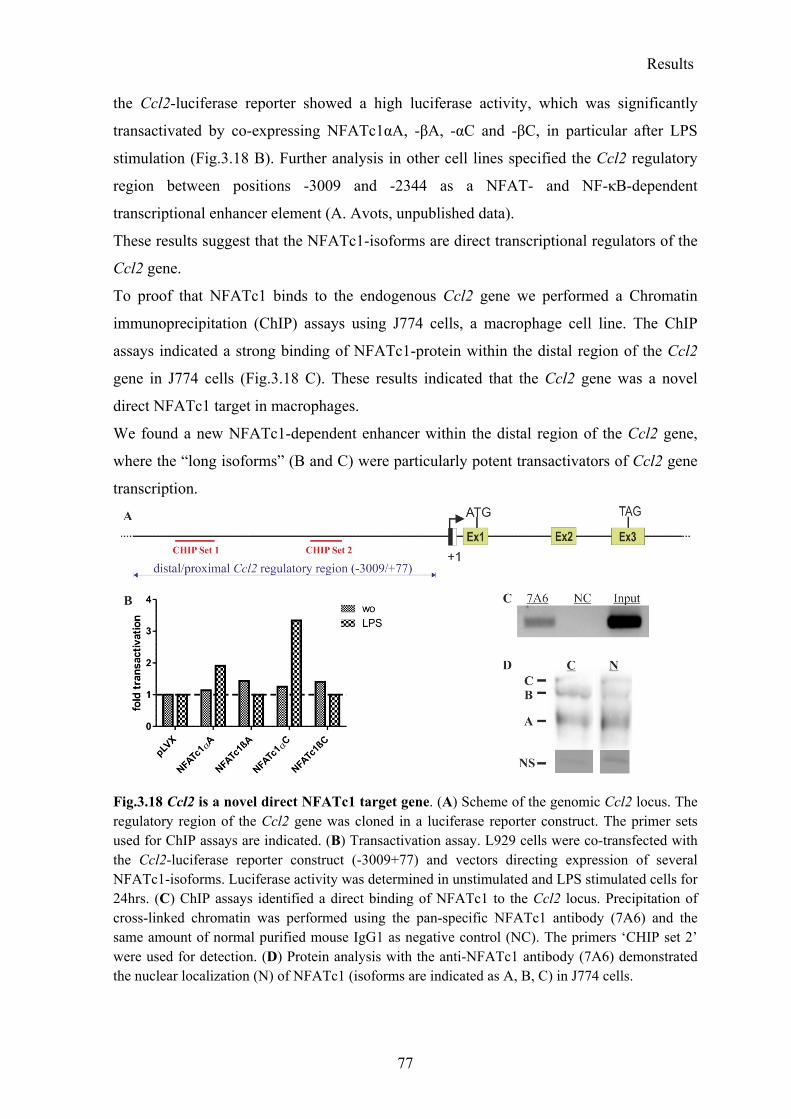
Results
77
the Ccl2-luciferase reporter showed a high luciferase activity, which was significantly
transactivated by co-expressing NFATc1αA, -βA, -αC and -βC, in particular after LPS
stimulation (Fig.3.18 B). Further analysis in other cell lines specified the Ccl2 regulatory
region between positions -3009 and -2344 as a NFAT- and NF-κB-dependent
transcriptional enhancer element (A. Avots, unpublished data).
These results suggest that the NFATc1-isoforms are direct transcriptional regulators of the
Ccl2 gene.
To proof that NFATc1 binds to the endogenous Ccl2 gene we performed a Chromatin
immunoprecipitation (ChIP) assays using J774 cells, a macrophage cell line. The ChIP
assays indicated a strong binding of NFATc1-protein within the distal region of the Ccl2
gene in J774 cells (Fig.3.18 C). These results indicated that the Ccl2 gene was a novel
direct NFATc1 target in macrophages.
We found a new NFATc1-dependent enhancer within the distal region of the Ccl2 gene,
where the “long isoforms” (B and C) were particularly potent transactivators of Ccl2 gene
transcription.
Fig.3.18 Ccl2 is a novel direct NFATc1 target gene. (A) Scheme of the genomic Ccl2 locus. The regulatory region of the Ccl2 gene was cloned in a luciferase reporter construct. The primer sets used for ChIP assays are indicated. (B) Transactivation assay. L929 cells were co-transfected with the Ccl2-luciferase reporter construct (-3009+77) and vectors directing expression of several NFATc1-isoforms. Luciferase activity was determined in unstimulated and LPS stimulated cells for 24hrs. (C) ChIP assays identified a direct binding of NFATc1 to the Ccl2 locus. Precipitation of cross-linked chromatin was performed using the pan-specific NFATc1 antibody (7A6) and the same amount of normal purified mouse IgG1 as negative control (NC). The primers ‘CHIP set 2’ were used for detection. (D) Protein analysis with the anti-NFATc1 antibody (7A6) demonstrated the nuclear localization (N) of NFATc1 (isoforms are indicated as A, B, C) in J774 cells.
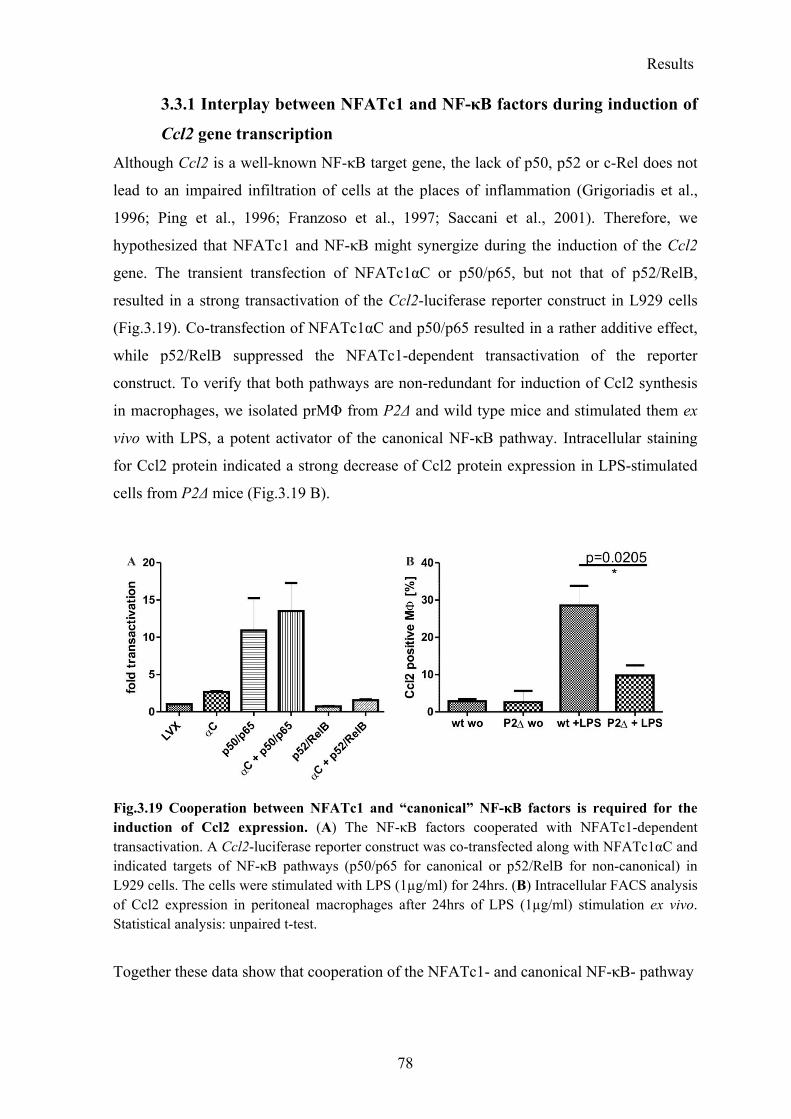
Results
78
3.3.1 Interplay between NFATc1 and NF-κB factors during induction of
Ccl2 gene transcription
Although Ccl2 is a well-known NF-κB target gene, the lack of p50, p52 or c-Rel does not
lead to an impaired infiltration of cells at the places of inflammation (Grigoriadis et al.,
1996; Ping et al., 1996; Franzoso et al., 1997; Saccani et al., 2001). Therefore, we
hypothesized that NFATc1 and NF-κB might synergize during the induction of the Ccl2
gene. The transient transfection of NFATc1αC or p50/p65, but not that of p52/RelB,
resulted in a strong transactivation of the Ccl2-luciferase reporter construct in L929 cells
(Fig.3.19). Co-transfection of NFATc1αC and p50/p65 resulted in a rather additive effect,
while p52/RelB suppressed the NFATc1-dependent transactivation of the reporter
construct. To verify that both pathways are non-redundant for induction of Ccl2 synthesis
in macrophages, we isolated prMΦ from P2Δ and wild type mice and stimulated them ex
vivo with LPS, a potent activator of the canonical NF-κB pathway. Intracellular staining
for Ccl2 protein indicated a strong decrease of Ccl2 protein expression in LPS-stimulated
cells from P2Δ mice (Fig.3.19 B).
Fig.3.19 Cooperation between NFATc1 and “canonical” NF-κB factors is required for the induction of Ccl2 expression. (A) The NF-κB factors cooperated with NFATc1-dependent transactivation. A Ccl2-luciferase reporter construct was co-transfected along with NFATc1αC and indicated targets of NF-κB pathways (p50/p65 for canonical or p52/RelB for non-canonical) in L929 cells. The cells were stimulated with LPS (1µg/ml) for 24hrs. (B) Intracellular FACS analysis of Ccl2 expression in peritoneal macrophages after 24hrs of LPS (1µg/ml) stimulation ex vivo. Statistical analysis: unpaired t-test.
Together these data show that cooperation of the NFATc1- and canonical NF-κB- pathway

Results
79
3.4 Characterization of the lymphoid compartment in P2Δ mice
3.4.1 Unimpaired lymphoid compartments in P2Δ mice specified
NFATc1α-isoforms as critical regulators of B1a cell development
Immune-receptor triggering induces a strong activation of the Nfatc1 P1 promoter and
results in a high expression level of NFATc1α proteins. However, expression of
NFATc1β-isoforms is detectable in lymphoid cells, before and after activation. In order to
reveal a putative role for NFATc1β-isoforms, we investigated the lymphoid compartment
of P2Δ mice. Overall numbers of CD4+, CD8+ and B220+ cells in spleens of unchallenged
wild type and P2Δ mice (Fig.3.20 A, B) did not reveal any abnormalities, in line with our
former analysis of the bone marrow progenitor cell populations (see Fig.3.11 B).
These data suggests that expression of NFATc1β-isoforms is dispensable for normal
homeostasis of the adaptive immune system.
NFATc1 expression is critically required for development of peritoneal B1a cells (Berland
and Wortis, 2003; Bhattacharyya et al., 2011). However, the numbers of B1a cells were not
impaired in P2Δ mice (Fig.3.20 C).
Fig.3.20 Unimpaired cell compartments in P2Δ mice. FACS analysis of lymphoid populations. Splenic CD4+ and CD8+ T-cells (A), B220+ B-cells (B) and peritoneal B1a cells (B220+CD23-
CD5+CD11b+) (C) from wild type and P2Δ littermates. Statistical analysis: Mann-Whitney U test.
This suggests that the P1 promoter-driven expression of NFATc1α-isoforms is critical for
the proper development of B1a cells.
3.4.2 Expression of β-isoforms is irrelevant for the major functions of
NFATc1 in T- and B-cells
In resting lymphocytes the majority of NFATc1 protein is expressed as β-isoforms, which
might play a role for maintaining the “resting state” of lymphocytes. However, our FACS
analysis of naïve splenic T- and/or B-cells isolated from P2Δ mice did not reveal any
significant up-regulation of lymphocyte activation markers (Fig.3.21 A) suggesting that the

Results
80
expression of NFATc1β is not required for the maintenance of the resting state of
lymphoid cells.
Prevention of activation-induced cell death (AICD) and support for clonal expansion are
the major functions of NFATc1 in activated T- and B-cells, supported by a massive
induction of the short NFATc1αA-protein.
To reveal the role of β-isoforms in these processes we analyzed the proliferation and AICD
of T- and B-cells from P2Δ mice (Fig.3.21). Neither the proliferation nor the AICD were
affected in P2Δ cells, stimulated with antibodies directed against CD3 and CD28 (for T-
cells) or against IgM (for B-cells).
Fig.3.21 Unchanged functionality of P2Δ T- and B-cells. (A) Freshly prepared naïve T- and B- cells from P2Δ mice were stained with antibodies against the activation markers CD62L and CD25 (for T-cells) and CD69 (for B-cells). (B) Proliferation of CFSE labeled CD4+ T-cells stimulated with anti-CD3/ anti-CD28 for 72hrs. (C) AICD of CD4+ T-cells stimulated for four days with anti-CD3/ anti-CD28 and restimulated on day 4 (anti-CD3/ anti-CD28) for three additional days were analyzed by FACS after Annexin V and PI staining. (D) AICD of B220+ B-cells stimulated for two days with anti-IgM and re-stimulated on d2.
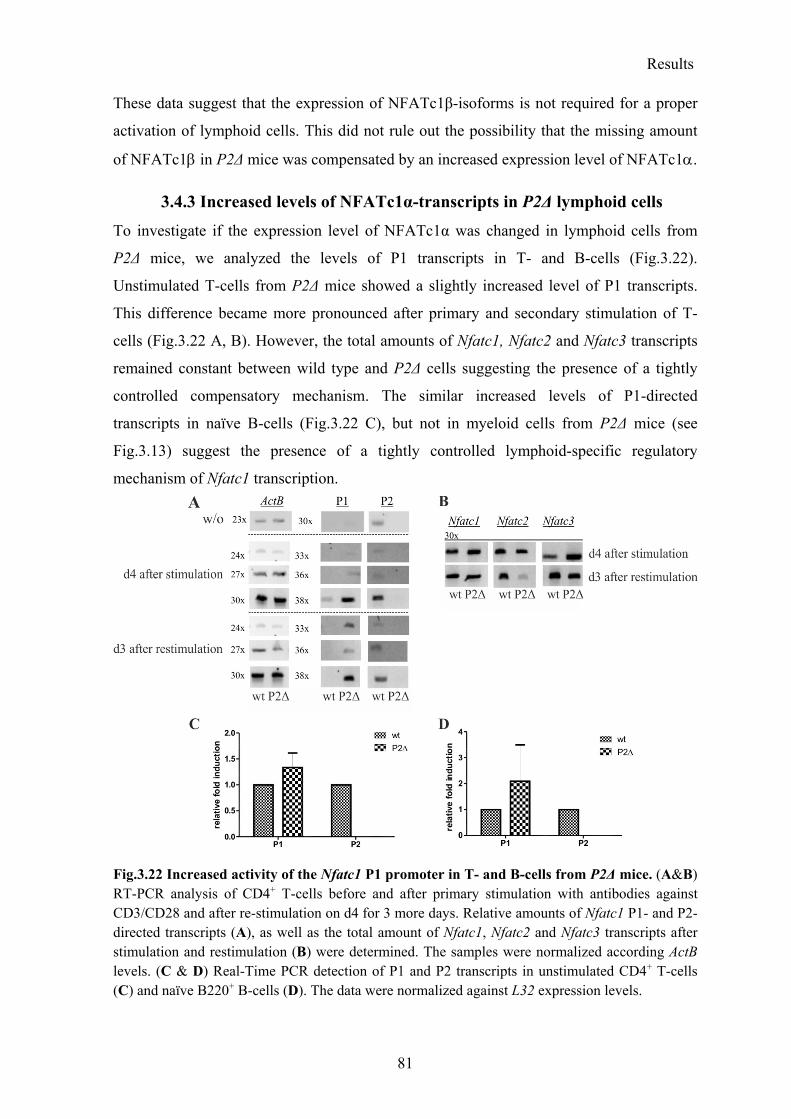
Results
81
These data suggest that the expression of NFATc1β-isoforms is not required for a proper
activation of lymphoid cells. This did not rule out the possibility that the missing amount
of NFATc1 in P2Δ mice was compensated by an increased expression level of NFATc1.
3.4.3 Increased levels of NFATc1α-transcripts in P2Δ lymphoid cells
To investigate if the expression level of NFATc1α was changed in lymphoid cells from
P2Δ mice, we analyzed the levels of P1 transcripts in T- and B-cells (Fig.3.22).
Unstimulated T-cells from P2Δ mice showed a slightly increased level of P1 transcripts.
This difference became more pronounced after primary and secondary stimulation of T-
cells (Fig.3.22 A, B). However, the total amounts of Nfatc1, Nfatc2 and Nfatc3 transcripts
remained constant between wild type and P2Δ cells suggesting the presence of a tightly
controlled compensatory mechanism. The similar increased levels of P1-directed
transcripts in naïve B-cells (Fig.3.22 C), but not in myeloid cells from P2Δ mice (see
Fig.3.13) suggest the presence of a tightly controlled lymphoid-specific regulatory
mechanism of Nfatc1 transcription.
Fig.3.22 Increased activity of the Nfatc1 P1 promoter in T- and B-cells from P2Δ mice. (A&B) RT-PCR analysis of CD4+ T-cells before and after primary stimulation with antibodies against CD3/CD28 and after re-stimulation on d4 for 3 more days. Relative amounts of Nfatc1 P1- and P2-directed transcripts (A), as well as the total amount of Nfatc1, Nfatc2 and Nfatc3 transcripts after stimulation and restimulation (B) were determined. The samples were normalized according ActB levels. (C & D) Real-Time PCR detection of P1 and P2 transcripts in unstimulated CD4+ T-cells (C) and naïve B220+ B-cells (D). The data were normalized against L32 expression levels.

Results
82
We concluded that NFATc1β deficiency is negligible for the cells of the adaptive immune
system due to a compensatory increased activity of the P1 promoter.
In conclusion, our data demonstrate that (1.) expression of NFATc1β is required for a
proper immune response of resident macrophages to peritoneal fungal infections, (2.) Ccl2
is a novel NFATc1 target gene cooperatively regulated through the NFAT- and canonical
NF-κB- pathways, (3.) expression of NFATc1β-isoforms is irrelevant for the homeostasis
and activation of adaptive immune system cells, in which deficiency of β-isoform
expression was compensated by increased expression of NFATc1α and, finally (4.)
NFATc1α-, but not β-isoforms are required for a normal development of peritoneal B1a
cells.
3.5 Generation of the Nfatc1-dsRed knock-in reporter mouse
To investigate the expression of NFATc1 in vivo at tissue and cellular level we generated a
knock-in reporter mouse line by fusing the monomeric dsRed sequence to the first common
exon 3 present in all Nfatc1-isoforms.
The construction of the targeting vector is summarized in Fig.3.23. The coding sequence of
the monomeric dsRed protein was cloned in front of two polyA sites from the SV40 virus
(“dsRed-polyA” fragment). Two regions of homology were isolated from the BAC
bMQ222j17, as Bsu15I fragments and cloned into the pBSKSII-vector. The “dsRed-
polyA” fragment was cloned ‘in frame’ with the exon 3 sequence of Nfatc1 within the ‘the
short homolog arm’ (4.2kb) bearing pBS4.2-1 construct. For a working fusion in the
Nfatc1 frame the sequence of seven C-terminal amino acids of the dsRed were removed.
The dsRed was fused starting with the sequence of amino acid seven (coding for Isoleucine
(I)) behind the 74th amino acid sequence (coding for Serine (S)) of exon 3. The p4.2-1 with
the exon3-dsRed fusion and the “long arm” (8.1kb) bearing p8.1 vector were used to clone
the “short arm-exon 3-dsRed-fusion” and the “long arm” into the pKSTKNeoFloxP vector.
The pKSTKNeoFloxP contained a thymidine kinase (TK) for negative selection and a
floxed neomycin cassette for positive selection. The “short arm-exon 3-dsRed fusion” was
inserted between the TK and the neomycin cassette and the “long arm” behind the
neomycin cassette (Fig.3.23). The two flanking loxP sites enable a later removal of the
neomycin cassette by cre recombinase.
The linearized (SacII) vector was transfected into v6.5 (B/6x129/sv) and JM8 (B6/N)
embryonic stem cells (Auerbach et al., 2000; Pettitt et al., 2009).

Results
83
After selection, 500 individual G418-resistant clones were isolated from each ESC line.
Their DNA was isolated and, after digestion with BamHI, analyzed for the presence of
homologous recombination using Southern Blots (Fig.3.24 B). The 5’ probe should detect
a 12kb wild type (wt) fragment and a 9kb fragment, if a right integration occurred. From
each cell line one positive clone was isolated and expanded. The presence of a correct
single integration event was shown using 5’-, 3’-probes and a probe specific for the
neomycin resistance gene to exclude multiple integration events. The expected 5.5kb
fragment showed up in all lanes, because the detected fragment was part of the targeting
vector (Fig.3.24 C III). There were no multiple integrations, because no longer fragments
were detected. 3’ integration was verified by SdaI (SbfI) digestion. The expected sizes for
the wt allele and the targeted allele were 22.6kb and 18.2kb (Fig.3.24 C II), respectively.
Fig.3.23 Targeting strategy. The short and long arm (grey areas indicate the regions of homology on the wild type allele (first line) and in the targeting vector (second line)) ensure a proper homologous recombination by flanking the fused exon 3 (green) to the monomeric dsRed sequence (red), followed by two poly A sequences and the neomycin resistance under the control of a PGK promoter (neo-PGK, yellow). The neomycin resistance cassette is flanked by two loxP sites (grey triangles), which allow a later removal from the targeted allele (third line). A thymidine kinase (TK) is part of the vector to enable negative selection. The fused sequence of exon 3 (green) and dsRed (red) is indicated below with the amino acids and their positions in the former NFATc1- and dsRed-proteins.
DsRed-m (pA )SV40 2x neo-PGKTK
P1 P2
1 kb
CAG ACG TCC ATC AAG GAGQ T S I K E
72 73 74 7 8 9
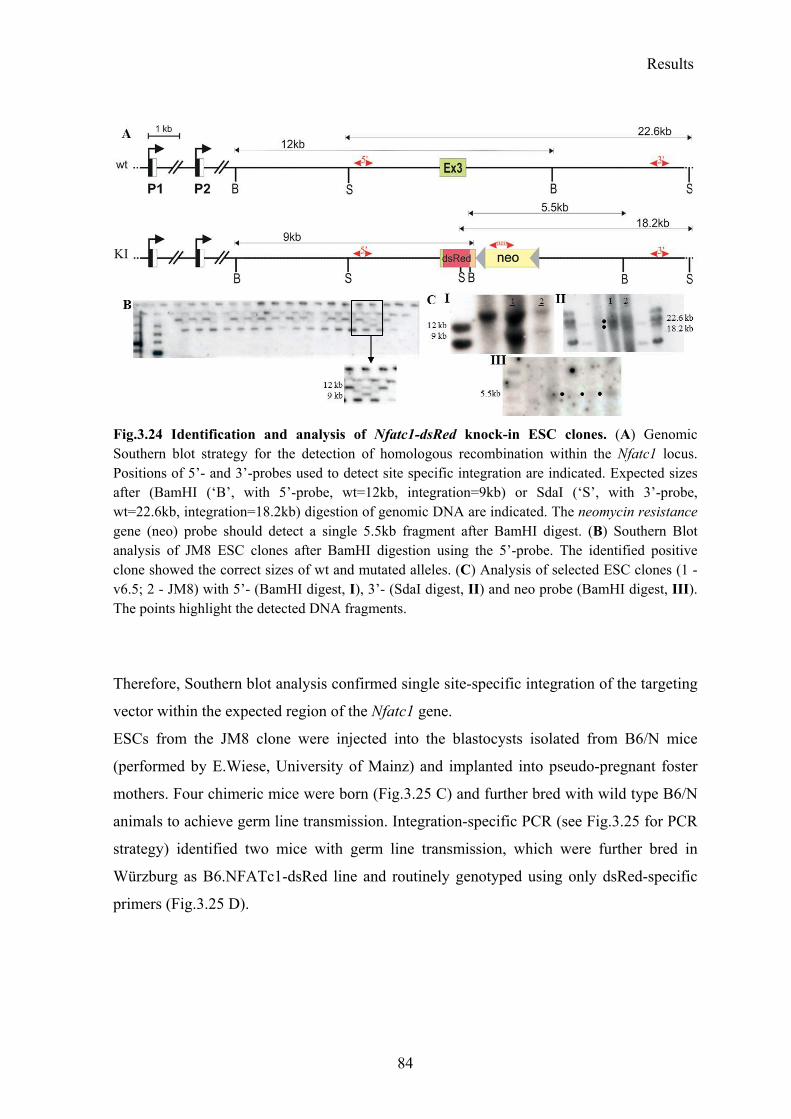
Results
84
Fig.3.24 Identification and analysis of Nfatc1-dsRed knock-in ESC clones. (A) Genomic Southern blot strategy for the detection of homologous recombination within the Nfatc1 locus. Positions of 5’- and 3’-probes used to detect site specific integration are indicated. Expected sizes after (BamHI (‘B’, with 5’-probe, wt=12kb, integration=9kb) or SdaI (‘S’, with 3’-probe, wt=22.6kb, integration=18.2kb) digestion of genomic DNA are indicated. The neomycin resistance gene (neo) probe should detect a single 5.5kb fragment after BamHI digest. (B) Southern Blot analysis of JM8 ESC clones after BamHI digestion using the 5’-probe. The identified positive clone showed the correct sizes of wt and mutated alleles. (C) Analysis of selected ESC clones (1 - v6.5; 2 - JM8) with 5’- (BamHI digest, I), 3’- (SdaI digest, II) and neo probe (BamHI digest, III). The points highlight the detected DNA fragments.
Therefore, Southern blot analysis confirmed single site-specific integration of the targeting
vector within the expected region of the Nfatc1 gene.
ESCs from the JM8 clone were injected into the blastocysts isolated from B6/N mice
(performed by E.Wiese, University of Mainz) and implanted into pseudo-pregnant foster
mothers. Four chimeric mice were born (Fig.3.25 C) and further bred with wild type B6/N
animals to achieve germ line transmission. Integration-specific PCR (see Fig.3.25 for PCR
strategy) identified two mice with germ line transmission, which were further bred in
Würzburg as B6.NFATc1-dsRed line and routinely genotyped using only dsRed-specific
primers (Fig.3.25 D).
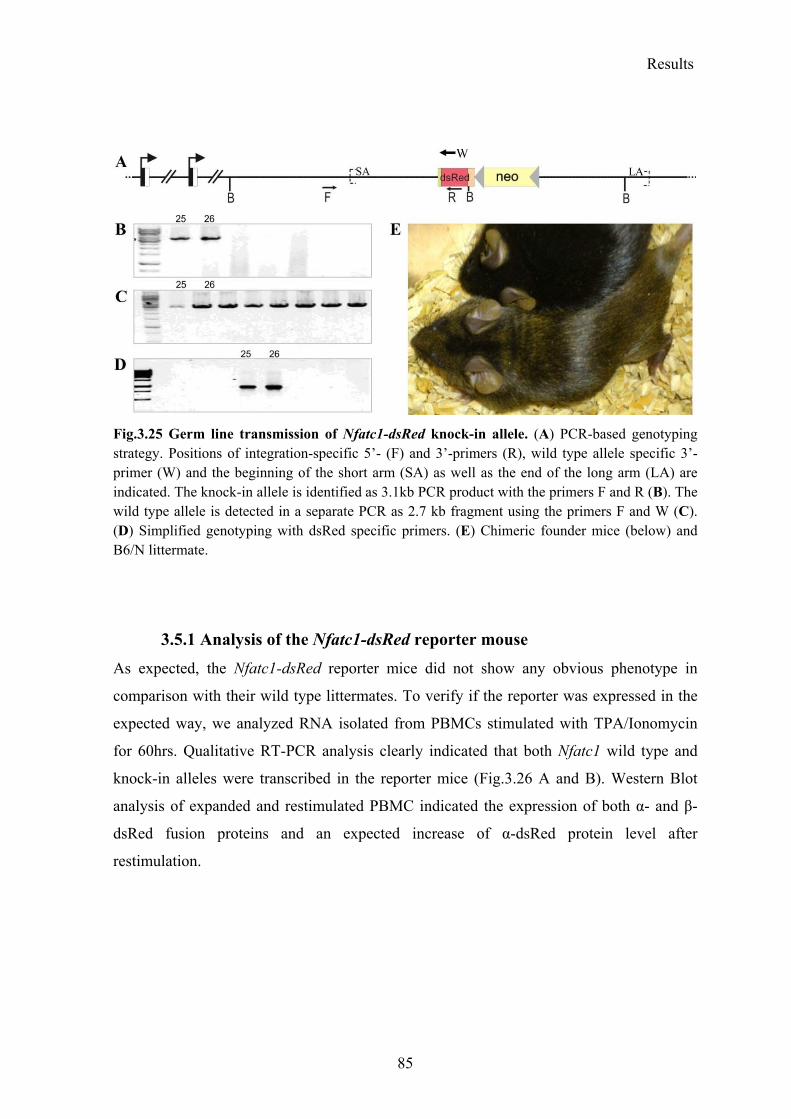
Results
85
Fig.3.25 Germ line transmission of Nfatc1-dsRed knock-in allele. (A) PCR-based genotyping strategy. Positions of integration-specific 5’- (F) and 3’-primers (R), wild type allele specific 3’-primer (W) and the beginning of the short arm (SA) as well as the end of the long arm (LA) are indicated. The knock-in allele is identified as 3.1kb PCR product with the primers F and R (B). The wild type allele is detected in a separate PCR as 2.7 kb fragment using the primers F and W (C). (D) Simplified genotyping with dsRed specific primers. (E) Chimeric founder mice (below) and B6/N littermate.
3.5.1 Analysis of the Nfatc1-dsRed reporter mouse
As expected, the Nfatc1-dsRed reporter mice did not show any obvious phenotype in
comparison with their wild type littermates. To verify if the reporter was expressed in the
expected way, we analyzed RNA isolated from PBMCs stimulated with TPA/Ionomycin
for 60hrs. Qualitative RT-PCR analysis clearly indicated that both Nfatc1 wild type and
knock-in alleles were transcribed in the reporter mice (Fig.3.26 A and B). Western Blot
analysis of expanded and restimulated PBMC indicated the expression of both α- and β-
dsRed fusion proteins and an expected increase of α-dsRed protein level after
restimulation.
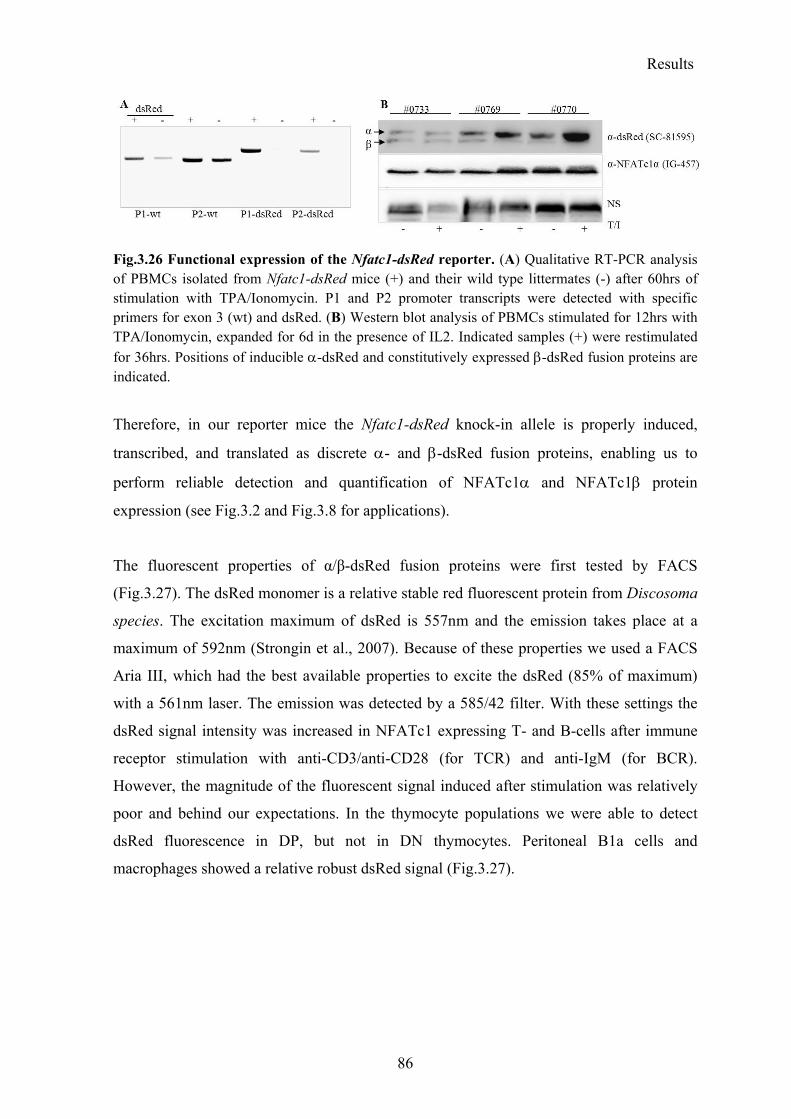
Results
86
Fig.3.26 Functional expression of the Nfatc1-dsRed reporter. (A) Qualitative RT-PCR analysis of PBMCs isolated from Nfatc1-dsRed mice (+) and their wild type littermates (-) after 60hrs of stimulation with TPA/Ionomycin. P1 and P2 promoter transcripts were detected with specific primers for exon 3 (wt) and dsRed. (B) Western blot analysis of PBMCs stimulated for 12hrs with TPA/Ionomycin, expanded for 6d in the presence of IL2. Indicated samples (+) were restimulated
for 36hrs. Positions of inducible -dsRed and constitutively expressed -dsRed fusion proteins are indicated.
Therefore, in our reporter mice the Nfatc1-dsRed knock-in allele is properly induced,
transcribed, and translated as discrete - and -dsRed fusion proteins, enabling us to
perform reliable detection and quantification of NFATc1 and NFATc1 protein
expression (see Fig.3.2 and Fig.3.8 for applications).
The fluorescent properties of α/β-dsRed fusion proteins were first tested by FACS
(Fig.3.27). The dsRed monomer is a relative stable red fluorescent protein from Discosoma
species. The excitation maximum of dsRed is 557nm and the emission takes place at a
maximum of 592nm (Strongin et al., 2007). Because of these properties we used a FACS
Aria III, which had the best available properties to excite the dsRed (85% of maximum)
with a 561nm laser. The emission was detected by a 585/42 filter. With these settings the
dsRed signal intensity was increased in NFATc1 expressing T- and B-cells after immune
receptor stimulation with anti-CD3/anti-CD28 (for TCR) and anti-IgM (for BCR).
However, the magnitude of the fluorescent signal induced after stimulation was relatively
poor and behind our expectations. In the thymocyte populations we were able to detect
dsRed fluorescence in DP, but not in DN thymocytes. Peritoneal B1a cells and
macrophages showed a relative robust dsRed signal (Fig.3.27).
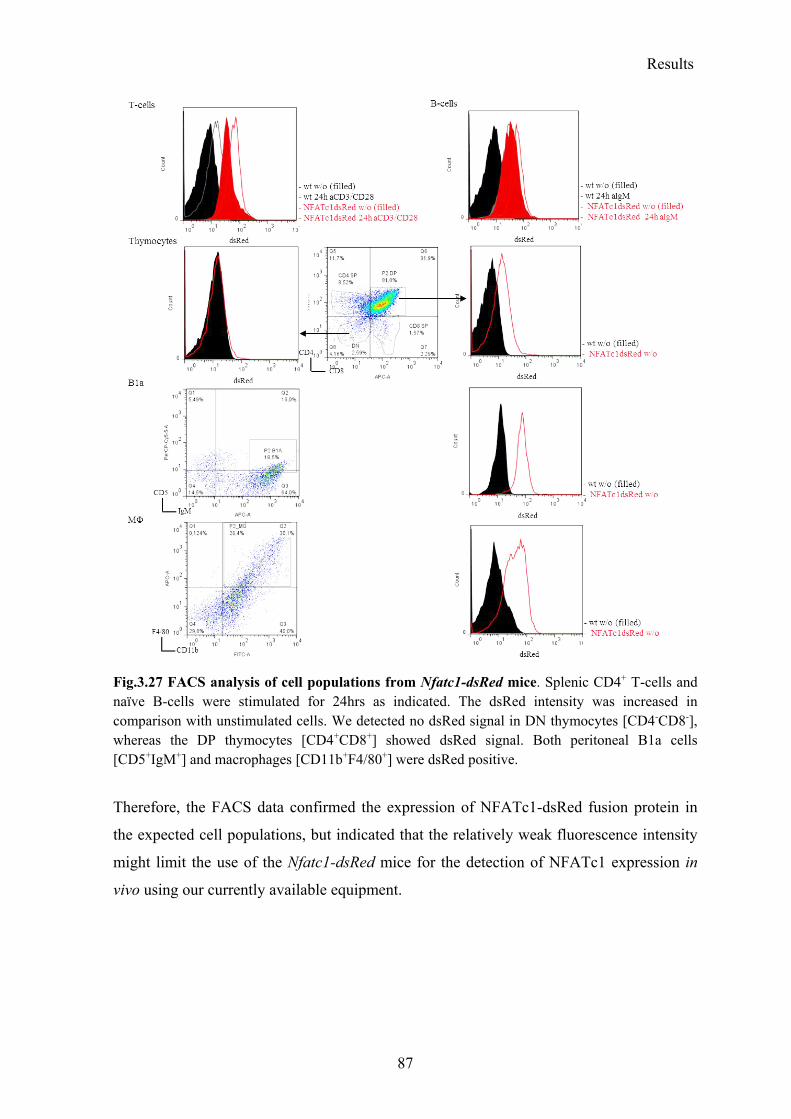
Results
87
Fig.3.27 FACS analysis of cell populations from Nfatc1-dsRed mice. Splenic CD4+ T-cells and naïve B-cells were stimulated for 24hrs as indicated. The dsRed intensity was increased in comparison with unstimulated cells. We detected no dsRed signal in DN thymocytes [CD4-CD8-], whereas the DP thymocytes [CD4+CD8+] showed dsRed signal. Both peritoneal B1a cells [CD5+IgM+] and macrophages [CD11b+F4/80+] were dsRed positive.
Therefore, the FACS data confirmed the expression of NFATc1-dsRed fusion protein in
the expected cell populations, but indicated that the relatively weak fluorescence intensity
might limit the use of the Nfatc1-dsRed mice for the detection of NFATc1 expression in
vivo using our currently available equipment.
Discussion
88
4 Discussion
4.1 NFATc1 in resident macrophages during fungal infection
Fungal infections leading to peritonitis are commonly occurring in human. Peritonitis is
frequently caused by Candida albicans. However, in seldom cases opportunistic infections
with Saccharomyces cerevisiae (Snyder, 1992; Munoz et al., 2005) were also described.
Furthermore, among others S. cerevisiae antigens are used to diagnose Crohn’s disease
(Buckland, 2005). Peritoneal macrophages account for the major group of phagocytic cells
in peritoneum (Ray and Dittel, 2010) and represent resident guardians which express a
broad range of surface pattern recognition receptors (PRR) to recognize invaders (Taylor et
al., 2005; Yona et al., 2013). S. cerevisiae and C. albicans are detected mainly by the
Dectin-1 receptor which triggers the activation of NFAT- and NF-κB- pathways (Zanoni
and Granucci, 2012).
4.1.1 Yeast induction results in a rapid nuclear translocation of NFATc1,
but not of NFATc2 and NFATc3
We show here that NFATc1 is involved in antifungal responses of resident macrophages.
NFATc1 translocated rapidly into the nucleus after S. cerevisiae stimulation ex vivo
(Fig.3.3). Interestingly, this translocation was relatively transient (Fig.3.7). This suggests
an important role for NFATc1 in the induction of genes in the early phase of immune
response, as described for NFATc2 during induction of IL2 in DCs (Zanoni et al., 2009).
Moreover this could also suggest that NFATc1 might be involved in the initiation of
chromatin modifications, e.g. by recruitment of histone acetyltransferases (Avots et al.,
1999; Koenig et al., 2010). Recently, calcineurin-independent pathways were described to
induce NFATc1 (Patra et al., 2013). We showed that its translocation in prMΦ was CN-
dependent (Fig.3.4). Our findings are consistent with the findings that NFATc1 is induced
in antifungal responses in neutrophils and as a response to UDP, a nucleotide which is
secreted after brain injuries, in microglia (Greenblatt et al., 2010; Kim et al., 2011a).
Myeloid cells display different expression patterns of NFAT family members. NFATc2
and NFATc3 expression has been reported in macrophages (Minematsu et al., 2011; Fric et
al., 2012). Therefore, we characterized their involvement in the antifungal response of
rMΦ. However, NFATc2 translocation was detected in less than 10% of F4/80+ cells and
NFATc3 was found to be exclusive cytosolic (Fig.3.5). Consequently, NFATc1 is the
major NFAT family member that is involved in the antifungal response in rMΦ. In
Discussion
89
BMDM, neither NFATc1, nor NFATc2 or NFATc3 translocated into the nucleus in
response to S. cerevisiae ex vivo (Fig.3.6), which was surprising because Minematsu et al.,
2011 reported a nuclear localization of NFATc3, even without stimulation. Peritoneal rMΦ
are established before birth and maintain themselves independent of bone marrow derived
monocytes, indicating a highly specialized nature (Hashimoto et al., 2013; Yona et al.,
2013). BMDM are not specialized yet. This difference suggests that CN-dependent
translocation of NFATc1 in prMΦ is a specific property of a specialized macrophage
subpopulation.
4.1.2 Predominant expression of NFATc1β-isoforms in peritoneal
resident macrophages
The exclusive expression of P2-directed Nfatc1 transcripts in rMΦ and the predominant
induction of P2 promoter activity within 1hr upon S. cerevisiae infection in vivo (Fig.3.1)
suggest that NFATc1β-proteins play an important role in the early antifungal responses.
An increase of NFATc1-dsRed protein was found in all peritoneal cells, but especially in
macrophages after 24hrs of S. cerevisiae infection in Nfatc1-dsRed knock-in reporter mice
(Fig.3.2). Apart from FACS analysis, the use of this mouse enabled us to discriminate
between α- and β-isoforms by immune blotting, which is not possible in “non-reporter”
mice. Expression of NFATc1β-proteins in a ratio of 23.6 (β/α) confirmed that the induction
of Nfatc1 transcription was mainly directed by the P2 promoter (Fig.3.8). Overall, all three
NFATc1-protein-isoforms were strongly induced after stimulation for 24hrs and 48hrs.
Such isoform composition is typical for myeloid lineage cells examined by us so far, and
for certain lymphoid tumor cell lines (K. Murti, unpublished data), but not for lymphoid
cells, where the relatively high expression of the short NFATc1αA-isoform is becoming
dominant after immune-receptor stimulation (Chuvpilo et al., 2002). The correlation
between the relative induction of Nfatc1 mRNA and protein expression was partly
controversial, because mRNA levels were only slightly elevated after 24hrs. Reasons could
be post-transcriptional or post-translational control mechanism, such as enhanced RNA or
protein stability (Powell et al., 2002; Cheadle et al., 2005) or increased translation
efficiency. A similar time course of NFATc1-protein induction was described in human
macrophages stimulated with TNFα: low and transient increase of NFATc1-protein after
4hrs was followed by a second constitutive wave of expression starting around 24hrs and
lasting for several days (Yarilina et al., 2011).
Discussion
90
Additional findings have shown a dominance of NFATc1-isoforms at very early stages of
myeloid differentiation of embryonic stem cells in vitro and in BMDCs (A. Avots, M.
Väth, unpublished data).
In summary, our observations suggest a predominant role of NFATc1β-isoforms in prMΦ
and, probably, other myeloid cells, in contrast to the well-established role of NFATc1α-
isoforms in activated lymphocytes (Chuvpilo et al., 2002; Hock et al., 2013).
4.2 The predominant role of NFATc1ß-isoforms in antifungal response
In order to reveal a functional role of NFATc1β in cells of the myeloid and lymphoid
lineage, we investigated the Nfatc1-P2fl/fl-promoter mice (Fig.3.9). To delete NFATc1β in
all tissues (P2Δ mice), these mice were crossed with a CMV-cre deleter line (Schwenk et
al., 1995), in which cre expressison is under the control of the ubiquitous active,
immediately early CMV promoter (Qin et al., 2010; Gofflot et al., 2011). In addition, first
experiments were conducted using cells from P2fl/fl-LysM-cre mice for the myeloid lineage
specific deletion of NFATc1In these mice cre is expressed under control of the lysozyme
M promoter (Clausen et al., 1999). NFATc1β was successfully deleted in both mice
(Fig.3.10, data for P2fl/fl-LysM-cre not shown). Remarkably, we could not detect any P2
transcripts in heart tissues, where abundant expression of NFATc1α-isoforms is critical for
the development of heart valves, thereby explaining the embryonic lethality of NFATc1
knock-out mice on day E14/15 (de la Pompa et al., 1998; Ranger et al., 1998a; Zhou et al.,
2005). Therefore, our analysis of P2Δ and P2fl/fl-LysM-cre (data not shown) mice indicated
that the NFATc1-isoforms are dispensable for the heart development as well as for the
proper development and homeostasis of myeloid lineage cells (Fig.3.11).
Because NFATc1 was described to be involved in phagocytosis (Yamaguchi et al., 2011),
we were surprised to find an unimpaired phagocytosis in NFATc1β-deficient macrophages
(Fig.3.12 A). Presumably, NFATc1 has a different function after induction of
phagocytosis, due to the activation of the Dectin-1 pathway, which is associated with
phagocytosis (Herre, 2004). Furthermore, NFATc1β seems not to be involved in antigen
presentation in rMΦ (Fig.3.12 B). At the molecular level, we confirmed our former
observations that NFATc1β-isoforms were mainly expressed upon fungal infection in
prMΦ (Fig.3.13 and Fig.3.14). As a consequence, the overall Nfatc1 mRNA levels and
expression of NFATc1-protein was strongly reduced in macrophages in P2Δ mice. It
should be noted that neither the deletion of the P2 promoter itself nor the missing
expression of NFATc1-proteins had any detectable influence on the activity of the
remaining P1 promoter (Fig.3.13).
Discussion
91
4.2.1 Impaired clearance of fungal infections in P2Δ mice
Injection of yeast or yeast products is a well-established method to study infections, such
as peritonitis. Frequently used yeast species and yeast products are C. albicans (Evron,
1980; Taylor et al., 2007), zymosan A (Taylor et al., 2007; Hildebrand et al., 2013) or S.
cerevisiae (Fahrig, 1974; Amarante-Paffaro, 2004; Ghoneum, 2007).
NFATc1β-deficient mice showed a significantly impaired clearance of S. cerevisiae
peritoneal infections (Fig.3.15). This result was verified using P2fl/fl-LysM-cre mice to
ensure a myeloid phenotype and exclude any impact from peritoneal lymphoid cells, such
as B1a cells (Fig.3.15 C). We observed significantly less infiltrating inflammatory
monocytes (Gr1hiCD11b+F4/80+) in the peritoneum of P2Δ mice 24hrs after infection,
together with an unimpaired number of infiltrating neutrophils and resident macrophages
(Fig.3.16). These findings explained the impaired clearance of fungal infections, in line
with the unimpaired phagocytosis in NFATc1β-deficient rMΦ. Unchanged numbers of
rMΦ were expected, because rMΦ are restricted to a certain cell number and need to
recruit circulating cells in case of infection (Taylor et al., 2005; Kim et al., 2011b). The
striking reduced numbers of infiltrating monocytes and unimpaired number of infiltrating
neutrophils appeared to be due to a significant reduction in Ccl2 mRNA and protein levels
in NFATc1β-deficient peritoneal cells and in peritoneal fluid (Fig.3.17). Monocyte
recruitment to the sites of inflammation is activated by chemokine signals (Taylor et al.,
2005). Within those, Ccl2 is the most prominent chemokine that is mainly produced by
macrophages (Robben et al., 2005; Deshmane et al., 2009). Ccl2 was reported to be
influenced by the Dectin-1 receptor pathway and NFAT factors. Due to a lack in Ccl2
expression Dectin-1 receptor knock-out mice exhibit a decreased number of infiltrating
cells (Taylor et al., 2007). NFATs are described to be involved in Ccl2 expression in some
myeloid cells, e.g. in mast cells, in basophils, and in microglia (Venkatesha, 2004; Zaidi et
al., 2006; Kim et al., 2011a). Neutrophils are reported not to be attracted by CCL2 to the
same extent as monocytes (Yang et al., 2012) which explains their unimpaired cell
numbers.
Taken together these data suggest that NFATc1β-isoforms are directly or indirectly
regulating the induction of Ccl2 gene transcription and protein expression in prMΦ,
thereby explaining the decreased number of infiltrating monocytes and significantly
impaired clearance of fungal peritoneal infections in P2Δ and P2fl/fl-LysM-cre mice.
Discussion
92
4.3 Ccl2 is a novel direct NFATc1 target gene in macrophages
Although Ccl2 was described as target gene of the canonical NF-κB pathway (Ping et al.,
1996; Saccani et al., 2001), no defects in infiltration of inflammatory monocytes were
described for p50/p52 double knock-out or in c-Rel knock-out mice (Grigoriadis et al.,
1996; Franzoso et al., 1997). Furthermore, LPS can induce NFATc1-dependent Ccl2
production in microglia, which is VIVIT sensitive and, therefore, controlled by calcium
(Nagamoto-Combs and Combs, 2010).
Therefore, we hypothesized that NFATc1 might regulate Ccl2 expression. We examined
the Ccl2 locus for possible NFATc1 binding sites and identified a novel NFATc1
dependent enhancer within the distal region of the Ccl2 gene (Fig.3.18). ChIP assays
confirmed NFATc1 binding to this region in J774 cells (Fig.3.18 C), a mouse macrophage
line specified by steady-state nuclear localization of NFATc1 (Fig.3.18 D). These data
indicate Ccl2 as a direct NFATc1 target gene in macrophages.
4.3.1 The interplay between NFATc1- and NF-κB pathways during the
induction of Ccl2 gene transcription
Together with the transient translocation of NFATc1 after S. cerevisiae stimulation ex vivo
we found a simultaneous, but sustained activation of the canonical NF-κB pathway
(Fig.3.7). The non-canonical NF-κB pathway was activated only in a small fraction of
F4/80+ cells (Fig.3.7). This fraction could be a minor cell population with different
properties, such as those in which NFATc2 translocation was detected (Fig.3.5).
Because of the observed simultaneous translocation and the new knowledge that Ccl2 is a
NFATc1 target gene, we suspected a cooperation of both factors on the Ccl2 locus.
Previous studies described a possible “crosstalk” between NFAT and NF-κB in
macrophages (Zhu, 2003; Zanoni et al., 2009; Elloumi et al., 2012), a similar activation
downstream of the Dectin-1 receptor pathway (Zanoni and Granucci, 2012), and a direct
interaction of p65 and NFATc1 to regulate synergistically the transcription of hypertrophic
genes in cardiomyocytes during cardiac hypertrophy (Liu et al., 2012). We found interplay
between NFATc1- and NF-κB-pathways during induction of Ccl2 gene transcription
(Fig.3.19) and conclude that the cooperation between NFATc1 and canonical NF-κB is
required for a proper induction of Ccl2 expression during activation of macrophages.
4.4 NFATc1β-deficiency in lymphoid cells
Triggering of the immune-receptor induces a strong activation of Nfatc1 P1 promoter and
results in a high expression level of NFATc1α-protein. However, an expression of
Discussion
93
NFATc1β-isoforms is detectable in lymphoid cells, before and after activation. In resting
lymphocytes the majority of a relatively small amount of mostly cytosolic NFATc1-protein
is expressed as β-isoforms, which might play a role for maintaining in the “resting state”.
In order to reveal a putative role for NFATc1β-isoforms in lymphocytes, we investigated
the lymphoid compartment of P2Δ mice. We could show that NFATc1β is dispensable for
the proper development and homeostasis of lymphoid cells (Fig.3.20). Dispensability of
NFATc1β for the development of lymphoid and myeloid cells suggests a major role of
NFATc1α-isoforms in the development of hematopoietic cells, in line with the known role
of NFATc1α in the development of non-immune cells (Zhou et al., 2005). Furthermore,
our data indicated that the P1- and not P2-promoter-driven expression of NFATc1α-
isoforms is crucial for the proper development of B1a cells (Fig.3.20 C) (Berland and
Wortis, 2003; Bhattacharyya et al., 2011), either because of unique functional properties of
α-isoforms or due to the higher expression levels typical for α-transcripts in lymphoid
cells.
4.4.1 Expression of β-isoforms was irrelevant for important functions of
NFATc1 in T- and B-cells
We could refute the hypothesis that the NFATc1β-proteins are required for the
maintenance of the “resting state” of lymphoid cells. NFATc1β-deficient naïve splenic T-
and B-cells did not reveal any significant up-regulation of lymphocyte activation markers
(Fig.3.21 A).
Both the proliferation and survival of peripheral lymphocytes are controlled by NFATc1
and supported by a massive induction of short NFATc1αA-protein (Chuvpilo et al., 2002;
Hock et al., 2013). Our results were in line with these data and suggest that the expression
of NFATc1β-isoforms is not required for a proper activation of lymphoid cells (Fig.3.21).
Concepts of alternative promoters and their tight regulation for expression in different
tissues or substitution of a missing/mutated promoter are well-known (Daubas et al., 1988;
Ayoubi and Van De Ven, 1996; Rini and Calabi, 2001; Brown et al., 2009; Adams et al.,
2011). Therefore, we checked for a possibly compensatory effect between both Nfatc1
promoters and found that the missing NFATc1 expression was compensated by an
increased level of NFATc1in P2Δ mice (Fig.3.22).
In conclusion, due to a compensatory increased activity of the P1 promoter NFATc1β-
deficiency appeared to be negligible for cells of the adaptive immune system. This
suggests the presence of a tightly controlled lymphoid-specific regulatory mechanism of
Nfatc1 transcription, since no compensatory effect was detectable in myeloid cells.

Discussion
94
Taken together, our results illustrate the redundancy and indispensability of NFATc1-
isoforms in the adaptive and innate immune system. In the myeloid compartment
NFATc1β is required whereas NFATc1α is dispensable, while in the lymphoid
compartment NFATc1α appears to be the essential NFATc1-protein. This indicates a
highly developed regulatory system for NFATc1 in the different compartments of the
immune system and, perhaps, even beyond.
4.5 Nfatc1-dsRed knock-in reporter mouse
In order to investigate the expression of NFATc1 in vivo at tissue and cellular levels we
generated a knock-in reporter mouse line by fusing the monomeric dsRed sequence to the
first common exon 3 of all Nfatc1-isoforms (Fig.3.23).
The Nfatc1-dsRed knock-in reporter mouse was successfully generated by injection of
transgenic JM8 embryonic stem cells into B6/N blastocysts (Fig.3.24). Since JM8 cells
already have a B6/N background and chromosomal aberrations (data not shown) were
detected in karyotype analysis of v6.5 cells, we decided to use only JM8 cells for injections
(Liu et al., 1997; Pettitt et al., 2009) and obtained two mice with germ line transmission
(Fig.3.25). In line with our analysis of heterozygote conditional Nfatc1 knock-out mice
(data not shown) these mice did not show any obvious phenotype.
4.5.1 Analysis of the Nfatc1-dsRed reporter mouse
To verify if the reporter was expressed in the expected way, we analyzed the RNA and
protein expression in PBMCs from Nfatc1-dsRed mice after TPA/ionomycin stimulation
(Fig.3.26). TPA and ionomycin stimulate lymphocytes by activating the PKC pathway
(TPA) and increasing intracellular Ca2+ levels (ionomycin) (Altman et al., 1992; Morgan
and Jacob, 1994). We found the Nfatc1-dsRed knock-in allele properly induced,
transcribed, and translated as discrete - and -dsRed fusion proteins. This enabled us to
perform a reliable detection and quantification of both NFATc1- and NFATc1- protein
expression.
DsRed monomer is a relative stable red fluorescent protein from Discosoma species
(Campbell et al., 2002). The excitation of dsRed (557nm) and its emission (592nm) might
limit its usability for detection of NFATc1 expression in vivo using our currently available
equipment (Strongin et al., 2007).
However, we found an increase of the dsRed signal intensity in activated lymphocytes, but
the magnitude of fluorescent signal induced after stimulation was relatively poor and
Discussion
95
behind our expectations (Fig.3.27). Peritoneal B1a cells and macrophages showed a
relative robust dsRed signal. Unexpectedly, we could only detect a very weak dsRed signal
in DN thymocytes, which was in contrast to recently published data about NFATc1
expression in DN thymocytes (Patra et al., 2013). This could be due to a slow or
incomplete maturation of dsRed or might be influenced by the age of mice and their
thymic involution (Campbell et al., 2002; Macian, 2005). Besides this result, the FACS
data confirmed the expression of NFATc1-dsRed fusion proteins in all tested cell
populations, which express NFATc1.
The reliable detection and quantification of NFATc1α- and NFATc1β- protein expression
and the opportunity to follow the induction of NFATc1 by FACS facilitate the use of this
mouse as a unique tool for NFATc1 detection. The Nfatc1-dsRed reporter mouse is used
now to gain more information about the induction and functional role of NFATc1-isoforms
in the development of B-cell lymphomas (data not shown).
Taken together our experimental data demonstrate that (1.) expression of NFATc1β is
required for a proper immune response of resident macrophages to peritoneal fungal
infections, (2.) Ccl2 is a novel NFATc1 target gene in macrophages which is cooperatively
regulated through NFAT- and canonical NF-κB pathways, (3.) expression of NFATc1β-
isoforms is irrelevant for homeostasis and activation of adaptive immune system cells,
where deficiency of β-isoform expression is compensated by increased expression of
NFATc1α, and (4.) the NFATc1α- (but not β-) isoforms are required for a proper
development of peritoneal B1a cells.
96
Literature
Acuto, O., V. Di Bartolo, and F. Michel. 2008. Tailoring T-cell receptor signals by proximal negative feedback mechanisms. Nat Rev Immunol. 8:699-712.
Adams, C., A. Henke, and J. Gromoll. 2011. A novel two-promoter-one-gene system of the chorionic gonadotropin beta gene enables tissue-specific expression. Journal of molecular endocrinology. 47:285-298.
Altman, A., M.I. Mally, and N. Isakov. 1992. Phorbol ester synergizes with Ca2+ ionophore in activation of protein kinase C (PKC)alpha and PKC beta isoenzymes in human T cells and in induction of related cellular functions. Immunology. 76:465-471.
Amarante-Paffaro, A. 2004. Phagocytosis as a potential mechanism for microbial defense of mouse placental trophoblast cells. Reproduction. 128:207-218.
Andersen, M.H., D. Schrama, P. Thor Straten, and J.C. Becker. 2006. Cytotoxic T cells. The Journal of investigative dermatology. 126:32-41.
Aramburu, J., M.B. Yaffe, C. Lopez-Rodriguez, L.C. Cantley, P.G. Hogan, and A. Rao. 1999. Affinity-driven peptide selection of an NFAT inhibitor more selective than cyclosporin A. Science. 285:2129-2133.
Arron, J.R., M.M. Winslow, A. Polleri, C.P. Chang, H. Wu, X. Gao, J.R. Neilson, L. Chen, J.J. Heit, S.K. Kim, N. Yamasaki, T. Miyakawa, U. Francke, I.A. Graef, and G.R. Crabtree. 2006. NFAT dysregulation by increased dosage of DSCR1 and DYRK1A on chromosome 21. Nature. 441:595-600.
Auerbach, W., J.H. Dunmore, V. Fairchild-Huntress, Q. Fang, A.B. Auerbach, D. Huszar, and A.L. Joyner. 2000. Establishment and chimera analysis of 129/SvEv- and C57BL/6-derived mouse embryonic stem cell lines. BioTechniques. 29:1024-1028, 1030, 1032.
Avots, A., M. Buttmann, S. Chuvpilo, C. Escher, U. Smola, A.J. Bannister, U.R. Rapp, T. Kouzarides, and E. Serfling. 1999. CBP/p300 integrates Raf/Rac-signaling pathways in the transcriptional induction of NF-ATc during T cell activation. Immunity. 10:515-524.
Ayoubi, T.A., and W.J. Van De Ven. 1996. Regulation of gene expression by alternative promoters. FASEB J. 10:453-460.
Barnden, M.J., J. Allison, W.R. Heath, and F.R. Carbone. 1998. Defective TCR expression in transgenic mice constructed using cDNA-based alpha- and beta-chain genes under the control of heterologous regulatory elements. Immunology and cell biology. 76:34-40.
Beals, C.R., C.M. Sheridan, C.W. Turck, P. Gardner, and G.R. Crabtree. 1997. Nuclear export of NF-ATc enhanced by glycogen synthase kinase-3. Science. 275:1930-1934.
Berland, R., and H.H. Wortis. 2003. Normal B-1a cell development requires B cell-intrinsic NFATc1 activity. Proc Natl Acad Sci U S A. 100:13459-13464.
Bhattacharyya, S., J. Deb, A.K. Patra, D.A. Thuy Pham, W. Chen, M. Vaeth, F. Berberich-Siebelt, S. Klein-Hessling, E.D. Lamperti, K. Reifenberg, J. Jellusova, A. Schweizer, L. Nitschke, E. Leich, A. Rosenwald, C. Brunner, S. Engelmann, U. Bommhardt, A. Avots, M.R. Muller, E. Kondo, and E. Serfling. 2011. NFATc1 affects mouse splenic B cell function by controlling the calcineurin--NFAT signaling network. J Exp Med. 208:823-839.
Borel, J.F., C. Feurer, H.U. Gubler, and H. Stahelin. 1976. Biological effects of cyclosporin A: a new antilymphocytic agent. Agents and actions. 6:468-475.
97
Brown, G.D., J. Herre, D.L. Williams, J.A. Willment, A.S. Marshall, and S. Gordon. 2003. Dectin-1 mediates the biological effects of beta-glucans. J Exp Med. 197:1119-1124.
Brown, M., J. Ning, J.A. Ferreira, J.L. Bogener, and D.B. Lubahn. 2009. Estrogen receptor-alpha and -beta and aromatase knockout effects on lower limb muscle mass and contractile function in female mice. American journal of physiology. Endocrinology and metabolism. 296:E854-861.
Brownlie, R.J., and R. Zamoyska. 2013. T cell receptor signalling networks: branched, diversified and bounded. Nat Rev Immunol. 13:257-269.
Buckland, M.S., M. Mylonaki, D. Rampton, H.J. Longhurst. 2005. Serological markers (anti-Saccharomyces cerevisiae mannan antibodies and antineutrophil cytoplasmic antibodies) in inflammatory bowel disease: diagnostic utility and phenotypic correlation. Clin Diagn Lab Immunol. 11:1328-1330
Buxade, M., G. Lunazzi, J. Minguillon, S. Iborra, R. Berga-Bolanos, M. Del Val, J. Aramburu, and C. Lopez-Rodriguez. 2012. Gene expression induced by Toll-like receptors in macrophages requires the transcription factor NFAT5. J Exp Med. 209:379-393.
Campbell, R.E., O. Tour, A.E. Palmer, P.A. Steinbach, G.S. Baird, D.A. Zacharias, and R.Y. Tsien. 2002. A monomeric red fluorescent protein. Proc Natl Acad Sci U S A. 99:7877-7882.
Carey, J.B., C.S. Moffatt-Blue, L.C. Watson, A.L. Gavin, and A.J. Feeney. 2008. Repertoire-based selection into the marginal zone compartment during B cell development. J Exp Med. 205:2043-2052.
Cheadle, C., J. Fan, Y.S. Cho-Chung, T. Werner, J. Ray, L. Do, M. Gorospe, and K.G. Becker. 2005. Control of gene expression during T cell activation: alternate regulation of mRNA transcription and mRNA stability. BMC genomics. 6:75.
Chuvpilo, S., E. Jankevics, D. Tyrsin, A. Akimzhanov, D. Moroz, M.K. Jha, J. Schulze-Luehrmann, B. Santner-Nanan, E. Feoktistova, T. Konig, A. Avots, E. Schmitt, F. Berberich-Siebelt, A. Schimpl, and E. Serfling. 2002. Autoregulation of NFATc1/A expression facilitates effector T cells to escape from rapid apoptosis. Immunity. 16:881-895.
Chuvpilo, S., M. Zimmer, A. Kerstan, J. Glockner, A. Avots, C. Escher, C. Fischer, I. Inashkina, E. Jankevics, F. Berberich-Siebelt, E. Schmitt, and E. Serfling. 1999. Alternative polyadenylation events contribute to the induction of NF-ATc in effector T cells. Immunity. 10:261-269.
Clausen, B.E., C. Burkhardt, W. Reith, R. Renkawitz, and I. Forster. 1999. Conditional gene targeting in macrophages and granulocytes using LysMcre mice. Transgenic research. 8:265-277.
Cochran, B.H., A.C. Reffel, and C.D. Stiles. 1983. Molecular cloning of gene sequences regulated by platelet-derived growth factor. Cell. 33:939-947.
Conboy, I.M., D. Manoli, V. Mhaiskar, and P.P. Jones. 1999. Calcineurin and vacuolar-type H+-ATPase modulate macrophage effector functions. Proc Natl Acad Sci U S A. 96:6324-6329.
Crabtree, G.R., and E.N. Olson. 2002. NFAT signaling: choreographing the social lives of cells. Cell. 109 Suppl:S67-79.
Daubas, P., A. Klarsfeld, I. Garner, C. Pinset, R. Cox, and M. Buckingham. 1988. Functional activity of the two promoters of the myosin alkali light chain gene in primary muscle cell cultures: comparison with other muscle gene promoters and other culture systems. Nucleic Acids Res. 16:1251-1271.

98
Davies, L.C., M. Rosas, P.J. Smith, D.J. Fraser, S.A. Jones, and P.R. Taylor. 2011. A quantifiable proliferative burst of tissue macrophages restores homeostatic macrophage populations after acute inflammation. Eur J Immunol. 41:2155-2164.
de la Pompa, J.L., L.A. Timmerman, H. Takimoto, H. Yoshida, A.J. Elia, E. Samper, J. Potter, A. Wakeham, L. Marengere, B.L. Langille, G.R. Crabtree, and T.W. Mak. 1998. Role of the NF-ATc transcription factor in morphogenesis of cardiac valves and septum. Nature. 392:182-186.
Dennehy, K.M., J.A. Willment, D.L. Williams, and G.D. Brown. 2009. Reciprocal regulation of IL-23 and IL-12 following co-activation of Dectin-1 and TLR signaling pathways. Eur J Immunol. 39:1379-1386.
Deshmane, S.L., S. Kremlev, S. Amini, and B.E. Sawaya. 2009. Monocyte chemoattractant protein-1 (MCP-1): an overview. J Interferon Cytokine Res. 29:313-326.
Duber, S., M. Hafner, M. Krey, S. Lienenklaus, B. Roy, E. Hobeika, M. Reth, T. Buch, A. Waisman, K. Kretschmer, and S. Weiss. 2009. Induction of B-cell development in adult mice reveals the ability of bone marrow to produce B-1a cells. Blood. 114:4960-4967.
Elloumi, H.Z., N. Maharshak, K.N. Rao, T. Kobayashi, H.S. Ryu, M. Muhlbauer, F. Li, C. Jobin, and S.E. Plevy. 2012. A cell permeable peptide inhibitor of NFAT inhibits macrophage cytokine expression and ameliorates experimental colitis. PLoS One. 7:e34172.
Evron. 1980. In Vitro Phagocytosis of Candida albicans by Peritoneal Mouse Macrophages. Infection and Immunity.
Fahrig. 1974. Development of host-mediated mutagenicity tests I. Differential response of yeast cells injected into testes of rats and peritoneum of mice and rats to mutagens. Mutation Research.
Feske, S., Y. Gwack, M. Prakriya, S. Srikanth, S.H. Puppel, B. Tanasa, P.G. Hogan, R.S. Lewis, M. Daly, and A. Rao. 2006. A mutation in Orai1 causes immune deficiency by abrogating CRAC channel function. Nature. 441:179-185.
Flannagan, R.S., V. Jaumouille, and S. Grinstein. 2012. The cell biology of phagocytosis. Annu Rev Pathol. 7:61-98.
Franzoso, G., L. Carlson, L. Xing, L. Poljak, E.W. Shores, K.D. Brown, A. Leonardi, T. Tran, B.F. Boyce, and U. Siebenlist. 1997. Requirement for NF-kappaB in osteoclast and B-cell development. Genes Dev. 11:3482-3496.
Fric, J., T. Zelante, A.Y. Wong, A. Mertes, H.B. Yu, and P. Ricciardi-Castagnoli. 2012. NFAT control of innate immunity. Blood. 120:1380-1389.
Garcia-Rodriguez, C., and A. Rao. 1998. Nuclear factor of activated T cells (NFAT)-dependent transactivation regulated by the coactivators p300/CREB-binding protein (CBP). J Exp Med. 187:2031-2036.
Geissmann, F., S. Jung, and D.R. Littman. 2003. Blood monocytes consist of two principal subsets with distinct migratory properties. Immunity. 19:71-82.
Germain, R.N. 2002. T-cell development and the CD4-CD8 lineage decision. Nat Rev Immunol. 2:309-322.
Ghoneum. 2007. Yeast Therapy for the Treatment of Breast Cancer: A Nude Mice Model Study. In vivo.
Gilmore, T.D. 2006. Introduction to NF-kappaB: players, pathways, perspectives. Oncogene. 25:6680-6684.
Gofflot, F., O. Wendling, N. Chartoire, M. Birling, X. Warot, and J. Auwerx. 2011. Characterization and Validation of Cre-Driver Mouse Lines. Current Protocols in Mouse Biology.

99
Goodridge. 2007. Dectin-1 Stimulation by Candida albicans Yeast or Zymosan Triggers NFAT Activation in Macrophages and Dendritic Cells. The Journal of Immunology.
Goodridge, H.S., C.N. Reyes, C.A. Becker, T.R. Katsumoto, J. Ma, A.J. Wolf, N. Bose, A.S.H. Chan, A.S. Magee, M.E. Danielson, A. Weiss, J.P. Vasilakos, and D.M. Underhill. 2011. Activation of the innate immune receptor Dectin-1 upon formation of a ‘phagocytic synapse’. Nature. 472:471-475.
Gordon, S., and P.R. Taylor. 2005. Monocyte and macrophage heterogeneity. Nat Rev Immunol. 5:953-964.
Graf, T. 2008. Immunology: blood lines redrawn. Nature. 452:702-703. Green, D.R., N. Droin, and M. Pinkoski. 2003. Activation-induced cell death in T cells.
Immunol Rev. 193:70-81. Greenblatt, M.B., A. Aliprantis, B. Hu, and L.H. Glimcher. 2010. Calcineurin regulates
innate antifungal immunity in neutrophils. J Exp Med. 207:923-931. Grigoriadis, G., Y. Zhan, R.J. Grumont, D. Metcalf, E. Handman, C. Cheers, and S.
Gerondakis. 1996. The Rel subunit of NF-kappaB-like transcription factors is a positive and negative regulator of macrophage gene expression: distinct roles for Rel in different macrophage populations. EMBO J. 15:7099-7107.
Gwack, Y., S. Sharma, J. Nardone, B. Tanasa, A. Iuga, S. Srikanth, H. Okamura, D. Bolton, S. Feske, P.G. Hogan, and A. Rao. 2006. A genome-wide Drosophila RNAi screen identifies DYRK-family kinases as regulators of NFAT. Nature. 441:646-650.
Hardison, S.E., and G.D. Brown. 2012. C-type lectin receptors orchestrate antifungal immunity. Nat Immunol. 13:817-822.
Hardy, R.R. 2006. B-1 B cell development. J Immunol. 177:2749-2754. Hardy, R.R., and K. Hayakawa. 2001. B cell development pathways. Annu Rev Immunol.
19:595-621. Harwood, N.E., and F.D. Batista. 2010. Early events in B cell activation. Annu Rev
Immunol. 28:185-210. Hashimoto, D., A. Chow, C. Noizat, P. Teo, M.B. Beasley, M. Leboeuf, C.D. Becker, P.
See, J. Price, D. Lucas, M. Greter, A. Mortha, S.W. Boyer, E.C. Forsberg, M. Tanaka, N. van Rooijen, A. Garcia-Sastre, E.R. Stanley, F. Ginhoux, P.S. Frenette, and M. Merad. 2013. Tissue-Resident Macrophages Self-Maintain Locally throughout Adult Life with Minimal Contribution from Circulating Monocytes. Immunity. 38:792-804.
Herre, J. 2004. Dectin-1 uses novel mechanisms for yeast phagocytosis in macrophages. Blood. 104:4038-4045.
Hildebrand, D.G., E. Alexander, S. Horber, S. Lehle, K. Obermayer, N.A. Munck, O. Rothfuss, J.S. Frick, M. Morimatsu, I. Schmitz, J. Roth, J.M. Ehrchen, F. Essmann, and K. Schulze-Osthoff. 2013. IkappaBzeta Is a Transcriptional Key Regulator of CCL2/MCP-1. J Immunol. 190:4812-4820.
Hock, M., M. Vaeth, R. Rudolf, A.K. Patra, D.A. Pham, K. Muhammad, T. Pusch, T. Bopp, E. Schmitt, R. Rost, F. Berberich-Siebelt, D. Tyrsin, S. Chuvpilo, A. Avots, E. Serfling, and S. Klein-Hessling. 2013. NFATc1 Induction in Peripheral T and B Lymphocytes. J Immunol. 190:2345-2353.
Hodge, M.R., A.M. Ranger, F. Charles de la Brousse, T. Hoey, M.J. Grusby, and L.H. Glimcher. 1996. Hyperproliferation and dysregulation of IL-4 expression in NF-ATp-deficient mice. Immunity. 4:397-405.
Hogan, P.G., L. Chen, J. Nardone, and A. Rao. 2003. Transcriptional regulation by calcium, calcineurin, and NFAT. Genes Dev. 17:2205-2232.
100
Hogan, P.G., R.S. Lewis, and A. Rao. 2010. Molecular basis of calcium signaling in lymphocytes: STIM and ORAI. Annu Rev Immunol. 28:491-533.
Horsley, V., A.O. Aliprantis, L. Polak, L.H. Glimcher, and E. Fuchs. 2008. NFATc1 balances quiescence and proliferation of skin stem cells. Cell. 132:299-310.
Huai, Q., H.Y. Kim, Y. Liu, Y. Zhao, A. Mondragon, J.O. Liu, and H. Ke. 2002. Crystal structure of calcineurin-cyclophilin-cyclosporin shows common but distinct recognition of immunophilin-drug complexes. Proc Natl Acad Sci U S A. 99:12037-12042.
Huang, G.N., D.L. Huso, S. Bouyain, J. Tu, K.A. McCorkell, M.J. May, Y. Zhu, M. Lutz, S. Collins, M. Dehoff, S. Kang, K. Whartenby, J. Powell, D. Leahy, and P.F. Worley. 2008. NFAT binding and regulation of T cell activation by the cytoplasmic scaffolding Homer proteins. Science. 319:476-481.
Ishimoto, T., Y. Takei, Y. Yuzawa, K. Hanai, S. Nagahara, Y. Tarumi, S. Matsuo, and K. Kadomatsu. 2008. Downregulation of monocyte chemoattractant protein-1 involving short interfering RNA attenuates hapten-induced contact hypersensitivity. Mol Ther. 16:387-395.
Kayama, H., R. Koga, K. Atarashi, M. Okuyama, T. Kimura, T.W. Mak, S. Uematsu, S. Akira, H. Takayanagi, K. Honda, M. Yamamoto, and K. Takeda. 2009. NFATc1 mediates Toll-like receptor-independent innate immune responses during Trypanosoma cruzi infection. PLoS Pathog. 5:e1000514.
Kiani, A., I. Habermann, M. Haase, S. Feldmann, S. Boxberger, M.A. Sanchez-Fernandez, C. Thiede, M. Bornhauser, and G. Ehninger. 2004. Expression and regulation of NFAT (nuclear factors of activated T cells) in human CD34+ cells: down-regulation upon myeloid differentiation. J Leukoc Biol. 76:1057-1065.
Kiani, A., H. Kuithan, F. Kuithan, S. Kyttala, I. Habermann, A. Temme, M. Bornhauser, and G. Ehninger. 2007. Expression analysis of nuclear factor of activated T cells (NFAT) during myeloid differentiation of CD34+ cells: regulation of Fas ligand gene expression in megakaryocytes. Exp Hematol. 35:757-770.
Kim, B., H.k. Jeong, J.h. Kim, S.Y. Lee, I. Jou, and E.h. Joe. 2011a. Uridine 5'-Diphosphate Induces Chemokine Expression in Microglia and Astrocytes through Activation of the P2Y6 Receptor. The Journal of Immunology. 186:3701-3709.
Kim, Y.G., N. Kamada, M.H. Shaw, N. Warner, G.Y. Chen, L. Franchi, and G. Nunez. 2011b. The Nod2 sensor promotes intestinal pathogen eradication via the chemokine CCL2-dependent recruitment of inflammatory monocytes. Immunity. 34:769-780.
Kino, T., H. Hatanaka, M. Hashimoto, M. Nishiyama, T. Goto, M. Okuhara, M. Kohsaka, H. Aoki, and H. Imanaka. 1987a. FK-506, a novel immunosuppressant isolated from a Streptomyces. I. Fermentation, isolation, and physico-chemical and biological characteristics. The Journal of antibiotics. 40:1249-1255.
Kino, T., H. Hatanaka, S. Miyata, N. Inamura, M. Nishiyama, T. Yajima, T. Goto, M. Okuhara, M. Kohsaka, H. Aoki, and et al. 1987b. FK-506, a novel immunosuppressant isolated from a Streptomyces. II. Immunosuppressive effect of FK-506 in vitro. The Journal of antibiotics. 40:1256-1265.
Klein, U., and R. Dalla-Favera. 2008. Germinal centres: role in B-cell physiology and malignancy. Nat Rev Immunol. 8:22-33.
Koenig, A., T. Linhart, K. Schlengemann, K. Reutlinger, J. Wegele, G. Adler, G. Singh, L. Hofmann, S. Kunsch, T. Buch, E. Schafer, T.M. Gress, M.E. Fernandez-Zapico, and V. Ellenrieder. 2010. NFAT-induced histone acetylation relay switch promotes c-Myc-dependent growth in pancreatic cancer cells. Gastroenterology. 138:1189-1199 e1181-1182.
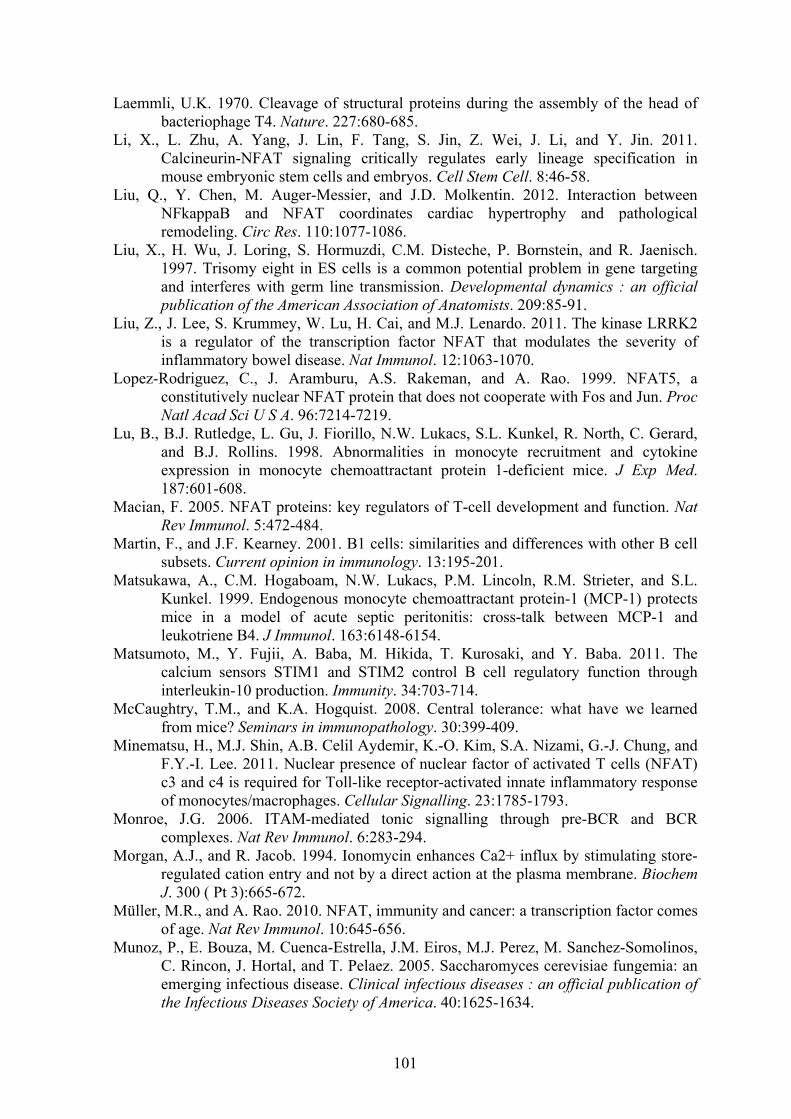
101
Laemmli, U.K. 1970. Cleavage of structural proteins during the assembly of the head of bacteriophage T4. Nature. 227:680-685.
Li, X., L. Zhu, A. Yang, J. Lin, F. Tang, S. Jin, Z. Wei, J. Li, and Y. Jin. 2011. Calcineurin-NFAT signaling critically regulates early lineage specification in mouse embryonic stem cells and embryos. Cell Stem Cell. 8:46-58.
Liu, Q., Y. Chen, M. Auger-Messier, and J.D. Molkentin. 2012. Interaction between NFkappaB and NFAT coordinates cardiac hypertrophy and pathological remodeling. Circ Res. 110:1077-1086.
Liu, X., H. Wu, J. Loring, S. Hormuzdi, C.M. Disteche, P. Bornstein, and R. Jaenisch. 1997. Trisomy eight in ES cells is a common potential problem in gene targeting and interferes with germ line transmission. Developmental dynamics : an official publication of the American Association of Anatomists. 209:85-91.
Liu, Z., J. Lee, S. Krummey, W. Lu, H. Cai, and M.J. Lenardo. 2011. The kinase LRRK2 is a regulator of the transcription factor NFAT that modulates the severity of inflammatory bowel disease. Nat Immunol. 12:1063-1070.
Lopez-Rodriguez, C., J. Aramburu, A.S. Rakeman, and A. Rao. 1999. NFAT5, a constitutively nuclear NFAT protein that does not cooperate with Fos and Jun. Proc Natl Acad Sci U S A. 96:7214-7219.
Lu, B., B.J. Rutledge, L. Gu, J. Fiorillo, N.W. Lukacs, S.L. Kunkel, R. North, C. Gerard, and B.J. Rollins. 1998. Abnormalities in monocyte recruitment and cytokine expression in monocyte chemoattractant protein 1-deficient mice. J Exp Med. 187:601-608.
Macian, F. 2005. NFAT proteins: key regulators of T-cell development and function. Nat Rev Immunol. 5:472-484.
Martin, F., and J.F. Kearney. 2001. B1 cells: similarities and differences with other B cell subsets. Current opinion in immunology. 13:195-201.
Matsukawa, A., C.M. Hogaboam, N.W. Lukacs, P.M. Lincoln, R.M. Strieter, and S.L. Kunkel. 1999. Endogenous monocyte chemoattractant protein-1 (MCP-1) protects mice in a model of acute septic peritonitis: cross-talk between MCP-1 and leukotriene B4. J Immunol. 163:6148-6154.
Matsumoto, M., Y. Fujii, A. Baba, M. Hikida, T. Kurosaki, and Y. Baba. 2011. The calcium sensors STIM1 and STIM2 control B cell regulatory function through interleukin-10 production. Immunity. 34:703-714.
McCaughtry, T.M., and K.A. Hogquist. 2008. Central tolerance: what have we learned from mice? Seminars in immunopathology. 30:399-409.
Minematsu, H., M.J. Shin, A.B. Celil Aydemir, K.-O. Kim, S.A. Nizami, G.-J. Chung, and F.Y.-I. Lee. 2011. Nuclear presence of nuclear factor of activated T cells (NFAT) c3 and c4 is required for Toll-like receptor-activated innate inflammatory response of monocytes/macrophages. Cellular Signalling. 23:1785-1793.
Monroe, J.G. 2006. ITAM-mediated tonic signalling through pre-BCR and BCR complexes. Nat Rev Immunol. 6:283-294.
Morgan, A.J., and R. Jacob. 1994. Ionomycin enhances Ca2+ influx by stimulating store-regulated cation entry and not by a direct action at the plasma membrane. Biochem J. 300 ( Pt 3):665-672.
Müller, M.R., and A. Rao. 2010. NFAT, immunity and cancer: a transcription factor comes of age. Nat Rev Immunol. 10:645-656.
Munoz, P., E. Bouza, M. Cuenca-Estrella, J.M. Eiros, M.J. Perez, M. Sanchez-Somolinos, C. Rincon, J. Hortal, and T. Pelaez. 2005. Saccharomyces cerevisiae fungemia: an emerging infectious disease. Clinical infectious diseases : an official publication of the Infectious Diseases Society of America. 40:1625-1634.
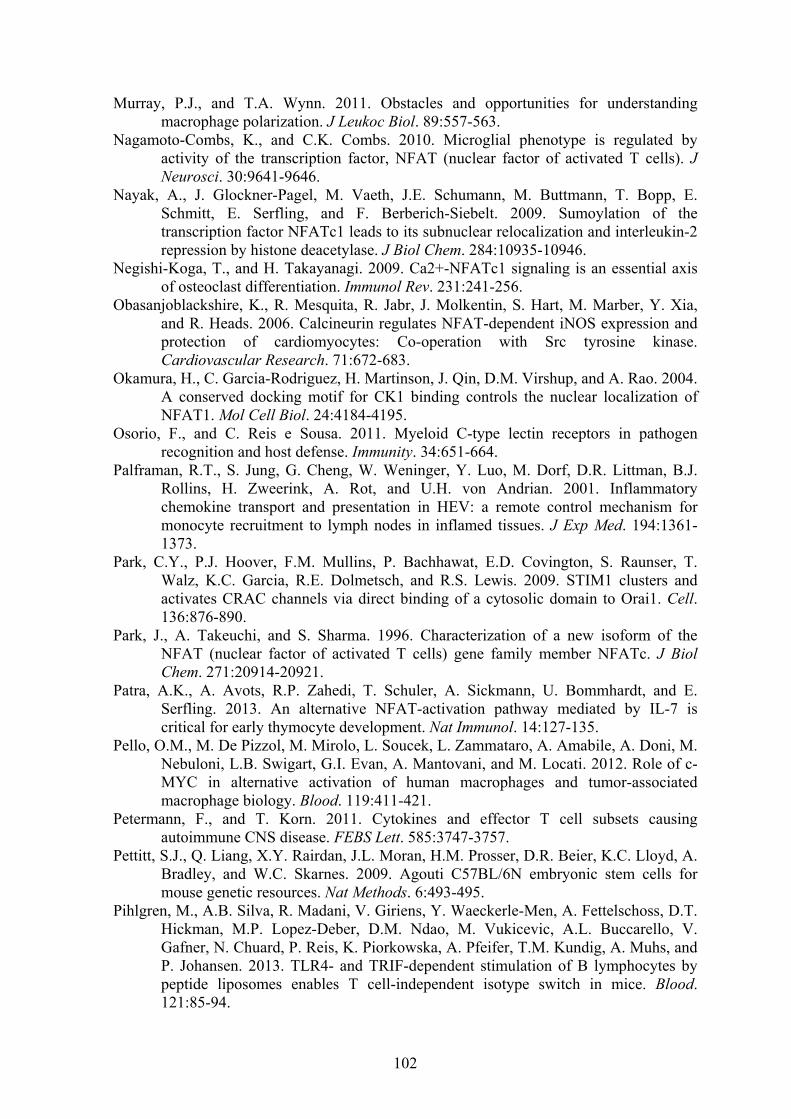
102
Murray, P.J., and T.A. Wynn. 2011. Obstacles and opportunities for understanding macrophage polarization. J Leukoc Biol. 89:557-563.
Nagamoto-Combs, K., and C.K. Combs. 2010. Microglial phenotype is regulated by activity of the transcription factor, NFAT (nuclear factor of activated T cells). J Neurosci. 30:9641-9646.
Nayak, A., J. Glockner-Pagel, M. Vaeth, J.E. Schumann, M. Buttmann, T. Bopp, E. Schmitt, E. Serfling, and F. Berberich-Siebelt. 2009. Sumoylation of the transcription factor NFATc1 leads to its subnuclear relocalization and interleukin-2 repression by histone deacetylase. J Biol Chem. 284:10935-10946.
Negishi-Koga, T., and H. Takayanagi. 2009. Ca2+-NFATc1 signaling is an essential axis of osteoclast differentiation. Immunol Rev. 231:241-256.
Obasanjoblackshire, K., R. Mesquita, R. Jabr, J. Molkentin, S. Hart, M. Marber, Y. Xia, and R. Heads. 2006. Calcineurin regulates NFAT-dependent iNOS expression and protection of cardiomyocytes: Co-operation with Src tyrosine kinase. Cardiovascular Research. 71:672-683.
Okamura, H., C. Garcia-Rodriguez, H. Martinson, J. Qin, D.M. Virshup, and A. Rao. 2004. A conserved docking motif for CK1 binding controls the nuclear localization of NFAT1. Mol Cell Biol. 24:4184-4195.
Osorio, F., and C. Reis e Sousa. 2011. Myeloid C-type lectin receptors in pathogen recognition and host defense. Immunity. 34:651-664.
Palframan, R.T., S. Jung, G. Cheng, W. Weninger, Y. Luo, M. Dorf, D.R. Littman, B.J. Rollins, H. Zweerink, A. Rot, and U.H. von Andrian. 2001. Inflammatory chemokine transport and presentation in HEV: a remote control mechanism for monocyte recruitment to lymph nodes in inflamed tissues. J Exp Med. 194:1361-1373.
Park, C.Y., P.J. Hoover, F.M. Mullins, P. Bachhawat, E.D. Covington, S. Raunser, T. Walz, K.C. Garcia, R.E. Dolmetsch, and R.S. Lewis. 2009. STIM1 clusters and activates CRAC channels via direct binding of a cytosolic domain to Orai1. Cell. 136:876-890.
Park, J., A. Takeuchi, and S. Sharma. 1996. Characterization of a new isoform of the NFAT (nuclear factor of activated T cells) gene family member NFATc. J Biol Chem. 271:20914-20921.
Patra, A.K., A. Avots, R.P. Zahedi, T. Schuler, A. Sickmann, U. Bommhardt, and E. Serfling. 2013. An alternative NFAT-activation pathway mediated by IL-7 is critical for early thymocyte development. Nat Immunol. 14:127-135.
Pello, O.M., M. De Pizzol, M. Mirolo, L. Soucek, L. Zammataro, A. Amabile, A. Doni, M. Nebuloni, L.B. Swigart, G.I. Evan, A. Mantovani, and M. Locati. 2012. Role of c-MYC in alternative activation of human macrophages and tumor-associated macrophage biology. Blood. 119:411-421.
Petermann, F., and T. Korn. 2011. Cytokines and effector T cell subsets causing autoimmune CNS disease. FEBS Lett. 585:3747-3757.
Pettitt, S.J., Q. Liang, X.Y. Rairdan, J.L. Moran, H.M. Prosser, D.R. Beier, K.C. Lloyd, A. Bradley, and W.C. Skarnes. 2009. Agouti C57BL/6N embryonic stem cells for mouse genetic resources. Nat Methods. 6:493-495.
Pihlgren, M., A.B. Silva, R. Madani, V. Giriens, Y. Waeckerle-Men, A. Fettelschoss, D.T. Hickman, M.P. Lopez-Deber, D.M. Ndao, M. Vukicevic, A.L. Buccarello, V. Gafner, N. Chuard, P. Reis, K. Piorkowska, A. Pfeifer, T.M. Kundig, A. Muhs, and P. Johansen. 2013. TLR4- and TRIF-dependent stimulation of B lymphocytes by peptide liposomes enables T cell-independent isotype switch in mice. Blood. 121:85-94.
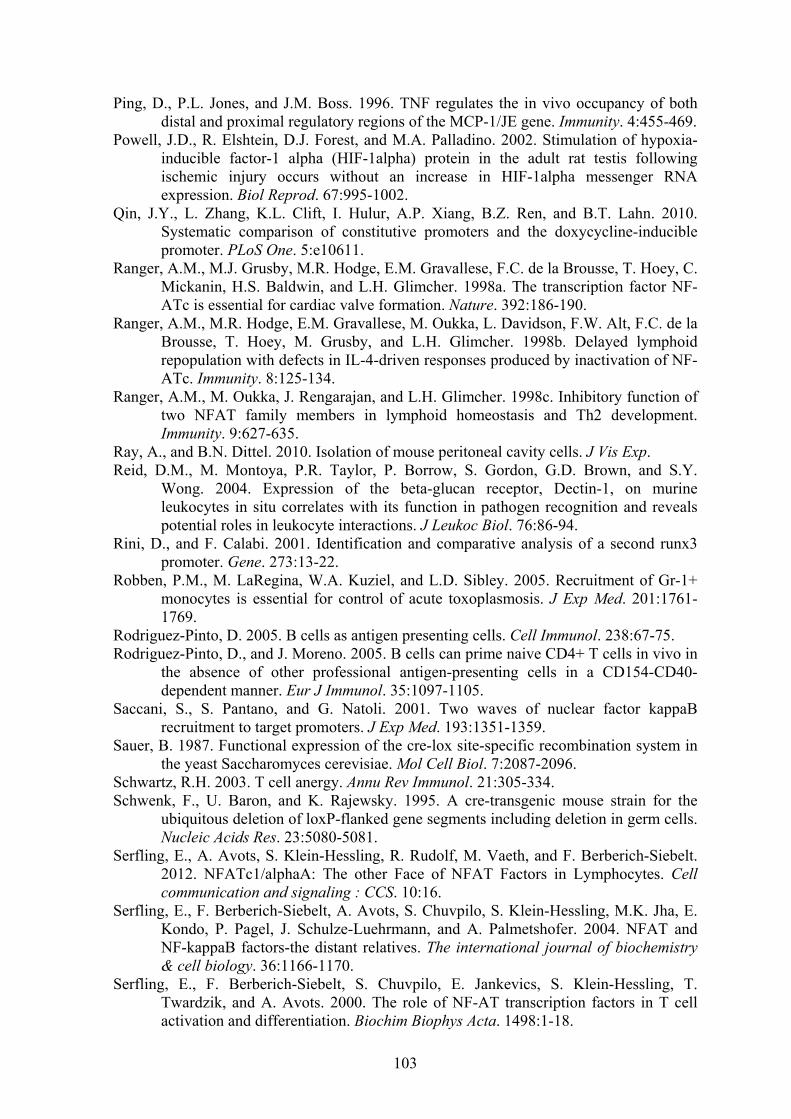
103
Ping, D., P.L. Jones, and J.M. Boss. 1996. TNF regulates the in vivo occupancy of both distal and proximal regulatory regions of the MCP-1/JE gene. Immunity. 4:455-469.
Powell, J.D., R. Elshtein, D.J. Forest, and M.A. Palladino. 2002. Stimulation of hypoxia-inducible factor-1 alpha (HIF-1alpha) protein in the adult rat testis following ischemic injury occurs without an increase in HIF-1alpha messenger RNA expression. Biol Reprod. 67:995-1002.
Qin, J.Y., L. Zhang, K.L. Clift, I. Hulur, A.P. Xiang, B.Z. Ren, and B.T. Lahn. 2010. Systematic comparison of constitutive promoters and the doxycycline-inducible promoter. PLoS One. 5:e10611.
Ranger, A.M., M.J. Grusby, M.R. Hodge, E.M. Gravallese, F.C. de la Brousse, T. Hoey, C. Mickanin, H.S. Baldwin, and L.H. Glimcher. 1998a. The transcription factor NF-ATc is essential for cardiac valve formation. Nature. 392:186-190.
Ranger, A.M., M.R. Hodge, E.M. Gravallese, M. Oukka, L. Davidson, F.W. Alt, F.C. de la Brousse, T. Hoey, M. Grusby, and L.H. Glimcher. 1998b. Delayed lymphoid repopulation with defects in IL-4-driven responses produced by inactivation of NF-ATc. Immunity. 8:125-134.
Ranger, A.M., M. Oukka, J. Rengarajan, and L.H. Glimcher. 1998c. Inhibitory function of two NFAT family members in lymphoid homeostasis and Th2 development. Immunity. 9:627-635.
Ray, A., and B.N. Dittel. 2010. Isolation of mouse peritoneal cavity cells. J Vis Exp. Reid, D.M., M. Montoya, P.R. Taylor, P. Borrow, S. Gordon, G.D. Brown, and S.Y.
Wong. 2004. Expression of the beta-glucan receptor, Dectin-1, on murine leukocytes in situ correlates with its function in pathogen recognition and reveals potential roles in leukocyte interactions. J Leukoc Biol. 76:86-94.
Rini, D., and F. Calabi. 2001. Identification and comparative analysis of a second runx3 promoter. Gene. 273:13-22.
Robben, P.M., M. LaRegina, W.A. Kuziel, and L.D. Sibley. 2005. Recruitment of Gr-1+ monocytes is essential for control of acute toxoplasmosis. J Exp Med. 201:1761-1769.
Rodriguez-Pinto, D. 2005. B cells as antigen presenting cells. Cell Immunol. 238:67-75. Rodriguez-Pinto, D., and J. Moreno. 2005. B cells can prime naive CD4+ T cells in vivo in
the absence of other professional antigen-presenting cells in a CD154-CD40-dependent manner. Eur J Immunol. 35:1097-1105.
Saccani, S., S. Pantano, and G. Natoli. 2001. Two waves of nuclear factor kappaB recruitment to target promoters. J Exp Med. 193:1351-1359.
Sauer, B. 1987. Functional expression of the cre-lox site-specific recombination system in the yeast Saccharomyces cerevisiae. Mol Cell Biol. 7:2087-2096.
Schwartz, R.H. 2003. T cell anergy. Annu Rev Immunol. 21:305-334. Schwenk, F., U. Baron, and K. Rajewsky. 1995. A cre-transgenic mouse strain for the
ubiquitous deletion of loxP-flanked gene segments including deletion in germ cells. Nucleic Acids Res. 23:5080-5081.
Serfling, E., A. Avots, S. Klein-Hessling, R. Rudolf, M. Vaeth, and F. Berberich-Siebelt. 2012. NFATc1/alphaA: The other Face of NFAT Factors in Lymphocytes. Cell communication and signaling : CCS. 10:16.
Serfling, E., F. Berberich-Siebelt, A. Avots, S. Chuvpilo, S. Klein-Hessling, M.K. Jha, E. Kondo, P. Pagel, J. Schulze-Luehrmann, and A. Palmetshofer. 2004. NFAT and NF-kappaB factors-the distant relatives. The international journal of biochemistry & cell biology. 36:1166-1170.
Serfling, E., F. Berberich-Siebelt, S. Chuvpilo, E. Jankevics, S. Klein-Hessling, T. Twardzik, and A. Avots. 2000. The role of NF-AT transcription factors in T cell activation and differentiation. Biochim Biophys Acta. 1498:1-18.

104
Sieber, M., and R. Baumgrass. 2009. Novel inhibitors of the calcineurin/NFATc hub - alternatives to CsA and FK506? Cell communication and signaling : CCS. 7:25.
Snyder, S. 1992. Peritonitis due to Saccharomyces cerevisiae in a patient on CAPD. Peritoneal dialysis international : journal of the International Society for Peritoneal Dialysis. 12:77-78.
Solovjov, D.A., E. Pluskota, and E.F. Plow. 2005. Distinct roles for the alpha and beta subunits in the functions of integrin alphaMbeta2. J Biol Chem. 280:1336-1345.
Soutoglou, E., and I. Talianidis. 2002. Coordination of PIC assembly and chromatin remodeling during differentiation-induced gene activation. Science. 295:1901-1904.
Strongin, D.E., B. Bevis, N. Khuong, M.E. Downing, R.L. Strack, K. Sundaram, B.S. Glick, and R.J. Keenan. 2007. Structural rearrangements near the chromophore influence the maturation speed and brightness of DsRed variants. Protein Eng Des Sel. 20:525-534.
Sul, O.-J., K. Ke, W.-K. Kim, S.-H. Kim, S.-C. Lee, H.-J. Kim, S.-Y. Kim, J.-H. Suh, and H.-S. Choi. 2012. Absence of MCP-1 leads to elevated bone mass via impaired actin ring formation. Journal of Cellular Physiology. 227:1619-1627.
Takahashi, M., C. Galligan, L. Tessarollo, and T. Yoshimura. 2009. Monocyte Chemoattractant Protein-1 (MCP-1), Not MCP-3, Is the Primary Chemokine Required for Monocyte Recruitment in Mouse Peritonitis Induced with Thioglycollate or Zymosan A. The Journal of Immunology. 183:3463-3471.
Takayanagi, H. 2003. Induction and Activation of the Transcription Factor NFATc1 (NFAT2) Integrate RANKL Signaling in Terminal Differentiation of Osteoclasts. Developmental Cell.
Taylor, P.R., L. Martinez-Pomares, M. Stacey, H.H. Lin, G.D. Brown, and S. Gordon. 2005. Macrophage receptors and immune recognition. Annu Rev Immunol. 23:901-944.
Taylor, P.R., S.V. Tsoni, J.A. Willment, K.M. Dennehy, M. Rosas, H. Findon, K. Haynes, C. Steele, M. Botto, S. Gordon, and G.D. Brown. 2007. Dectin-1 is required for beta-glucan recognition and control of fungal infection. Nat Immunol. 8:31-38.
Terui, Y., N. Saad, S. Jia, F. McKeon, and J. Yuan. 2004. Dual role of sumoylation in the nuclear localization and transcriptional activation of NFAT1. J Biol Chem. 279:28257-28265.
Varin, A., S. Mukhopadhyay, G. Herbein, and S. Gordon. 2010. Alternative activation of macrophages by IL-4 impairs phagocytosis of pathogens but potentiates microbial-induced signalling and cytokine secretion. Blood. 115:353-362.
Veillette, A., M.A. Bookman, E.M. Horak, and J.B. Bolen. 1988. The CD4 and CD8 T cell surface antigens are associated with the internal membrane tyrosine-protein kinase p56lck. Cell. 55:301-308.
Venkatesha, R.T. 2004. Platelet-activating Factor-induced Chemokine Gene Expression Requires NF- B Activation and Ca2+/Calcineurin Signaling Pathways: INHIBITION BY RECEPTOR PHOSPHORYLATION AND -ARRESTIN RECRUITMENT. Journal of Biological Chemistry. 279:44606-44612.
Willingham, A.T., A.P. Orth, S. Batalov, E.C. Peters, B.G. Wen, P. Aza-Blanc, J.B. Hogenesch, and P.G. Schultz. 2005. A strategy for probing the function of noncoding RNAs finds a repressor of NFAT. Science. 309:1570-1573.
Winslow, M.M., M. Pan, M. Starbuck, E.M. Gallo, L. Deng, G. Karsenty, and G.R. Crabtree. 2006. Calcineurin/NFAT signaling in osteoblasts regulates bone mass. Dev Cell. 10:771-782.
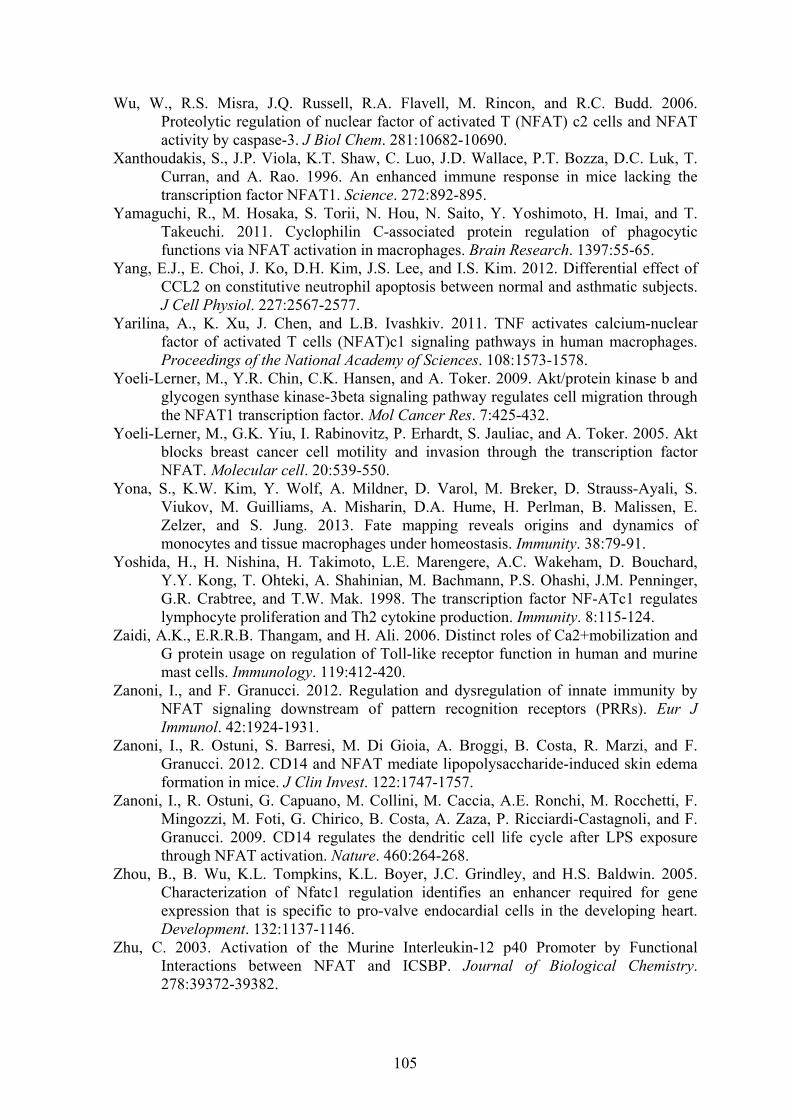
105
Wu, W., R.S. Misra, J.Q. Russell, R.A. Flavell, M. Rincon, and R.C. Budd. 2006. Proteolytic regulation of nuclear factor of activated T (NFAT) c2 cells and NFAT activity by caspase-3. J Biol Chem. 281:10682-10690.
Xanthoudakis, S., J.P. Viola, K.T. Shaw, C. Luo, J.D. Wallace, P.T. Bozza, D.C. Luk, T. Curran, and A. Rao. 1996. An enhanced immune response in mice lacking the transcription factor NFAT1. Science. 272:892-895.
Yamaguchi, R., M. Hosaka, S. Torii, N. Hou, N. Saito, Y. Yoshimoto, H. Imai, and T. Takeuchi. 2011. Cyclophilin C-associated protein regulation of phagocytic functions via NFAT activation in macrophages. Brain Research. 1397:55-65.
Yang, E.J., E. Choi, J. Ko, D.H. Kim, J.S. Lee, and I.S. Kim. 2012. Differential effect of CCL2 on constitutive neutrophil apoptosis between normal and asthmatic subjects. J Cell Physiol. 227:2567-2577.
Yarilina, A., K. Xu, J. Chen, and L.B. Ivashkiv. 2011. TNF activates calcium-nuclear factor of activated T cells (NFAT)c1 signaling pathways in human macrophages. Proceedings of the National Academy of Sciences. 108:1573-1578.
Yoeli-Lerner, M., Y.R. Chin, C.K. Hansen, and A. Toker. 2009. Akt/protein kinase b and glycogen synthase kinase-3beta signaling pathway regulates cell migration through the NFAT1 transcription factor. Mol Cancer Res. 7:425-432.
Yoeli-Lerner, M., G.K. Yiu, I. Rabinovitz, P. Erhardt, S. Jauliac, and A. Toker. 2005. Akt blocks breast cancer cell motility and invasion through the transcription factor NFAT. Molecular cell. 20:539-550.
Yona, S., K.W. Kim, Y. Wolf, A. Mildner, D. Varol, M. Breker, D. Strauss-Ayali, S. Viukov, M. Guilliams, A. Misharin, D.A. Hume, H. Perlman, B. Malissen, E. Zelzer, and S. Jung. 2013. Fate mapping reveals origins and dynamics of monocytes and tissue macrophages under homeostasis. Immunity. 38:79-91.
Yoshida, H., H. Nishina, H. Takimoto, L.E. Marengere, A.C. Wakeham, D. Bouchard, Y.Y. Kong, T. Ohteki, A. Shahinian, M. Bachmann, P.S. Ohashi, J.M. Penninger, G.R. Crabtree, and T.W. Mak. 1998. The transcription factor NF-ATc1 regulates lymphocyte proliferation and Th2 cytokine production. Immunity. 8:115-124.
Zaidi, A.K., E.R.R.B. Thangam, and H. Ali. 2006. Distinct roles of Ca2+mobilization and G protein usage on regulation of Toll-like receptor function in human and murine mast cells. Immunology. 119:412-420.
Zanoni, I., and F. Granucci. 2012. Regulation and dysregulation of innate immunity by NFAT signaling downstream of pattern recognition receptors (PRRs). Eur J Immunol. 42:1924-1931.
Zanoni, I., R. Ostuni, S. Barresi, M. Di Gioia, A. Broggi, B. Costa, R. Marzi, and F. Granucci. 2012. CD14 and NFAT mediate lipopolysaccharide-induced skin edema formation in mice. J Clin Invest. 122:1747-1757.
Zanoni, I., R. Ostuni, G. Capuano, M. Collini, M. Caccia, A.E. Ronchi, M. Rocchetti, F. Mingozzi, M. Foti, G. Chirico, B. Costa, A. Zaza, P. Ricciardi-Castagnoli, and F. Granucci. 2009. CD14 regulates the dendritic cell life cycle after LPS exposure through NFAT activation. Nature. 460:264-268.
Zhou, B., B. Wu, K.L. Tompkins, K.L. Boyer, J.C. Grindley, and H.S. Baldwin. 2005. Characterization of Nfatc1 regulation identifies an enhancer required for gene expression that is specific to pro-valve endocardial cells in the developing heart. Development. 132:1137-1146.
Zhu, C. 2003. Activation of the Murine Interleukin-12 p40 Promoter by Functional Interactions between NFAT and ICSBP. Journal of Biological Chemistry. 278:39372-39382.

106
Abbreviations
3’ 3 prime
5’ 5 prime
> followed by
°C degree Celsius
ABB Annexin-Binding Buffer
AICD activation induced cell death
AP-1 activator-protein 1
APC antigen presenting cell
-APC allophycocyanin
(d)ATP (desoxy)adenosine triphosphate
B6/N laboratory black inbred mouse line
Bcl10 B-cell CLL/lymphoma-10
BCR B-cell receptor
BM bone marrow
BMDC bone marrow derived dendritic cell
BMDM bone marrow derived macrophage
BMMC bone marrow derived mast cell
bp base pair
BSA bovine serum albumin
BSS buffered salt solution
C57/B6 laboratory black inbred mouse line (=B6/N)
Ca2+ calcium
CARD9 caspase recruitment domain containing protein 9
CBP CREB binding protein
CCL2 chemokine ligand 2
CCR2 chemokine receptor 2
CD cluster of differentiation
CFSE carboxyfluorescein diacetate succinimidyl ester
cfu colony forming units
CK1 casein kinase 1
CLP common lymphoid progenitor
CLR C-type lectin receptor
CMP common myeloid progenitor
CN calcineurin
CO2 carbon dioxide
107
CP crossing point
CsA cyclosporine A
Ct threshold cycle
CTL cytotoxic T-cell
(d)CTP (desoxy)cytidine triphosphate
CMV cytomegalovirus
CyCAP cyclophillin C associated protein
CyPA cyclophillin A
DAG diacyl-glycerol
DL dilution factor
DMEM Dulbecco's Modified Eagle Medium
DMSO dimethyl-sulfoxide
DN double negative
DNA deoxyribonucleic acid
DP double positive
dTTP desoxythymidine triphosphate
DTT dithiothreitol
DYRK1 dual-specificity-tyrosine-phosphorylation-regulated kinase
ECL enhanced chemiluminescence
EDTA ethylenediaminetetraacetic acid
EF embryonic fibroblast
EGF epidermal growth factor
ELISA enzyme-linked immunosorbent assay
ER endoplasmic reticulum
ES(C) embryonic stem cell
et. al et aliter
EtBr ethidium Bromide
EtOH ethanol
FA formaldehyde
FACS fluorescence activated cell sorting
FCS fetal calf (bovine) serum
FITC fluorescein-isothiocyanat
F forward
Fig. figure
FK506 tacrolismus
FKBP FK506 binding protein
fl loxP sites (floxed)
108
for forward
g gram
GA gauge
GADS GRB2-related adaptor protein
gLB genomic lysis buffer
GSK3 glycogen synthase kinase 3
(d)GTP (desoxy)guanine triphosphate
h hour(s)
H2O water
HCL hydrogen chloride
HD high dye (formaldehyde)
hr(s) hour(s)
HRP horseradish-peroxidase
HSC hematopoietic stem cell
I ionomycin
IFN interferon
Ig immunoglobulin
IKK Iκb kinase
IL interleukin
iNOS inducible nitric oxide synthase
i.p. intraperitoneal
IP3 inositol 1,4,5-trisphosphate
ITAM immune receptor tyrosine based activation motif
ITK IL-2-inducible T-cell kinase
kg kilo-gram
kb kilo-base pair
l liter
-L lower
LAT linker for activation of T cells
LB lysogeny Broth
Lck lymphocyte-specific protein tyrosine kinase
Lox loxP sites
KI knock-in
KO knock-out
LPS lipopolysaccharide
LRRK2 leucin rich repeat kinase 2
LSY lysis
109
M molar mass
m milli-
Malt1 mucosa associated lymphoid tissue lymphoma translocation gene 1
MAPK mitogen-activated protein kinase
MCP-1 monocyte chemotactic protein-1
MES 2-(N-morpholino)ethanesulfonic acid
mg milligram
Mg magnesium
MgCl magnesium chloride
MHC major histocompatibility complex
min (‘) minute
ml milliliter
MLMC murine lung mast cell
MΦ macrophage
MPP multi-potent progenitor
mol mole
msec milliseconds
n nano-
Na2HPO4 disodium hydrogen phosphate
NaCl sodium chloride
NaH2PO4 monosodium phosphate
NaOH sodium hydroxide
nc non-coding
Neo neomycin
NES nuclear export signal
NEU neutralization
NFAT nuclear factor of activated T-cells
NF-κB nuclear factor kappa-light-chain-enhancer of activated B cells
NHR NFAT regulatory domain
NIK NF-κB inducing kinase
NK cells natural killer cells
NKCL natural killer-like C-type lectin receptor
NLS nuclear translocation signal
NO nitrogen monoxide
NRON ncRNA repressor of nuclear factor of activated T-cells
NS non specific
ON overnight
110
OVA ovalbumin
ORAI1 calcium release activated calcium channel
p pico-
p peritoneal
P1 promoter 1
P2 promoter 2
P32 radioactive isotope of phosphorus
PAF platelet activation factor
Pam3Cys tripalmitoyl-S-glyceryl-cysteine
PAMP pathogen associate molecule pattern
PBMCs peripheral blood mononuclear cells
PCR polymerase chain reaction
PE phycoerythrin
PEC(s) peritoneal cell(s)
PGK phosphoglycerate kinase
PIP2 phospholipid phosphatidylinositol 4,5-bisphosphate
PLC phospholipase C
PPIase peptidyl-prolyl cis-trans isomerase
prMΦ peritoneal resident macrophage
PRR pattern recognition receptors
R reverse
r resident
RBL red blood cell lysis
RES resuspension
rev reverse
RHD Rel-homology domain
rMΦ resident macrophage
RNA ribonucleic acid
ROS reactive oxygen species
rpm rounds per minute
RPMI Roswell Memorial Institute Medium
RSD Rel-similarity domain
RTK receptor tyrosine kinase
RT room temperature
RT-PCR reverse Transcriptase-PCR
SDS sodium dodecyl sulfate
sec (’’) seconds
111
SLP76 SH2-domain-containing leukocyte protein of 76 kDa
SOC store operated Ca2+ influx
SP single positive
Src c-Src tyrosine kinase
SRR serine rich region
STIM1 stromal interaction molecule 1
Syc spleen tyrosine kinase
TAD Transactivation domain
TAE Tris/Acetate/EDTA
TAM tumor associated macrophage
TCR T-cell receptor
TH T-helper cell
TLR toll-like receptor
Tm melting temperature
TM transmembrane
TNF tumor necrosis factor
TPA (PMA) tetradecanoylphorbol-acetat (phorbol-12-myristat-13-acetat)
Treg regulatory T-cell
µ micro-
U unit
-U upper
UDP uridine diphosphate
wo (w/o) without
wt wild type
YPD yeast Extract Peptone Dextrose
ZAP-70 ζ-chain-associated protein kinase of 70 kDa

112
Eidesstattliche Erklärung
Hiermit erkläre ich an Eides statt, die Dissertation „Redundancy and indispensability of
NFATc1 isoforms in the adaptive and innate immune system“ eigenständig angefertigt und
keine anderen als die von mir angegebenen Quellen und Hilfsmittel verwendet zu haben.
Ich erkläre außerdem, dass die Dissertation weder in gleicher noch in ähnlicher Form
bereits in einem anderen Prüfungsverfahren vorgelegt wurde.
Bisher habe ich keinen früheren akademischen Grad erworben oder zu erwerben versucht.
Würzburg, August 2013
Rhoda Busch
Affidavit
I hereby confirm that my thesis entitled „Redundancy and indispensability of NFATc1
isoforms in the adaptive and innate immune system“ is the result of my own work. I did
not receive any help or support from commercial consultants. All sources and/or materials
applied are listed and specified in the thesis.
Furthermore, I confirm that this thesis has not yet been submitted as part of another
examination process neither in identical nor in similar form.
Würzburg, August 2013
Rhoda Busch
Veröffentlichungen
Busch R, Murti K, Liu J, Patra A, Knobeloch K-P, Lichtinger M, Bonifer C, Wörtge S,
Reifenberg K, Waisman A, Ellenrieder V, Serfling E, Avots A. NFATc1/β initiates release of
BCL6-mediated repression of chemokine genes in peritoneal resident macrophages. Nature
Immunology, submitted.
Reviews
Rudolf R, Busch R, Patra A, Muhammad K, Avots A, Andrau J-C, Klein-Hessling S, Serfling
E. The architecture and expression of Nfatc1 gene in lymphocytes. Frontiers in B Cell Biology.
Poster
In vivo imaging of Nfatc1 gene expression during Lymphopoiesis
7th Spring School on Immunology of the Deutsche Gesellschaft für Immunologie, Ettal, 13-18
March 2011
Redundancy and Indispensability of NFATc1 Isoforms in the Adaptive and Innate Immune
System
16th Joint Meeting of the Signal Transduction Society “Signal Transduction, Receptors,
Mediators and Genes”, Weimar, 05-07 November 2012
![Sebastian Maier, arXiv:1512.01048v1 [quant-ph] 3 Dec …. Zrenner, E. Beham, S. Stufler, F. Findeis, M. Bichler, and G. Abstreiter, “Coherent properties of a two-level system based](https://cdn.vdocuments.site/doc/165x107/5ab5aaa17f8b9ab7638d0857/sebastian-maier-arxiv151201048v1-quant-ph-3-dec-zrenner-e-beham-s.jpg)


